
Abstract
Abstract
Biodegradation of some complex cyanide compounds, including sodium hexacyanoferrate (II) trihydrate [Na4Fe(CN)6·3H2O], potassium hexacyanoferrate (II) decahydrate [K4Fe(CN)6·10H2O], and potassium cyano-argentate [KAg(CN)2] by free cells of Pseudomonas resinovorans strain, was investigated in aqueous suspension as a function of pH, cyanide concentration, and initial glucose concentration. The minimum inhibition concentration (MIC) for each cyanide compound was determined while bacterial growth, ammonia generation, and glucose utilization were monitored during the experiments. The results indicate that P. resinovorans is able to degrade both the potassium and sodium cyanide complexes by using these compounds as sources of nitrogen. However, KAg(CN)2 was observed to inhibit the growth of the bacteria. The MIC values were determined to be 25 mM (10.55 g/L) and 75 mM (36.3 g/L) for K4Fe(CN)6·3H2O and Na4Fe(CN)6·10H2O, respectively, for P. resinovorans, whereas the maximum ammonia generated during cyanide biodegradation was observed at pH 5, and as expected, bacteria growth increased with higher glucose concentrations. Using P. resinovorans bacteria for the removal of cyanide is an innovative idea, and this study demonstrated the promising results. The findings of this study would be useful in designing a unit operation inoculated with P. resinovorans in a full-scale wastewater treatment plant for the treatment of cyanide-contaminated industrial wastewater.
Introduction
C
Several methods have been explored for cyanide removal from wastewaters. The common methods involve physical and chemical reaction techniques, such as natural degradation, sulfur dioxide process, Caro's acid, activated carbon, alkaline chlorination, iron/copper precipitation process, and ion exchange (Botz et al., 2005; Kuyucak and Akcil, 2013). However, these processes are not always effective compared to biological treatment methods. Biological methods can effectively remove a wide range of cyanide compounds (Dash et al., 2009) and show faster degradation kinetics (Desai and Ramakrishna, 1998). Moreover, biological methods are economical and reduce the toxicity and corrosiveness of the chemical oxidizers (Gurbuz et al., 2009). The biological methods involve two steps: the first step is the oxidative breakdown of cyanides followed by a subsequent conversion to ammonia, carbonate, and sulfate (Akcil, 2003). In the second step, ammonia is converted to nitrate and nitrite through the conventional nitrification process (Akcil et al., 2003; Kuyucak and Akcil, 2013).
The most commonly isolated microorganisms used for the biodegradation of cyanide complex ions are Pseudomonas species. Metal cyanide complex ions can be used as a source of nitrogen for the growth of the microorganisms (Dursun et al., 1999), thus leading to the destruction of the CN− ion. At high concentrations, cyanide compounds can inhibit bacterial growth. The cyanide concentration, which completely inhibits bacterial growth, is known as the minimum inhibition concentration (MIC) (Adjei and Ohta, 2000).
Although several studies have been conducted on the bioremediation of simple cyanide compounds, there is limited knowledge of the bioremediation of metal–cyanide complex compounds. Specifically, no studies have been previously reported on the biodegradation of complex cyanide compounds by using Pseudomonas resinovorans. Therefore, the main objective of this study was to ascertain whether P. resinovorans is capable of degrading metal–cyanide complex compounds. The secondary objectives were to examine the growth kinetics of the bacteria in the presence of the cyanide compounds, to determine the MIC for the cyanide compounds, and to evaluate the effects of pH and initial glucose concentration on the degradation of the cyanide compounds. Since the cyanide compounds were the only sources of nitrogen in our experiments, and previous studies have demonstrated ammonia formation as the main destruction pathway during cyanide biodegradation, we employed the formation of ammonia as an indication of the occurrence of biodegradation by P. resinovorans.
Materials and Methods
Culture of P. resinovorans
The P. resinovorans (ATCC® 14235), purchased from ATCC (Manassas, VA), was used in this study. The bacteria cells were grown in an M9 nutrient broth at a pH of 7.1, in 250-mL conical flasks, and were incubated at 30°C in a shaker incubator at 230 rpm for 24 h. The bacteria were then harvested by centrifugation at 4000 g for 5 min and washed twice in phosphate-buffered solution (PBS). The harvested cells were then transferred (ration 1:10) into the cyanide medium.
Preparation of cyanide stock solutions
Potassium hexacyanoferrate (II) trihydrate, sodium hexacyanoferrate (II) decahydrate, and potassium dicyanoargentate (Sigma-Aldrich, Carlsbad, CA) were used in this study. Stock solutions of the cyanide compounds were prepared at a concentration of 0.5 M and pH 10 (Gurbuz et al., 2009; Huertas et al., 2010). A predetermined quantity of the stock solution was added to 50 mL of the M9 medium to get the desired cyanide concentration for batch tests.
MIC tests
Cyanide compounds were added to the M9 medium as the only nitrogen source. M9 medium with cyanide concentrations ranging from 1.56 to 100 mM were introduced into culture tubes with a volume of 2 mL for each sample. About 50 μL of resting cells suspended in PBS solution (optical density [OD] ≈1) were added to each sample (Chen et al., 2008). The solution was then placed on the shaker incubator at 30°C and 230 rpm for 24 h. The bacterial concentration was determined at the beginning and after 24 h of growth. A control experiment was set up by using the M9 medium with ammonium chloride (5.0 g/L) as a nitrogen source, and the bacterial growth was also assessed.
Biodegradation tests using cyanide as a nitrogen and glucose as a carbon source
Bacteria were grown in the M9 medium supplemented with 6.25 mM of cyanide compounds and a predetermined quantity of glucose. The initial pH of solution was adjusted to the desired value by using sterile dilute and concentrated H2SO4 or NaOH and was not controlled during fermentation. Sterilization of the medium was performed in an autoclave at 121°C for 15 min.
The effect of the initial pH on the bioremoval of cyanide was studied. The biodegradation medium was prepared at constant cyanide and glucose concentrations of 6.25 mM and 4 g/L, respectively. The initial pH values were 5 (Dursun et al., 1999), 7 (Chen et al., 2009; Kim et al., 2011), and 9 (Luque-Almagro et al., 2005). Resting cells were then added to the medium and placed in the shaker incubator at 30°C and 230 rpm for 72 h. For each initial pH, bacterial growth, glucose concentration, and ammonia generation were measured.
The effects of the initial glucose concentration of the biodegradation medium were also investigated. The medium was prepared with glucose concentrations of 0.5, 1.0, 2.0, and 4.0 g/L and cyanide concentration of 6.25 mM. The initial pH was the optimum pH obtained from the study of pH effects outlined above. Resting cells were then added to the medium, which was placed in the shaker incubator at 30°C and 230 rpm for 72 h. For each initial glucose concentration, bacterial growth, glucose concentration, and ammonia generation were determined.
Analytical methods
Bacterial growth was assessed by measuring the OD of the medium at 600 nm wavelength using a spectrophotometer. A medium without inoculated bacteria was used as a blank solution. Glucose concentration was determined by using the “phenol-sulfuric acid assay” method (Fournier, 2001). Ammonia nitrogen was measured according to the Method 10023 (Salicylate method for Nitrogen, Ammonia Low Range [0.02–2.50 mg/L NH3-N]) (HACH Company, Loveland, CO). All the experimental data reported were taken from an average of three measured values.
Statistical analysis
A one-way ANOVA test was performed at a 95% confidence interval among the replicate data values obtained during the tests to determine whether the replicate values were significantly different. In addition, the standard deviations among the values were calculated. To verify the MIC values of the cyanide compounds, independent one-sample t-test was performed at a 95% confidence interval. The one-way ANOVA test, performed at a 95% confidence interval, was conducted to investigate how the ammonia production and glucose utilization were impacted under different pH values for the cyanide degradation experiments. A Tukey HSD test was performed for multiple comparisons when the ANOVA test showed significant differences (p<0.05). Furthermore, the effects of initial glucose concentration on the growth rate, glucose utilization, and ammonia production were analyzed by the ANOVA and Tukey HSD tests.
Independent two-sample t-test was performed at a 95% confidence interval to compare the ammonia production and glucose utilization using the two cyanide compounds for the same pH value. Similarly, the bacteria growth, ammonia production, and glucose utilization using the two cyanide compounds for the same glucose concentration were also compared.
Results and Discussion
Growth curve
The primary growth curve showed three distinguishable phases during 72 h; a short lag phase of the first 2 h, a logarithmic growth phase from 3 to 40 h, and the stationary phase after 40 h (Fig. 1). The near-classic growth curve observed is indicative of the bacterial viability and activity in the medium used and demonstrated the adequacy of the OD method for measuring bacteria growth and content in this study. The bacteria were harvested during the logarithmic growth phase and used in the cyanide biodegradation tests (Kaewkannetra et al., 2009).
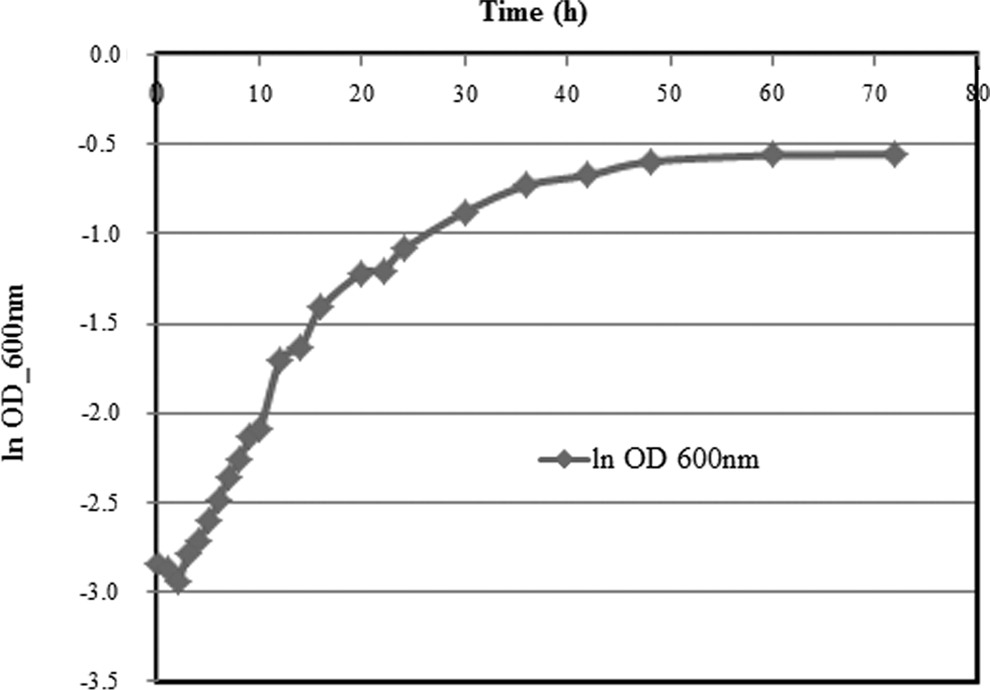
Growth of Pseudomonas resinovorans in nutrient broth. OD, optical density.
MIC tests
There was no growth of the bacteria for all concentrations of potassium cyanoargentate (KAg(CN)2) (Fig. 2). For each concentration of KAg(CN)2, there was a decrease in the bacterial population after the 24 h compared to its initial bacterial population, which suggests an inhibitory effect for KAg(CN)2. This is probably due to the presence of silver in this compound. Silver is generally known as a bactericide (Butkus et al., 2004). Choi et al. (2008) also observed the inhibitory effect of silver ions on the growth of Escherichia coli PHL628-gfp. The inhibitory effect occurs due to the sorption of the silver ion to the negatively charged bacterial cell wall, deactivates the cellular enzymes, disrupts the permeability of the membrane, and thus, leads to the cell lysis and death. Silver also combinds to DNA and RNA by denaturing and inhibits the replication of bacteria (Sambhy et al., 2006; Rai et al., 2009). Therefore, bioremediation using P. resinovorans is not effective for the removal of KAg(CN)2.
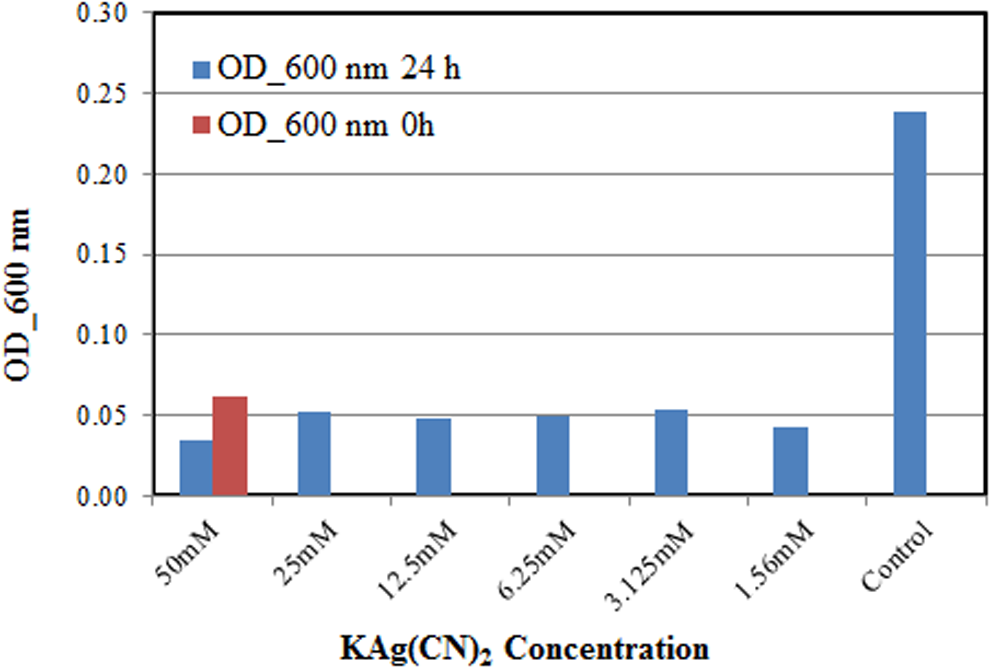
Minimum inhibition concentration (MIC) test for P. resinovorans in KAg(CN)2. Red bar=initial bacteria content; blue bar=final bacteria content after 24 h.
Figure 3a shows the bacterial growth at various potassium ferrocyanide (K4Fe(CN)6) concentrations with an initial OD of 0.065. The OD values increased after 24 h for all cyanide concentrations except the one for 25 mM. The OD values were 0.125, 0.118, 0.109, and 0.116 for cyanide concentrations of 1.56, 3.25, 6.25, and 12.5 mM, respectively. These higher OD values indicate that the bacteria are growing. For 25 mM of K4Fe(CN)6, a decrease in the OD suggests an inhibiting effect to the growth of the bacteria. Therefore, 25 mM (i.e., 10.55 g/L) was considered as the MIC for K4Fe(CN)6.
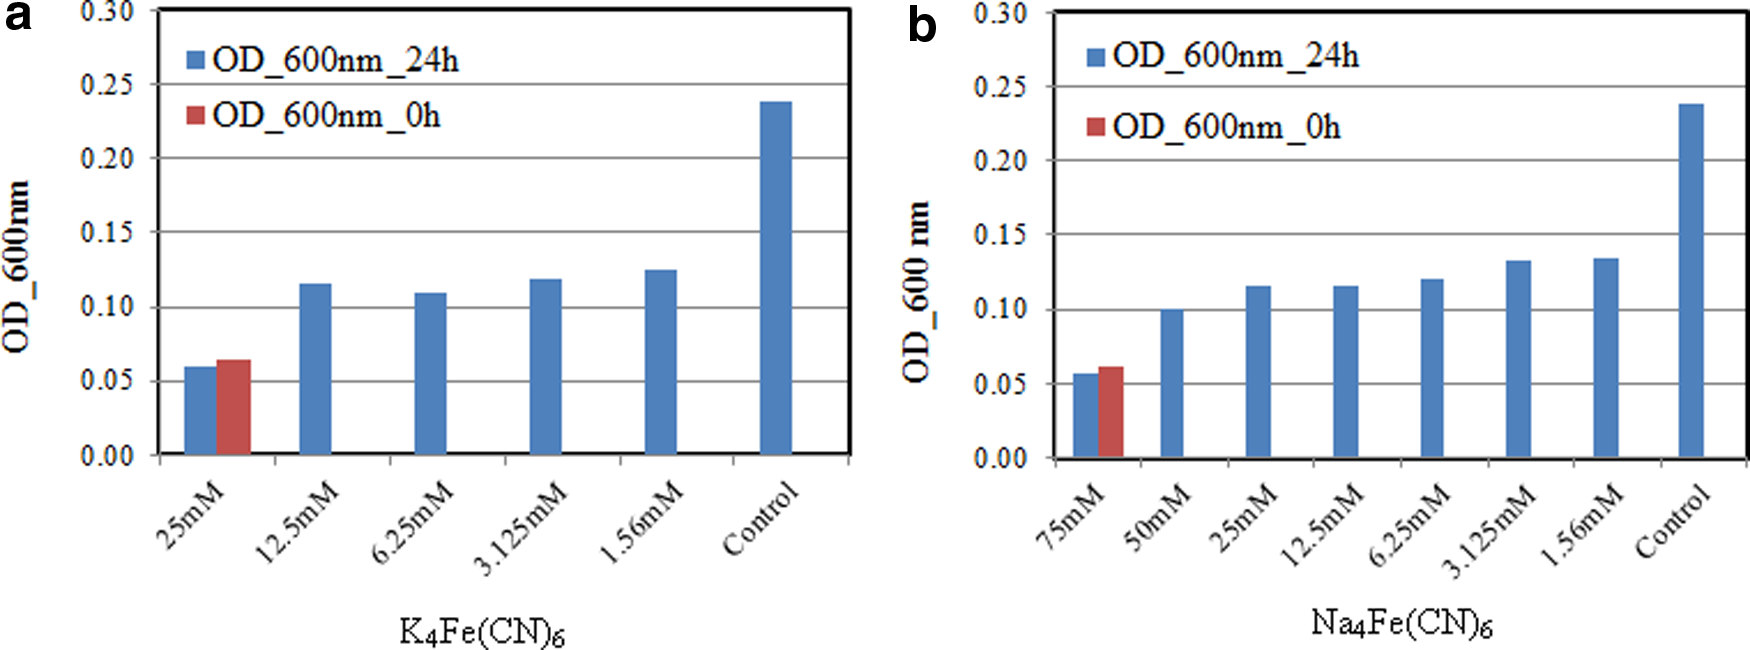
MIC test of P. resinovorans using
The growth of bacteria at different sodium ferrocyanide (Na4Fe(CN)6) concentrations with initial OD of 0.065 is shown in Figure 3b. The OD values were 0.135, 0.133, 0.12, 0.116, 0.115, and 0.1 for concentrations of 1.56, 3.125, 6.25, 12.5, 25, and 50 mM of Na4Fe(CN)6, respectively, after 24 h. Since the OD at a 75 mM of Na4Fe(CN)6 was 0.06, which was lower than the initial OD of 0.065, then we conclude that Na4Fe(CN)6 inhibited the bacterial growth at 75 mM. Therefore, the MIC value was considered as 75 mM (i.e., 36.3 g/L) for Na4Fe(CN)6.
Effect of initial pH
The ammonia production as a function of initial pH are presented in Figure 4 for Na4Fe(CN)6 and K4Fe(CN)6. About 6.25 mM of the cyanide compounds and 4 g/L of glucose were used in these tests. At pH 5 and 7 for the K4Fe(CN)6, ammonia was first detected after 24 h at a concentration of 0.08 mg/L (Fig. 4a). Then, ammonia concentration increased with time to 0.28 mg/L for pH 7 and 0.36 mg/L for pH 5 after 48 h and then remained relatively stable for pH 7 but declined for pH 5 to about 0.2 mg/L. At a pH of 9 for K4Fe(CN)6, ∼0.14 mg/L of ammonia was detected after about 16 h and finally increased to 0.3 mg/L in 72 h. Since the only source of nitrogen was the cyanide compound, the formation of ammonia from cyanide clearly demonstrate that P. resinovorans is effectively degrading this compound (Akcil and Mudder, 2003).
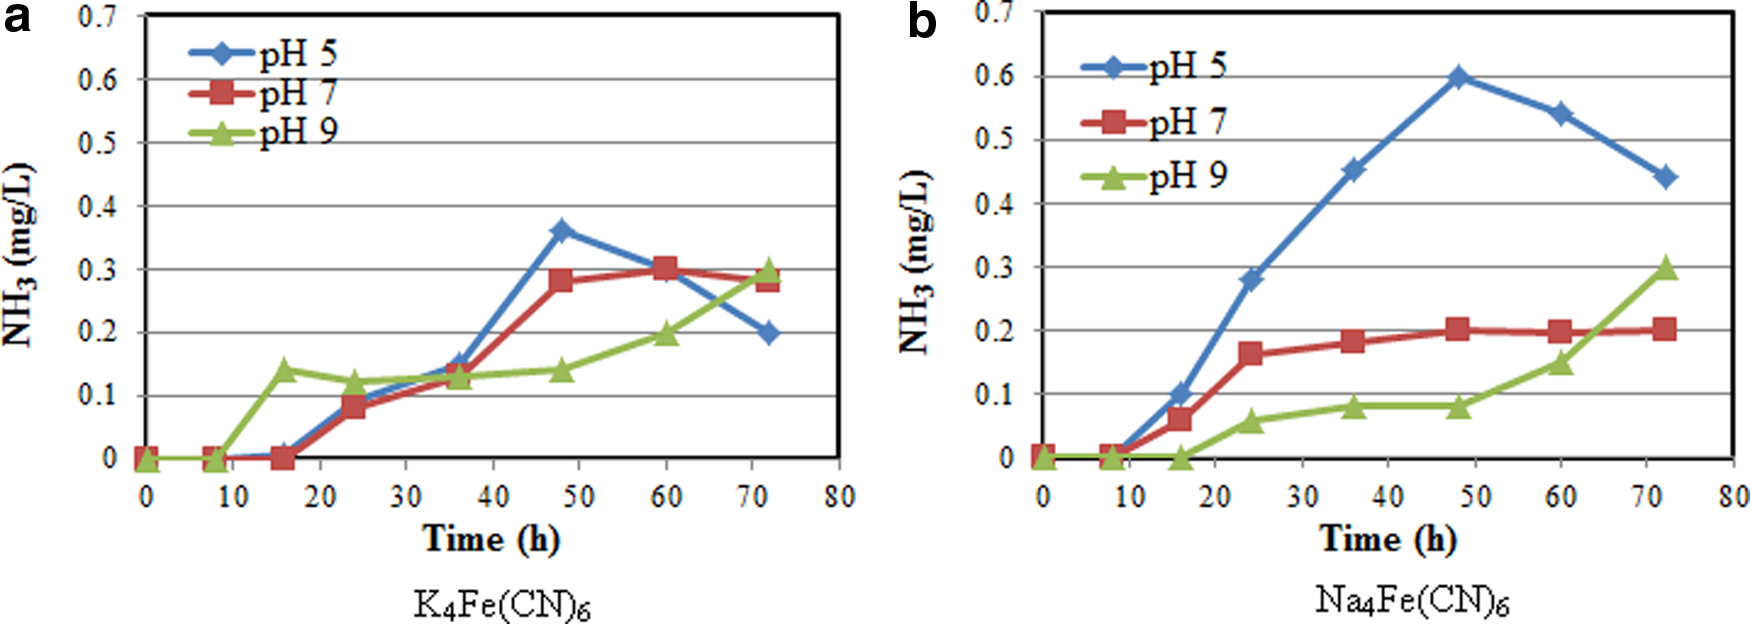
Effect of pH on ammonia–nitrogen generation using
For the Na4Fe(CN)6 (Fig. 4b), the trends for the ammonia production were similar to the K4Fe(CN)6 results, except for the actual concentrations. At pH 5 and 7, ammonia was first detected at the 16th hour with concentrations of 0.1 and 0.06 mg/L, respectively. At a pH of 5 and 7, the highest ammonia concentrations were 0.6 and 0.2 mg/L, respectively, at 48 h. After that the concentration declined for pH 5 and remained relatively constant for pH 7. For pH 9, about 0.06 mg/L of ammonia was first detected at the 24th hour and then increased up to 0.3 mg/L in 72 h (Fig. 4b). This bimodal ammonia production may be a result of a longer acclimation period for the bacteria at this pH.
Several other researchers have also reported the production of ammonia during the degradation of cyanide compounds in aqueous media (Kao et al., 2003, 2004; Luque-Almagro et al., 2005). The production of ammonia is indicative of a reductive hydrogenation pathway for the CN biodegradation by the microbes. The highest ammonia production at a pH of 5 is attributable to the higher bacteria activity for CN degradation, coupled with higher availability of hydrogen ions (H+), relative to pH 7 and 9. The relatively rapid decline in ammonia after reaching a maximum at 48 h at pH 5 could be indicative of exhaustion in the usable cyanide nitrogen, in addition to the conversion of ammonia to nitrite and nitrate (Akcil et al., 2003). Also, at such ammonia concentrations, the bacteria can utilize ammonia as their nitrogen source, particularly since cyanide would have been depleted significantly. This is in agreement with previous results (White and Schnabel, 1998; Kao et al., 2003; Chen et al., 2009). In addition, the decline of ammonia at pH 5 could be due to the higher acidity, which enhances ammonia gas emission from solution.
For the two ferrocyanide compounds, the maximum ammonia was generated at pH 5, thus suggesting a maximum bacterial activity for cyanide conversion at this pH, coupled with a higher H+ concentration. Dursun et al. (1999) have also reported a maximum ferrocyanide degradation rate at pH 5 using Pseudomonas fluorescens P70. They also observed that the bacterial activity was significantly reduced at pH 7 and was almost inhibited at pH 9. The P. resinovorans used in this study was very active at both pH 5 and 7 but showed reduced activity at pH 9. Chen et al. (2009) also reported maximum cyanide removal at pH 7 using Klebsiella oxytoca. However, Huertas et al. (2010) found effective cyanide removal at pH 9.5 using Pseudomonas pseudoalcaligenes strain CECT5344.
Table 1 presents the glucose utilization at all pH values with the ferrocyanide compounds with initial cyanide concentrations of 6.25 mM. At pH 5 and 7 for both compounds, the initial glucose concentrations declined rapidly within the first 12–24 h and then remained relatively constant. However, at pH 9, the glucose utilization rate was much lower for both K4Fe(CN)6 and Na4Fe(CN)6. These glucose utilization results support the observed bimodal results for ammonia production at pH 9 discussed earlier and also in terms of the higher viability of the microbes and enhanced production of ammonia at pH values of 5 and 7. Although the maximum ammonia generation occurred at pH 5, glucose utilization was similar at pH 5 and 7. This observation again suggests that the difference may be directly related to H+ availability for ammonia formation at the lower pH value.
Effect of initial glucose concentration
The effects of initial glucose concentration on bacteria growth are presented in Figure 5. At all glucose concentrations, ranging from 0.5 to 4.0 mg/L, the bacteria continued to grow until 72 h (Fig. 5a, b). The bacteria growth pattern was similar for both K4Fe(CN)6 and Na4Fe(CN)6. The OD values were observed to be increased at higher glucose concentrations. The maximum OD was about 0.09 after 70 h at 4 g/L of initial glucose concentration for the two cyanide compounds.
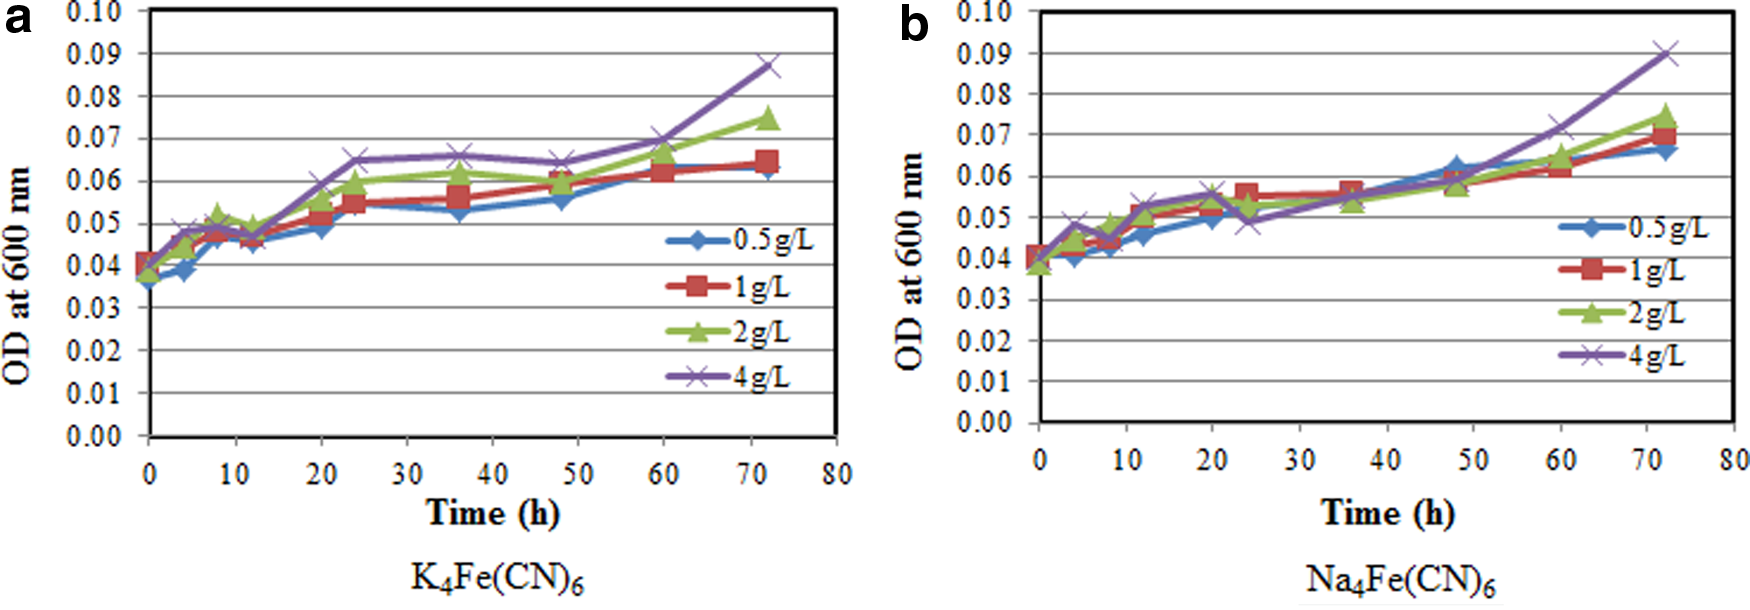
Effect of initial glucose concentration on the growth of bacteria at pH of 5.0 with
Initial glucose concentration had a significant effect on glucose utilization by P. resinovorans using K4Fe(CN)6 and Na4Fe(CN)6 (Table 2). The glucose utilization pattern was similar for all initial glucose concentrations in the sense that a rapid glucose concentration drop was observed for the first 20–24 h, after which the concentration remained relatively constant until 72 h. But, the concentration at which glucose utilization levels off is higher as the initial glucose concentration increases. It is noteworthy that while the bacteria utilization of glucose apparently stopped after 20–24 h, the bacteria continued to grow untill 72 h. These results indicate that the bacteria cells were utilizing a carbon source other than glucose after 20–24 h. Since the only other source of carbon was the CN− ion, it can be concluded that P. resinovorans are able to utilize cyano carbon for their growth. Babu et al. (1992) also reported that Pseudomonas putida can utilize cyanide compounds as sole source of carbon and nitrogen.
The effects of initial glucose concentration on ammonia generation are presented in Figure 6. The figure clearly indicates that for both cyanide compounds, ammonia production begins after about 16–24 h, which corresponds with the period at which glucose utilization becomes insignificant. The production of ammonia is clearly indicative of the beginning of the biodegradation of the cyanide compounds. Hence, the cessation of glucose carbon utilization also indicate the beginning of the utilization of both the cyanide nitrogen and carbon during the degradation of both compounds. Ammonia formation was increased rapidly after about 24 h (Fig. 6a, b), rising to a maximum concentration after 48–60 h, and followed by a decline untill 72 h. These results support the conclusion that P. resinovorans is able to utilize cyanide carbon for its growth. The decrease in ammonia concentrations toward the end of the experiments for both cyanide compounds is attributable to two factors. The first factor is the possible use of the ammonia by the microbes as a source of nitrogen (Akcil and Mudder, 2003). The second factor is a gradual emission of ammonia from solution.
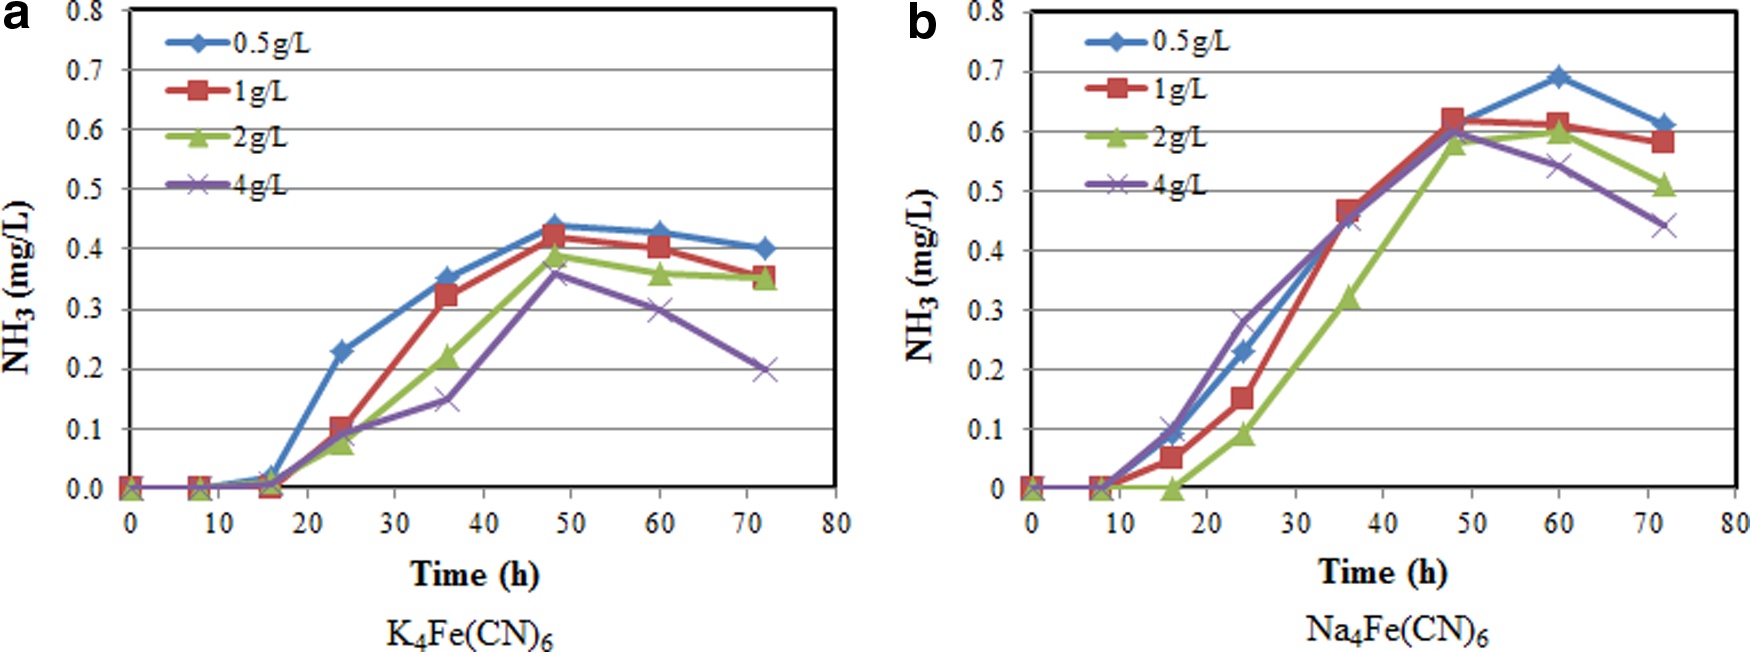
Effect of initial glucose concentration on ammonia–nitrogen generation at pH=5.0 with
Growth kinetics
The specific growth rates were calculated based on the assumption of the first-order kinetics for the exponential growth phase (Huertas et al., 2010). Figure 7 shows the first-order plot of OD/ODi versus time for four initial glucose concentrations using the two complex cyanide compounds tested. All of the plots show straight lines from which specific bacteria growth rates for various initial glucose concentrations were calculated. The specific growth rates were determined to be 0.0067, 0.0058, 0.0072, and 0.0087 h−1 for the initial glucose concentration of 0.5, 1, 2, and 4 g/L, respectively, for K4Fe(CN)6. For Na4Fe(CN)6, the specific growth rates were estimated to be 0.0073, 0.0066, 0.007, and 0.0088 h−1 for the same initial glucose concentrations, respectively. The results showed an increasing trend in specific growth rate with increase in initial glucose concentration.
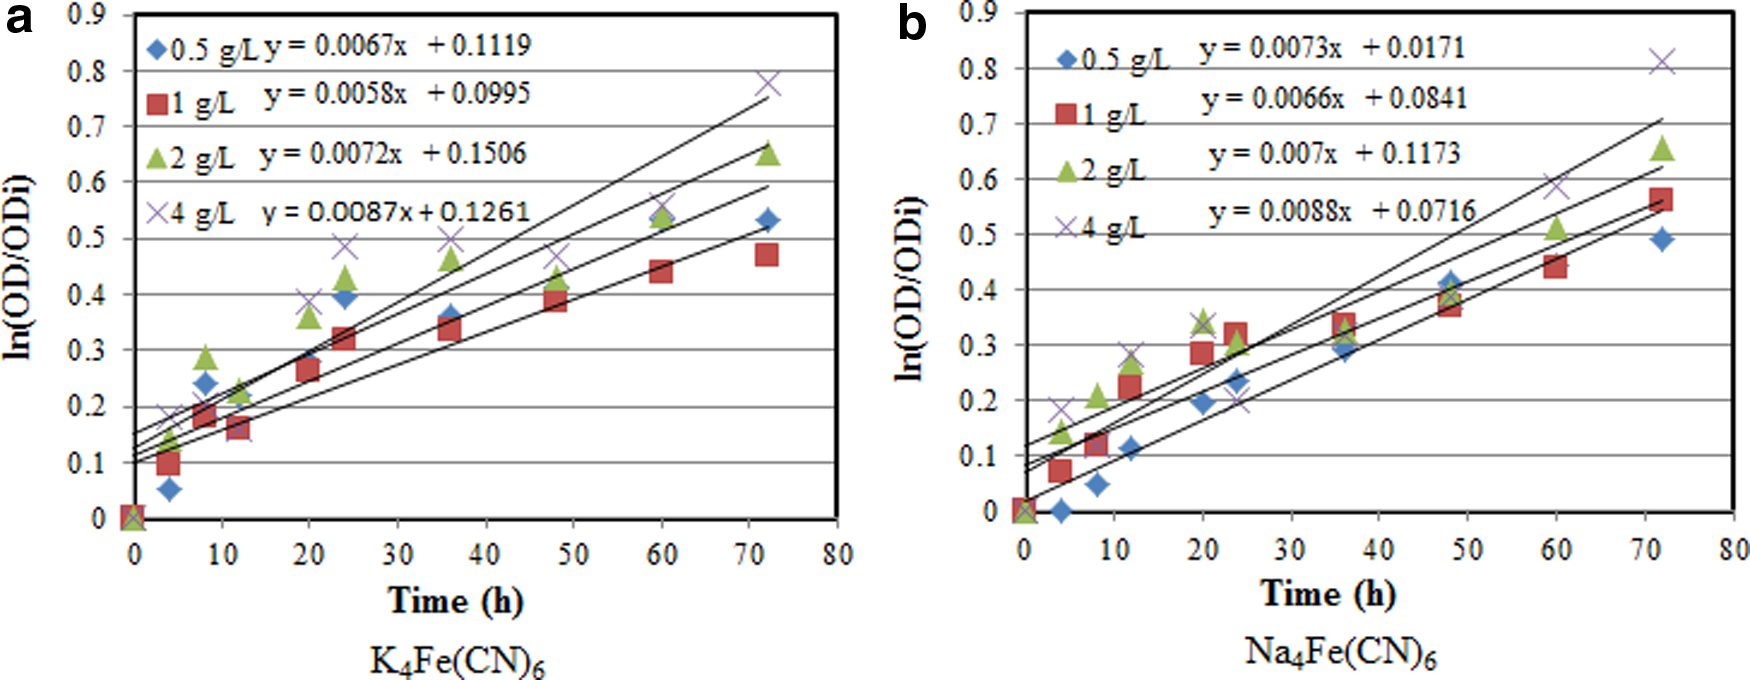
Ln(OD/ODi) versus time for various initial glucose concentrations using
Statistical analysis
The results of the ANOVA analysis showed that, at 95% confidence interval, there was no significant difference (p<0.05) in the replicate values obatined during various tests.
Independent one-sample t-test, at a 95% confidence interval, shows that the bacteria growth after 24 h is significantly lower than that of 0 h for all concentrations of KAg(CN)2. This is clearly indicative of bacteria growth inhibition in the presence of the silver containing cyanide compound, KAg(CN)2. For K4Fe(CN)6, the bacteria growth after 24 h was significantly higher compared to the bacteria growth at 0 h for cyanide concentrations ranging from 0 to 12.5 mM. However, the bacteria growth at 24 h was less than the bacteria growth at 0 h for 25 mM of cyanide concentration. Therefore, the MIC value was taken as 25 mM for K4Fe(CN)6. For Na4Fe(CN)6, the bacteria growth at 24 h was significantly higher compared to the bacteria growth at 0 h for all cyanide concentrations tested, except for 75 mM. At this concentration, the bacteria growth after 24 h was slightly lower than the initial growth rate. Therefore, the MIC value of Na4Fe(CN)6 was taken to be 75 mM.
To identify the effects of pH on ammonia generation and glucose utilization, ANOVA test was performed at a 95% confidence interval. The results showed that the ammonia production using K4Fe(CN)6 was not significantly different (p=0.9874>0.05) at pH values of 5, 7, and 9. However, the ammonia production was significantly different (p=0.0297<0.05) at the different pH values using Na4Fe(CN)6. Therefore, Tukey HSD test was performed to identify the significantly different values for the sodium containing cyanide compound. The Tukey HSD test results showed that the ammonia production at pH values of 5 and 9 were significantly different (HSD=0.218>0.202), whereas the ammonia productions between pH values of 5 and 7 (HSD=0.18<0.202) and between 7 and 9 (HSD=0.04<0.202) were not significantly different. Independent two-samples t-test results showed that, at a 95% confidence interval, the ammonia production was not significantly different at a similar pH of 5 using K4Fe(CN)6 and Na4Fe(CN)6 (p=0.1215>0.05). Similarly, there was no significant difference in ammonia production at pH of 7 (p=0.8738>0.05) and 9 (p=0.3870>0.05) using K4Fe(CN)6 and Na4Fe(CN)6. The glucose utilization was not significantly different at different pH values for the similar cyanide compound based on the ANOVA test as described earlier. In addition, independent two-sample t-test indicated that there was no significant difference in glucose utilization at a similar pH for the two cyanide compounds. The effects of initial glucose concentration on the bacteria growth, glucose utilization, and ammonia production were compared based on the one-way ANOVA test described earlier. The results showed that the bacteria growth was significantly different for various initial glucose concentrations. However, there was some inconsistancy in the results. Mostly, there was significant difference in bacteria growth between initial glucose concentrations of 0.5 and 4 g/L using K4Fe(CN)6 and Na4Fe(CN)6. Ammonia production was not significantly different at initial glucose concentrations of 0.5–4.0 g/L using K4Fe(CN)6 and Na4Fe(CN)6. However, the glucose utilization was significantly different at glucose concentrations of 0.5–4.0 g/L using K4Fe(CN)6 (p=0.00000<0.05) and Na4Fe(CN)6 (p=0.00000<0.05). For K4Fe(CN)6, glucose utilization was not significantly different (HSD=0.2417<0.604) when initial glucose concentration of 0.5 and 1 g/L were used based on the Tukey HSD test. However, glucose utilization was significantly different for initial glucose concentrations of 0.5 and 2 g/L, 0.5 and 4 g/L, 1 and 2 g/L, 1 and 4 g/L, and 2 and 4 g/L, as shown in Table 3. For Na4Fe(CN)6, glucose utilization was not significantly different for the initial glucose concentration of 0.5 and 1 g/L and 1 and 2 g/L. For other initial glucose concentrations, the glucose utilization was significantly different (Table 3).
Summary and Conclusions
P. resinovorans is able to utilize K4Fe(CN)6 and Na4Fe(CN)6 as both nitrogen and carbon sources when the initial cyanide concentrations are less than their MIC values. However, KAg(CN)2 was found to inhibit the growth of the bacteria. The MIC values were found to be 25 mM (10.55 g/L) and 75 mM (36.3 g/L) for K4Fe(CN)6 and Na4Fe(CN)6, respectively. The optimum pH was 5.0 because the maximum ammonia production was observed at this pH during P. resinovorans degradation of the cyanide compounds. The growth of bacteria was almost similar at lower glucose concentrations but varied significantly when glucose concentration was increased. Glucose was not utilized for the bacteria growth after 24 h when the degradation of the cyanide compounds started, thus indicating that the bacteria was able to utilize the residual carbon from the degrading cyanide compounds. To date, there are few bacteria identified, which have the ability to utilize cyanide as a sole source of carbon and nitrogen. Since P. resinovorans has not yet been used to degrade any cyanide compounds and has ability to utilize the cyanide compound as both nitrogen and carbon sources, it can be a potential candidate for the degradation of cyanide. Soil and water are contaminated due to the generation of a large volume of cyanide bearing waste from various industries. Hence, the removal of cyanide from the industrial wastewater before discharge into the nature is very important. Therefore, the findings of this study would be useful in designing a unit operation based on the first-order growth kinetic model of P. resinovorans in a full-scale wastewater treatment plant for the treatment of cyanide-contaminated industrial wastewater.
Footnotes
Acknowledgments
This study was made possible by the support of the American People through the United States Agency for International Development (USAID) and managed by Higher Education for Development (HED). The contents of this article are the sole responsibility of the authors and do not reflect the views of Higher Education for Development, USAID, or the United States government.
Author Disclosure Statement
No competing financial interests exist.