
Abstract
Abstract
Cadmium sulfide (CdS) nanomaterials (such as CdS nanodots or nanorods) are widely used in optical, electronic, and biological applications. Large-scale production and use of these materials will likely result in accidental and incidental releases, which raise concerns about their potential environmental and human-health impacts. Most studies on toxicity of Cd-containing nanomaterials have focused on nanodots, and the relative toxicity of Cd-containing nanorods is not well understood. Here, we compared genotoxicity and cytotoxicity of CdS nanorods (30–50 nm diameter, 500–1100 nm length) and cubic CdS nanodots (3–5 nm) in mice by examining total cadmium accumulation in organs, acute toxicity, DNA damage, spermatozoon viability and abnormality, kidney and liver damage, and oxidative stress. Compared with (smaller) nanodots, nanorods resulted in relatively low bioaccumulation, acute toxicity, and damage to spermatozoa and the tested organs. Differences in toxicity between CdS nanodots and nanorods could not be fully explained by differences in their metal ion (Cd2+) release patterns, based on control tests with mice gavaged with dissolved CdCl2 at equivalent concentrations. This underscores that toxicity of metallic nanomaterials could not be solely predicted based either on their elemental composition or on the amount of ions released before receptor intake. Particle morphology (including size) may also need to be considered.
Introduction
P
Cadmium-containing nanomaterials are widely used in optical, electronic, and biological applications (Nirmal et al., 1996; Agarwal et al., 2005; Bowers et al., 2005). Accordingly, concern about their potential environmental and human-health impacts has increased (Rzigalinski and Strobl, 2009). It has been argued that toxic effects of CdSe are largely linked to Cd2+ released from the CdSe surface (Kirchner et al., 2005; Mahendra et al., 2008; Su et al., 2010). Cd2+ released from quantum dots is bactericidal, and it may also induce production of intracellular reactive oxygen species (ROS), resulting in oxidative stress (Dailianis et al., 2005; Yang et al., 2007a, 2007b). Haque et al. (2013) concluded that oxidative stress caused by higher production of ROS was an important factor in the pathogenicity of CdSe/CdS-MPA nanodots to mice. Hossain and Mukherjee (2013) reported that ROS levels in both Escherichia coli and HeLa cells increased on exposure to CdS nanodots; in addition, HeLa cells exhibited altered morphology with condensed and fragmented nuclei. Such overloads of ROS in mammalian cells can damage membrane lipids, proteins, and DNA (Finkel and Holbrook, 2000). Li et al. (2009) argued that both increased intracellular ROS and Cd2+ release are possible mechanisms for the cytotoxicity of CdS quantum dots. They also suggested that with the increase of quantum dot concentration, the toxicity mechanism changes from intracellular oxidative stress to Cd2+ release.
To date, the relative toxicity of cadmium-containing nanorods is not well understood. In particular, it is unknown whether differences in acute toxicity and genotoxicity between Cd-containing nanodots and nanorods are mainly due to differences in their Cd2+-release characteristics. In this study, we used mice to compare genotoxicity and cytotoxicity of CdS 1D nanorods versus CdS 0D nanodots, using CdCl2 salt as a control for the effect of released Cd2+. Acute toxicity of the two CdS nanoproducts was compared along with bioaccumulation of total Cd in different organs, including kidney, liver, and spermary. A comet assay with mice lymphocytes was also conducted to evaluate DNA damage by means of single-cell gel electrophoresis. Damage to spermatozoa, liver, and kidney after exposure to nanodots or nanorods was also compared.
Materials and Methods
Reagents and animals
All chemical reagents were purchased from Beijing Chemical Reagent Ltd., China, and used without further purification. Superoxide dismutase (SOD) and malondialdehyde (MDA) kits were purchased from Beyotime Institute of Biotechnology, China. Kunming mice (17–22 g/mouse) were obtained from the Center for Experimental Animals of North China Coal Medical University. The mice were maintained at 22°C for one week before use in the experiments.
Synthesis and characterization of CdS nanomaterials
CdS nanodots were synthesized by adding 200 mL of 0.2 M Na2S to 200 mL of 0.2 M CdCl2 solution under agitation (85-2, Gongyi Kehua) (700 rpm). To synthesize CdS nanorods, CdCl2 (0.3 g) and thioacetamide (0.4 g) were added to a 30-mL Teflon-lined stainless steel autoclave, followed by the addition of 2 mL of distilled water and 18 mL of ethylenediamine. The autoclave was placed in an oven at 150°C for 24 h, and then allowed to cool to room temperature. The yellowish product was collected and washed with distilled water and ethanol.
Sizes and shapes of all the samples were examined using a Hitachi 3500 scanning electron microscope (SEM), as well as a JEOL-2010 high-resolution transmission electron microscope (TEM) that was operated at an acceleration voltage of 200 kV. The crystal structure was characterized with a Rigaku D/Max-2500 X-ray diffractometer (XRD) employing Cu Kα radiation, λ=1.54056 Å. Hydrodynamic diameters were measured by dynamic light scattering, and ζ potentials were measured by electrophoretic mobility, on a Malvern Zetasizer (ZETAPALS/BI-200SM, Brookhaven).
Characterization of CdS dissolution at different pH values
To characterize dissolution kinetics, CdS nanorods or nanodots were suspended in saline (0.9% NaCl) at 10 g/L. The pH was adjusted with HCl or NaOH. After agitation for designated time intervals, 10 mL of the suspensions was taken out and centrifuged at 25,750 g for 10 min to separate the CdS nanomaterial and the solution (Chen et al., 2012). The supernatant was withdrawn, and the Cd2+ concentration in the solution was measured with inductively coupled plasma (ICP; ICP-9000, Jarrell-Ash). For each CdS product, the dissolution kinetics was examined at pH 2.0 and 7.0, respectively.
Acute toxicity
Acute toxicity of CdS nanodots, CdS nanorods, and CdCl2 salt was tested. The study population of 120 mice were randomly divided into 12 groups (each containing 10 mice). After an absolute diet for 12 h, CdS nanoproducts or CdCl2 salt were gavaged to the mice. Gavagation was performed daily for 2 weeks. The daily doses used were: CdS nanodots, 215, 464, 1000, and 2150 mg/kg; CdS nanorods, 1000, 2150, 4640, and 10,000 mg/kg; and CdCl2, 46.4, 100, 215, and 464 mg/kg. The median lethal dose (LD50) was calculated using Horn's equation (Horn et al., 1956).
Accumulation of cadmium in mice
To test cadmium accumulation, 112 mice were randomly divided into seven groups (each containing 16 mice). Groups 1 and 2 were gavaged with high doses of CdS nanodots or nanorods; the concentrations of CdS nanomaterials were 10 mg/mL in saline (equivalent to a dose of 200 mg/kg per day). Groups 3 and 4 were gavaged with low doses of CdS nanodots or nanorods; the concentration of CdS nanomaterials were 5 mg/mL in saline (100 mg/kg per day). Groups 5 and 6 were gavaged with 12.7 g/L (high dose, 254 mg/kg per day) or 6.35 g/L (low dose, 127 mg/kg per day) of CdCl2 saline solution (the total mass of Cd in the solutions was equal to the respective mass of Cd involved in the experiments using CdS nanomaterials). Group 7 was used as the control and was gavaged with a saline containing 0.1 mg/L CdCl2 (equivalent to a dose of 2 μg/kg per day); this concentration of Cd2+ is slightly higher than the highest concentrations of dissolved Cd2+ from the CdS nanorods and nanodots as measured in the CdS dissolution experiments. After 18 or 35 days, eight mice from each group were dissected, and target organs, including liver, kidney, and spermary, were obtained. The target organs were liquefied with 5 mL nitric acid and 1 mL hydrogen peroxide, microwave digested (Multiwave 3000, Anton Paar GmbH), and diluted to a final volume of 10 mL. Concentrations of total Cd in tissues were measured with an atomic absorption spectrum (SP-3520AA).
Comet assay for DNA damage
Forty mice were randomly divided into four groups (each containing 10 mice). Each group was gavaged with saline containing 10 g/L CdS nanodots (equivalent to a dose of 200 mg/kg per day), 10 g/L CdS nanorods (200 mg/kg per day), 12.7 g/L of CdCl2 (254 mg/kg per day), or 0.1 mg/L CdCl2 (control, 2 μg/kg per day), respectively. The comet assay experiments were carried out after 35 days following the standard protocol (Olive and Banath, 2006). Cells were analyzed at 400× magnification with a Komet 3.1 Image Analysis System (Kinetic Imaging) using a Leica DMLB fluorescence microscope.
Sperm quantity and quality
Thirty male mice were randomly divided into three groups (each containing 10 mice), and they were gavaged with 10 g/L CdS nanodots, 10 g/L CdS nanorods, and saline with 0.1 mg/L CdCl2 (control), respectively. After 35 days, the epididymis were removed and cut into pieces in physiological saline, and then filtrated. The filtrated saline solution was stained with 1% eosin solution for 15 min, washed with distilled water, and left to dry in the air (Bai et al., 2010; Elmazoudy et al., 2011). The samples were analyzed with a microscope, and the spermatozoon sperm quantity and quality was characterized from 5000 integral spermatozoa.
Damage to kidney and liver, and SOD and MDA assays
Forty mice were randomly divided into four groups (each containing 10 mice). Each group was gavaged daily with 10 g/L CdS nanodots (equivalent to 200 mg/kg), 10 g/L CdS nanorods (200 mg/kg), 12.7 g/L CdCl2 (254 mg/kg), and 0.1 mg/L CdCl2 (control, 2 μg/kg), respectively. The mice were killed by vertebral dislocation after 16 days, and their kidneys and livers were fixed by formalin. The fixed samples were sliced and stained with hematoxylin and eosin, and then histopathology examinations were performed. The SOD and MDA levels in mice blood serum were assayed using SOD and MDA assay kits S0081 and S0131 (Beyotime Institute of Biotechnology), respectively.
Results and Discussion
Characteristics of CdS nanodots and nanorods
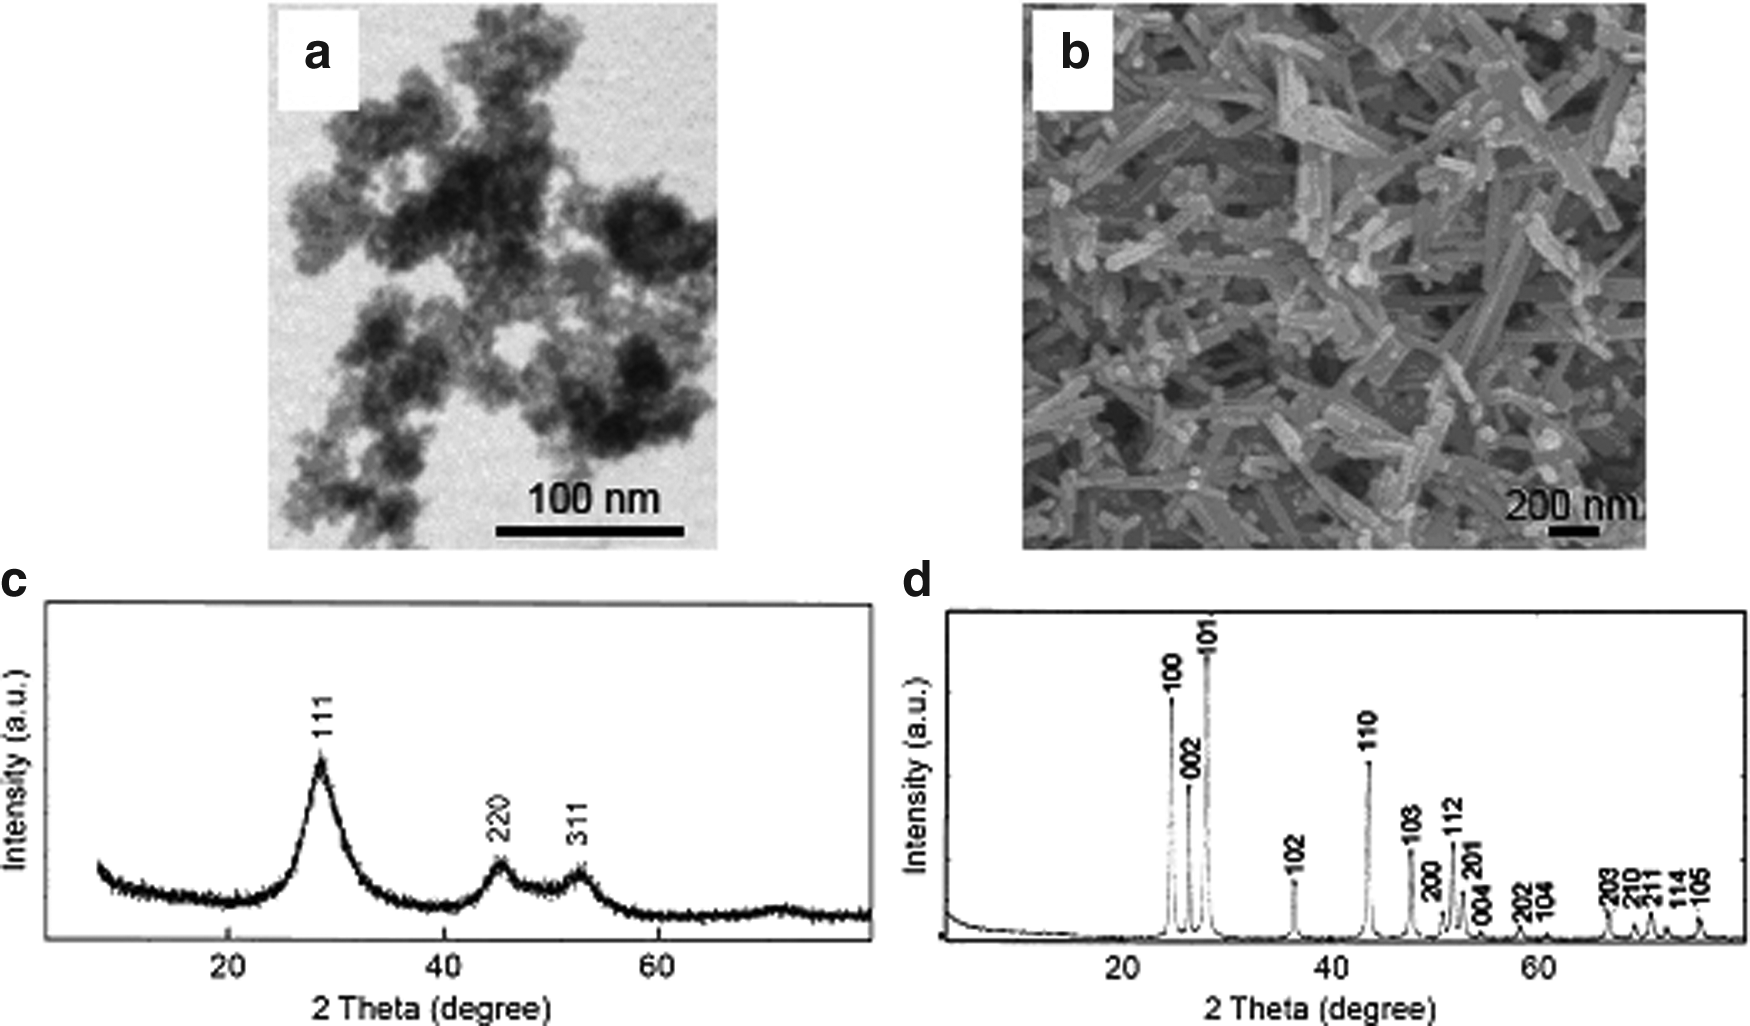
TEM and SEM images of the as-prepared CdS products are shown in Fig. 1. The dimensions of CdS nanodots ranged from 3 to 5 nm (Fig. 1a), whereas CdS nanorods had diameters ranging from 30 to 50 nm and lengths from 500 to 1100 nm (Fig. 1b). The XRD patterns (Fig. 1c,d) show that the nanodots had a cubic structure (a=5.818 Å, JCPDS: 10-0454) and the nanorods had a hexagonal structure (a=4.141 Å, c=6.72 Å, JCPDS: 41-1049). The ζ potential values (in ethanol) were 4.0 mV for CdS nanodots and 18.1 mV for nanorods.
Characterization of CdS nanomaterials:
Significant aggregation of CdS nanodots occurred in the saline exposure medium; the particle-sized distribution exhibited a large peak at 4914 nm and a small peak at 850 nm (Fig. 2a). Both differences in nanoparticle size and extent of aggregation represent potential confounding effects for the effective dose and distribution of nanomaterials delivered, which could affect the physiological response in mice. One additional confounding factor is that the nanomaterial aggregates that form in well-defined exposure media are not representative of the more complex and more difficult to characterize hetero-aggregates which form in vivo (Albanese and Chan, 2011). Despite such common confounding factors, it is important to explore how initial morphological differences in CdS nanoparticles affect their toxicity to different mammalian systems.

Dissolution of CdS nanodots and nanorods under different pH values
Both CdS nanodots and CdS nanorods released more Cd2+ at pH 2.0 than at pH 7.0, and dissolution leveled off after ∼60 h (Fig. 2b, c). The smaller nanodots (with thus higher specific surface area) released more Cd2+ than the nanorods. The concentration of dissolved Cd2+ reached 30 g/L for CdS nanodots, compared with 1.5 μg/L for CdS nanorods (for pH 7.0). For both nanoparticle suspensions, the released Cd2+ accounted for a relatively small fraction of the added total Cd. For example, at pH 2.0, the mass of Cd released was 0.0005% of the total amount of Cd contained in CdS nanodots, and 0.00003% for CdS nanorods.
Acute toxicity of CdS nanodots and nanorods
The LD50 values of CdS nanodots and CdS nanorods were 767 and 7203 mg/kg per day (Fig. 3), respectively; whereas the LD50 value of CdCl2 was lower at 137 mg/kg per day. The value corresponding to CdS nanodots is lower than that reported for bulk CdS material for mice (1166 mg/kg per day, according to the material safety data sheet), suggesting higher toxicity of these nanoparticles. On the other hand, the LD50 for CdS nanorods is significantly higher than that of the bulk CdS. It should be noted that the LD50 value of CdS nanodots was only 5.6 times higher than the LD50 value of CdCl2, even though CdS nanodots showed a limited dissolution potential (0.0005% of total Cd present) in the exposure medium (Fig. 3); whereas CdCl2 was completely dissolved. This suggests that the toxicity of Cd-containing nanomaterials cannot be simply predicted based on the amount of Cd2+ released before intake. Obviously, the bioavailable Cd that contributes to toxicity encompasses a greater fraction than Cd2+ ions dissolved in the exposure medium.
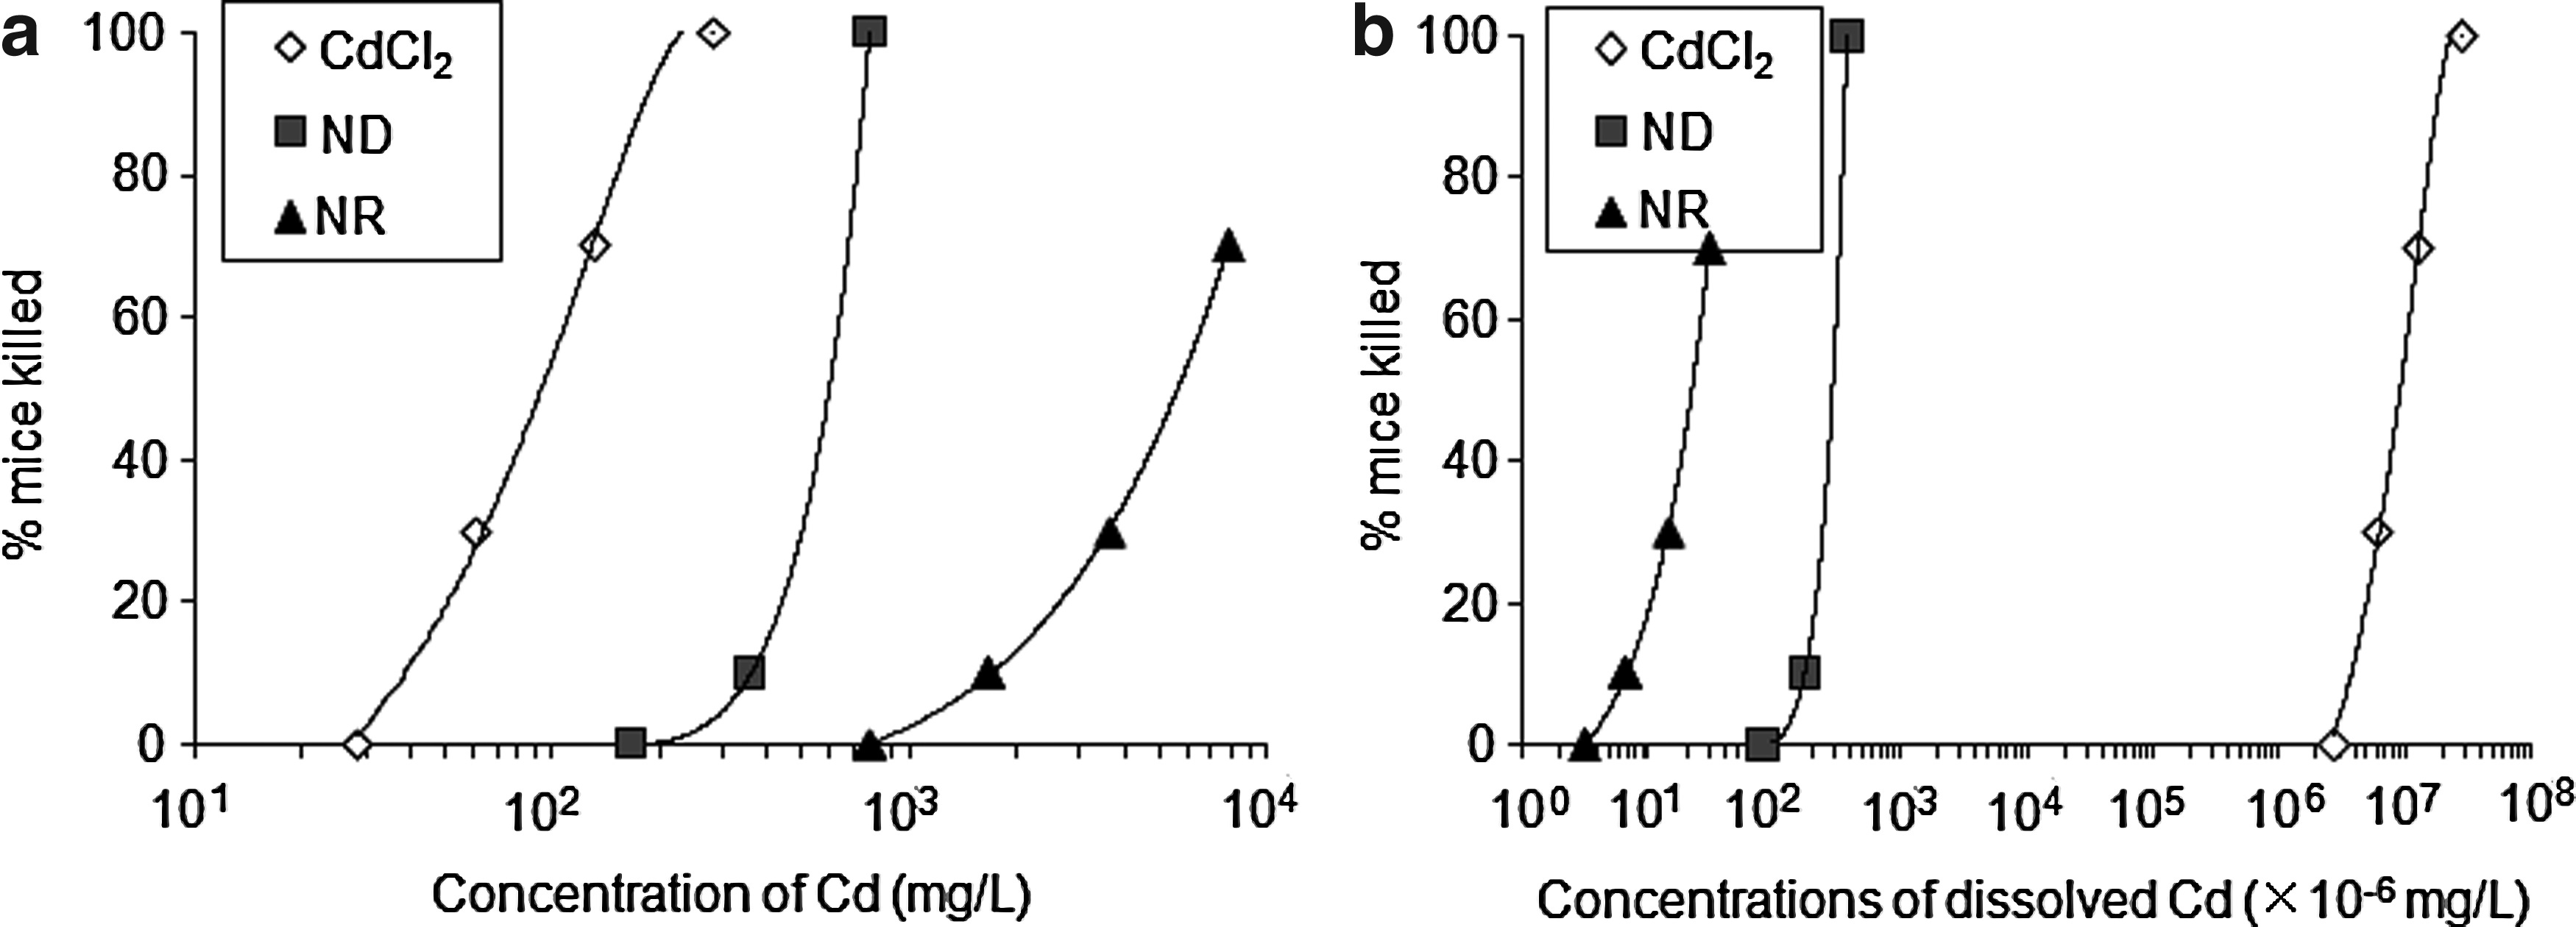
Percentage of mice killed versus
Accumulation of cadmium in target organs
Cd concentrations in all test organs (kidney, liver, and spermary) were generally considerably higher for the mice treated with CdS nanodots than for those treated with equivalent doses of CdS nanorods, but not as high for mice treated with equivalent concentrations of CdCl2 solution (Fig. 4). No accumulation was observed for the control (mice treated with 0.1 mg/L CdCl2). Accumulation in all organs of the mice treated with a low dose (100 mg/kg per day) was about one-half of that for the mice receiving a high dose (200 mg/kg per day; Fig. 4a,c), indicating a relatively linear relationship between dose and accumulation. The relative concentrations of Cd in the three target organs changed over time. For example, accumulation in the liver decreased from day 18 to day 35 (Fig. 4b,d), suggesting excretion. For a given nanoparticle type, the accumulation rate differed among different organs as previously reported (Hauck et al., 2010).
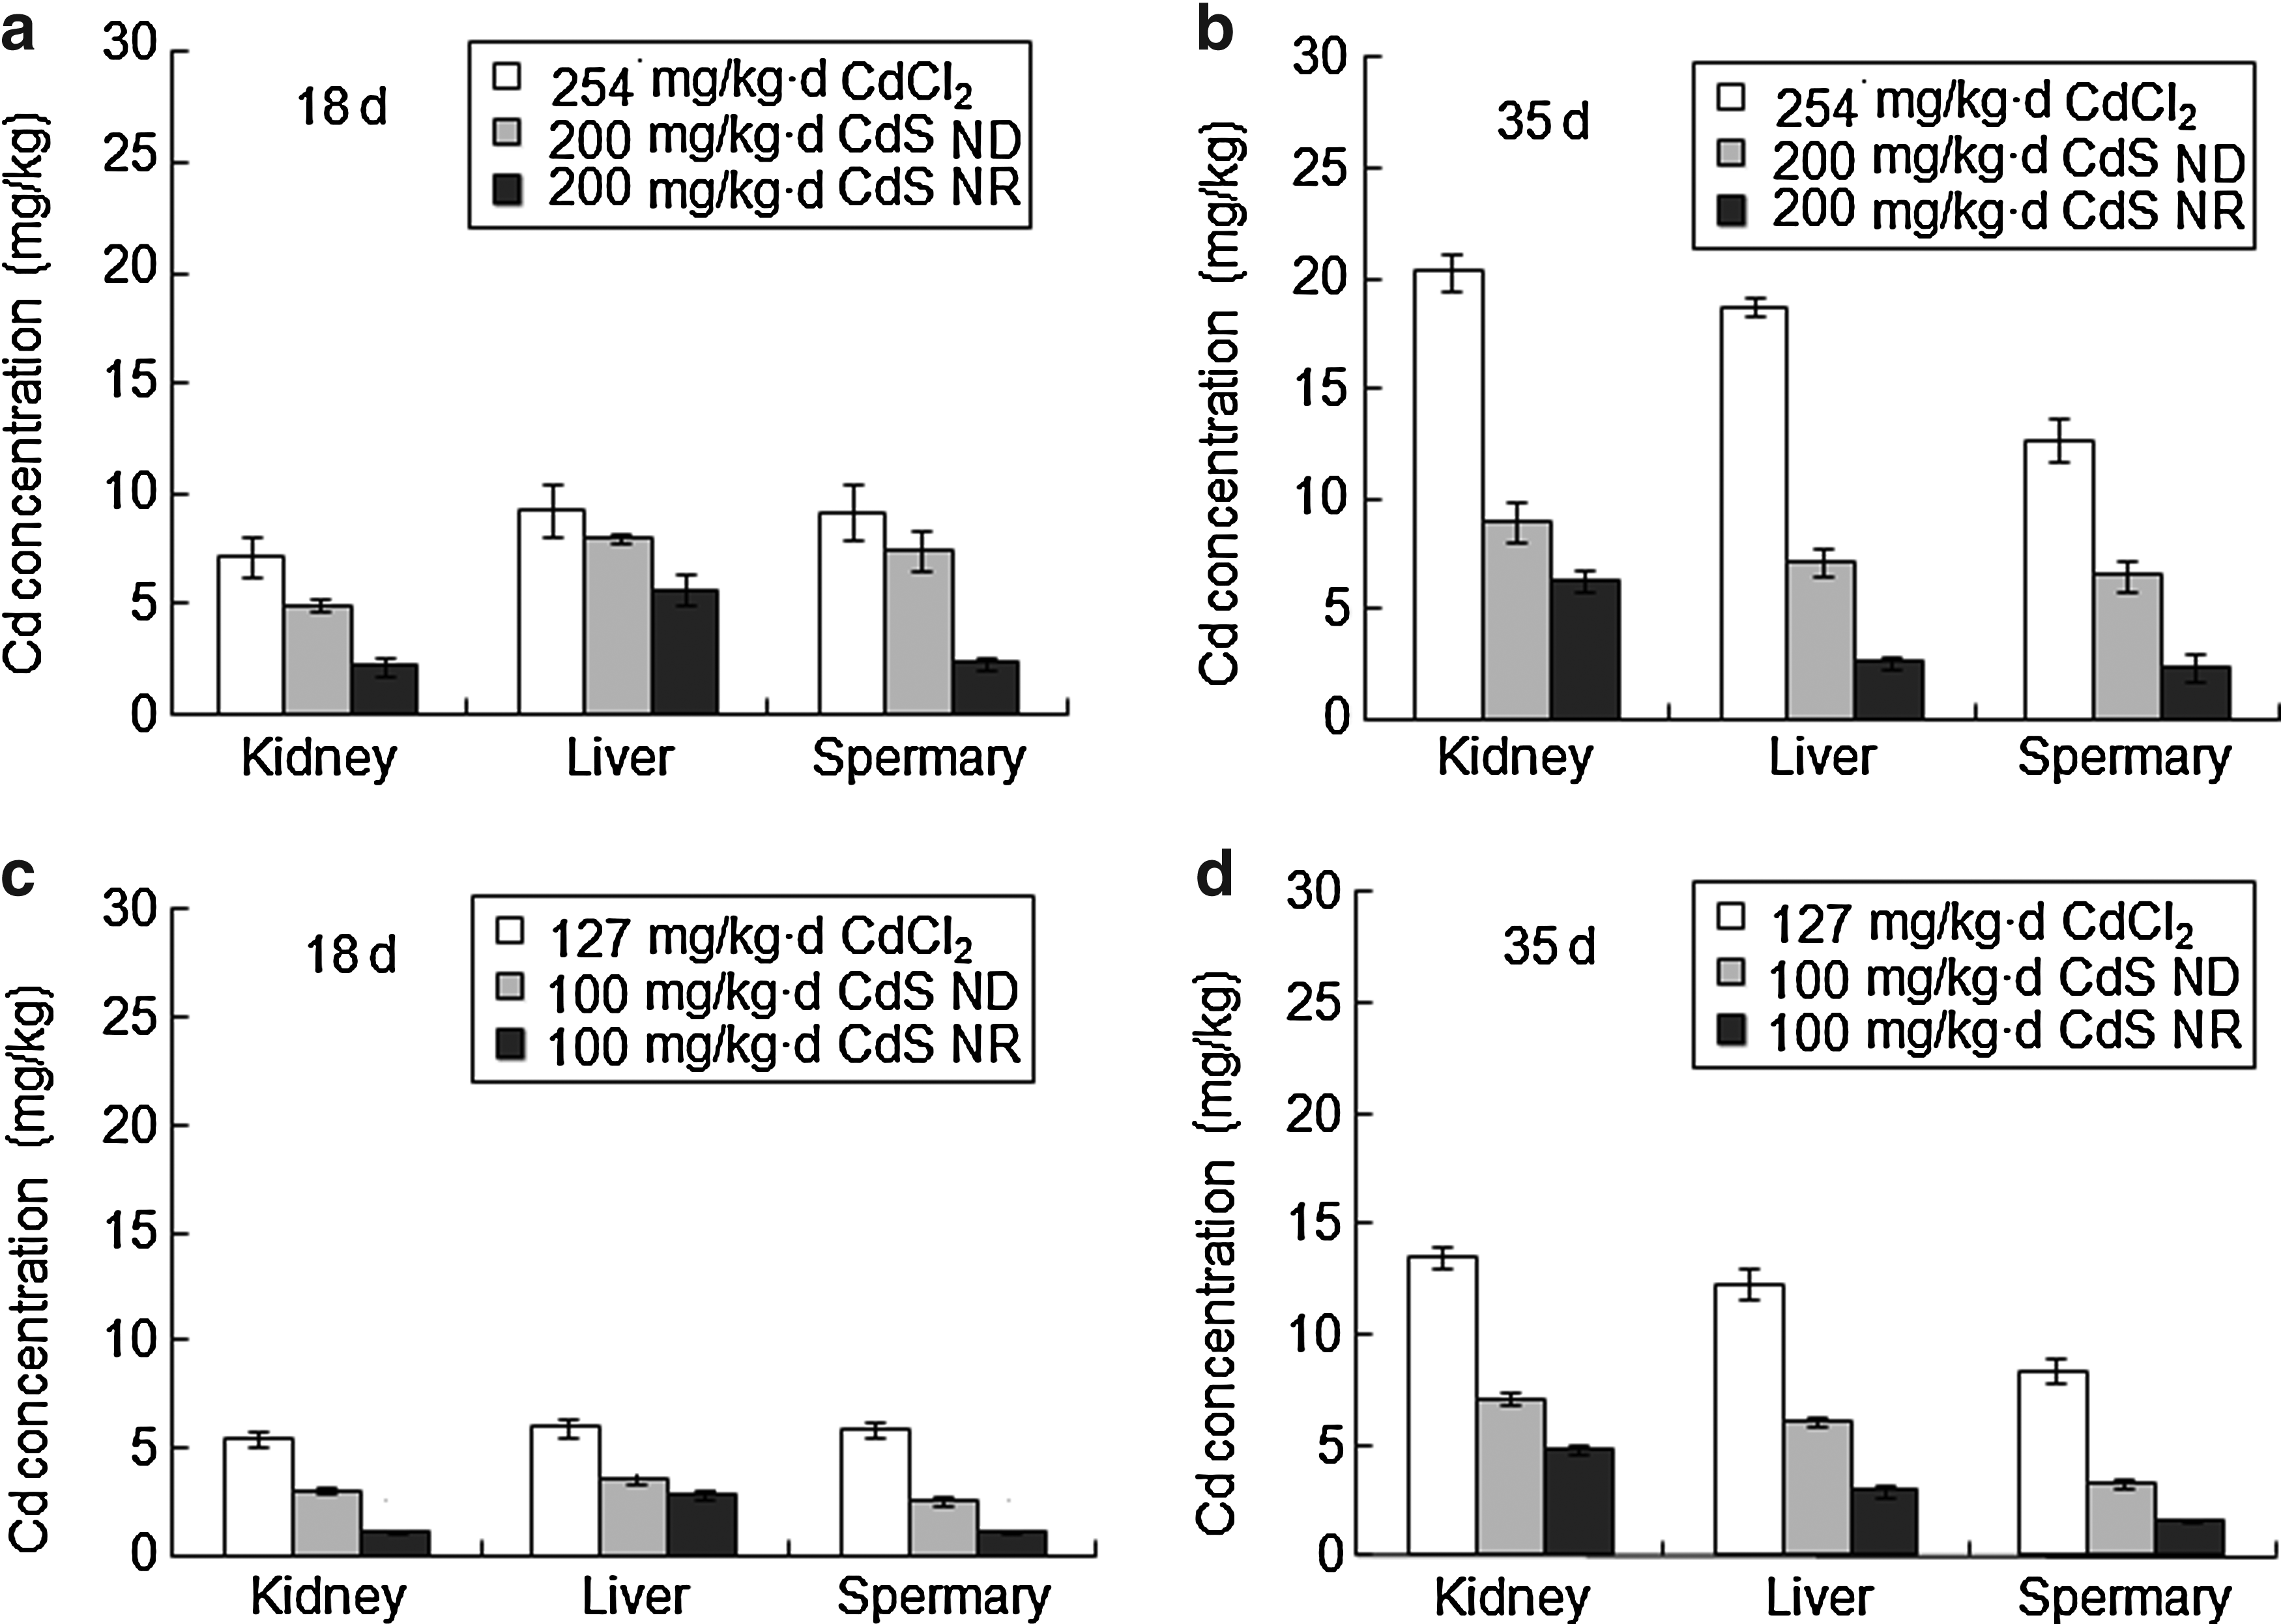
Accumulation of Cd in target organs: mice treated for 18
Even though the highest total Cd accumulation was observed in mice treated with CdCl2 solution, the differences in accumulation between different treatments were relatively small (accumulation in mice treated with CdCl2 was 1.1 to 2.5 times greater than in mice gavaged with CdS nanodots, and 1.6 to 7.3 times greater than in mice gavaged with CdS nanorods), considering that (unlike the CdCl2 treatment) only a small fraction of CdS nanodots and nanorods was present as dissolved Cd2+ during exposure. Moreover, differences in Cd accumulation between mice gavaged with CdS nanodots and nanorods were rather small compared with the large differences in their Cd2+ release patterns. Thus, the differences in total Cd bioaccumulation between the two types of nanopaticles cannot be explained solely based on differences in their capability to release Cd2+ ions.
Genotoxicity of CdS nanodots and nanorods
The genotoxic effects of CdS nanodots and nanorods were examined with single-cell gel electrophoresis (comet assay; Table 1). Damage to DNA, as indicated by the significance of tailing of lymphocytes, showed that genotoxicity was greater for mice treated with CdCl2 solution, followed by mice treated with CdS nanodots and then mice treated with CdS nanorods. The percentage of tailing for the normal lymphocytes was only 0.28%±0.13% (Table 1), compared with 37%±6% (with a tail length of 6.2±0.2 μm) for the mice treated with CdS nanorods, 48%±8% (with tail length of 19.0±0.0 μm) for the mice treated with CdS nanodots, and 55%±10% for the mice treated with CdCl2 solution. These data corroborate the small differences in effects observed between the mice treated with CdS nanodots and those treated with nanorods, reinforcing the inference that the dissolution potential of CdS nanomaterials in the exposure medium was not the most critical factor for controlling toxicity.
To further evaluate the differences in genotoxicity between CdS nanodots and nanorods, we examined the spermary damnification of the mice (Table 2; Supplementary Fig. S1). Compared with the control group, an obvious decrease in the number of spermatozoa was observed for mice gavaged with CdS nanorods or CdS nanodots. The sperm quantity and quality of the spermatozoa also varied significantly among different samples (Table 2; Supplementary Fig. S1.). Spermatozoon abnormality for the control group was 0.15%±0.11%, compared with 0.89%±0.52% for the mice treated with CdS nanorods and with 2.3%±0.9% for the mice treated with CdS nanodots. More profound effects were observed for normal spermatozoa, which decreased from 97.0%±3.0% for the control to 77.0%±8.0% for CdS nanorods and to 1.8%±3.3% for the mice treated with CdS nanodots.
Kidney and liver damage
Compared with the normal renal histopathology image of the control group (Fig. 5a), mice gavaged with CdS nanorods (Fig. 5b) retained glomerulars integrity, but renal interstitial engorgement and edema appeared and leucocytes became more abundant. The histopathology image of the mice gavaged with CdS nanodots (Fig. 5c) showed slight glomerular damage, which is conducive to inflammation and injury of the renal tissues. For the mice gavaged with CdCl2 (Fig. 5d), the glomerulars were significantly damaged and many lymphocygtes were observed. Cd-induced damage was irreversible even after exposure ended. These results corroborate that CdS nanorods were less toxic than CdS nanodots.
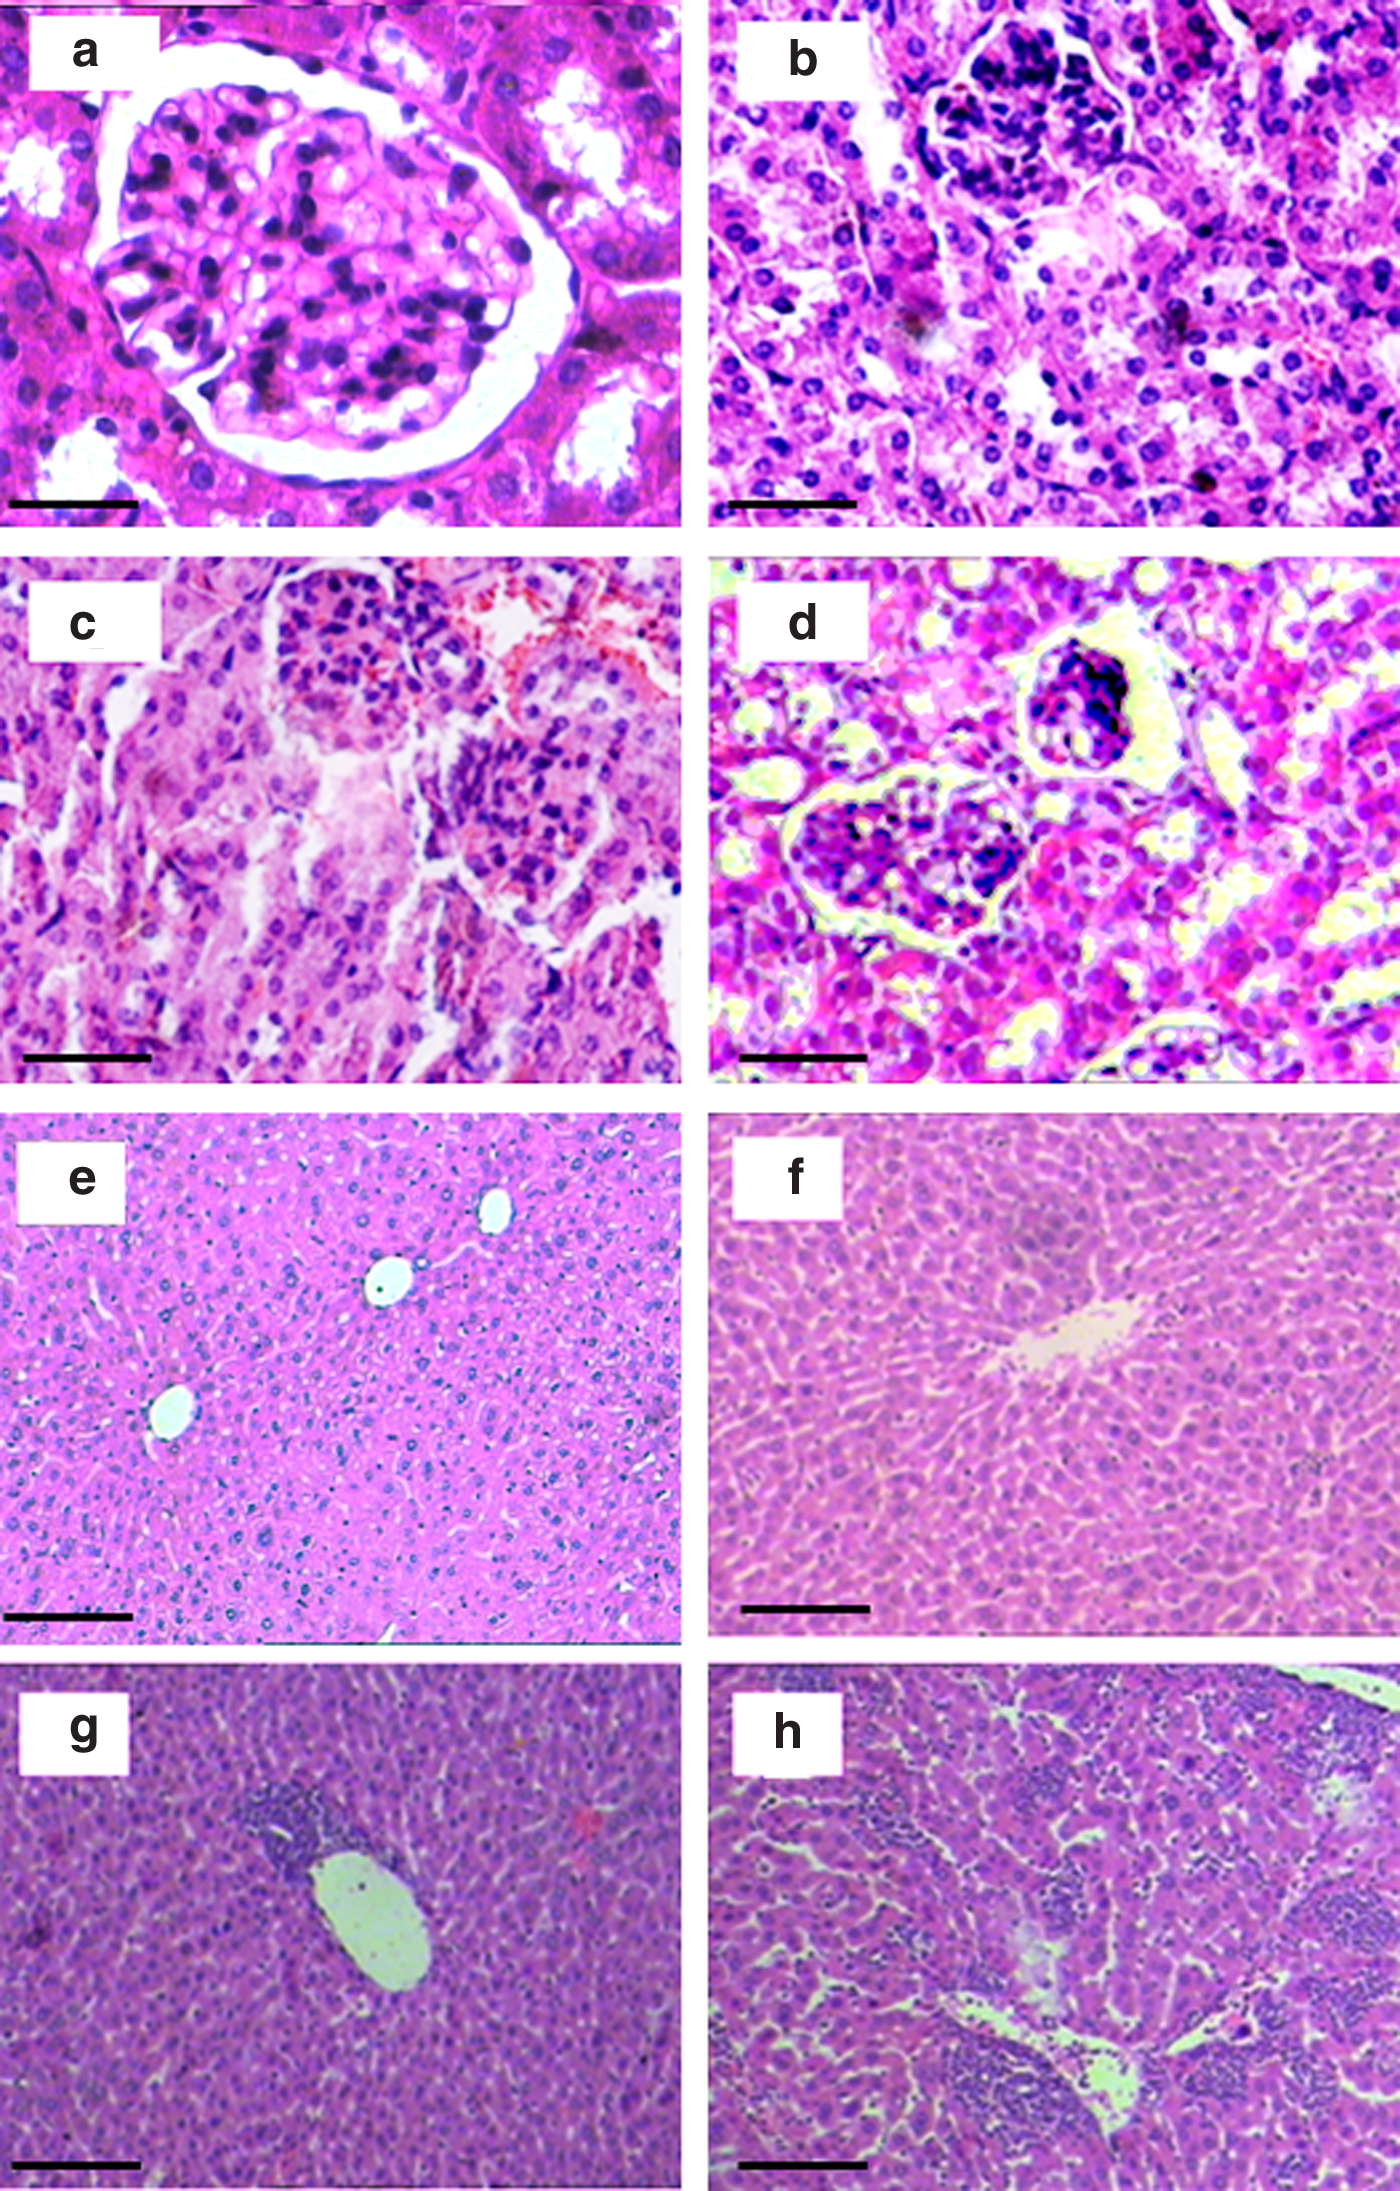
Histological sections of mice renal
A similar trend was observed for effects on the liver. Normal liver cells (Fig. 5e) were radioactively aligned around lobule central vein and had polygon shapes, and liver sinusoidal exited among hepatic cords. For the mice gavaged with CdS nanorods (Fig. 5f), a few inflammatory cells appeared around the lobule central vein; the hepatic cords showed radioactive and regular arrangement; and only a small quantity of liver cells were edemas. In contrast, many inflammatory cells were observed around the lobule central vein for mice treated with CdCl2 (Fig. 5h) or CdS nanodots (Fig. 5g). These treatments also resulted in hepatic and hepatocelluar vacuolation or steatosis in liver cells. Thus, CdS nanorods caused less liver damage than CdS nanodots.
Oxidative stress
SOD and MDA data were obtained to evaluate oxidative stress (Fig. 6). Similar to other toxicity indicators discussed earlier, both SOD and MDA levels indicated a greater effect for the mice gavaged with CdCl2 solution, followed by the mice gavaged with CdS nanodots and then the mice gavaged with CdS nanorods. The increased SOD and MDA levels in the blood serum were likely caused by excess ROS production, and implicated oxidative stress as a cause of the observed damage to kidney and liver tissues and spermatozoon abnormality as observed in other studies (Bai et al., 2010; Haque et al., 2013). This suggests that valuable fundamental insights could be provided by immunotoxicology studies which consider organismal response as a function of particle morphology, including size, shape, and extent of aggregation.
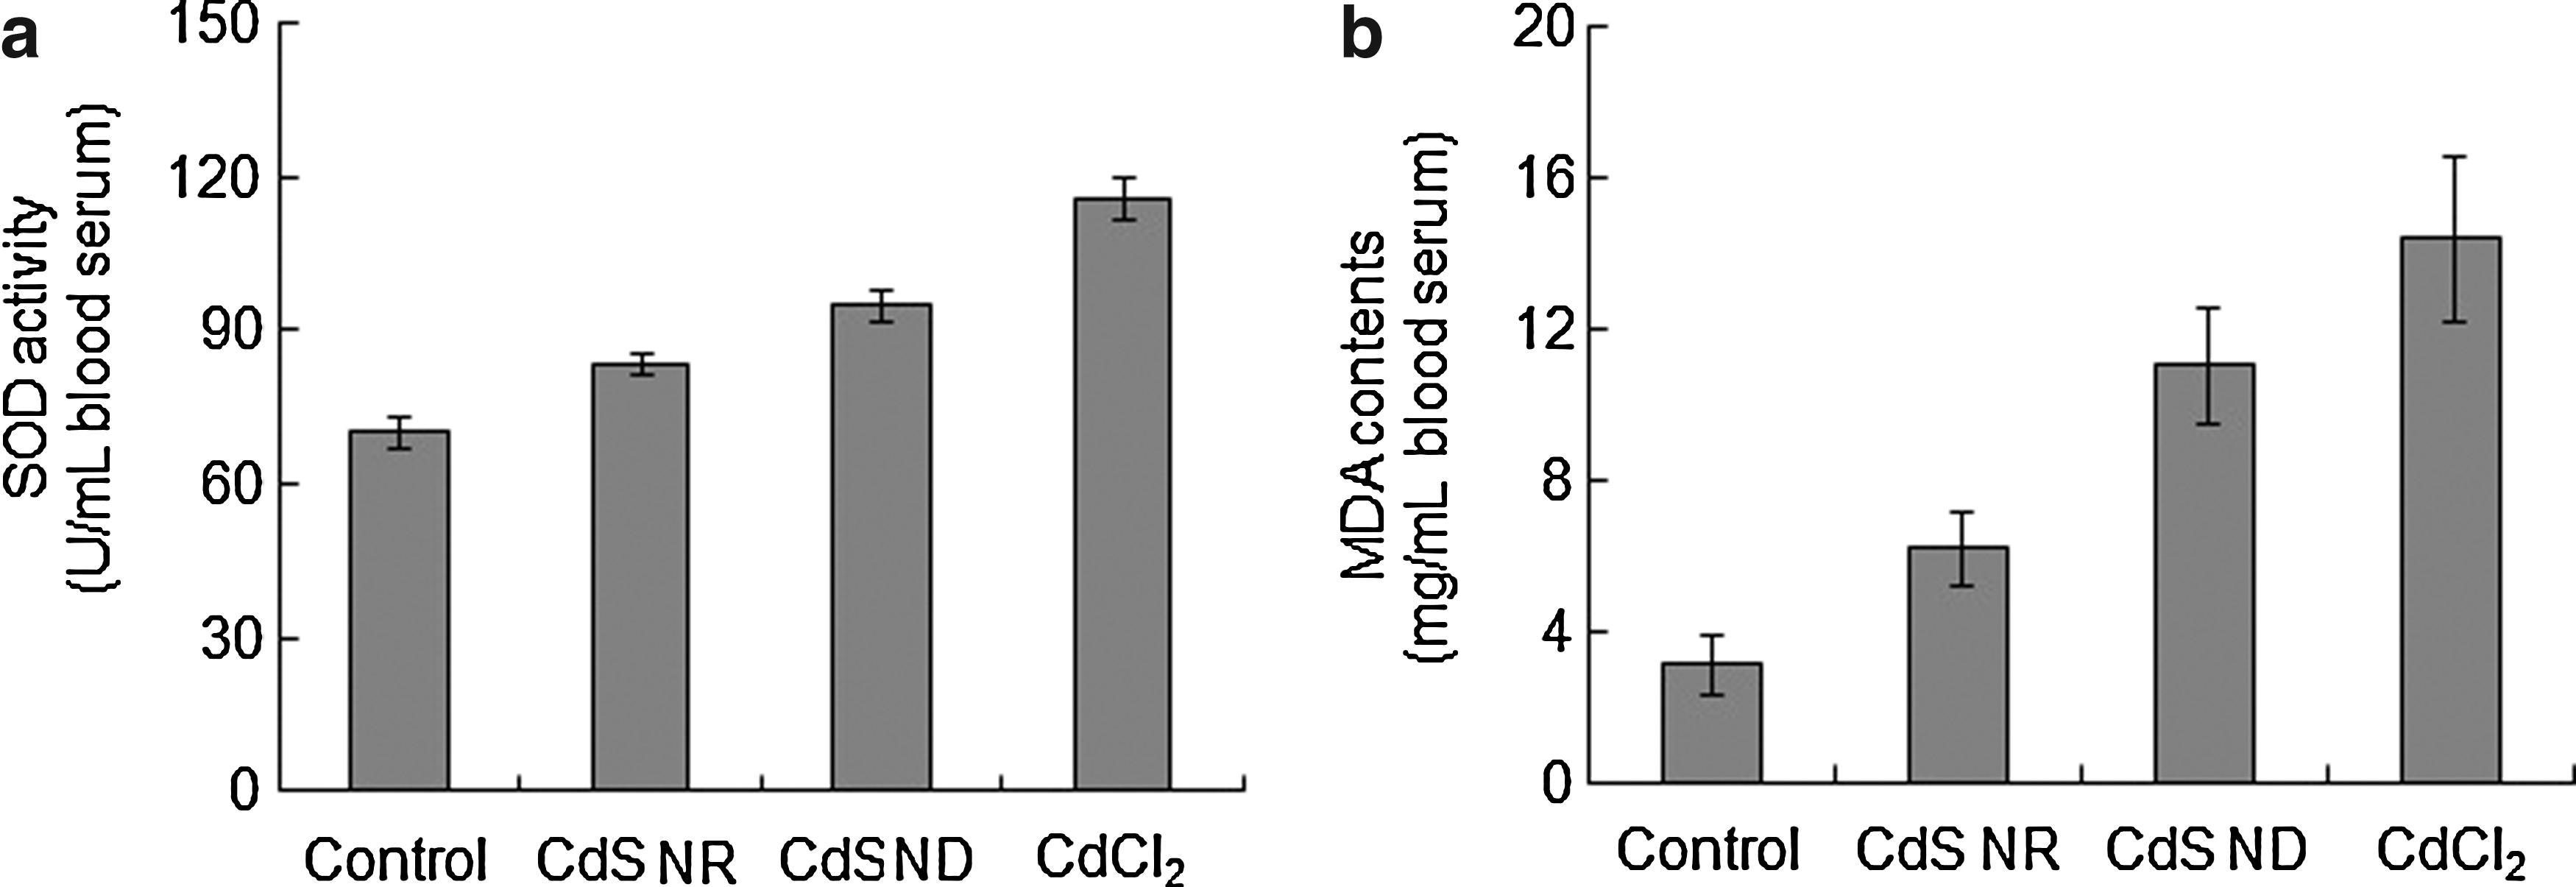
Oxidative stress exerted by CdS nanomaterials in blood serum. Effects of different treatments for 16 days on:
Conclusions
CdS nanodots and CdS nanorods exhibited markedly different Cd bioaccumulation, genotoxicity, and cytotoxicity in mice that cannot be fully explained by the differences in their Cd2+-release patterns. The mechanisms and factors controlling bioaccumulation and toxicity of metallic nanomaterials are rather complex [e.g., released ions can be bound by common ligands that decrease their availability while remaining in solution (Xiu et al., 2012)], and their toxicity cannot be predicted based solely on their elemental composition. Particle morphology (including size, shape, and extent of aggregation) should also be considered. This study also underscores the importance of averting unintended releases to the environment and the need for further research on how environmental and in vivo transformations (and associated matrix effects) affect metal speciation and the resulting biological interactions.
Footnotes
Acknowledgments
This work was supported by the Ministry of Science and Technology of China (Grant 2014CB932001), the Tianjin Municipal Science and Technology Commission (Grant 12HZGJHZ01100), and the China–U.S. Center for Environmental Remediation and Sustainable Development.
Author Disclosure Statement
No competing financial interests exist.
References
Supplementary Material
Please find the following supplemental material available below.
For Open Access articles published under a Creative Commons License, all supplemental material carries the same license as the article it is associated with.
For non-Open Access articles published, all supplemental material carries a non-exclusive license, and permission requests for re-use of supplemental material or any part of supplemental material shall be sent directly to the copyright owner as specified in the copyright notice associated with the article.