
Abstract
Abstract
In this study, we present a method for determining the relative affinity of nanoparticles (NPs) for an ensemble of other particles in a complex, heterogeneous suspension. We evaluated this method for NPs heteroaggregating with suspended solids present in activated sludge. A relationship was derived between the heterogeneous affinity coefficient, α, and measurements over time of the distribution coefficient, γ, of NPs measured in supernatant versus those removed by heteroaggregation and subsequent settling. Application of this method, which uses a mathematical relationship to determine α from experimentally measured γ values, to a series of metal and metal oxide NPs heteroaggregated with activated sludge indicated a relative affinity in the order of pristine CeO2, TiO2 NPs, and ZnO NPs>Ag(0) NPs surface-modified with polyvinylpyrrolidone (PVP)>citrate-functionalized CeO2 NP>Ag(0) NPs surface-modified with gum arabic. This trend in relative affinity followed the observed trend in removal such that higher affinity corresponded to higher removals of NPs. Values of α were calculated from measured relative affinities using average diameter and concentration of the activated sludge particles. The value calculated for PVP-stabilized Ag(0) NPs was comparable to a value previously reported for the attachment of these same NPs to a biofilm. Calculations also yielded size dependence of α in the case of the two Ag(0) evaluated that may be linked to NP dissolution.
Introduction
G
It has been previously proposed that processes controlling NP transport and attachment to environmentally relevant surfaces can be used as the basis for a functional assay (Lecoanet et al., 2004). Aggregation and deposition are analogous processes involving particle–particle or particle–surface interactions occurring in sequential steps of transport and attachment. Physical-chemical processes controlling NP attachment or “affinity” for abiotic or biotic surfaces such as bacteria, algae, clays, and the tissues of higher organisms will play a key role in determining whether NPs associate with larger “background” particles that accumulate in sediments, whether NPs adhere to gills or skin, or whether they stick to media in ground water aquifers. Such processes of heteroaggregation and deposition are, therefore, likely to impact transport, bioavailability, and bio-uptake of NPs (Lin et al., 2011). Measurement of surface affinity may, therefore, provide a means for predicting important dimensions of the environmental behavior of NPs.
Many NPs used in consumer products will be modified by surface functionalization that is designed to impede aggregation through charge or steric stabilization (Napper and Netschey, 1971). Stabilization of colloids can enhance transport in environmental media due to decreased removal, which is typically achieved via aggregation processes (Espinasse et al., 2007; Chen et al., 2008). Environmental conditions such as ionic strength, presence of naturally occurring macromolecules, redox conditions, and pH of media will further influence or modify the affinity of NPs for each other and for other surfaces (Lin et al., 2012).
The attachment efficiency (α) describes the likelihood of attachment for each collision between two surfaces. The surface affinity between NPs in homoaggregation can be estimated by normalizing the aggregation rate in a given system to the rate of aggregation observed when chemical conditions favor the process (where α is assumed to be unity) such as when stability is due to particle charge and salt concentrations that are above the critical coagulation concentration. These rates of aggregation are determined from the slope of the linear zone of the plot of changing hydrodynamic radius as a function of time (Petosa et al., 2010). As an example, when using analytical techniques to monitor hydrodynamic radius, αhomo can be calculated using the slope of the rate of changing radius shown in Equation (1):
where rh is the hydrodynamic radius, C0 is the initial concentration, and fav denotes the aggregation reaction under favorable conditions. This method is, however, limited to the determination of attachment efficiency in homoaggregation alone and requires advanced instrumentation.
NP deposition in a porous medium of spheres of known composition can be used to obtain information on the affinity coefficient between NPs and a model reference surface such as glass beads. Removal of NPs across the column containing a packed bed of the reference porous medium “collectors” (after the first two to three pore volumes have been eluted) is related to the affinity coefficient, αhetero as
where dc is the diameter of the collectors, ɛ is the porosity of the packed bed, L is the length of the column, C and C0 are the concentration of the particles in the effluent and influent, respectively, and η0 is the single collector efficiency that describes particle transport and can be calculated from theory. In addition to limitations on the type of surfaces that can be represented as spherical collectors, this method requires equipment providing for accurate flow control, injection, and sample collection.
Environmentally relevant systems will often present a heterogeneous ensemble of surfaces of complex geometries that render traditional experimental determination of the attachment efficiency challenging. In this work, we present a method for obtaining estimates of the overall affinity of NPs for surfaces in such systems that is both experimentally simple and easily interpreted in a theoretical context.
Concept
Theory
Due to their small size, the settling rate of individual NPs is negligible. Homo- or heteroaggregation can produce objects that are sufficiently large to settle from suspension over time scales of seconds to days. In systems in which NPs are present in small concentrations, typical of those predicted from production estimates of NPs [e.g., (Gottschalk and Nowack, 2011; Hendren et al., 2011)], particle collisions in a suspension will likely be dominated by heteroaggregation with larger “background” particles (clays, bacteria, etc.). Settling of the resulting aggregates (and further aggregation during settling) will, therefore, result in the removal of many of the products of heteroaggregation. The distribution of NPs between those that are not associated with background particles (not heteroaggregated) and those which have heteroaggregated at any time is an instantaneous picture of the extent of heteroaggregation that has occurred. If settling is assumed to remove the majority of heteroaggregates from the suspension, then the distribution coefficient, γ, can be approximated as the distribution of NPs between the suspended and settled (heteroaggregated) compartments. This distribution coefficient would ideally be taken as the ratio of measurement of mass or number of NPs per mass of solids that have settled from suspension to the mass or number concentration of NPs remaining in suspension at any time:
where MS is the mass of the NP associated with the settled material, MB is the mass of the background particles removed by settling, and CL is the concentration of the NPs that remains in the supernatant (complete parameter list in Supplementary Table S1). Thus, γ has units of m3/kg. In practice, if the concentrations of particles native to a given system (background particles) and NPs are followed over time, γ at any time during heteroaggregation can be calculated from measurements of the supernatant alone, calculating the amounts removed with the settled heteroaggregates by difference from the initial amounts present.
Let us consider the products of heteroaggregation, before settling occurs, as representing a balance between the forward reaction of heteroaggregation and a reverse break-up reaction that returns particles which have previously aggregated to a state of free suspension due to erosion or fracturing. Modifying the Smoluchowski equation (von Smoluchowski, 1917), the forward reaction is described by the product of the second-order collision rate constant, β, the concentration of un-heteroaggegated NPs, n, the concentration of background particles, B (which remains constant), and the affinity coefficient between nano- and background particles, α. The reverse reaction, (breakup of larger aggregates into the primary particle sizes) can be assumed to be proportional (by the rate constant kB, constant of breakup) to the number of NPs that have heteroaggregated (n0 − n), such that
The collision rate constant, β(n, B), is the sum of transport interactions induced by Brownian motion, differential settling, and shear, and varies as a function of the diameters of nano- and background particles, mixing conditions, temperature, fluid viscosity, and particle densities. If the forward and reverse reactions come to a steady state and all of the background particles (including the heteroaggregation products) are removed from suspension without disturbing the remaining un-aggregated NPs, measurement of the distribution coefficient γ would be expected to yield a value equal to the ratio of the forward and reverse reaction rate constants:
where CB is the mass concentration of background particles (number concentration, B, multiplied by the mass of a single background particle). In other words, at a steady state, the distribution coefficient should be proportional to the affinity coefficient by a factor
The time-variable solution to Equation (4) yields
Subtracting n from n0 and dividing by n×CB yields an expression for the instantaneous distribution coefficient, γ(t):
During the early stages of heteroaggregation, breakup can be assumed to be negligible, and Equation (7) can be simplified and rearranged to yield the following method for relating the affinity coefficient and γ(t) during early time periods:
Thus, from the experimentally determined γ(t) values and knowledge of the concentration of the background particles, a plot of
By performing experiments in which a known quantity of NPs is introduced to a suspension of background particles, and enabling heteroaggregation to proceed with mixing for a series of programmed times, values for the instantaneous distribution coefficient can be calculated by measuring the NPs remaining in solution after mixing is halted and background particles are allowed to settle from the suspension. Plotting the resulting data versus heteroaggregation (mixing) time as described by Equation (8) enables the calculation of the relative affinity of NPs for the background particles. Absolute values of α can be obtained by dividing the value of the slope by the mass concentration of the background particles and a calculated collision frequency. Alternatively, the product βB for a given system (background particles, mixing conditions, etc.) can be obtained by altering the chemical conditions (such as ionic strength) to favor aggregation analogous to Equation (1):
or by calibrating the system to a known value of αhetero determined, for example, from column experiments.
Computational verification
Equation (4) and the subsequent solution presented earlier approximate the heteroaggregating suspension as consisting of only two particles classes, monodisperse NPs and background particles. A more complete description of heteroaggregation accounts for all possible combinations of NP and background particle aggregates and must be solved numerically. This more precise description of heteroaggregation was coded in Matlab (Matlab R2010a, the MathWorks, Inc., Natick, MA) and is expressed as a system of m differential equations, each of which describes the change in number concentration of particle aggregates in one size class k, such that k=1 to m. If NPs of radius rNP occupy the smallest size class (the subscript NP indicating k=1), the rate of change in the number concentration of NPs, nNP (assuming no breakup), is equal to the rate at which they aggregate with themselves and with particles in all other size classes, such that
where nk is the number concentration of size k aggregates, β (rNP, rk, fSk) is the collision rate kernel describing the rate at which an NP comes in contact with a particle or aggregate in size class k accounting for porosity of the aggregates based on their fractal dimension (Wiesner, 1992), and αk is the attachment efficiency between an NP and a size k aggregate with an average fraction of NPs fSk on its surface. In these simulations, attachment efficiencies between size classes evolve as a function of fSk in each size class, modifying the initial affinity coefficient between nano- and background particles, αBN as the average surface of background particles is modified by the heteroaggregated NPs. For k>1, the remaining m−1 differential equations include a term describing gains in aggregate number concentration due to aggregation from smaller-sized classes, as well as the losses to larger-sized classes such as those shown for NPs in Equation (10).
Numerical solution of the system of m differential equations over time yields an aggregation between NPs and an evolving distribution of background particles and aggregates distributed through these m size classes. These simulations were performed to test the validity of the approximating the heteroaggregation process as occurring between just two size classes as described by Equation (4). The simulation parameters covered ranges similar to those of the experimental measurements described further, with a fixed initial concentration of background particles (CB=4 g/L), initial concentrations of NPs of 10 and 50 mg/L, initial background particle diameters ranging from 2 to 15 μm, initial NP diameters ranging from 5 to 20 nm, and attachment efficiencies between background particles and NP ranging from 0.001 to 1. By varying simulation time for heteroaggregation and following the total amount of NPs associated with background particles over time, simulated values of γ(t) were generated. The results of these simulations confirm the linear relationship between

Confirmation of linearity as described by Equation (10) (two particle-sized classes) using numerical simulations of heteroaggregation for systems of many interacting particle-sized classes.
Experimental
Materials
Metal and metal-oxide NPs with core compositions of Ag, CeO2, ZnO, and TiO2 were employed in this study due to their prevalence in consumer products and technologies and their likelihood of release to the wastewaters (Blaser et al., 2008). Table 1 indicates the NPs used and the associated characteristics, including size and coating. All of the nano-Ag particles used were synthesized in-house at the Center for the Environmental Implication of Nanotechnology (CEINT; Duke University, Durham, NC) and differed in size and surface functionalization. Pristine CeO2 NPs were provided by Rhodia (LIONS, Saclay, France), while the citrate-functionalized CeO2 was purchased from Byk Additives (Altana, Wesel, Germany). The ZnO NPs (Nanosun P99/30) were donated by Micronisers (Dandenong, Australia), and the TiO2 NPs were purchased from Evonik Industries (Essen, Germany); neither possessed surface macromolecule functionalizations. All the dispersions were made in nanopure water with an average pH of 5.6. Zeta potential was measured at 100 mg/L on a Malvern Zeta-Sizer (Malvern Instruments, Malvern, United Kingdom) and is reported in Table 1.
CEINT, Center for the Environmental Implication of Nanotechnology; GA, gum arabic; NP, nanoparticle; PVP, polyvinylpyrrolidone.
Distribution experiments
Time-dependent distribution coefficients (γ) were measured in 25 mL batch experiments. Secondary wastewater sludge was sampled from the activated sludge basin of the Durham County Wastewater Treatment Plant (WWTP) in Durham, NC. The average pH and chemical oxygen demand (as measured by HACH test kits) of the activated sludge were around 7.2 and 350–550 mg/L, respectively. The total suspended solids were ∼3.81 g/L. Sludge was stored at 4°C for less than one week before experimental completion (Hendren et al., 2013). In the batch tests, NPs were added at concentrations of either 10 or 50 mg/L to the activated sludge suspension, and mixing ensued for a programmed period of 0 min to 1 h with data collected at six time points overall. After programmed mixing, the heteroaggregated suspension was gravity separated for ∼30 min. The supernatant was decanted and acidified with 2% HNO3 before analysis on the ICP-OES. The solid concentration was determined via mass balance for most samples and confirmed by solid digestion (United States Environmental Protection Agency, 1994) on a subset of samples. Removal was assessed, and the distribution coefficient was then calculated according to Equation (3).
Results
The removal, r, of NPs from suspension (as measured by initial and final metal concentrations,
Removal differed based on surface functionalization. For example, in the case of CeO2, the citrate surface modification exhibited a lower ζ potential (−17.9±4.5 mV) as prepared in nanopure water at pH 5.6 compared with the pristine NPs (32.2±4.1 mV), thereby increasing the stability of the functionalized NPs. However, it is not clear whether changes in removal (85% vs. 98%) can be directly attributed to changes in the zeta potential, as the complex mixture of solutes present in the wastewater would be expected to alter NP surface charge. Similarly, in the case of PVP- and GA-stabilized Ag NPs of a similar size (6 vs. 8 nm in mean diameter), these two surface treatments imparted different surface charges as well as possibly different steric properties. The ζ potential of 6 nm GA-functionalized Ag was measured at neutral pH to be −38.3±0.9 mV, while the ζ of the 8 nm PVP-Ag NPs was −8.19±0.6 mV. As with the CeO2 NPs, a higher (negative) electrophoretic mobility (from which the ζ is calculated) was associated with less removal to the settled material. These data were in agreement with trends of removal reported by Hendren et al. (2013) in batch studies, where the authors found that PVP-coated NPs were removed to a greater extent compared with GA-Ag NPs. Other researchers have reported high levels of removal of Ag NPs (99%) after 2 h of mixing without any impact of size (Kiser et al., 2010; Kaegi et al., 2011; Kaegi et al., 2013).
From Equation (5) (for any arbitrary time, rather than at a steady state), the relationship between the time variable distribution coefficient (values presented in Supplementary Table S2) and removal after a mixing period t is given by
assuming that all background particles are removed by settling (an assumption that was verified to hold within at least 1%). Distribution coefficients calculated from removal by settling, observed following programmed mixing at various times t and plotted as ln (γCB+1) plotted versus time [or equivalently, ln (rC0/C+1) versus time] yield a trend line with a slope of αβB.
An example of one such plot is shown in Fig. 2 for 50 mg/L of TiO2 and GA-Ag NPs mixed with activated sludge. The linear portion of this plot, consistent with Equation (8), is apparent for mixing times between ∼0 and 10 min. At longer periods of time, the plot reaches a plateau due to an increasing importance of breakup, modifications to heteroaggregate chemistry, or both. This linear range between 0 and 10 min of mixing was observed for all of the NPs investigated with R2 values ranging from 0.85 to 0.98. The values of the slopes are presented in Table 2. The trend in the magnitude of the slope matches the trend in removals after 1 h of mixing.
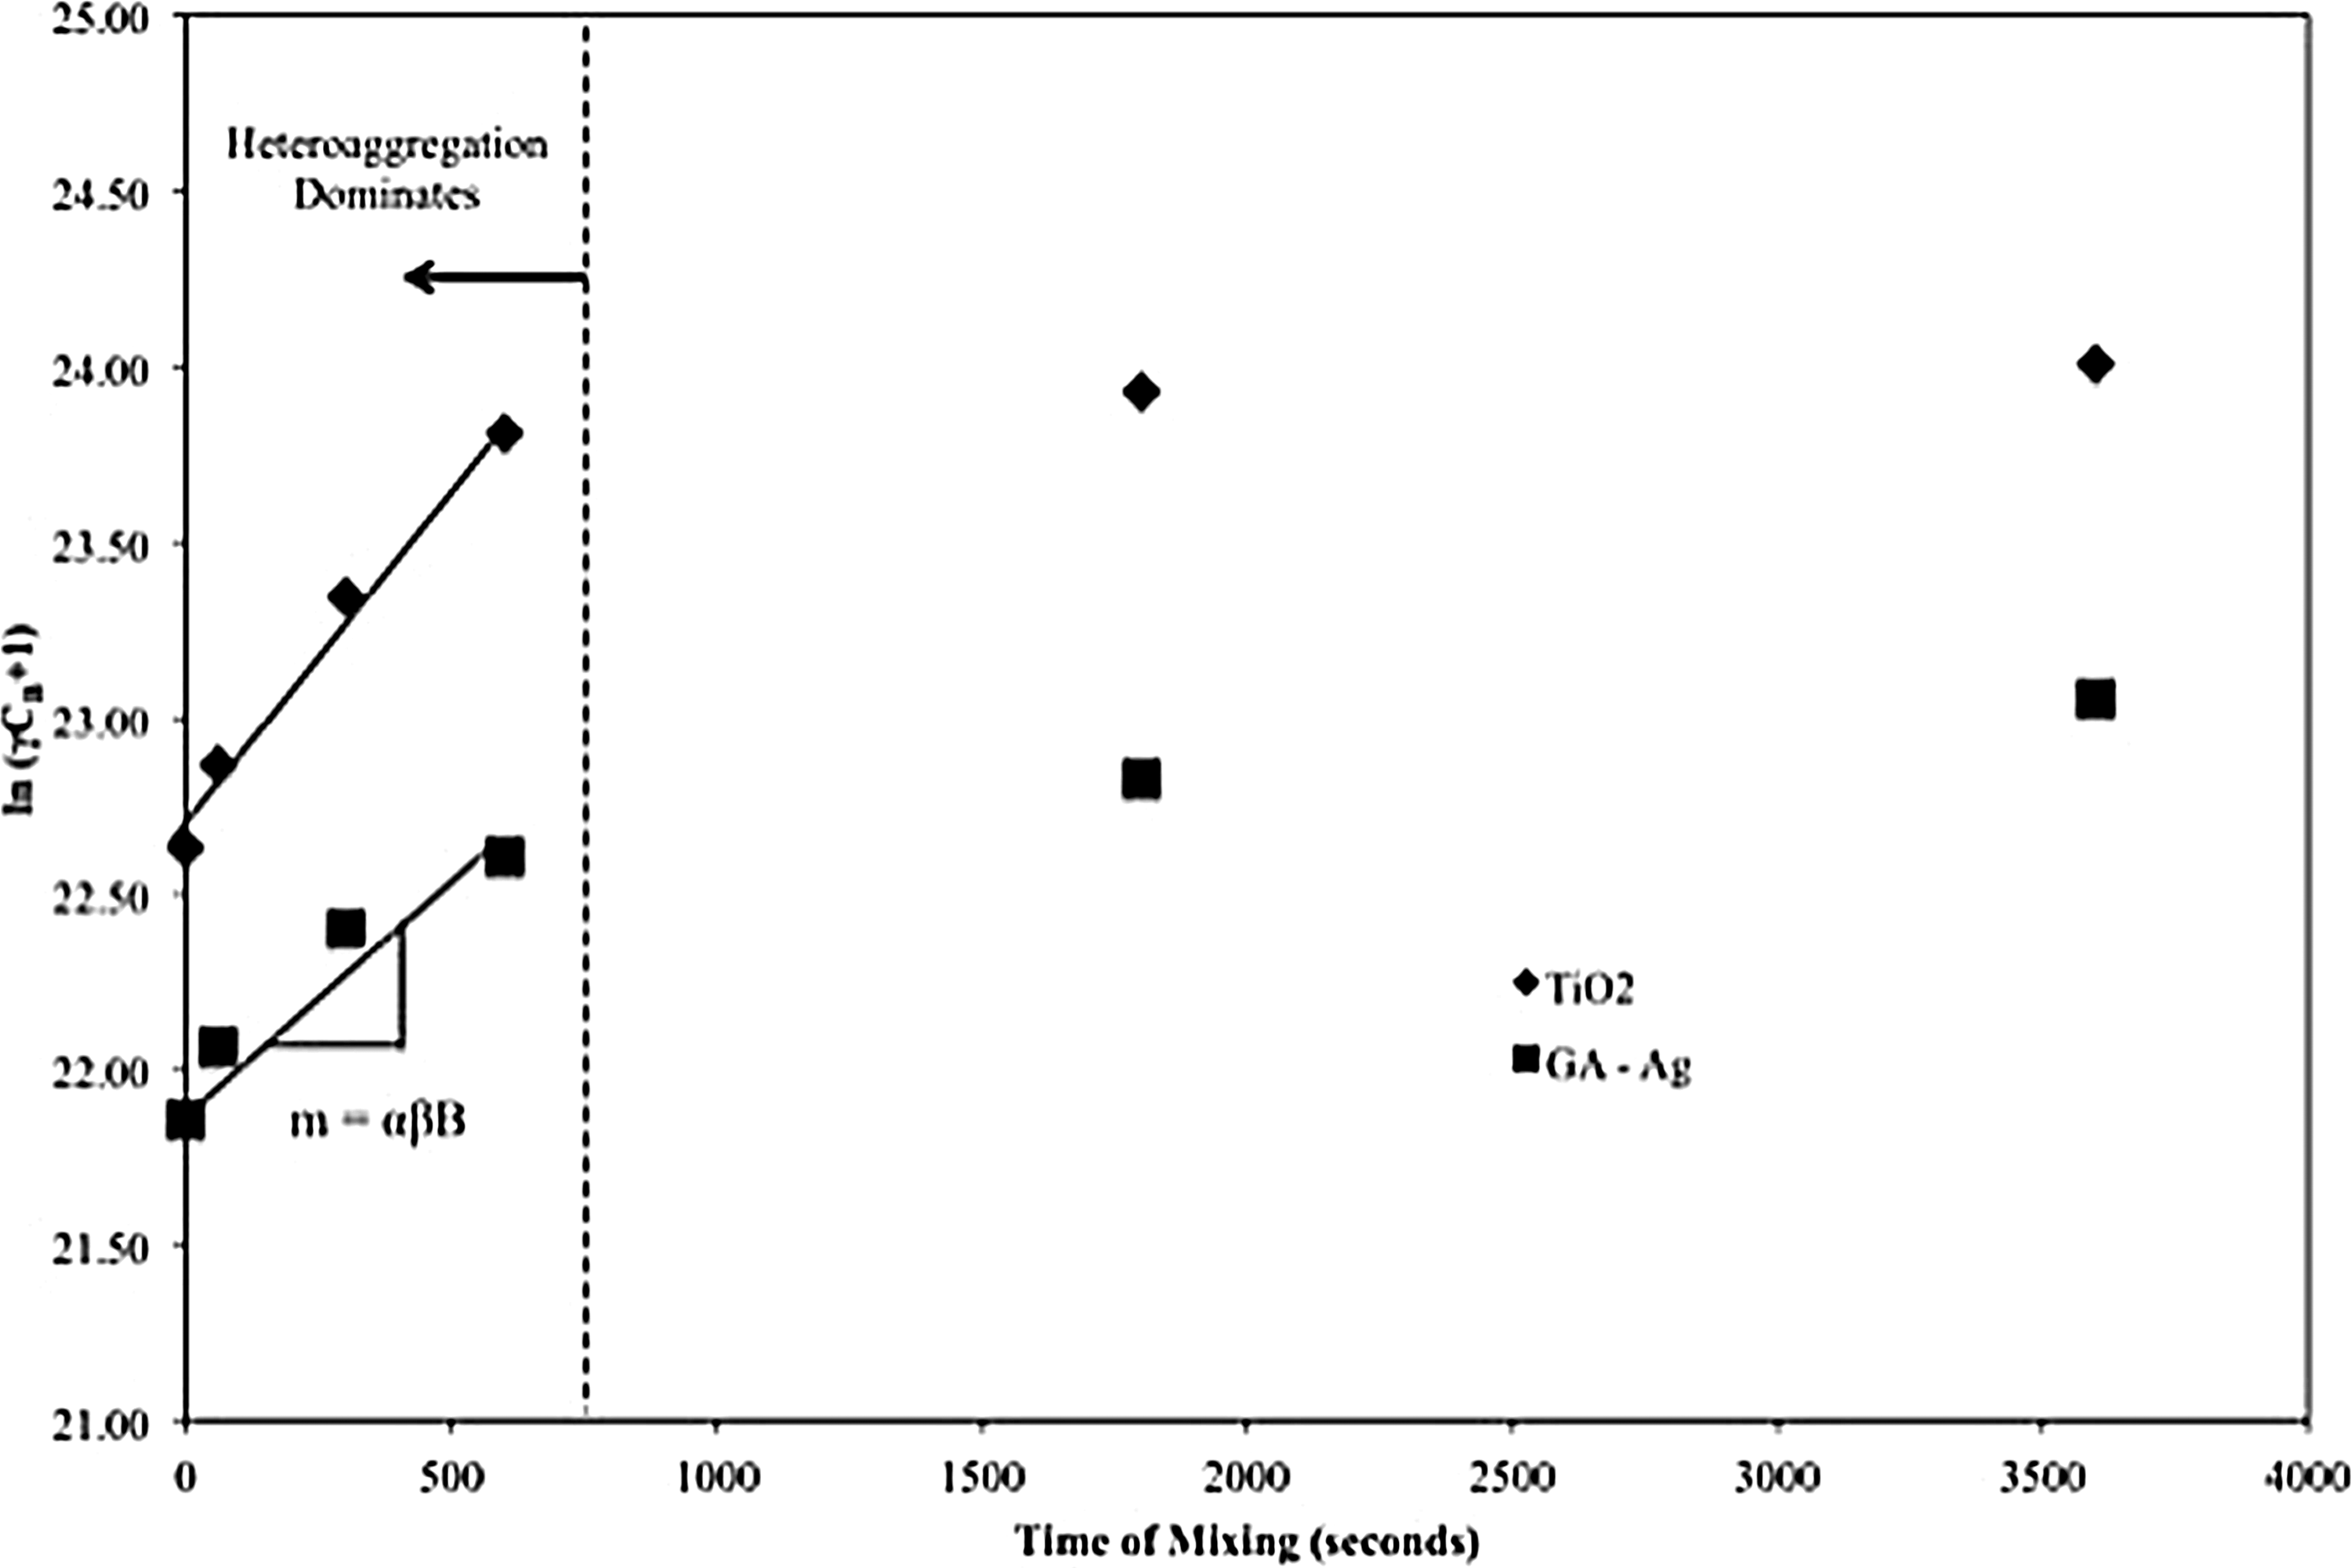
Representative plot for TiO2 and GA-Ag NPs interacting with secondary sludge to illustrate the initial linear behavior that is used to determine αβB. GA, gum arabic; NPs, nanoparticles.
Estimates for the heteroaggregation affinity coefficient, α, for these combinations of NPs and activated sludge were obtained by dividing the measured slope, αβB, by βB, obtained from measurements of the activated sludge (B) and calculated from theory (β). The mass and concentrations of background particles were from measurements of the suspended solid concentration and particle size distribution of the activated sludge. The mass concentration of the sampled wastewater was measured to be ∼4 g/L, and a value for the density of the activated sludge of 1050 kg/m3 was assumed (Sears et al., 2006). The number average diameter of the background particles was determined to be 2.3 μm as obtained from static light scattering measurements (Malvern Mastersizer 3000; Malvern Instruments), which was similar to values reported by others (Snidaro et al., 1997; Schmid et al., 2003).
The collision frequency, β, describes particle collisions resulting from Brownian motion, differential settling, and velocity gradients and was calculated using theory describing these interactions between porous aggregates (Veerapaneni and Wiesner, 1994; Thill et al., 2001). For the calculation of β, a value for the velocity gradient G of 20 s−1 was assumed, and the density of the NPs was assumed to be the density of the metal core (Ag=10,500 kg/m3, Ce=7650 kg/m3, Ti=4230 kg/m3, and Zn=5610 kg/m3). At the beginning of heteroaggregation experiments, there exists a dominant β associated with a single type of interaction, which corresponds to the interaction between an average-sized NP and an average-sized background particle. The experimental conditions for this study inspected the initial, fast stage of heteroaggregation, where changes in β and breakup could be assumed negligible.
Discussion
Trends in calculated estimates of the affinity coefficients, α, were similar to those observed for both the relative affinities (αβB) and settled removal of NPs after 60 min of mixing with 40 nm PVP-Ag>TiO2≈ZnO>pristine CeO2>8 nm PVP-Ag≈citrate-functionalized CeO2≈25 nm GA-Ag>6 nm GA-Ag. The calculation of α was found to be sensitive to the assumed properties of the background particles and the mixing conditions. However, the value of ∼0.01 calculated for the affinity coefficient for the 40 nm PVP Ag NPs by this method is close to the value of α previously reported by Xiao and Wiesner (2013) of 0.01 for a biofilm determined from column studies using the same PVP-functionalized Ag NPs used in this work.
In the case of Ag NPs, where size was also a variable, the data suggested a possible size dependence for α. While the mechanism that accounts for this phenomenon is unknown, we speculate that differences in α with size may be an artifact of silver dissolution. Dissolution kinetics in pure water have been shown to be size controlled such that smaller particles result in increased dissolution of Ag (Ma et al., 2012). If the smaller Ag NPs dissolved to a greater extent, more silver would have remained in the supernatant. Since only total silver was measured (as opposed to particulate and dissolved fractionation), this would give the appearance of less heteroaggregation, and therefore a smaller value for α. Size-dependent changes in surface charge density and complexation of ligands in the wastewater as well as different initial values in the ζ potential may have also played a role. This method enables the determination of a fundamental NP property in wastewater from a time-dependent parameter that dictates removal. Both α and removal are useful for indicating NP behavior in environmental systems.
Summary
A simple method for quantifying the relative affinity of NPs with a complex mixture of larger particles has been shown to yield results that are consistent with theory and with observed trends in NP removal. The method serves as a functional assay for NP behavior in aquatic systems that are sensitive to differences in NP composition, including different surface functionalizations. Improvements to research would be an analysis of the impact of background sludge sampled from different locations due to the high variability of the wastewater matrix. In addition, further application of this work to other NPs and aged samples can provide important information on NP behavior in the environmental matrix of wastewater sludge. Estimates of surface affinity obtained by this method should be useful in predicting heteroaggregation and deposition of NPs and in enabling calculations of NP transport, bioavailability, and bio-uptake.
Footnotes
Acknowledgments
This material is based on work supported by the NSF and the EPA under NSF Cooperative Agreement EF-0830093, CEINT, and Transatlantic Initiative for Nanotechnology and the Environment (TINE) supported by the UK Natural Environment (NE/H013679/1; NE/H01375X/1). Any opinions, findings, conclusions, or recommendations expressed in this material are those of the author(s) and do not necessarily reflect the views of the NSF, or the EPA, or ANR. This work has not been subjected to EPA review, and no official endorsement should be inferred. The authors gratefully acknowledge the CNRS for funding the iCEINT International Consortium for the Environmental Implications of Nanotechnology (GDRi iCEINT) and support by Labex SERENADE (11-LABX-0064).
Author Disclosure Statement
No competing financial interests exist.
References
Supplementary Material
Please find the following supplemental material available below.
For Open Access articles published under a Creative Commons License, all supplemental material carries the same license as the article it is associated with.
For non-Open Access articles published, all supplemental material carries a non-exclusive license, and permission requests for re-use of supplemental material or any part of supplemental material shall be sent directly to the copyright owner as specified in the copyright notice associated with the article.