
Abstract
Abstract
Conventional titanium dioxide (TiO2) materials can be activated only by ultraviolet (UV) light, which is only 4–5% of the whole solar spectrum. As a result, visible light (vis)–active TiO2-based photocatalysts have recently received significant attention in the field of TiO2 photocatalytic treatment and purification of water and air. This study reports the preparation of UV-visible light–active phosphorous (P)-doped, fluorine (F)-doped, and PF–co-doped anatase TiO2 nanoparticles via an innovative sol-gel method. Prepared nanoparticles were characterized by UV-vis diffuse reflectance spectroscopy, X-ray diffraction analysis, Raman spectroscopy, high-resolution transmission electron microscopy, X-ray photoelectron spectroscopy, Fourier transform infrared spectroscopy (FTIR), and porosimetry analysis. Synthesized materials exhibited improved structural properties, including high surface area, small crystallite size, reduced band gap energy, mesoporous structure, and high porosity. Due to doping with P and F, light absorption of TiO2 in the visible light region was efficiently enhanced with effective band gap energy of 2.70 eV. Brunauer-Emmett-Teller (BET) surface area for PF–co-doped, P-doped, F-doped, and reference TiO2 nanoparticles was 212.0, 175.0, 88.8, and 79.7 m2/g, respectively. PF–co-doped TiO2 showed the highest photocatalytic degradation of atrazine, which could be attributed to the beneficial effects including small crystallite size, high BET surface area, and light absorption in UV-visible region, induced by co-doping of TiO2 with P and F. Finally, reaction intermediates were determined, which confirms the photocatalytic degradation of atrazine using the synthesized catalysts under UV-visible light illumination.
Introduction
O
Fortunately, unique opportunities for water treatment and purification have been recently provided through the development of promising nanotechnologies. Novel nanomaterials have been developed during the last decade and evaluated for the destruction of toxic and recalcitrant organic contaminants and killing/inactivation of pathogenic microorganisms in water. During the last decade, various advanced oxidation technologies (AOTs) such as gamma radiation, ultraviolet (UV)/hydrogen peroxide (H2O2), UV/ozone (O3), O3/H2O2, H2O2/ferrous iron (Fe2+), UV/H2O2/Fe2+, UV/peroxymonosulfate (PMS), UV/persulfate (PS), UV/PMS/Fe2+, UV/PS/Fe2+, UV/titanium dioxide (TiO2), and UV/H2O2/TiO2 have also been frequently applied for the treatment of water contaminated with dyes, pesticides, pharmaceuticals, and other regulated or nonregulated organic contaminants (Homem and Santos, 2011; He et al., 2012; Zheng et al., 2012; Ismail et al., 2013; Khan et al., 2013; Shah et al., 2013). Among these AOTs, TiO2-based photocatalytic processes are considered among the most suitable, reusable, sustainable, and environment friendly emerging water treatment processes. TiO2 is one of the most important and appropriate photocatalysts because of its strong oxidizing power, biological and chemical inactivity, low cost, relatively low toxicity, and high resistivity to photo- and chemical corrosion (Jin et al., 2009; Zhang et al., 2010b; Han et al., 2011; Han et al., 2012). Due to the excellent properties as photocatalyst, TiO2 is widely used in catalyzing alcohol dehydration, degradation of pigments, and oxidation of aromatic compounds, organic acids, volatile organic compounds, and nitrogen oxides under UV radiation (Yu et al., 2002). As a result, TiO2 is currently the most studied photocatalyst for the remediation of emerging environmental pollutants. The photocatalytic activity of TiO2, as a result of UV light absorption, is due to the production of excited electrons in the conduction band and corresponding positive holes in the valence band. These two photoinduced species are mobile and can result in the formation of reactive oxygen species (ROS), especially
In the last two decades, much effort has been devoted to extend the photocatalytic response of TiO2 into the visible light region. Through metal (e.g., copper, vanadium, etc.) and nonmetal (e.g., carbon, nitrogen, etc.) doping, visible light can be utilized to produce ROS as a result of band gap narrowing or the introduction of localized midgap energy states in TiO2 (Colón et al., 2006; Lin and Lin, 2012; Liu et al., 2013). Thus, modified TiO2-based nanomaterials have been prepared and their photocatalytic activities were investigated under either solar or visible light irradiation. The materials doping provided excellent enhancement to the photocatalytic activity of TiO2 for the degradation of phenol, 4-chlorophenol, methyl orange, methylene blue (MB), and tetracycline (Colón et al., 2006; Hamadanian et al., 2011; Wang et al., 2011; Elghniji et al., 2012; Lin and Lin, 2012). In addition to single doping, co-doping of TiO2 with two or more nonmetals, such as carbon and nitrogen, and nitrogen and fluorine, has been found to be an efficient way to enhance the solar energy harvesting capacity of TiO2 and its photocatalytic performance (Pelaez et al., 2010; Liu et al., 2013). Among many doping elements, phosphorous and fluorine are recently gaining great interest because of the increased photocatalytic activities of the corresponding materials under solar and visible light illuminations (Yu et al., 2003; Yu, 2007; Natori et al., 2009). Natori et al. (2009) have found that P-doped TiO2 (P-TiO2) have higher photocatalytic activity than that of commercially available TiO2 in terms of MB decomposition under UV-visible and visible light illumination. Yu (2007) observed that the addition of P into the TiO2 lattice maintained its anatase structure at relatively high temperature (i.e., 900°C). This relatively high temperature could achieve high crystallinity while maintaining the anatase phase of P-TiO2, which positively affects the photocatalytic activity. Yu (2007) also found that catalysts synthesized using phosphoric acid (H3PO4) and tetraethyl orthotitanate [Ti(OC2H5)4] exhibited higher photocatalytic activity compared with the commercially available P-25 for the degradation of MB under UV light (λ=365 nm) illumination. Yu et al. (2003) reported that phosphated mesoporous TiO2 prepared using H3PO4 and titanium isopropoxide had higher photocatalytic activity for the degradation of n-pentane compared with pure mesoporous TiO2 and P-25. They also observed that catalysts calcined at 500°C demonstrated higher photocatalytic activity than those calcined at 400 and 600°C. Vijayabalan et al. (2009) studied the degradation of Reactive Orange 4 with TiO2-P25 and F-doped TiO2 (F-TiO2)-P25 and found that the photocatalytic degradation rate obtained by F-TiO2-P25 was three times higher than that of TiO2-P25. These studies suggest that P and F can efficiently enhance the photocatalytic behavior of TiO2. Although some previous studies report on single doping of titania with either P or F to improve the photocatalytic activity for the degradation of water contaminants including Reactive Orange 4, acetaldehyde, trichloroethylene, rhodamine B, n-pentane, and MB (Yu et al., 2003; Li et al., 2005; Zheng et al., 2008; Lv et al., 2009; Vijayabalan et al., 2009), yet no study has been reported so far on the effects of P and F co-doping into the TiO2 crystal lattice.
The principle objective of this work was to synthesize UV-visible light sensitive P-doped TiO2 (P-TiO2), F-doped TiO2 (F-TiO2), and PF–co-doped TiO2 (PF-TiO2) photocatalysts by a modified sol-gel method employing a nonionic hydrocarbon surfactant as a pore directing agent. For morphological, structural, optical, and electronic properties determination, the synthesized reference (TiO2) and modified (P-TiO2, F-TiO2 and PF-TiO2) materials were thoroughly characterized by diffuse reflectance spectroscopy (DRS), X-ray diffraction analysis (XRD), high-resolution transmission electron microscopy (HR-TEM), X-ray photoelectron spectroscopy (XPS), Raman spectroscopy, Fourier transform infrared spectroscopy (FTIR), and porosimetry. Taking into account that many pesticides are considered to be serious health risks for humans and other animals because of their carcinogenic, bioresistant, and endocrine-disrupting nature (Nelkenbaum et al., 2009) and that atrazine is among the most widely used organic pesticides (herbicides), this compound was thus selected as a model pollutant for the evaluation of photocatalytic activities of the synthesized nanomaterials under UV-visible light irradiation.
Experimental
Preparation of reference TiO2, P-TiO2, F-TiO2, and PF-TiO2 nanoparticles
The reference TiO2 (undoped TiO2), P-TiO2, F-TiO2, and PF-TiO2 nanoparticles were prepared by a modified sol-gel method. Titanium (IV) isopropoxide (TTIP, 97%; Sigma-Aldrich), H3PO4 (99.99%; Sigma-Aldrich), and ammonium fluoride (NH4F, 96%; Fisher Scientific) were used as Ti, P, and F precursors, respectively. The nonionic surfactant polyoxyethylene (80) sorbitan monooleate (Tween 80; Sigma-Aldrich) was used as a pore directing agent in the sol-gel synthesis. Initially, Tween 80 was taken in a beaker and then isopropyl alcohol (i-PrOH, 99.8%; Pharmco) was added dropwise under vigorous stirring until Tween 80 was completely dissolved. After the addition of i-PrOH, acetic acid (AcOH; Fisher) was added immediately to the solution to maintain a low pH and for in situ formation of water through its esterification reaction with i-PrOH. Before the addition of P and F precursors, TTIP was introduced dropwise into the solution. The solution was kept under vigorous stirring for about 30 min. Finally, H3PO4, NH4F, or both were added to the resulting solution for the synthesis of P-TiO2, F-TiO2, and PF-TiO2 nanoparticles, respectively. In case of using both, that is, H3PO4 and NH4F, NH4F was added after 8 h of stirring of H3PO4 solution to obtain a homogenous solution. The resulting solutions were stirred for 24 h at room temperature. The transparent, homogenous, and stable solutions were obtained after 24 h of aging. The molar ratio of ingredients was Tween 80:TTIP:i-PrOH:AcOH:H3PO4:NH4F=3.6:10:137:25:1:1 for PF-TiO2. P-TiO2 and F-TiO2 were synthesized without the addition of NH4F or H3PO4, respectively, keeping the same molar ratio of the rest of the ingredients. Reference TiO2 was synthesized by the above mentioned procedure without the addition of P and F precursors. After 24 h stirring, the sol was dried in borosilicate glass dishes at room temperature for 12 h and then calcined in a multi-segment programmable high temperature furnace (Paragon Model HT-22-D, Thermcraft Inc.) to prepare the catalysts. The sols were calcined at 400°C for 1 h, the temperature was initially increased from room temperature to 400°C with a ramp rate of 60°C/h, and then up at 580°C for 2 h (at a ramp rate of 80°C/h). The samples were then cooled down naturally. The anatase crystal phase of the nanoparticles was maintained at this temperature (Baiju et al., 2005; Lv et al., 2009). During the calcination, all the organic compounds were completely removed from the resultant nanoparticles. The calcined samples were scratched from the dishes and then ground into fine powder form.
Characterization of reference TiO2, P-TiO2, F-TiO, and PF-TiO2 nanoparticles
Structural properties of the reference TiO2, P-TiO2, F-TiO2, and PF-TiO2 nanoparticles were determined using X-ray powder diffraction (X'Pert PRO; Philips) with Cu K (λ=0.15406 nm) radiation together with Raman spectroscopy. Raman spectra were measured in backscattering configuration on a Renishaw inVia Reflex microscope using a high power near infrared diode laser (λ=785 nm) and an Ar+ ion laser (λ=514.5 nm) as excitation sources. The laser beam was focused onto the samples by means of a 5× objective (low magnification, to avoid possible inhomogeneity problems and have more representative data), while the laser power density was kept at low levels (<0.1 mW/μm2) to avoid any local heating and phase transformation of the titania samples. A Tristar 3000 (Micromeritics) porosimeter analyzer was used for the determination of Brunauer–Emmett–Teller (BET) surface area, Barrett–Joyner–Halenda (BJH) pore size, pore volume, pore size distribution, and porosity. The powders were purged with nitrogen gas for 2 h at 150°C using Flow prep 060 (Micromeritics) prior to the BET analysis by a Tristar porosimeter analyzer for degas. The light absorption properties and optical band gap of the synthesized TiO2 nanopowders were investigated from UV-vis absorption spectra obtained with UV-vis spectrophotometer (2501 PC, Shimadzu) equipped with an integrated sphere accessory (ISR 1200) employing barium sulfate (BaSO4) as a reference standard material. The information about crystal size and crystal structure was obtained with A JEM-2010F (Jeol) HR-TEM with field emission gun at 200 kV. The samples were prepared by dispersing the nanoparticles in methanol (high-performance liquid chromatograph [HPLC] grade; Pharmco) by ultrasonication (2510R-DH; Bransonic) over 30 min. A few drops of the solution were then fixed on a carbon-coated copper grid (LC325-Cu, EMS) and dried with an infrared lamp. XPS (SSX-100 XPS) was employed to reveal the chemical composition and valence state of the dopants in the nanoparticle powders. The instrument was fitted with monochromatic Al Kα radiation (E=1486.6 eV) and 600 μm nominal X-ray beam diameter. The absolute binding energies were calibrated using C1s level peak at 284.6 eV. To determine the presence of P and F in the synthesized photocatalysts, FTIR was performed using Schimadzue, IR Prestige-21, FTIR-8400S spectrometer.
Evaluation of photocatalytic activity
The photocatalytic activity of the as-prepared nanoparticles was evaluated in terms of atrazine (99.9%; Sigma Aldrich) degradation under UV-visible light illumination. The photocatalytic reactor consists of a borosilicate glass Petri dish (diameter 10 cm). Milli-Q grade water (resistivity of 18.2 MΩ·cm) was used for all experiments. Prior to the addition of atrazine, the pH of water was adjusted at 3.0 with 0.1 N HCl solutions. The low pH was selected due to the high oxidation properties of TiO2 in the acidic region and high redox potential of •OH at acidic pH (i.e., 2.7 in acidic versus 1.8 in neutral solution) (Buxton et al., 1988; Chen et al., 2012). Then, the pH-adjusted aqueous solutions were spiked with an aliquot of atrazine solution to achieve the initial concentration of 2.32 μM. To obtain uniform suspension of TiO2 photocatalysts, the solution containing TiO2 nanoparticles was sonicated for 12 h using an ultrasonicator (2510R-DH; Bransonic). The photocatalyst suspension was then added to the reactor containing atrazine solution at 0.5 g/L as initial catalyst loading and 10 mL as final reaction solution volume. The reactor was completely sealed with parafilm and a fan was located behind the reactor to avoid any loss of solution through evaporation. A magnetic stirrer was used for continuously mixing the suspension in the reactor during the reaction under UV-visible light illumination. Two 15 W fluorescent lamps (Cole-Parmer) were employed as UV-visible light source (315–700 nm; Supplementary Fig. S1). The UV-visible light intensity was determined with a radiant power meter (Newport Corp.) and was found as 9.50×10⁻² mW/cm2. Sampling was performed at specific time intervals, that is, at 0, 0.5, 1, 2, 3, 4, and 6 h by taking 150 μL of sample solution and quenched with 150 μL of methanol to avoid any reaction. The collected samples were filtered using syringeless filters (pore size: 0.2 μm; Whatman) to separate out the catalyst particles. The concentration of atrazine in the sample was analyzed using a HPLC (Agilent Series 1100) with a similar method reported in our previous publication (Khan et al., 2013). Moreover, reaction intermediates were identified using a combination of liquid chomatography/quadrupole time-of-flight (an Agilent G6540A quadrupole time-of-flight mass spectrometer) with a same method reported by Andersen et al. (2013). An Agilent Eclipse XDB-C18 column (2.1 mm×50 mm, 3.5 μm) was employed and the flow rate was 0.2 mL/min.
Results and Discussion
Characterization of as-prepared nanoparticles
UV–vis absorption spectra of the nanoparticles
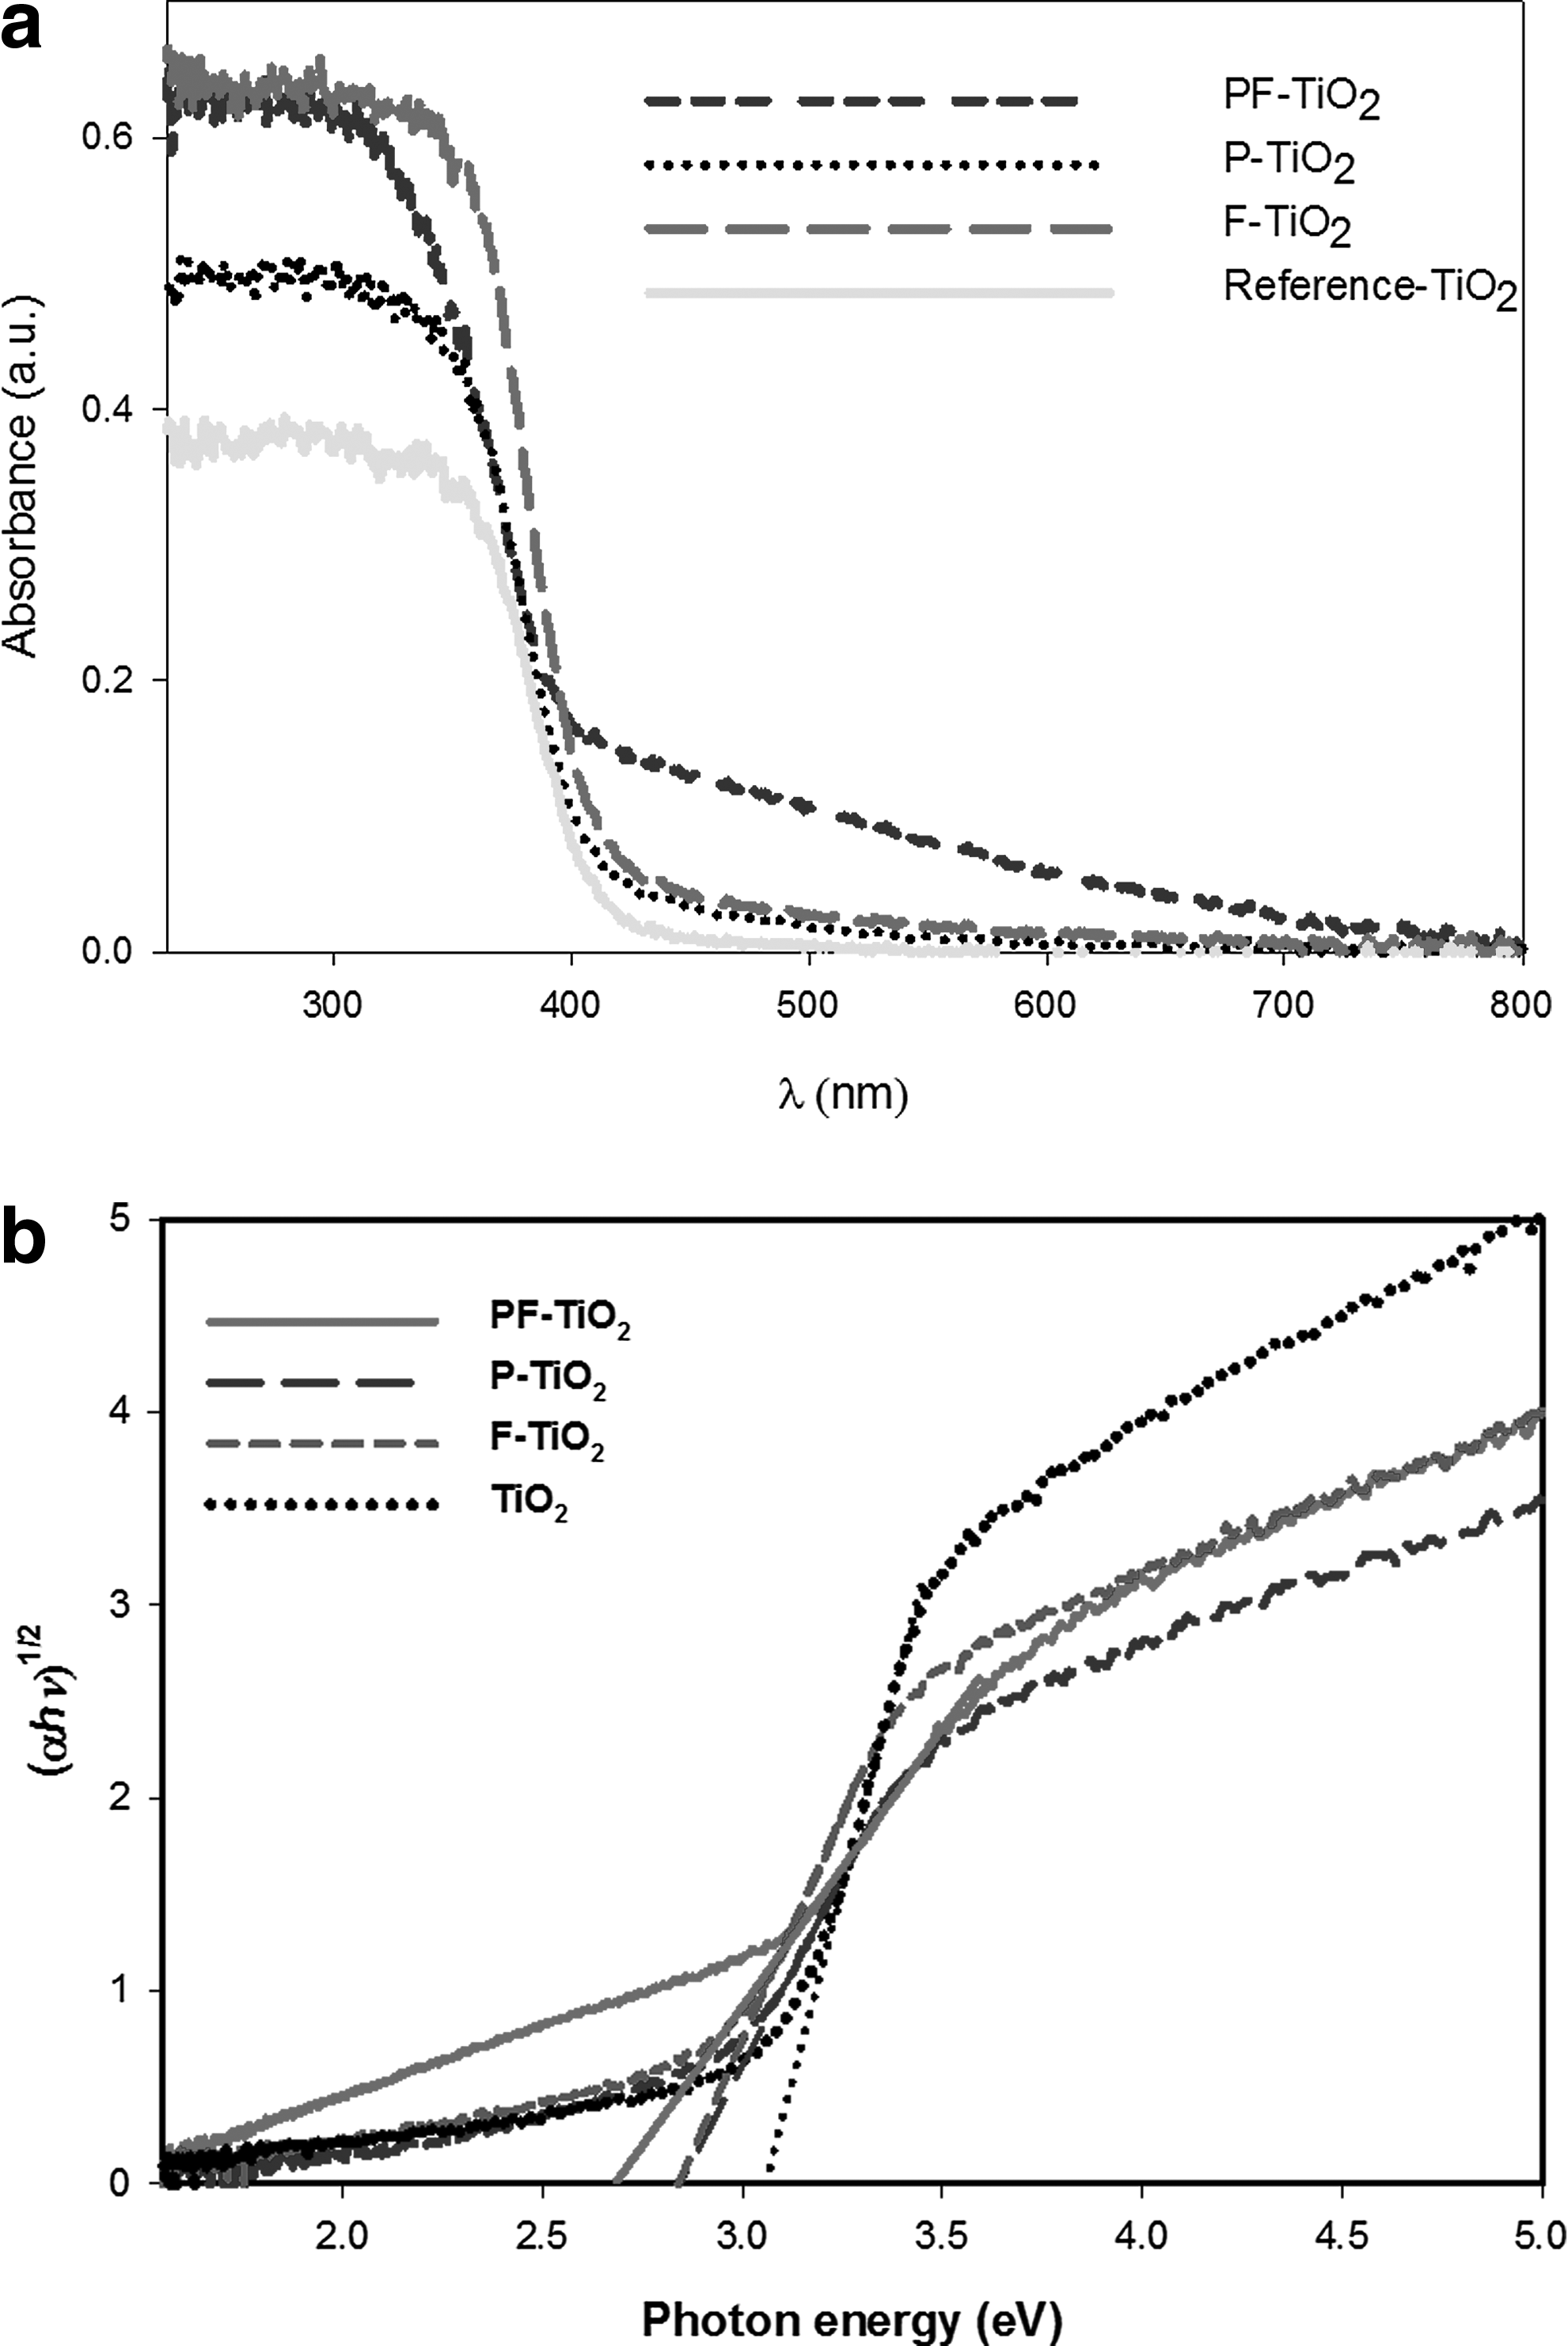
The UV-vis absorption spectra of the P-TiO2, F-TiO2, and PF-TiO2 nanoparticles in comparison with the reference TiO2 nanoparticles are shown in Fig. 1a. To estimate the effective band gap energy for the synthesized samples, (αhν)1/2 was plotted as a function of the photon energy (hν), assuming indirect allowed transitions (Gonzalez and Santiago, 2007). The values of the indirect band gap for PF-TiO2, P-TiO2, F-TiO2, and reference TiO2 were determined by the linear extrapolation of the corresponding curves as shown in Fig. 1b. The value was 2.70 eV for PF-TiO2, 2.85 eV for P-TiO2, and F-TiO2, and 3.08 eV for reference TiO2. These results suggest that the strongest absorbance in the visible light region is exhibited by PF-TiO2 and hence, such material is anticipated to have the highest photocatalytic activity under visible light irradiation. In addition, a red absorption shift was also observed for PF-TiO2 (Fig. 1a), which further strengthens our hypothesis that co-doping of TiO2 with P and F is highly effective in extending the optical response of TiO2 to the visible light region.
Optical properties of the different as-prepared TiO2 nanoparticles:
Besides, it has been reported that doping of F into TiO2 crystal lattice contributed to the creation of two types of surface oxygen vacancies, two trapped electrons (F center) and one trapped electron (F+ center) oxygen vacancies (Li et al., 2005), both contributing to the photocatalytic activity of F-TiO2 under visible light (Li et al., 2005). Similarly, Yang et al. (2007) reported that the enhanced photocatalytic activity of P-TiO2 could be attributed to the large surface area and high degree of crystallinity of P-TiO2. These observations suggest that P-TiO2, F-TiO2, and PF-TiO2 nanoparticles would be ideal photocatalysts under UV-visible/visible light illumination.
Structural analysis of reference TiO2, P-TiO2, F-TiO2, and PF-TiO2 nanoparticles
The XRD patterns of the as-prepared nanoparticles are shown in Fig. 2. It can be seen from the characteristic diffraction peak at about 2θ=25.5° corresponding to the (101) anatase crystal plane, that all the nanoparticles exhibit well-crystallized anatase structures with no observation of peaks corresponding to the rutile phase. These observations indicated that the main phase composition of the TiO2 particles has not been drastically influenced by the process of doping and co-doping, within the resolution of powder X-ray diffraction. It can be seen from Table 1 that no significant variations in the (101) plane spaces [D (101)] were found between the modified and reference TiO2 nanoparticles. These results suggest that the average unit cell dimensions of the anatase crystal lattices were not significantly affected by the incorporation of P and/or F. This may possibly be due to the low doping percentages of the P and F in the TiO2 crystal lattice. The most intense diffraction peak of anatase, that is, (101) plane was used to calculate the average crystallite size using the Scherrer formula (Zhang et al., 2010a):
XRD pattern of PF-TiO2, P-TiO2, F-TiO2, and reference TiO2 samples. XRD, X-ray diffraction analysis.
Calculated from XRD, using Scherrer equation: D=0.89 λ/(β×cosθ).
Calculated from BET, using D=6000/(ρ×BET surface area), where ρ=3.79 g/cm3 of anatase density.
Porosity (%)=pore volume (cm3/g)/(pore volume [cm3/g]+solid catalyst volume without pore [cm3/g])×100; the solid catalyst volume (cm3/g) without pore was calculated from the density of anatase (3.79 g/cm3) and is equal to 1/density of the solid catalyst volume without pore.
Based on Bragg's Law: d=λ/(2×sin θ), where λ=1.54 Å.
BET, Brunauer-Emmett-Teller; XRD, X-ray diffraction analysis.
where D is the average crystallite size, K is a constant equal to 0.89, λ is the wavelength of the X-ray radiation (0.154 nm), β is the full width at half-maximum (FWHM) of 101 peak, and θ is the diffraction angle. The average crystallite sizes were calculated to be 5.9, 9.9, 14.6, and 16.4 nm for PF-TiO2, P-TiO2, F-TiO2, and reference TiO2 nanoparticles, respectively (Table 1).
The structural properties and phase composition of the modified TiO2 nanomaterials were further investigated by Raman spectroscopy. Figure 3 compares the Raman spectra of the reference TiO2, P-TiO2, F-TiO2, and PF-TiO2 nanoparticles at 785 nm laser excitations (identical results were obtained at 514.5 nm). All samples exhibit the characteristic Raman-active modes of the anatase TiO2 phase (Yang et al., 2007), consistently with the materials phase composition determined by XRD. Moreover, analysis of the Raman spectra revealed significant intensity reduction together with distinct shifts and broadening of the anatase Raman bands, especially for the P-TiO2 and PF-TiO2 nanoparticles compared with F-TiO2 and reference TiO2. This variation is characteristic of size effects due to optical phonon confinement, resulting in both, broadening and blue shift of the Raman modes (Kelly et al., 1997) in addition to the reduction of the Raman scattering efficiency in nanosized materials. Specifically, the peak position and FWHM (in parentheses) of the lowest frequency and most intense (Eg) anatase mode, frequently used to quantify phonon confinement size effects in anatase (Han et al., 2011; Liu et al., 2013), were determined to be at 143.4 (9.5), 143.8 (10), 147 (17), and 147.5 (25) cm−1 for the reference TiO2, F-TiO2, P-TiO2, and PF-TiO2, respectively. Projecting the Eg peak positions to the correlation plots of the anatase Eg frequency versus crystallite size predicted by the phonon confinement model (Pottier et al., 2003), indicates that the anatase crystallite size decreases to 17, 15, 8.0, and 6.5 nm for the reference TiO2, F-TiO2, P-TiO2, and PF-TiO2, respectively, in close agreement with the XRD results (Table 1). While the same model could also justify the FWHM values of the anatase Eg mode for the reference TiO2 and F-TiO2 samples, excess broadening was noted for P-TiO2 and particularly for PF-TiO2, deviating from the predicted scaling of the Raman shift versus FWHM (Kelly et al., 1997). This implies the presence of additional effects related to lattice strain and structural defects that could shift and/or broaden the anatase modes for P-TiO2 and PF-TiO2.

Raman spectra for the reference, F-TiO2, P-TiO2, and PF-TiO2 at 785 nm. The inset compares in detail the variation of the lowest frequency Eg anatase mode for the different TiO2 nanoparticles.
Besides, the intense anatase Raman modes, 2 weak bands at 450 and 610 cm−1 could be identified for the reference TiO2 (Fig. 3), characteristic of small amounts of the rutile phase that is beyond the detection limit of powder XRD. The formation of the rutile phase that can be justified by the relatively high calcination temperature (580°C) of the bare TiO2 nanoparticles was, however, inhibited by the presence of H3PO4 and NH4F reagents for the doped-TiO2 nanomaterials. On the other hand, two additional Raman bands emerged at 246 and ∼360 cm−1 for P-TiO2 and PF-TiO2, indicating the formation of a small fraction of brookite TiO2 nanocrystals (Han et al., 2011), similar to other anion doped TiO2 nanomaterials prepared by the surfactant assisted sol-gel method (Likodimos et al., 2013).
BET surface area analysis
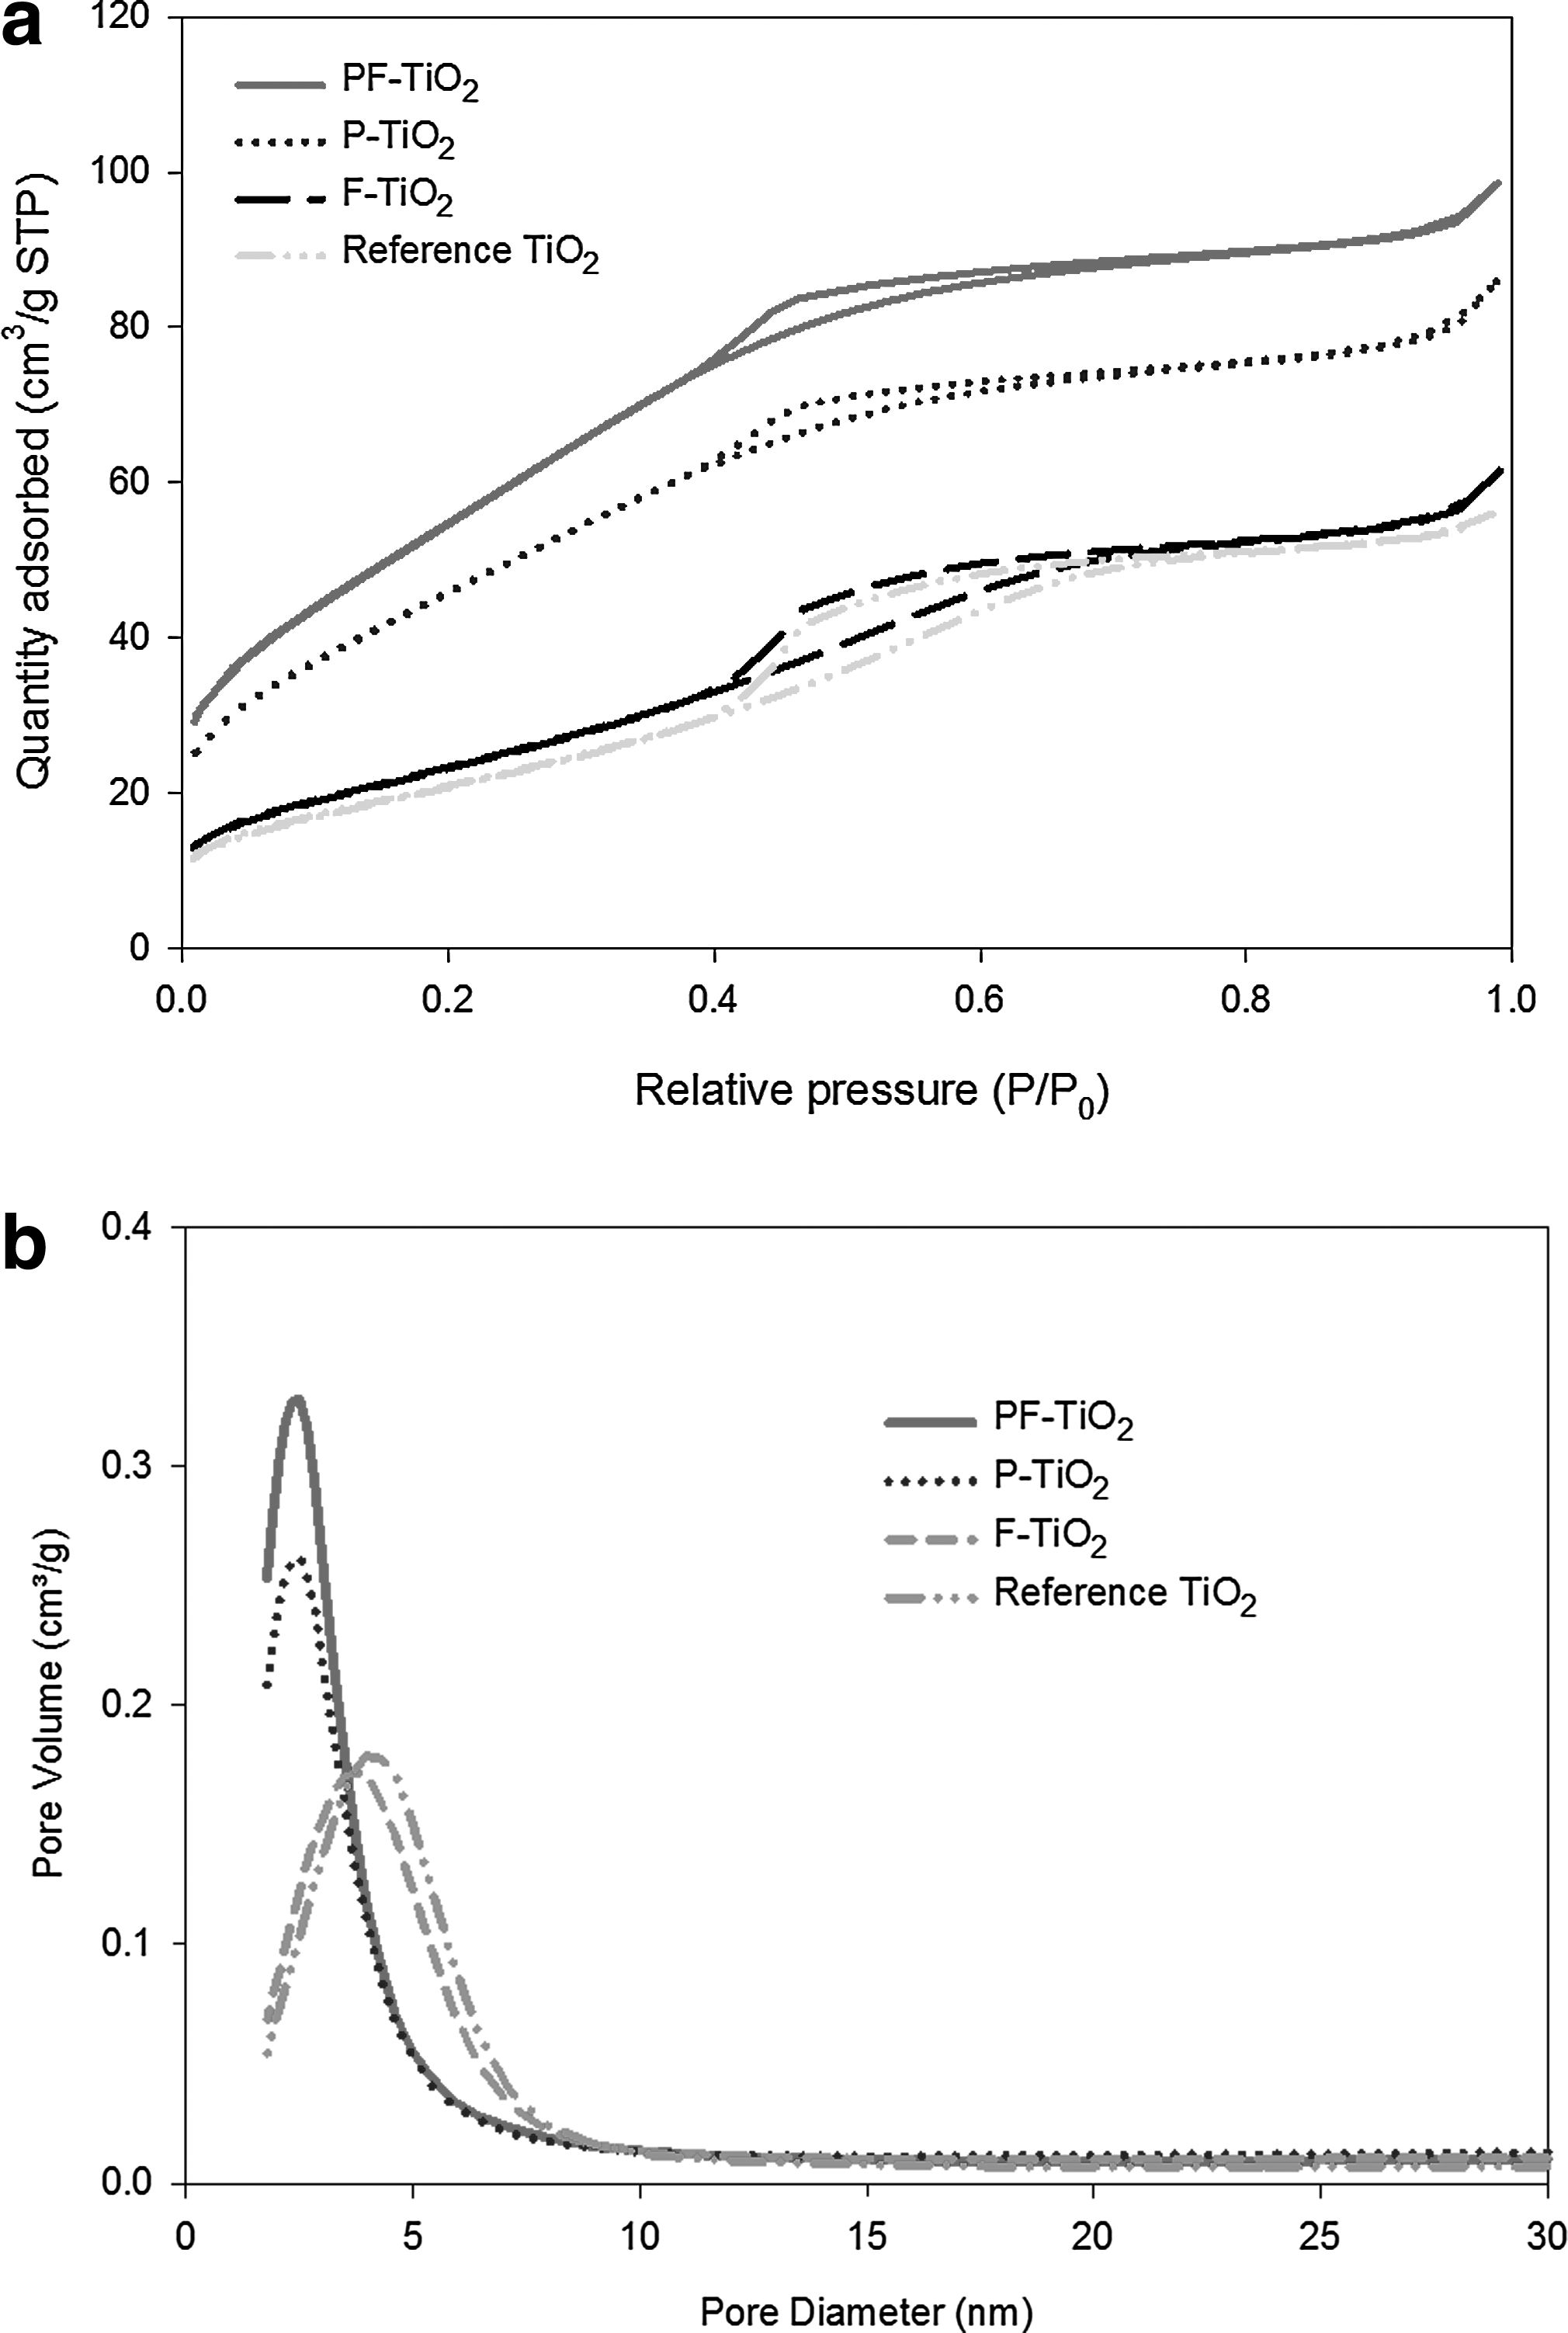
The N2 adsorption-desorption isotherms and BJH pore size distributions of the reference TiO2, P-TiO2, F-TiO2, and PF-TiO2 nanoparticles are shown in Fig. 4. The Halsey equation was used for calculating the pore size distribution from the N2 desorption isotherm by applying the BJH method. According to IUPAC classification, the N2 adsorption-desorption isotherms of Fig. 4a can be classified as type IV on the basis of hysteresis loops (Sing et al., 1985). This type of isotherm is characteristic of mesoporous materials showing that the as-prepared catalysts are mesoporous in nature (Sing et al., 1985). Figure 4b reveals that the pore size distributions significantly varied with doping of the TiO2 crystal lattice with F and especially P. The pore diameter for the reference TiO2, F-TiO2, P-TiO2, and PF-TiO2 were determined to be about 4.0, 3.8, 2.5, and 2.5 nm, respectively, while the width of the derived pore size distributions were narrow, especially for the P-TiO2 and PF-TiO2 particles, indicating good homogeneity of the pores. The results obtained by analyzing the prepared nanoparticles for BET surface area are presented in Table 1. It can be seen that simultaneous doping of P and F into TiO2 noticeably increased the surface area, that is, the surface for area PF-TiO2 is 212.0 m2/g, which is about 2.7 times larger than that of reference TiO2 (79.7 m2/g). However, the results showed that P doping resulted in modified TiO2 catalysts with much higher surface area than those obtained with F doping, with 175.0 for P-TiO2 and 88.8 m2/g for F-TiO2. The pore volume followed similar trend to that of surface area, that is, the pore volume decreases for photocatalysts in the following order: PF-TiO2>P-TiO2>F-TiO2>reference TiO2.
The average particle size was further estimated from the BET surface area by using the following equation (Pelaez et al., 2009):
where D is average particle size and ρ is density of the catalyst (3.79 g/cm3 for anatase form) (Prasai et al., 2012). Based on the above equation, the average particle sizes for PF-TiO2, P-TiO2, F-TiO2, and reference TiO2 were calculated as 7.4, 9.1, 17.8, and 19.9 nm, respectively, complying with the results of XRD and Raman analyses and the inverse relationship between particle size and surface area (Pelaez et al., 2009).
HR-TEM studies
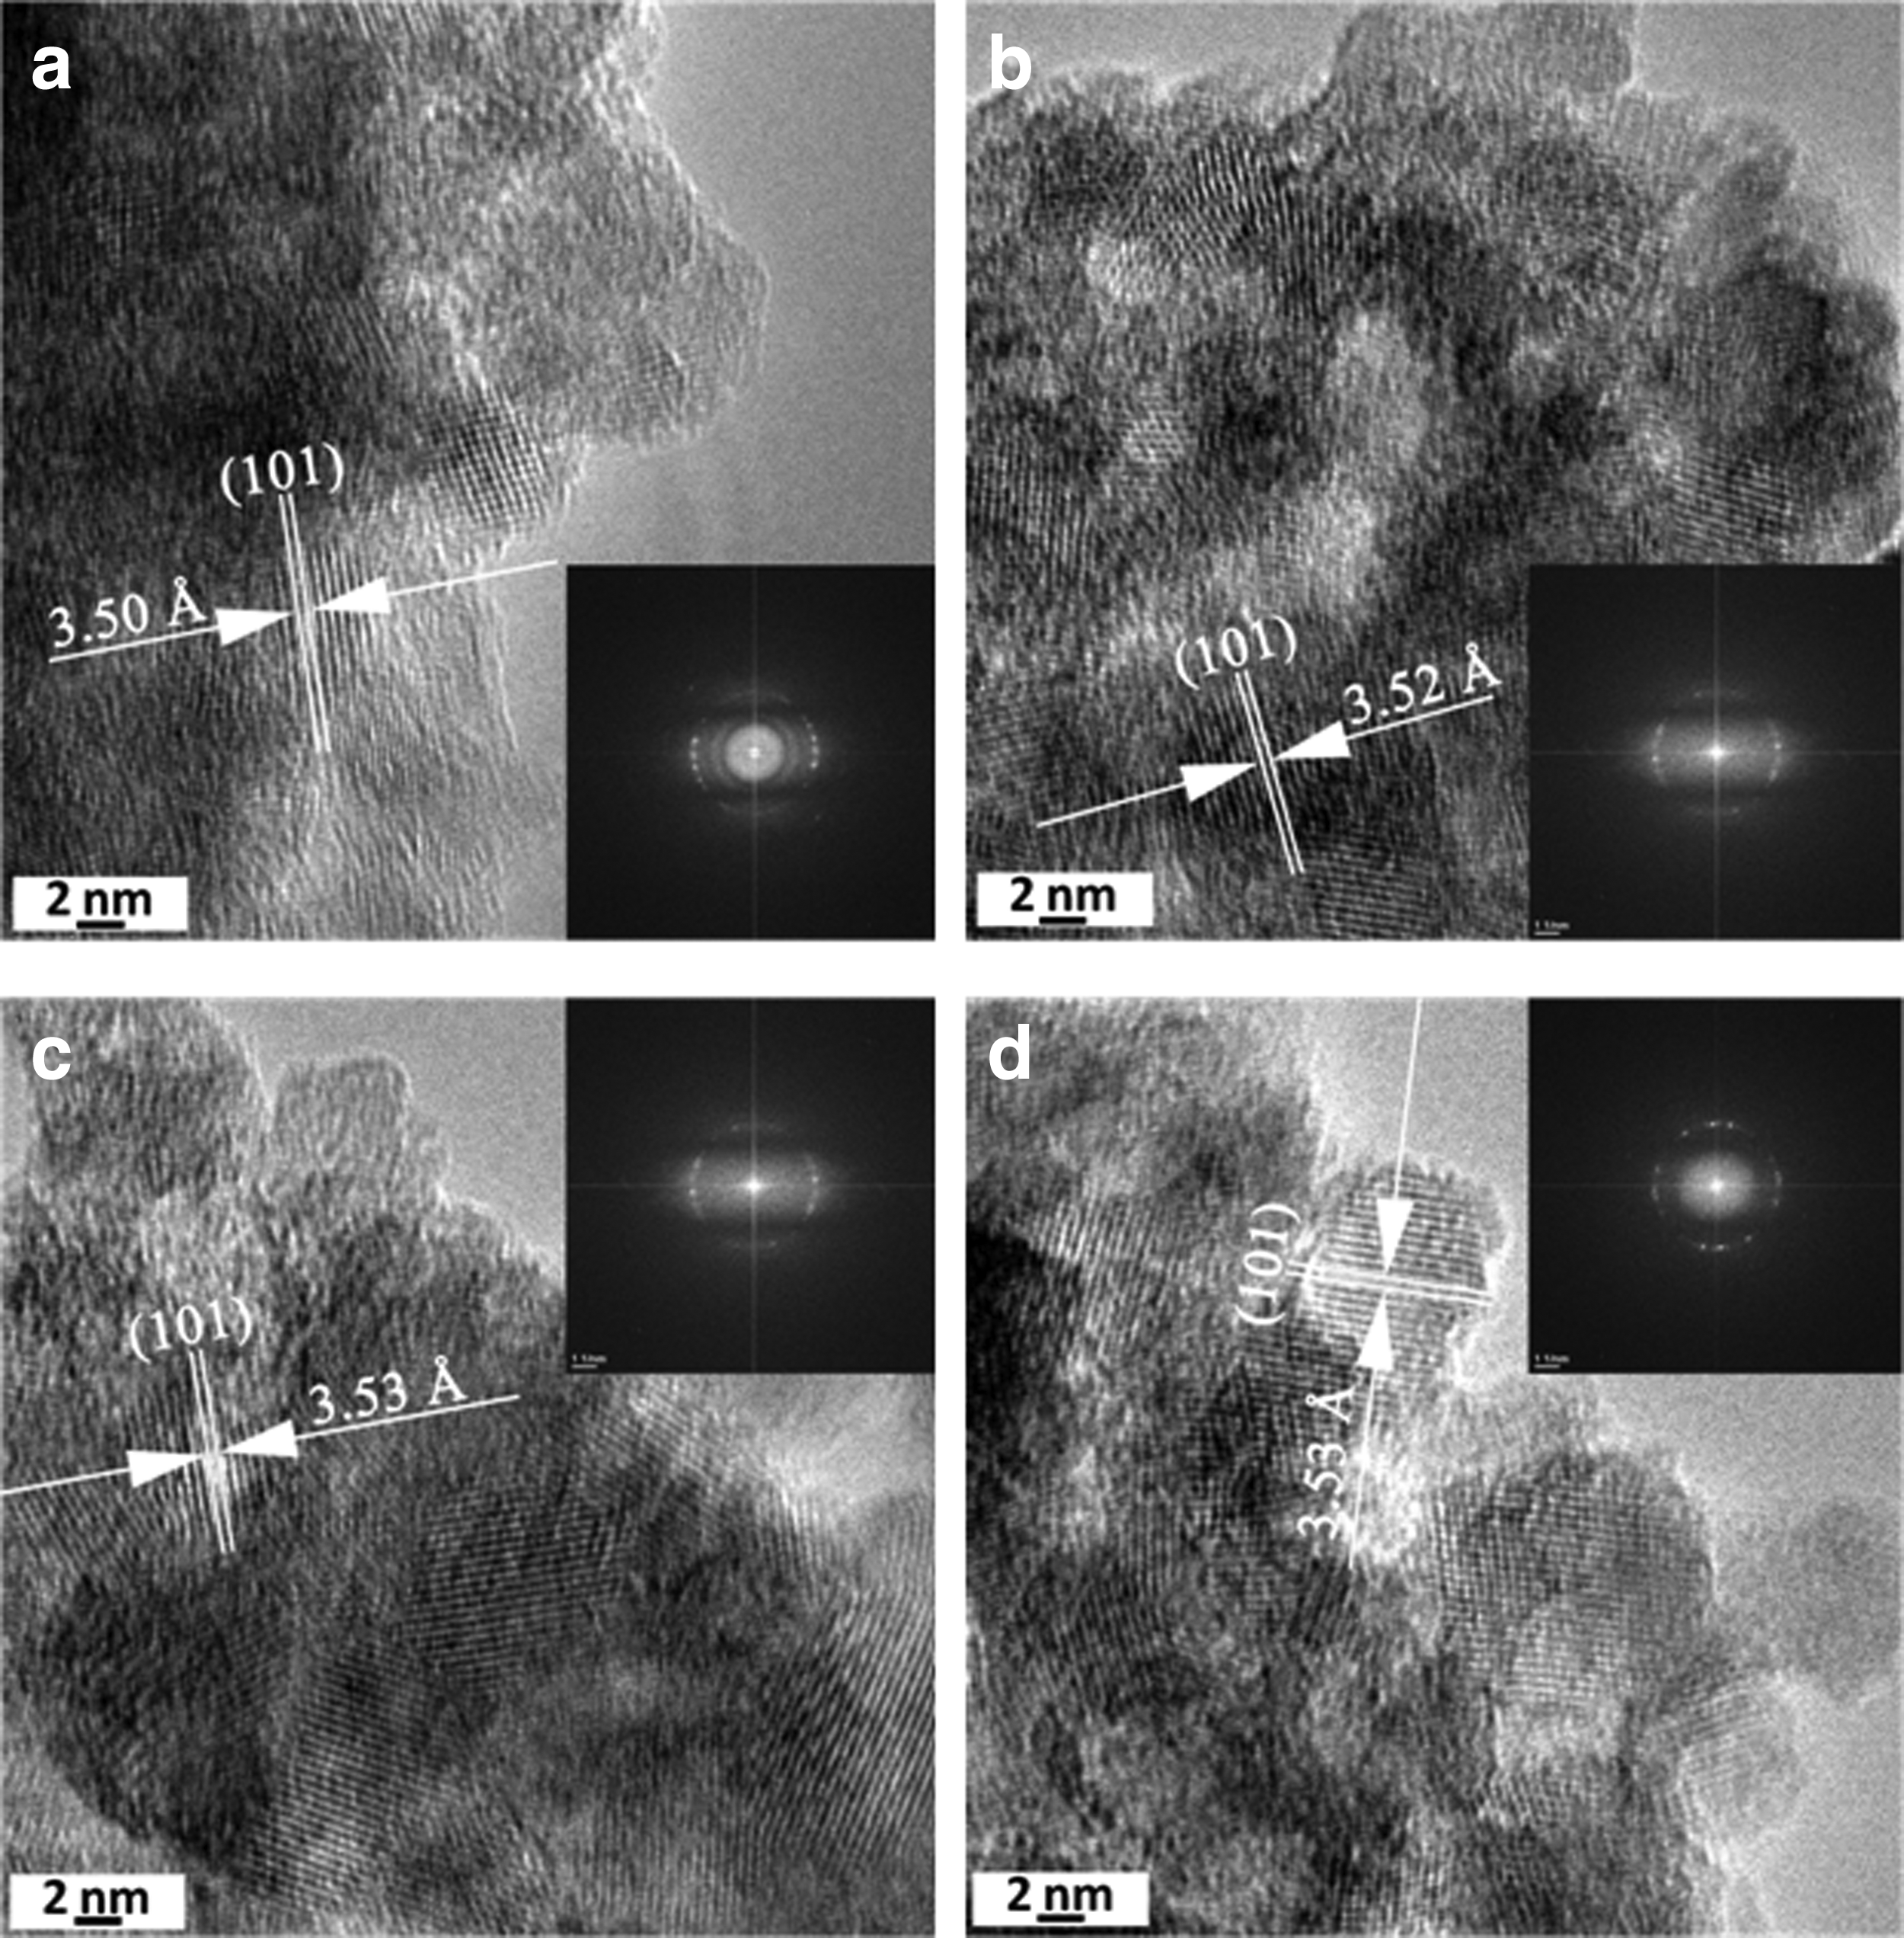
To further investigate the crystal size and morphology of the reference TiO2, P-TiO2, F-TiO2, and PF-TiO2 nanoparticles, HR-TEM and fast Fourier transform (FFT) were performed and the results are presented in Fig. 5a–d. The average crystal size evidenced from HR-TEM images were 5.5±1.0, 6.1±0.9, 8.8±0.9, and 11.2±1.6 nm for PF-TiO2, P-TiO2, F-TiO2, and reference TiO2, respectively. The results of the crystallite sizes for the samples were consistent with the nanoparticle size evolution derived by XRD, Raman, and BET analysis. A clear ring can be revealed from FFT patterns, showing that all TiO2 catalysts have one dominant crystal phase. In addition, clear lattice fringes with an interlayer distance in the range of 3.50–3.53 Å for the (101) planes of anatase were invariably resolved in HR-TEM images for all prepared nanoparticles, in close agreement to the 3.53 Å lattice spacing of the reference anatase (101) TiO2 planes, as shown in Table 1. Energy-dispersive X-ray spectroscopy (EDX) analysis was also performed for the determination of elemental composition of the as-prepared nanoparticles. The EDX results are shown in Supplementary Figs. S2–S5. It can easily be seen from these figures that phosphorous is efficiently doped into TiO2 crystals in P-TiO2 and PF-TiO2 (peak at 2.0 keV). However, due to the overlapping of the fluorine peak with the oxygen one, fluorine could not be identified in the EDX spectrums of F-TiO2 and PF-TiO2 nanoparticles.
High-resolution transmission electron microscopy images of TiO2 nanoparticles:
XPS analysis
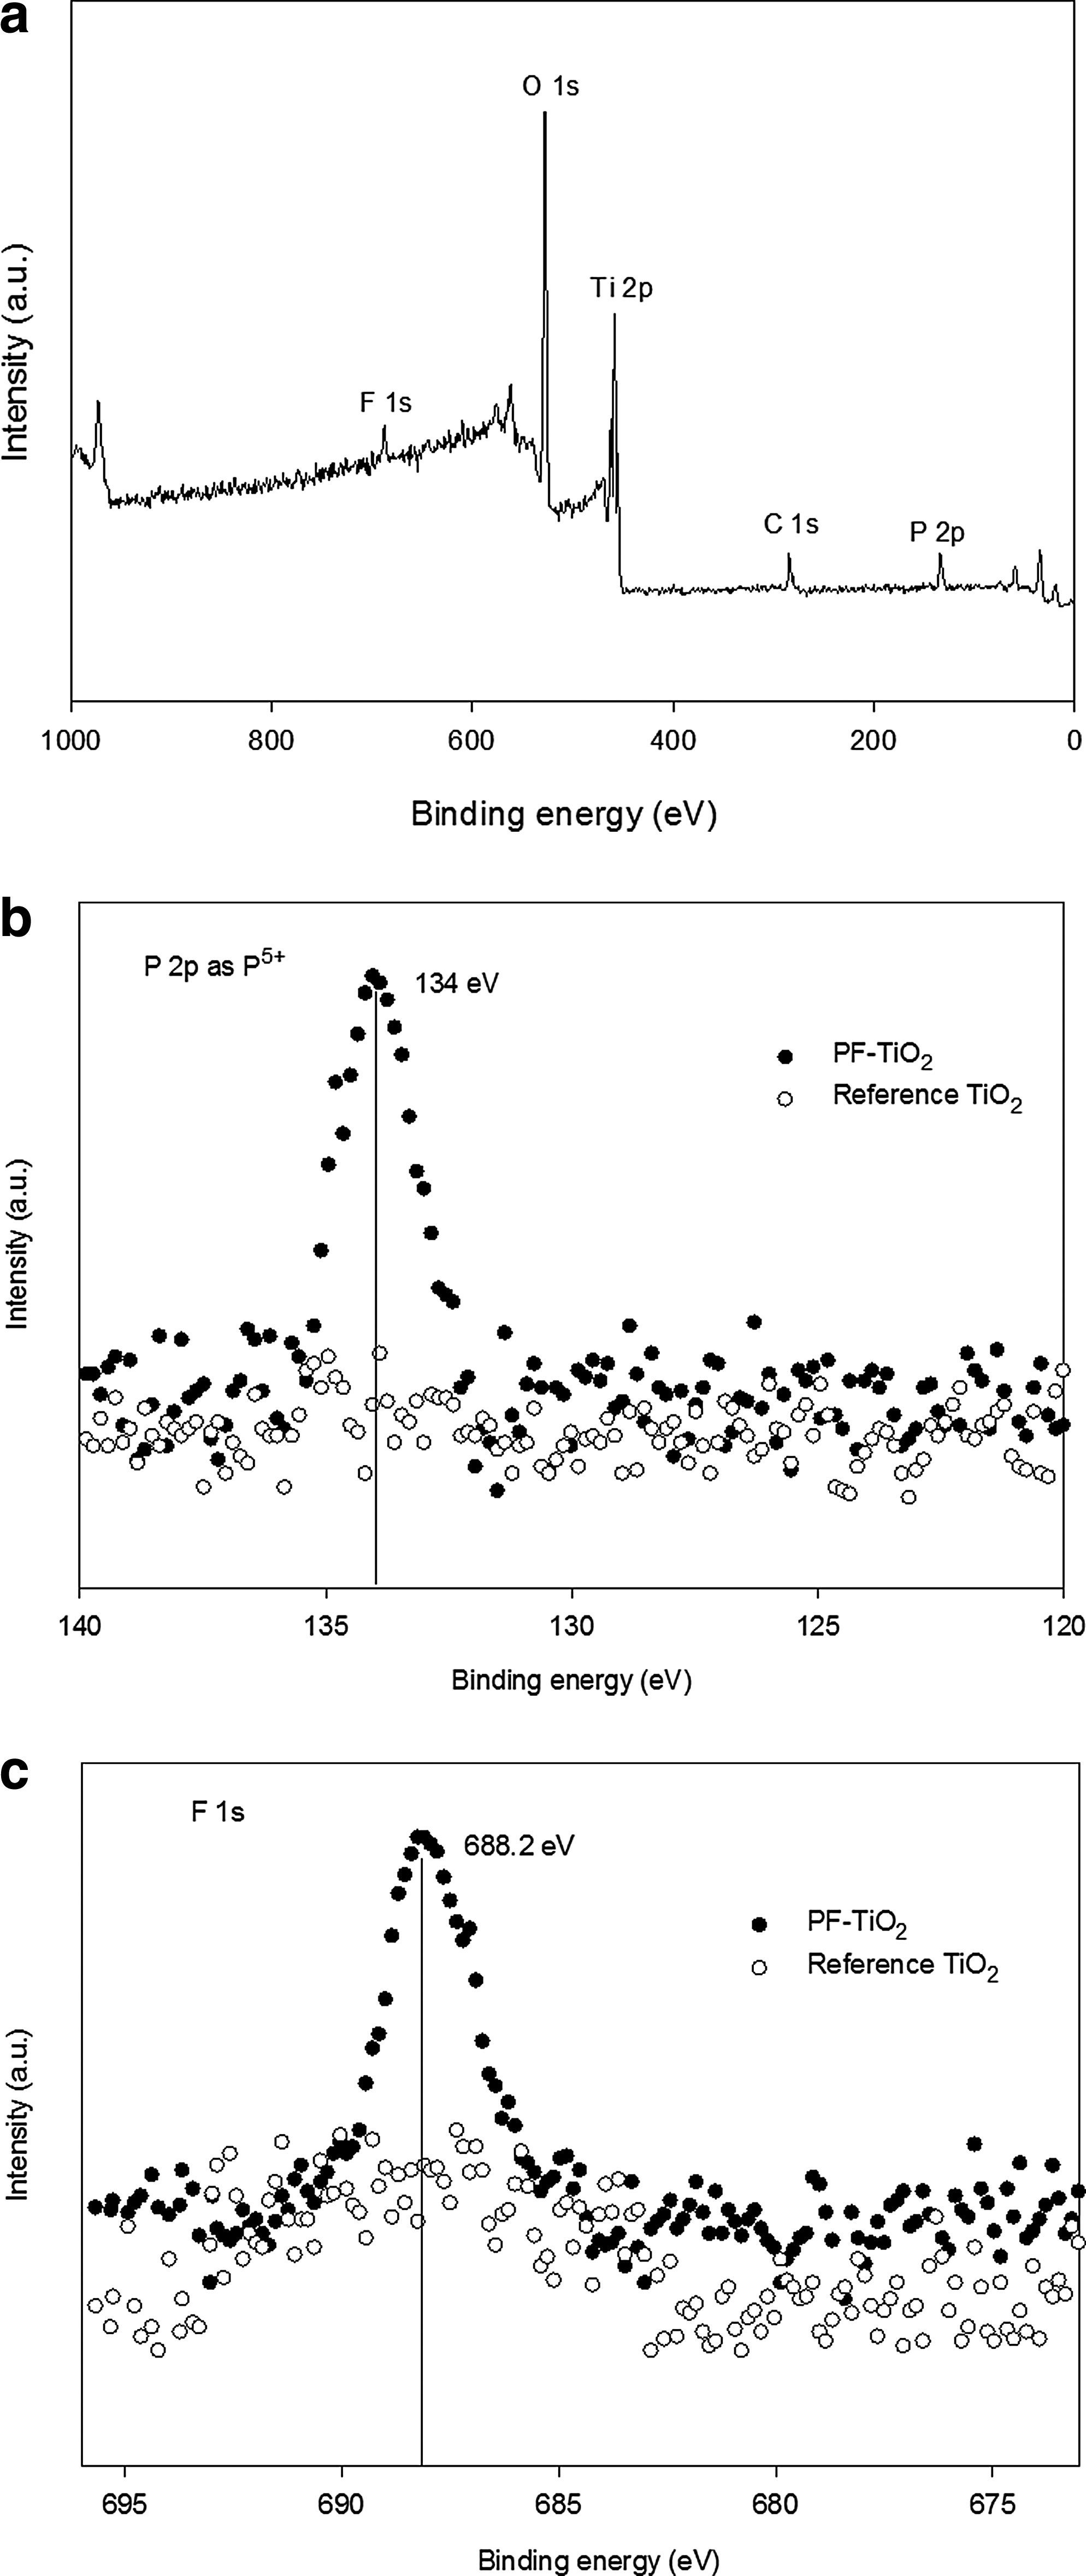
XPS analysis was carried out for the identification of incorporated P and F elements in the doped TiO2 crystal lattices. The XPS survey scan spectrum of PF-TiO2 is shown in Fig. 6a. High-resolution XPS spectra of P 2p and F 1s are displayed in Fig. 6b and c, respectively. Figure 6a shows that the elements detected in PF-TiO2 nanoparticles are P, F, Ti, O, and C. The carbon peak at 284.5 eV for C1s core level is expected to be an impurity peak that could be assigned to the adsorption of adventitious carbon in TiO2 (Pelaez et al., 2009). The peak at 134 eV representing P 2p is attributed to the pentavalent oxidation state (P5+) of phosphorous ions. The absence of a characteristic peak at 129 eV in the XPS spectra of P-TiO2 indicated that Ti atoms are unlikely to bond P atoms for the formation of Ti-P bonds (Lv et al., 2009). It has been reported that the presence of P5+ ions suggest that Ti4+ are partially replaced by P5+ ions in the crystal lattice of TiO2. These concomitant charge imbalances could decrease the recombination rate of electron-hole pairs (Lv et al., 2009) and hence lead to enhanced photocatalytic activities. Furthermore, the XPS spectrum showed a characteristic peak for Ti 2p3/2 at 458.5 eV, indicating the presence of Ti4+ ions in the TiO2 crystal lattice (Yang et al., 2006; Xu et al., 2008b). The peak at 529.5 eV in the survey spectra of the nanoparticles has been assigned to the O 1s core level in Ti-O bonds, that is, O2− in TiO2 crystal lattice (Han et al., 2013). The peak located at 688.2 eV is assigned to F 1s and was attributed for substitutional F-atoms in TiO2 crystal lattice (Pelaez et al., 2009). It has been reported that the recombination rate of photo-generated electrons and holes could be reduced by F substitution into TiO2 crystal lattice. As a result, oxygen vacancies are created in TiO2 lattice that can act as active sites for oxidizing species formation and subsequently leading to enhanced photocatalytic activity (Pelaez et al., 2009).
FTIR analysis
The FTIR results of doped and reference TiO2 nanomaterials are presented in Fig. 7. The hydroxylation state of TiO2 nanoparticles is strongly dependent on the conditions and methods of their preparation. It has been observed that the presence of free hydroxyl groups on the surface of TiO2 plays an important role in the catalyst activity due to their ability of transferring the photogenerated charge species during photocatalytic activity (Xu et al., 2008a). The broad peak at 3420 cm−1 is attributed to the stretching vibration of hydroxyl groups adsorbed on the surface of titania, whereas the peak at 1640 cm−1 is considered as a characteristic peak of bending vibration of surface-adsorbed free water molecules (Xu et al., 2008a). The stronger vibrations were detected in P-TiO2 and PF-TiO2 nanoparticles compared with reference TiO2 and F-TiO2 nanoparticles suggesting larger adsorption of water and hydroxyl groups on the surface of P-TiO2 and PF-TiO2 catalysts. The higher adsorption of water and hydroxyl groups positively affects the photocatalytic activities of these nanoparticles (Lv et al., 2009). Additionally, an absorption peak at 1045 cm−1 was observed in P-TiO2 and PF-TiO2 nanoparticles but not in reference TiO2 and F-TiO2 samples. This peak is actually a characteristic frequency of Ti–O–P vibrations suggesting the successful doping of P atom into TiO2 lattice, in good agreement with the EDX results (Supplementary Data) (Zheng et al., 2008; Lv et al., 2009). An absorption peak at 839 cm−1 can be seen in the FTIR spectra of F-TiO2 and PF-TiO2, which is ascribed to the vibration of Ti-F bond (Vijayabalan et al., 2009).
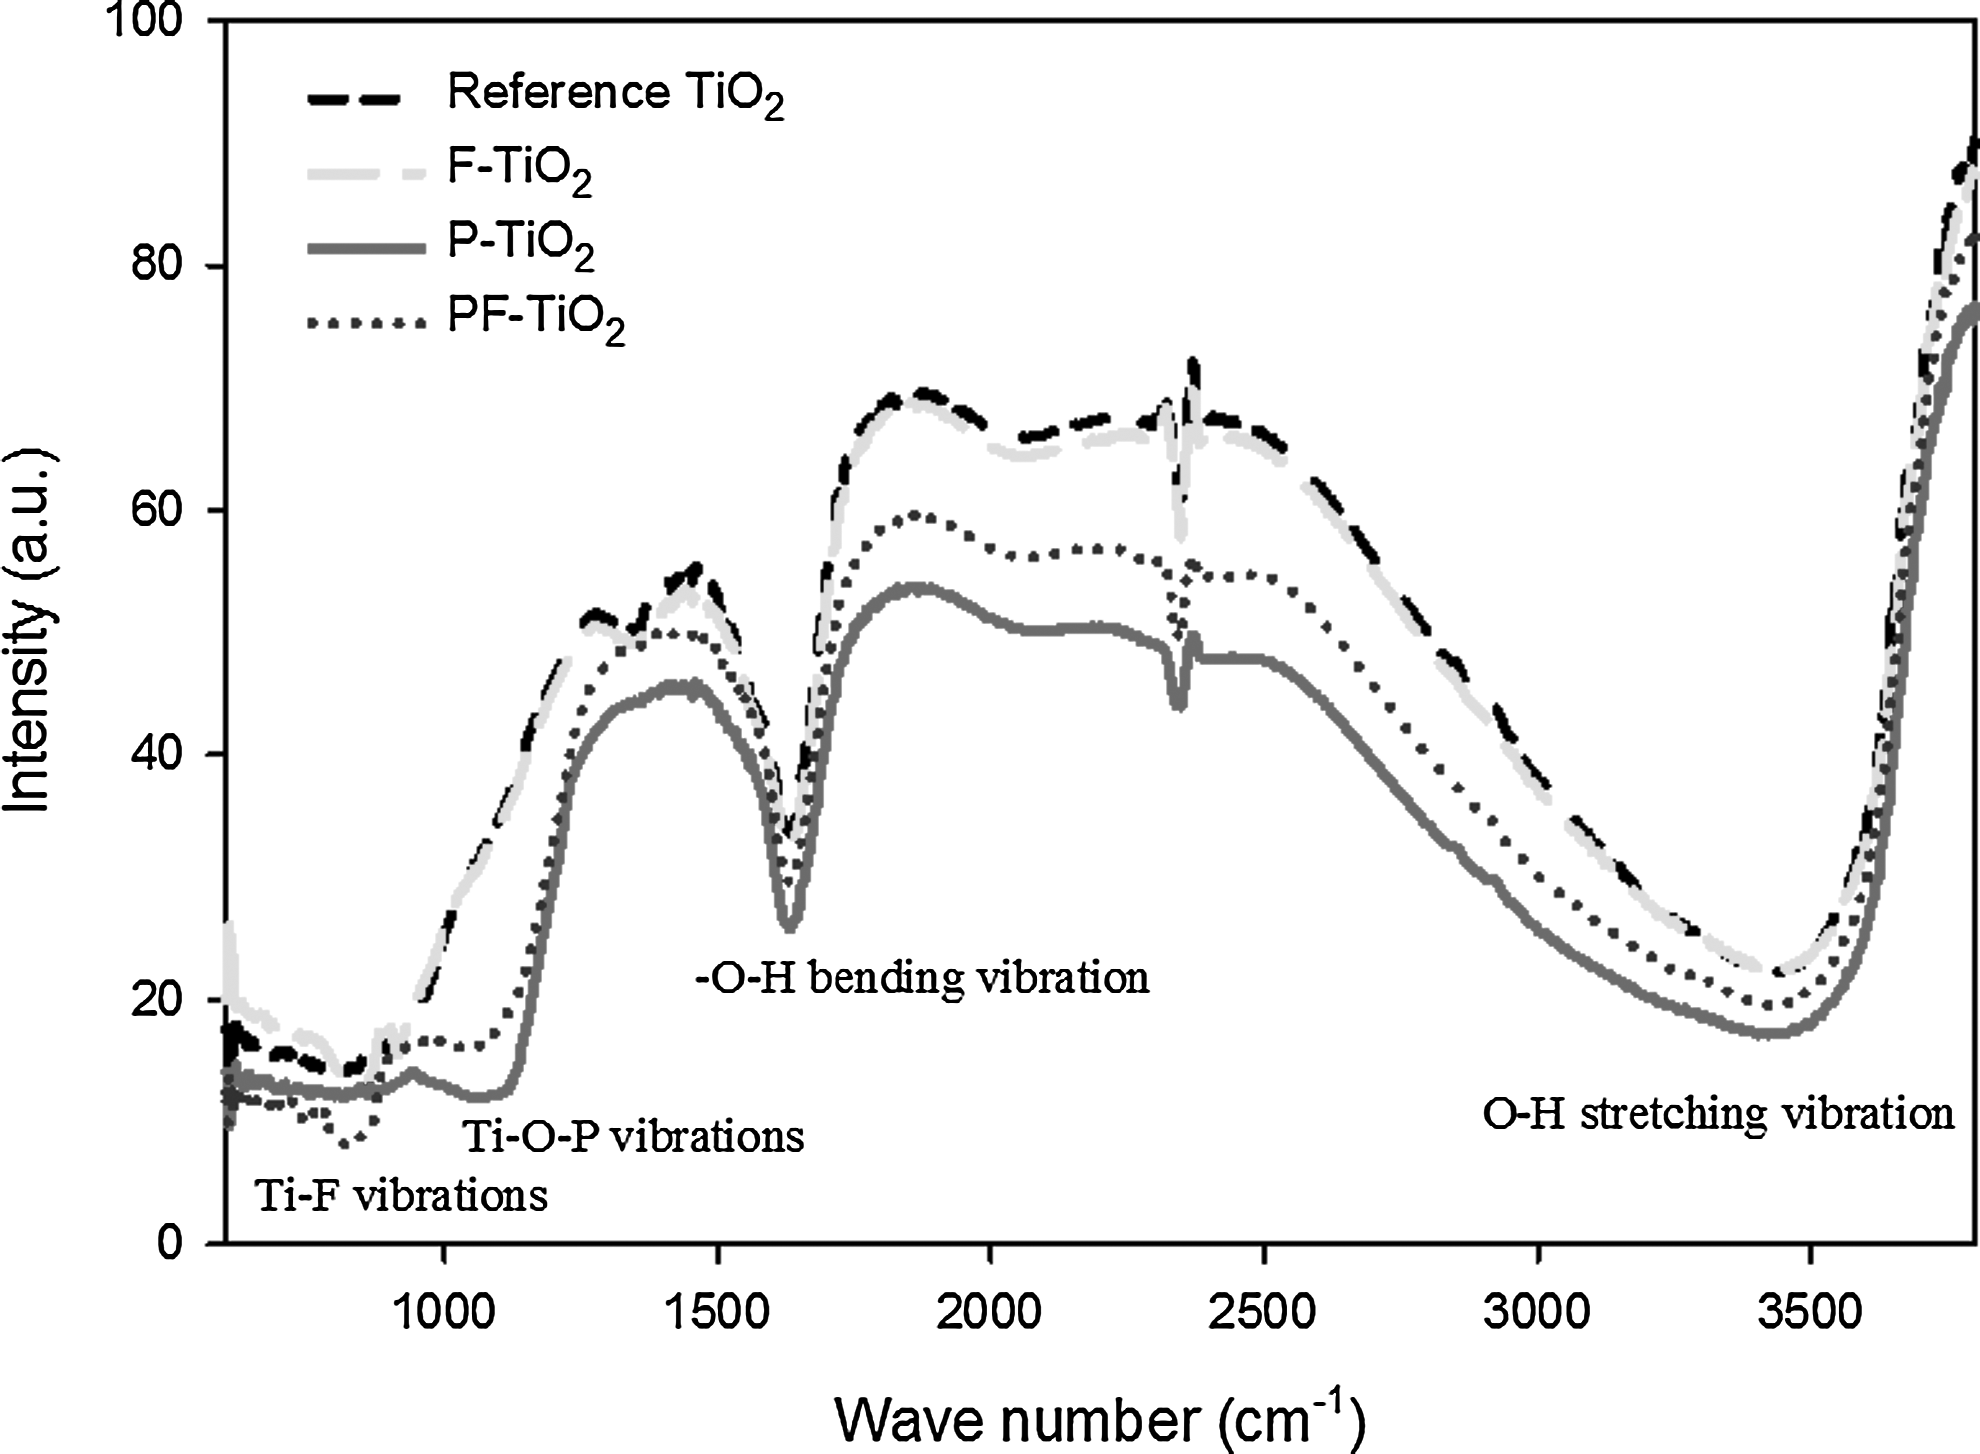
Fourier transform infrared (FTIR) spectra of PF-TiO2, P-TiO2, F-TiO2, and reference TiO2 samples.
Photocatalytic activity
Photocatalytic activity of the prepared doped and reference TiO2 samples was tested for the degradation of atrazine in aqueous solutions, under UV-visible light illumination. Results obtained from photocatalytic degradation study are presented in Fig. 8a and b. Figure 8a showed that no significant photolytic degradation of atrazine under UV-visible light was observed after 6 h irradiation, implying its persistent nature to UV-visible light under the mentioned experimental conditions. In addition, the adsorption of atrazine on PF-TiO2 (Fig. 8) and also on reference TiO2, F-TiO2, and P-TiO2 (data not shown) is negligible. Under light irradiation, F-TiO2, P-TiO2, and PF-TiO2 showed high pollutant removal efficiency compared with reference TiO2. The observed degradation rate constant (kobs) for atrazine was calculated as 1.1×10⁻³, 1.8×10⁻³, 3.8×10⁻³, and 5.0×10⁻³ min−1 for reference TiO2, F-TiO2, P-TiO2, and PF-TiO2, respectively. These results confirmed that high pollutant removal rate can be obtained when both P and F were doped into TiO2 crystal lattice confirming the synergistic effect of these dopants. The higher kobs for PF-TiO2 can be attributed to the higher amounts of surface-adsorbed free water and hydroxyl groups in addition to the relatively small crystal size of the PF-TiO2 nanoparticles. It has been found that the photoinduced holes can attack surface-adsorbed water molecules and hydroxyl groups, which results in the formation of hydroxyl radicals (Ding et al., 2000; Yu et al., 2010; Elghniji et al., 2012). The photodegradation mechanism of atrazine is supposed to take place in accordance with a well-established mechanism. The photocatalytic activation of semiconductor catalysts is due to the formation of positive holes in the valence band along with the corresponding excited electrons in the conduction band as can be shown by the following reaction (Yao et al., 2010):

where e−cb and h+vb are the electrons in the conduction band and positive holes in the valence band, respectively.
Both these photoinduced species have the potential to initiate several redox reactions with other entities present on the surface of photocatalyst. The various chemical reactions in UV-visible light illuminated atrazine (ATZ) solutions containing photocatalyst are summarized below (Xiao et al., 2008; Vijayabalan et al., 2009; Yu et al., 2010):
The electron-hole production [Eq. (3)] is a reversible process and the photoinduced species may recombine following Equation (10). However, Equation (4) can slow down the recombination Equation (10). Therefore, surface-adsorbed water molecules and hydroxyl groups are considered to play a key role in the photocatalytic degradation of water pollutants by promoting the formation of hydroxyl radicals through Equations (4) and (7). The high redox potential of hydroxyl radicals (2.8 V) is responsible for their high oxidation capability toward organic pollutants, in this case atrazine (Mehrdad et al., 2011). The small crystallite size, greater surface area, more surface adsorbed free water and hydroxyl groups, and large pore volume of P-TiO2 and PF-TiO2 nanoparticles speed up the transfer of surface charge carriers, decreasing recombination of electron-hole pairs, and consequently enhancing the photocatalytic activity compared with reference TiO2 and F-TiO2 nanoparticles (Hoffmann et al., 1995; Elghniji et al., 2012).
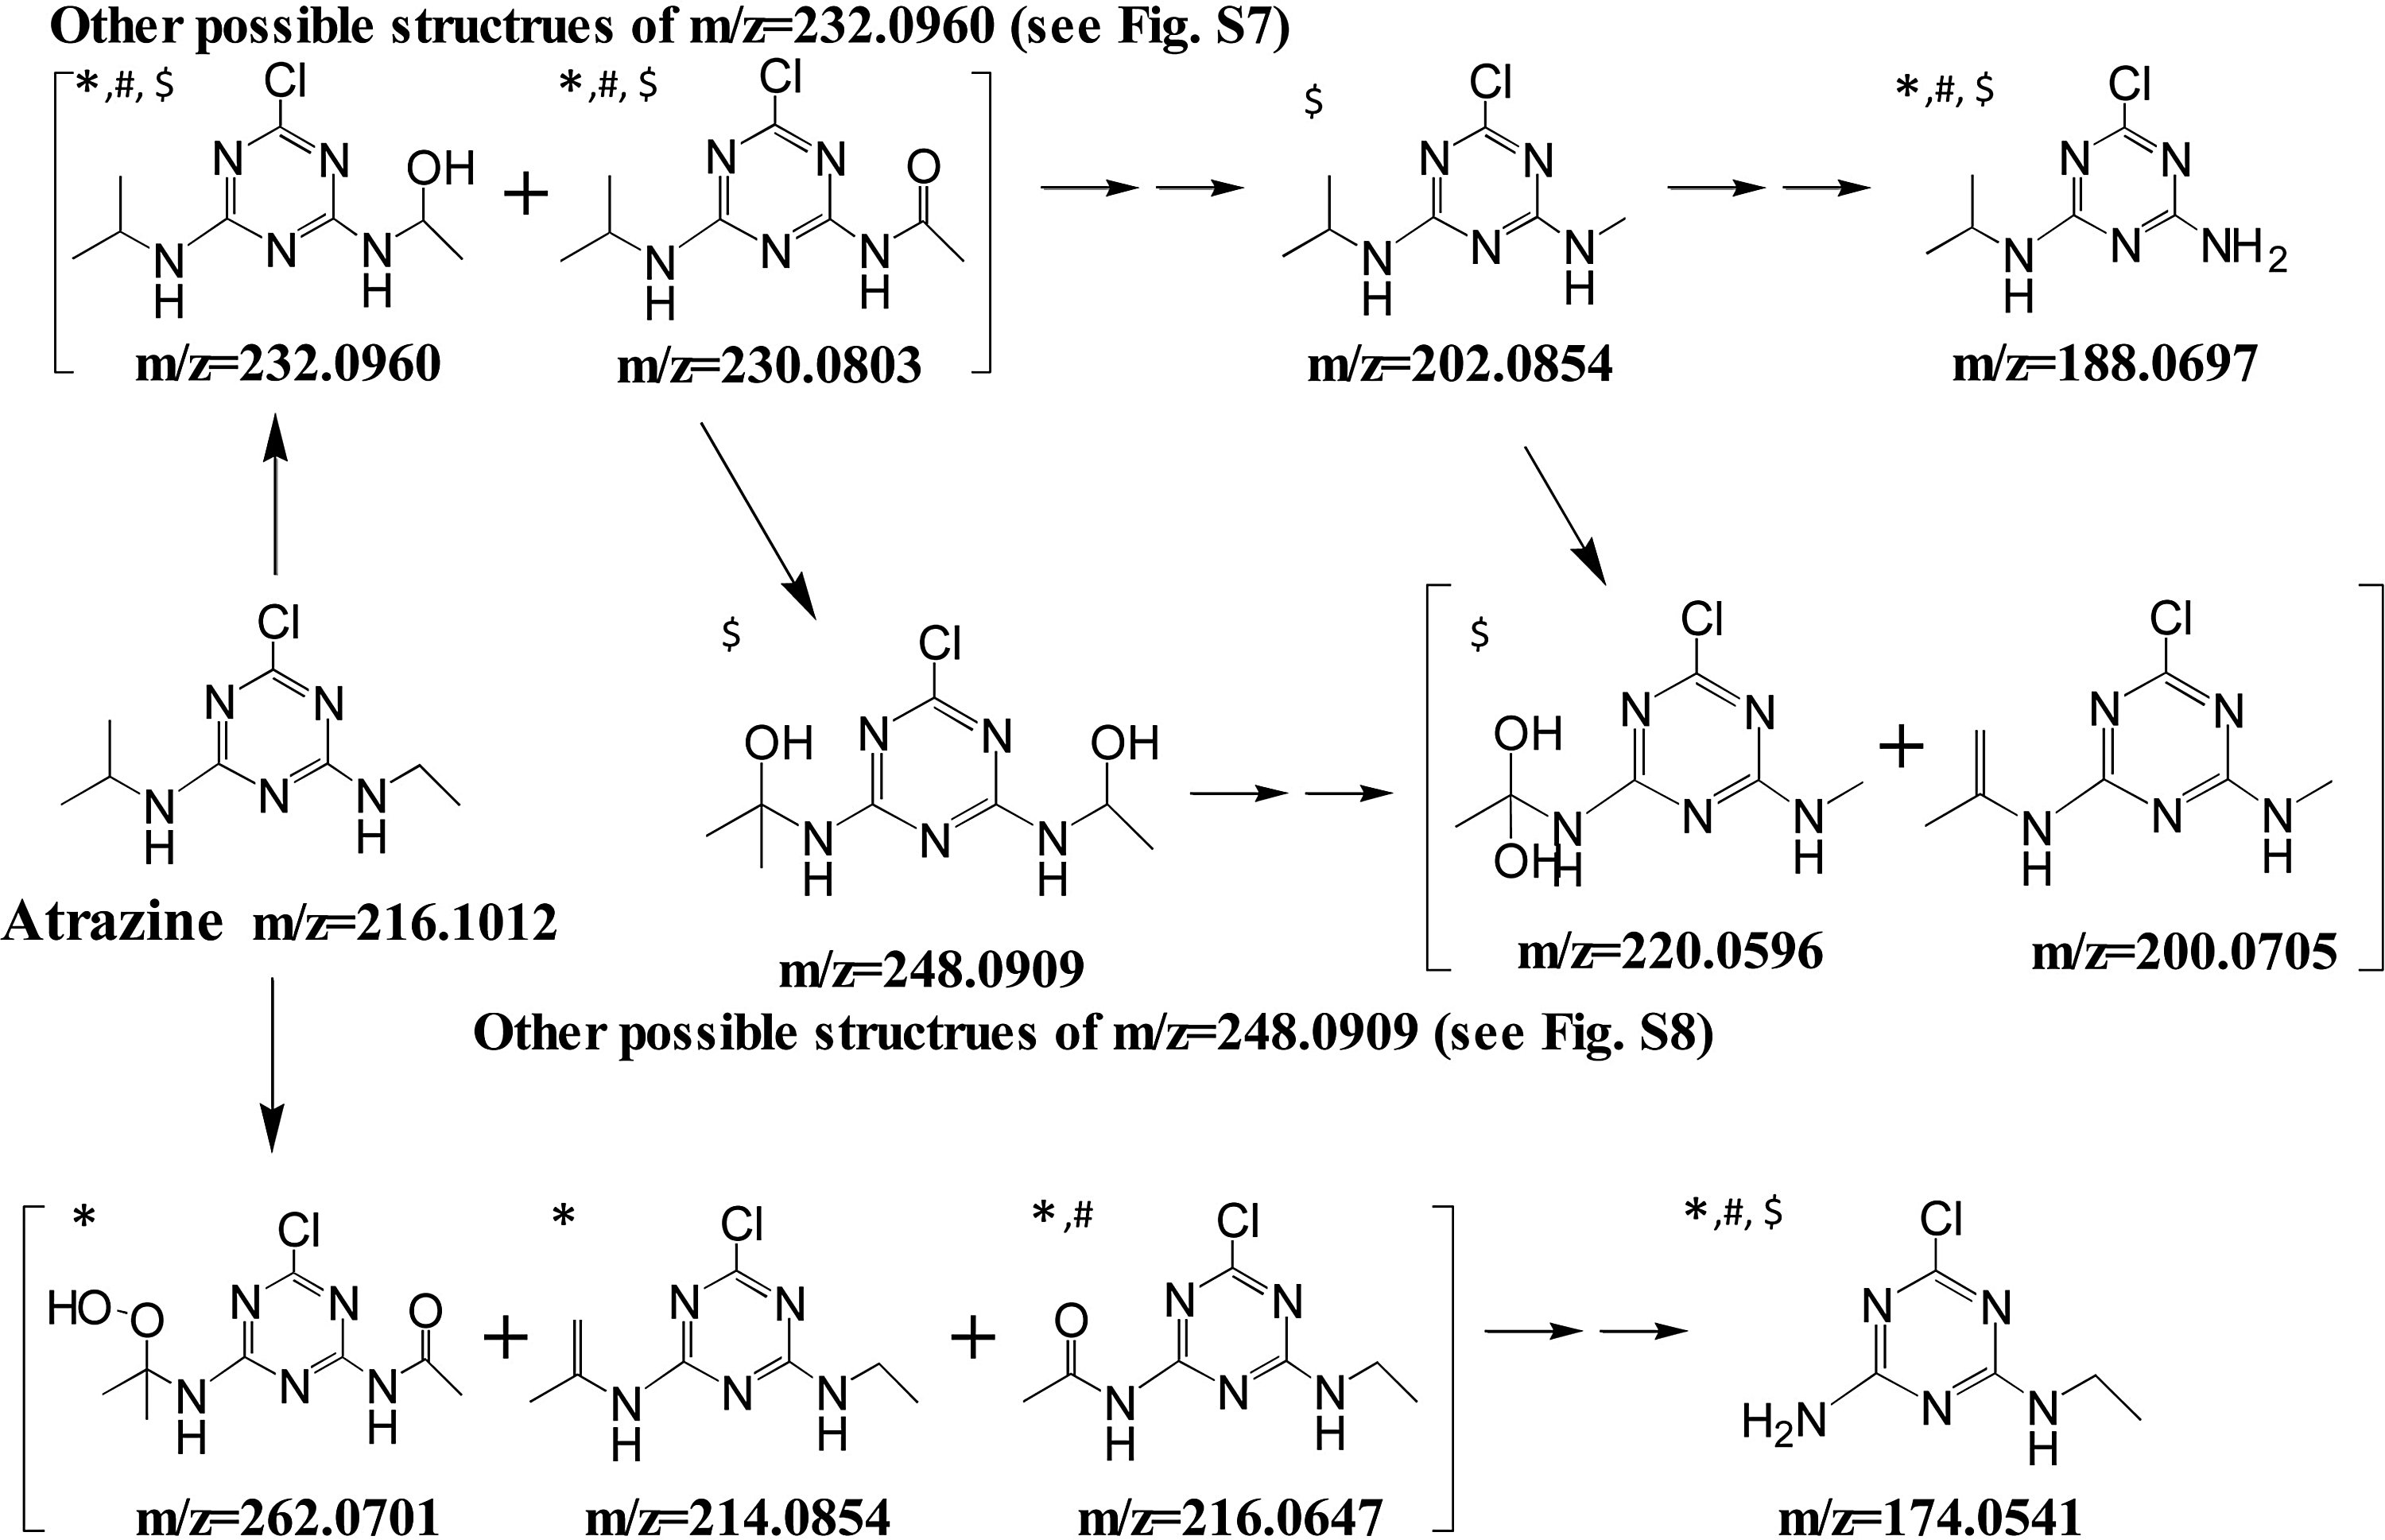
In addition to the investigation of photocatalytic activity of the synthesized catalyst, the reaction intermediates were determined after 10 h of atrazine degradation using PF-TiO2 under UV-visible light illumination. During the photocatalysis of atrazine, one new intermediate (m/z=200.0705, C7H10ClN5, degree of unsaturation [DU]=5; see the tandem mass spectrometry spectra shown in Supplementary Fig. S6) and 10 intermediates reported by Andersen et al. (2013), Chan and Chu (2006), and Chen et al. (2009) were observed. We also identified the intermediate (m/z=214.0856), which was recently found by Andersen et al. (2013). However, any dechlorination and deamination products were not observed during PF-TiO2 photocatalysis and complete mineralization of atrazine did not occur. The end product of atrazine by an attack of hydroxyl radical in TiO2 photocatalysis was cyanuric acid [C3N3(OH)3] in previous reports (Pelizzetti et al., 1990; Parra et al., 2004). Table 2 summarizes the observed reaction intermediates and their m/z values. The possible decomposition pathway is provided in Fig. 9. Other possible structures of m/z=232.0960 and 248.0909 are provided in Supplementary Figs. S7 and S8, respectively.
Andersen et al. (2013), bChan and Chu (2006), or cChen et al. (2009) also reported the same reaction intermediates of atrazine which were observed in this study.
LC-Q-TOF, liquid chromatography/quadrupole time-of-flight; LC/MS/MS, liquid chromatography/tandem mass spectrometry.
Conclusion
UV-visible light activated F-TiO2, P-TiO2, and PF-TiO2 photocatalysts were successfully synthesized by an innovative sol-gel method employing a nonionic surfactant as pore directing agent and H3PO4 and NH4F as P and F sources, respectively. The experimental results obtained in the present study showed that morphological, optical, structural, and porous properties of the synthesized TiO2 particles were positively improved with doping of P and F. DRS, EDX, and FTIR results showed that both P and F have been successfully incorporated into the crystal lattice of TiO2. The anatase phase was dominant for all nanoparticles with small amounts of rutile and brookite TiO2 while marked improvement of the surface area and porosity were obtained upon P and PF-doping. The synergistic effect produced by the co-doping of TiO2 with P and F had significant enhancement in the photocatalytic degradation of atrazine compared with P or F doping alone. The enhanced photocatalytic activity of PF-TiO2 nanoparticles is attributed to its small particle size, high surface area and absorbance in UV-visible spectral region, more adsorbed free water and hydroxyl groups, and decreased electron-hole recombination. This study confirmed that PF-TiO2 photocatalysis can be considered as a feasible option with high potential for the effective decomposition of organic pollutants during water treatment processes based on UV-visible (i.e., solar) light.
Footnotes
Acknowledgments
This work was partially funded by the Cyprus Research Promotion Foundation through Desmi 2009–2010 which is co-funded by the Republic of Cyprus and the European Regional Development Fund of the EU under contract number NEA IPODOMI/STRATH/0308/09. The Higher Education Commission (HEC), Islamabad, Pakistan is also highly acknowledged for partial financial support for this project through International Research Support Initiative Program (IRSIP). C.H. is the recipient of the Graduate School Dean's Fellowship, which supports University of Cincinnati doctoral students in their final year of degree work. Mr. Joel Andersen and Ms. Geshan Zhang in Environmental Engineering and Science Program, University of Cincinnati are highly acknowledged for their expert assistance in the analysis of reaction intermediates of atrazine.
Author Disclosure Statement
No competing financial interests exist.
References
Supplementary Material
Please find the following supplemental material available below.
For Open Access articles published under a Creative Commons License, all supplemental material carries the same license as the article it is associated with.
For non-Open Access articles published, all supplemental material carries a non-exclusive license, and permission requests for re-use of supplemental material or any part of supplemental material shall be sent directly to the copyright owner as specified in the copyright notice associated with the article.