
Abstract
Abstract
Equivalent organic loading rates (OLRs) can be achieved by running high strength chemical oxygen demand (COD) slower or low strength COD faster. Comparisons of reactor performance under these conditions have not been characterized. Pilot-scale tests were conducted to assess the impact of hydraulic retention time (HRT) for fixed OLRs on reactor performance and stability in a two-stage anaerobic expanded granular sludge bed reactor. A distillery wastewater was used as the substrate at mesophilic temperature (35°C). Results showed that COD removal efficiency and biogas production rate increased by ∼33–42% and ∼22–32%, respectively, as HRTs increased by approximately five to six times, while maintaining a constant OLR (∼3, 5, 7, or 9 g COD/[L·day]). Results imply that for equivalent OLRs, better reactor performance is achieved when running high-concentration COD at a slower rate compared with a lower concentration COD at a faster rate. This also implies a diffusion limiting process where a higher molecular weight and slowly degrading organics, such as crude proteins and fats, likely are flushed through the reactor faster than they are efficiently able to diffuse into the granular biomass for digestion. The Monod model was employed to demonstrate the stability of the granular biomass behavior. The maximum specific growth rate, the half-saturation coefficient, and the death rate all remained approximately constant, indicating that biomass function and viability remained consistent over the duration of testing.
Introduction
A
UASB operates using granular biomass where diffusion is the mechanism by which soluble wastewater substrates enter the granules for digestion. To modify and enhance UASB performance, expanded granular sludge bed (EGSB) reactors have been recently developed to improve the contact between the substrate and the inoculum within the system by expanding the sludge bed and escalating the hydraulic mixing. EGSB reactors are now extensively employed (Scully et al., 2006; Zhang et al., 2008; Fang et al., 2011a, 2011b; Liu et al., 2012; Zupančič et al., 2012; Ghorbanian et al., 2014a). Even with a recirculation loop, the overall retention time is only on the order of hours. Since it is a low hydraulic retention time (HRT) system, higher molecular weight and slowly degrading organics, such as proteins and lipids, may be flushed through the reactor before they are fully degraded (Girault et al., 2011). HRT is, therefore, an important operational parameter that must be considered carefully to achieve efficient digestion relative to the organic loading. Many studies on the impact of HRT on reactor performance treating various substrates have been reported for different AD reactor configurations (Salminen and Rintala, 2002; Kim et al., 2006; Rincón et al., 2008; Espinoza-Escalante, et al., 2009; Fongsatitkul et al., 2010). However, these studies have not been performed for modern EGSB reactors nor has the impact of varying HRTs at constant OLRs been characterized. Therefore, the effect of HRT on digestion of a distillery wastewater (WW) will be studied by varying chemical oxygen demand (COD) strength and flow rate, while maintaining a constant OLR in the EGSB reactor.
In this study, pilot-scale tests were conducted to assess the impact of HRT on the digestion process in a two-stage EGSB reactor at constant OLRs at mesophilic temperature (35°C). A distillery wastewater was used as the substrate for this study, which was introduced at one of the four COD strengths (∼5, 10, 20, and 30 g COD/L). Each of the COD strengths was run at four flow rates, resulting in four OLRs (∼3, 5, 7, and 9 g COD/[L·day]). This plan allowed for the comparison of COD removal efficiency and biogas production at equivalent OLRs obtained by running either higher COD strengths fed at a slower rate or lower COD strengths fed at a faster rate. Monod kinetic parameters were compared between COD strengths to determine if intrinsic biomass function and viability remained consistent among each test.
Materials and Methods
Equipment
AD tests were performed in a two-stage pilot-scale EGSB system from Voith Paper Environmental Solutions GmbH & Co. KG, which has a target COD loading of ∼10 g/(L·day). This system processes the wastewater in two stages using two different vessels. During the first stage, the wastewater was loaded in a 45-L (total and working volume) batch preacidification (PA) tank, where 20–40% of the COD of the wastewater was preacidified naturally (without adding any reactants). The PA tank was open to the atmosphere so that any gases produced here would have escaped to the atmosphere. While in the PA tank, the temperature, pH, and nutrient concentrations (nitrogen and phosphorus) were adjusted to the desired mesophilic conditions (temperature of ∼35°C, pH of ∼5.5–7.5, and COD:N:P ratio no more than 350:5:1) (Speece, 1983). The preacidified wastewater from the stage-one PA tank was transferred under anaerobic conditions to the stage-two 60-L (total and working volume) EGSB AD reactor (schematic shown in Fig. 1).
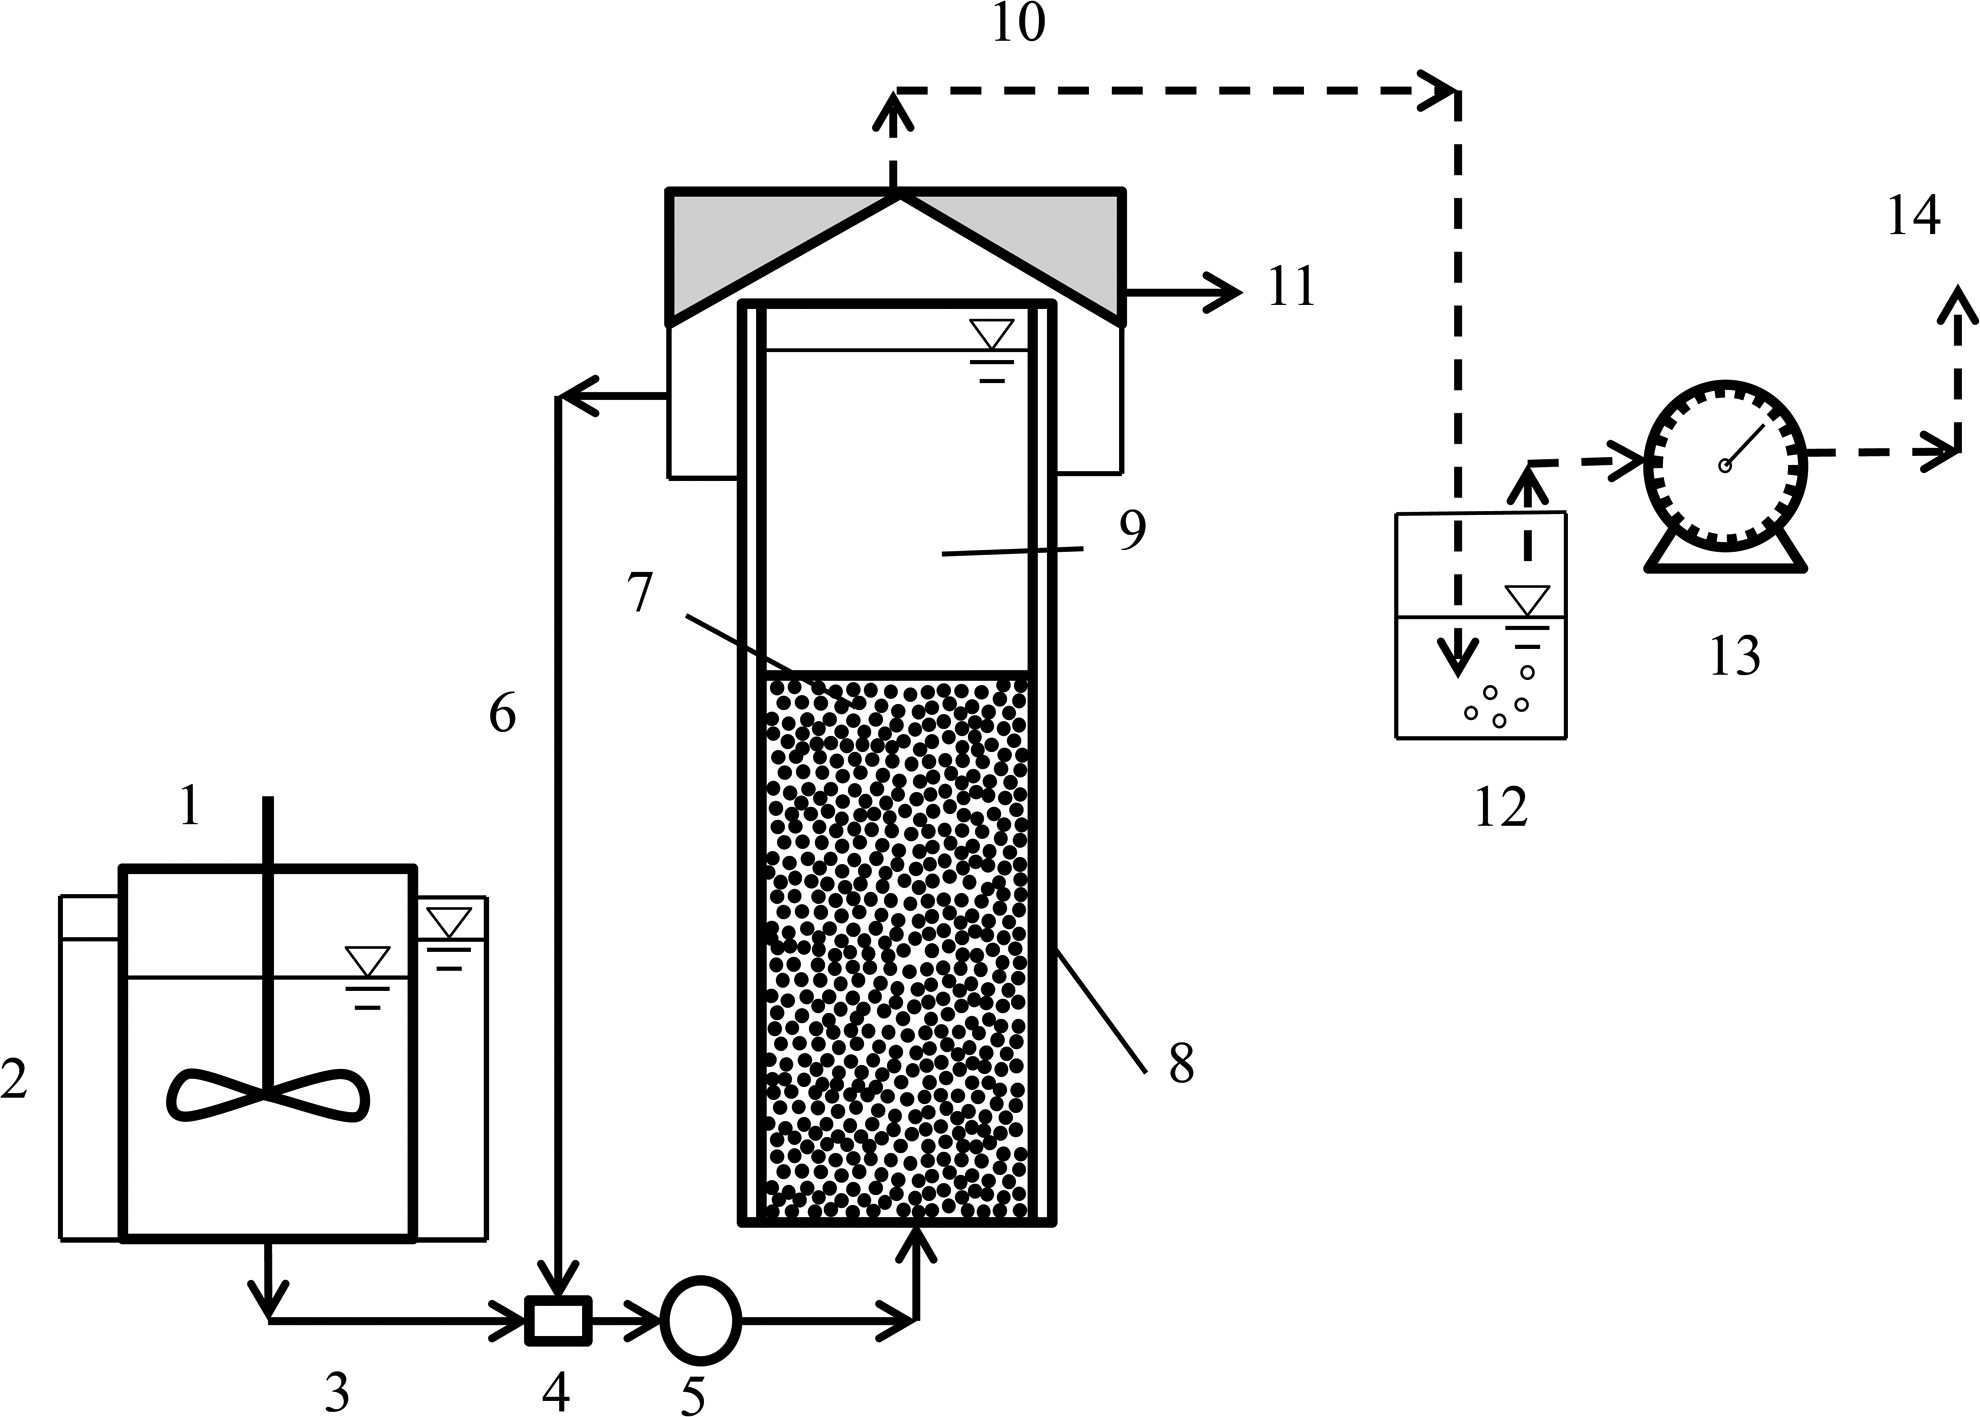
Schematic diagram of the two-stage anaerobic expanded granular sludge bed reactor system: 1, Stage-One preacidification tank; 2, heating tank/jacket; 3, feeding line; 4, connection block; 5, pump; 6, recirculation line; 7, granular biomass; 8, heating jacket; 9, Stage-Two expanded granular sludge bed digester; 10, produced biogas line; 11, effluent; 12, gas tank transparent; 13, gas meter; 14, exhaust gas.
Distillery wastewater samples (settled supernatant) were characterized before testing for pH, COD, volatile fatty acid (VFA), ammonia, TKN, sulfate, phosphorus, and solid content. pH was measured using a Accumet portable meter, model # AP85. Concentrations of COD, VFA, ammonia, sulfide, and phosphorus were measured by colorimetry using a spectrophotometer (Hach, model # DR 3900) and test vials preloaded with analytic reagents (Hach, TNT vials: 823, 832, 845, 864, 880, and 872). Total solids, total dissolved solids, and total suspended solids (TSS) were measured using standard methods from the United States Geological Survey (USGS, 1989). The fractionations of proteins, fats, and carbohydrates were reported by the wastewater supplier.
Gas analysis was performed using a SRI 8610C Gas Chromatograph (SRI Instruments, Inc.) with a HayeSep D column (Restek Corporation), and a thermal conductivity detector for methane and carbon dioxide detection; a MXT-1 column (Restek Corporation) and flame photometric detector were used for hydrogen sulfide detection.
Inoculum and substrate
Active methanogenic biomass supplied by Cargill, Inc. was inoculated in the stage-two EGSB (main 60 L reactor). The characteristics of the biomass were pH=∼7; TSS=61 g/L; and volatile suspended solid (VSS)=52 g/L. The substrates pulled from production lines were provided by a distillery plant located in Louisville, KY. The characteristics of the distillery wastewater are summarized in Table 1. All tests were run with the supernatant substrate (distillery wastewater) after settling.
TSS in the wastewater was less than 150 mg/L, which has been reported as the upper limit that is not harmful to biomass granules (Mulder and Thomas, 2003). The COD:N:P ratio present in the substrate here was ∼226:5:1, which is sufficient to treat this wastewater anaerobically.
Experimental procedure
Supernatant from settled distillery wastewater was loaded into the PA tank for preacidifying the wastewater and for pH, temperature, and nutrient adjustment. The wastewater was retained in the PA tank for ∼24 h (constant retention time), where 20–40% of the initial COD was converted to VFAs, an intermediate product before methane formation. The temperature was maintained between 32°C and 38°C, and the pH was adjusted to the required range of 5 or greater, which was chosen based on the acclimation behavior of this specific (distillery) wastewater, by adding caustic (NaOH) in the PA tank. For this particular wastewater, there was sufficient amount of nitrogen and phosphate (Table 1), so these did not require adjustments.
The main 60-L EGSB AD reactor was seeded with 45 L of the active fresh biomass. The wastewater (with no dilution) was fed to the AD reactor with a constant flow rate (∼0.2–0.3 L/h) for ∼20 days to stabilize and acclimate the biomass to the substrate. To enhance mixing and conversion efficiency, 30% of the feed passing through the main reactor was recycled using the recirculation line. Tests were then run for four COD strengths, each of which were run at four volumetric flow rates to yield four OLRs. Each test was run for a duration of ∼1–2 HRTs. The desired HRTs were calculated based on the volume of the main reactor and fresh influent only (exclusive of recycle). For HRTs of less than 3 days, the testing was run for about 5 days to ensure a steady state, which was determined based on COD and VFA measurements. The wastewater was diluted with tap water to obtain each COD concentration.
During testing, gas production, COD, and VFA concentrations were measured every 24–48 h. Approximately 15 to 20 data points were collected per test case. MS Excel was used for both statistical analyses and linear regression for kinetic modeling. COD strengths and OLRs are summarized in Table 2.
COD, chemical oxygen demand; OLR, organic loading rate.
Results and Discussion
Reactor performance
Temperatures in the PA tank and the EGSB were maintained within the range of 32–38°C and 31–33°C, respectively. pH in the PA tank and the EGSB effluent were ∼5.5 and ∼7.0, respectively. The temperature and pH indicate that the reactor operated normally within the desired mesophilic range.
PA during stage one, where some of the COD converts naturally to VFAs (intermediate products between COD conversion to methane), increases the stability in the main EGSB reactor (stage two) since a sudden increase in the OLR there would cause an accumulation of VFAs, since the acetogens grow at a slower rate than the acidogens (Wang et al., 2010). The degree of preacidification (PA degree) during the first stage is determined by
where CODPA (g/L) is the COD concentration leaving the PA tank and entering the main digester, and CODin (g/L) is the initial COD concentration of the wastewater loaded in the PA tank. Applying this to case 2D as an example (see Table 3), the initial COD of the wastewater in the PA tank was 19.6 g/L (CODin); the COD reduced to 14.7 g/L (CODPA) following the PA period. The VFA concentration increased from 1.6 to 6 g/L during this same period. The PA degree in this example is 25%, indicating that 25% of the initial COD was converted to VFAs.
HRT, hydraulic retention time.
PA degree was always between 23% and 32% (Table 3), which was within the desirable 20–40% range as stated by the manufacturer. Means, standard deviations, and coefficient of variations, which is the ratio of the standard deviation to the mean, were calculated for each column, as shown in Table 3.
Another important characteristic is the VFA concentration of the EGSB effluent, which reflects the acidity and the VFA consumption by methane forming bacteria in the main reactor. VFA concentrations of the effluent remained consistent (<0.15 g/L) and ranged from 0.05 to 0.12 g/L over the duration of the study indicating stability and normal operation of the reactor. Over the four different test cases, the standard deviations were between 0 and 0.02 g/L and coefficient of variations between 7% and 24%.
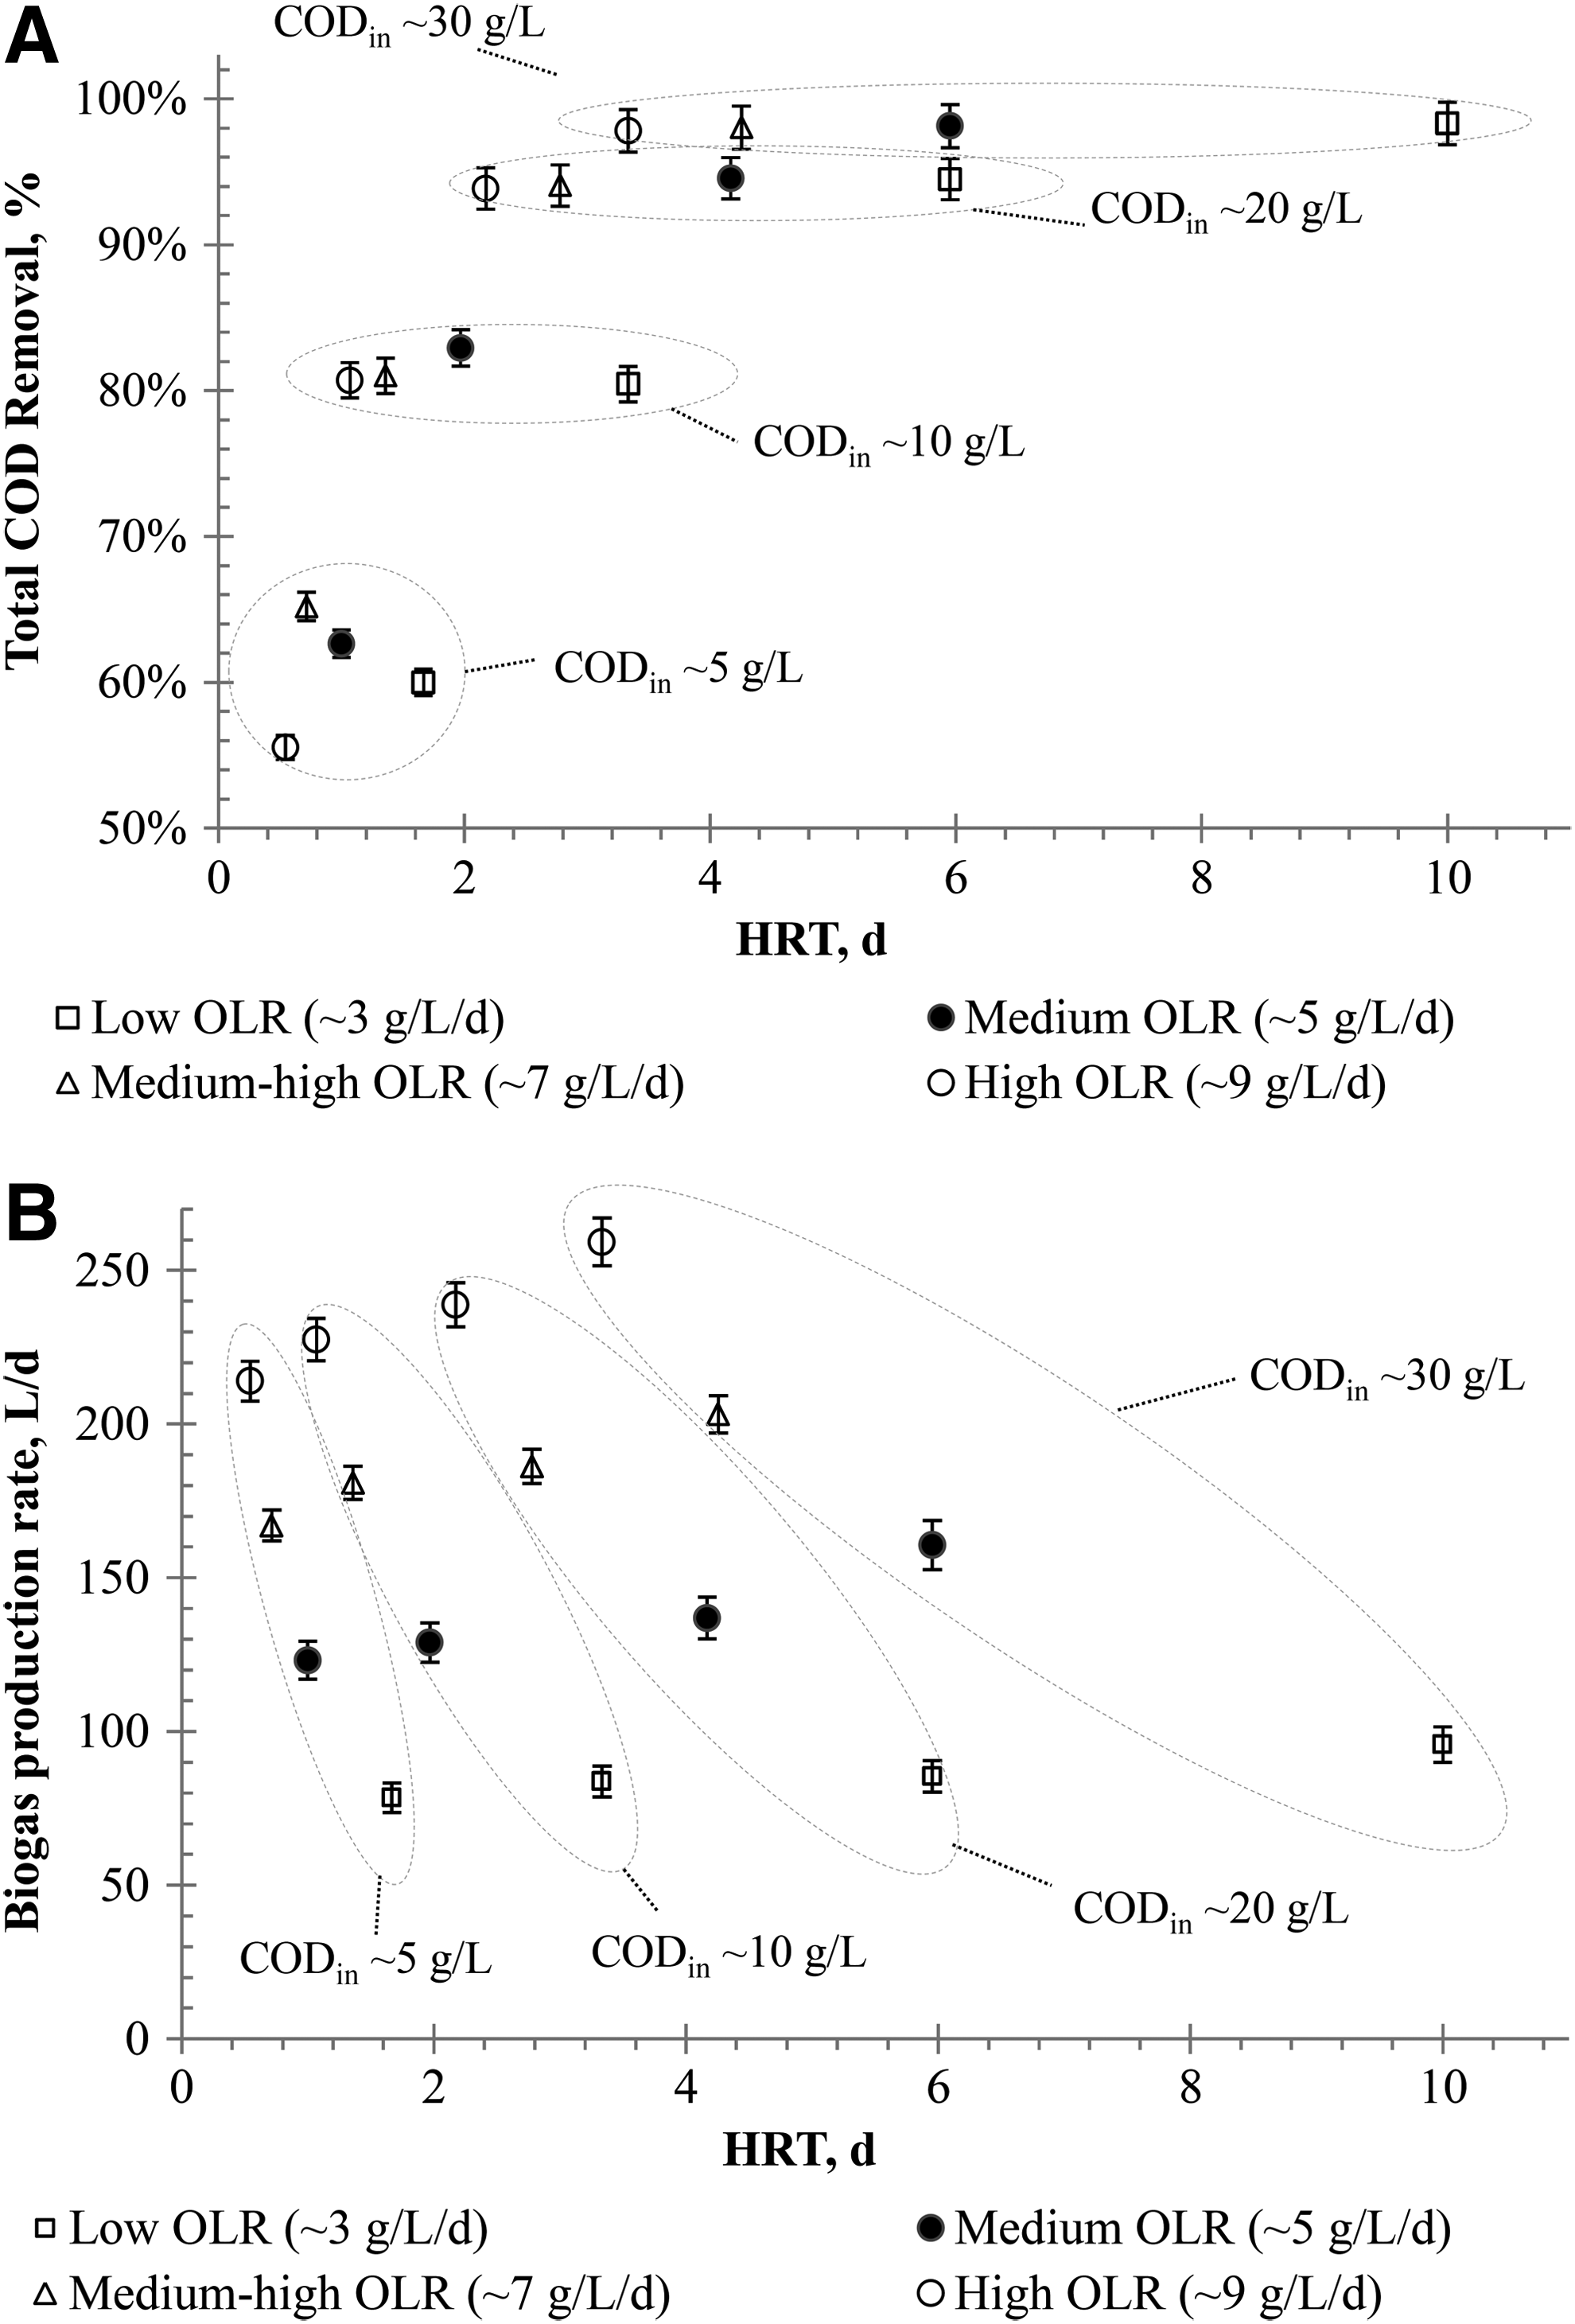
Total COD removal efficiency increased significantly as HRT increased, while maintaining constant OLRs (∼3, 5, 7, or 9 g COD/[L·day]) (Fig. 2A). At low OLRs (∼3 g COD/[L·day]), the removal efficiency increased from 60% to 98% as HRT increased from 1.6 to 10 days; for medium OLR (∼5 g COD/[L·day]), the removal efficiency increased from 63% to 98% as HRT increased from 1 to 5.9 days; for high–medium OLR (∼7 g COD/[L·day]), the removal efficiency increased from 65% to 98% as HRT increased from 0.7 to 4.3 days; for the highest OLR (∼9 g COD/[L·day]), the removal efficiency increased from 56% to 98% as HRT increased from 0.5 to 3.3 days. Increases in removal efficiency were well outside the ranges of all error bars, which were based on standard deviations. Furthermore, coefficients of variation were between 0.4% and 6%, indicating that COD removal efficiency was consistent in each case. These results clearly demonstrate that, for equivalent OLRs, higher COD removal is achieved when running high concentration COD at a slower rate compared with a lower concentration COD at a faster rate. Nearly 40% of the wastewater stream used here consisted of crude proteins and fats (Table 1), which are higher molecular weight and slowly degrading organics, which for lower HRT at the same OLR likely did not efficiently diffuse into the granular biomass. Proteins and fats have been reported as likely to require a longer HRT or may flush through a reactor without being digested (Girault et al., 2011).
Total COD removal efficiency
For equivalent COD concentrations entering the EGSB, removal efficiencies were about equal for all HRTs studied. For example, for 30 g/L influent COD content, as the HRT decreased and flow rate increased, the removal efficiency remained ∼98%. The trend held for all COD concentrations. The implication is that a given COD concentration can be fed more quickly through the EGSB reactor without losing conversion efficiency. The ability to increase the feed rate (and lower HRT) will likely last until it reaches the destabilization point where the reactor becomes overloaded with the intermediate VFA due to failure during acetogenesis and methanogenesis. At that point, the system will become acidified, the pH drops, and removal efficiency and biogas production will decrease (Salminen and Rintala, 2002; Rincón et al., 2008).
Biogas production trends mirrored COD removal trends (Fig. 2B). The biogas production rate increased by ∼22–32% as HRTs increased by approximately five to six times while maintaining constant OLRs (∼3, 5, 7, and 9 g COD/L·day). In the case of a low loading rate (∼3 g COD/L·day), the biogas production rate increased from 78 to 96 L/day as HRT increased from 1.6 to 10 days; for the medium loading case (∼5 g COD/L·day), the biogas production rate increased from 123 to 161 L/day as HRT increased from 1 to 5.9 days; for the medium–high loading rate (∼7 g COD/[L·day]), the biogas production rate increased from 167 to 203 L/day as HRT increased from 0.7 to 4.3 days; for the high loading case (∼9 g COD/[L·day]), the biogas production rate increased from 214 to 259 L/day as HRT increased from 0.5 to 3.3 days.
For equivalent COD concentrations entering the EGSB, as the OLR increased from ∼3 g COD/(L·day) to ∼9 g COD/(L·day), the biogas production rate increased ∼2.4–2.8 times due to the higher substrate feeding rate. As an example, for a COD concentration of 20 g/L, as the OLR increased from 3.2 g COD/(L·day) to 9 g COD/(L·day), the biogas production rate increased from 85 to 239 L/day, an increase of ∼2.8 times. The more significant finding here is that biogas quality remained similar for all cases as methane, carbon dioxide, and hydrogen sulfide percentages remained within a small range of each other. The methane content for all cases was between ∼71–76% (coefficient of variation of 0.4–2%), the carbon dioxide content was between ∼24–29% (coefficient of variation of 0.4–1.8%), and the hydrogen sulfide content was between 0.04% and 0.9% (coefficient of variation of 0.3%).
Kinetic analysis of biomass stability
For an up-flow sludge bed reactor, the rate of change of biomass in the system can be expressed as follows (Hu et al., 2002; Sponza and Uluköy, 2008):
where Q is the flow rate (L/day); V is the volume of the reactor (L); X0 and X are the concentrations (g VSS/L) of the biomass in the influent and the effluent of the reactor, respectively; and k and Kd are the specific growth rate (per day) and death rate constant (per day), respectively. By assuming that the concentration of the biomass in the reactor remains constant at steady state, dX/dt=0, and defining the HRT (θ) as the ratio of reactor volume (V) to the flow rate of the influent (Q), Equation (2) reduces to as follows:
The specific growth rate can be expressed by the Monod model, which can be applied to AD (Hu et al., 2002; Young and Cowan, 2004; Sponza and Uluköy, 2008) as follows:
where S is the COD concentration (g/L) in the effluent, km is the maximum specific growth rate (per day), and Ks is the half-saturation coefficient (g/L). Setting Equation (3) equal to Equation (4) as follows:
which can be inverted and linearized to give the following:
The rate of change in substrate concentration in the system can be expressed as follows:
where Y is the yield coefficient (g VSS g/COD) and S0 is the influent COD concentration (g COD/L). Under steady-state condition (−dS/dt=0), substituting Equation (3) into Equation (7) and rearranging gives the following:
First, Y and Kd were determined from the slope and intercept of a plot of (S0–S)/θX versus 1/θ in Equation (8). Then, Kd was used in Equation (6) and km and Ks were determined from the slope and intercept of a plot of θ/(1+θKd) versus 1/S. The R2 values ranged from ∼0.95 to 0.99 for obtaining all constants from the plots. All kinetic constants are summarized in Table 4.
The±values are based on the coefficient of variations (%) obtained for COD concentrations in each case in Table 3.
Values of km, Ks, and Kd remained either constant when considering the range of error, or at the very least within a narrow range throughout all the tests: km remained between 0.033±0.004 and 0.038±0.006/day, Ks between 0.66±0.08 and 0.69±0.11 g/L, and Kd between 0.009±0.001 and 0.013±0.002/day. Furthermore, for each COD strength, km was always three to four times the value of Kd. HRT and OLR were shown to be important operational parameters affecting substrate removal and biogas production. The constant or narrow range of biomass-specific kinetic parameters demonstrates biomass stability over the duration of the study, thereby allowing changes in digestion characteristics to be solely attributed to HRT and OLR.
Conclusion
The COD removal efficiency and biogas production rate increased by ∼33–42% and ∼22–32%, respectively, as HRTs increased by approximately five to six times while maintaining a fixed OLR (∼3, 5, 7, and 9 g COD/[L·day]). A better reactor performance was achieved when running high COD concentrations at a slower rate compared with lower COD concentrations at a faster rate for equivalent OLRs. These results imply a diffusion limiting process where higher molecular weight and slowly degrading organics, such as crude proteins and fats, are not able to efficiently diffuse into the granular biomass to be digested before exiting the reactor. The Monod model was employed to verify the stability of the granular biomass behavior throughout the duration of the testing. The maximum specific growth rate, km, the half-saturation coefficient, Ks, and the death rate, kd, all remained approximately constant, indicating biomass stability and that improvements in COD digestion and biogas production were attributed to differences in HRT and OLR.
Footnotes
Acknowledgments
The authors acknowledge financial support from the University of Louisville and Conn Center for Renewable Energy Research, as well as material support from Brown-Forman, Louisville, KY. The authors also want to thank Dr. Mahendra Sunkara of the Conn Center for Renewable Energy Research, University of Louisville and Dr. James C. Young, General Manager, of EnviTreat, LLC (Springdale, AR) for guidance during this project.
Author Disclosure Statement
No competing financial interests exist.