
Abstract
Abstract
Flowback water is the solution that returns to the surface following completion of the hydraulic fracturing process during natural gas extraction. This study examines and analyzes the constituents that make up flowback waters collected from various drilling sites in Marcellus shale formation in the states of Pennsylvania, New York, and West Virginia. Flowback sampling data were collected from four different sources (the Environmental Protection Agency, Gas Technology Institute; Pennsylvania Department of Environmental Protection; Bureau of Oil and Gas Management; and the New York Department of Environmental Conservation) and compiled into one database with a total of 35,000 entries. Descriptive statistical analysis revealed high concentrations of chlorinated solvents, disinfectants, dissolved metals, organic compounds, radionuclides, and total dissolved solids. A one-way ANOVA test revealed that over 60% of the constituents tested displayed significant differences (significance level=0.05) in mean concentrations among the four data sources. Relative prioritization scores were developed for 58 constituents by dividing observed mean concentrations by the maximum contamination level (MCL) guidelines for drinking water. The following constituents were found to have mean concentrations over 10 times greater than the MCL: barium, benzene, benzo(a)pyrene, chloride, dibromochloromethane, gross alpha, iron, manganese, radium, and thallium. Concentrations of anthropogenic chemicals are tightly correlated with each other, but not with chloride concentrations, and not with naturally occurring inorganics and radionuclides.
Introduction
C
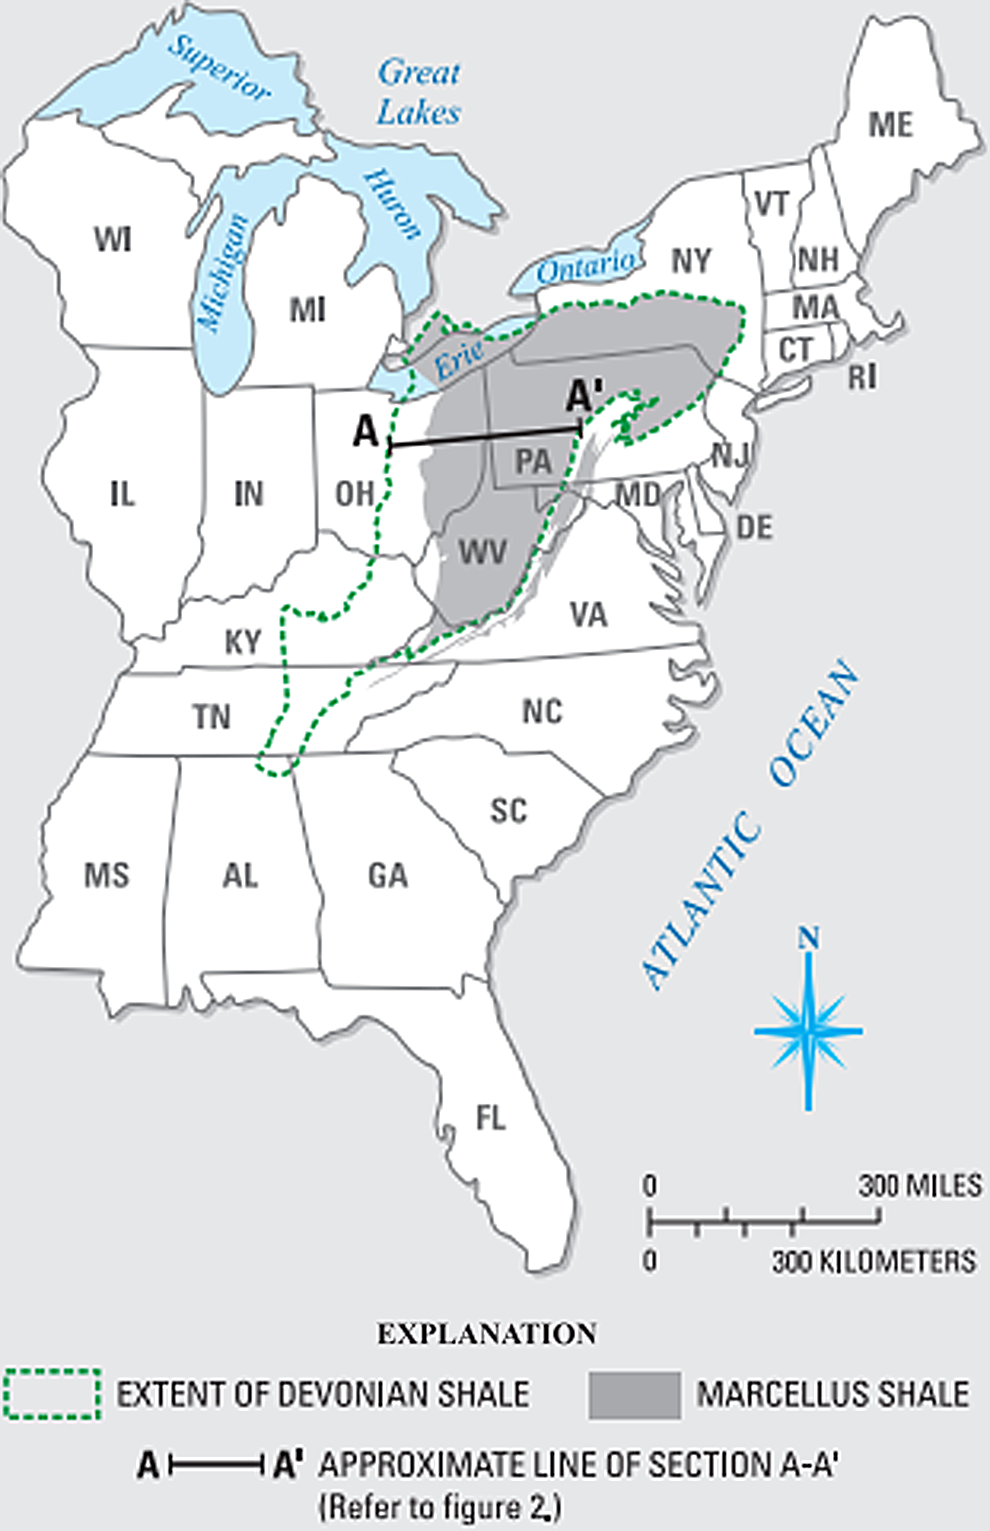
Extent of Marcellus shale formations in northeast United States (Soeder and Kappel, 2009).
Hydraulic fracturing and horizontal drilling processes require large volumes of water (2–5 million gallons of water for each operation) along with sand and chemical additives (Clark et al., 2013). A portion of this volume is collected as it flows back to the surface following hydraulic fracturing due to the release in underground pressure (Soeder and Kappel, 2009). Flowback water is commonly defined as the water that is released within the initial 2 weeks following the completion of the hydraulic fracturing process (American Petroleum Institute, 2010). Production water, however, is the naturally occurring water within the shale formation that flows to the surface throughout the lifespan of a well once it has gone into production (Schramm, 2011).
Understanding the chemical composition of flowback water and the types of constituents that may be present in it is an important issue in order to develop appropriate treatment processes for this waste and to understand the health and environmental impacts of accidental exposures to the fluid. Generally, flowback fluids contain the initial fracturing fluid that is pumped into the well, as well as a variety of constituents dissolved from the geologic formation being fractured. Thus, the fracturing fluid composition may vary from one well operation to the next based on the geological formation (NYSDEC, 2011). Fracturing fluid is composed primarily of water, which is typically between 80% and 90% of the fluid by weight, along with 10–20% by weight of a proppant, often sand, zirconium oxide, or ceramic varying in particle size. The remaining additives typically constitute ∼0.5–2% of the fracturing fluid (Aminto and Olson 2012; EPA, 2012). The additives may include varying percentages of the following: acid, breaker, biocide, corrosion inhibitor, friction reducer, gelling agent, iron control, scale inhibitor, and surfactant (NYSDEC, 2011; Aminto and Olson 2012). Approximately 10–30% of the fracturing fluid will return to the surface as flowback water (EPA, 2012). In addition, naturally occurring salts, radioisotopes, and other elements will appear in flowback water if there is mixing between the fracturing fluid and the brine present in the formation (Alley et al., 2011; Zhang et al., 2014). Other compounds may form due to reactions between the additives and substances within the shale formation (NYSDEC, 2011).
Many of the additives serve specific functions to the drilling process. Gels are typically added in order to increase viscosity and reduce fluid losses, while acids act to clear cement debris from the wellbore and dissolve carbonate minerals to provide an open conduit (PA DEP BOGM, 2010). Biocides are used to prevent microbial growth that may contaminate the methane gas or reduce well permeability. Surfactants are used to increase the fluid recovery by reducing the tension between the fluid and surrounding materials (Kargbo et al., 2010).
Balaba and Smart (2012) suggest that flowback waters and brines may be composed of high concentrations of various constituents, such as arsenic, barium, strontium, selenium, magnesium, manganese, sulfates, and radionuclides. Their concentrations have wide ranges, with sodium (50–40,000 ppm), chloride (5,000–80,000 ppm), and barium (50–9,000 ppm), and total dissolved solids (1,000–150,000 ppm) having particularly high concentrations. The variability in concentrations depends on the different regional shale composition and the different chemical additives used in the fracturing fluid, which give the fluid a high ionic strength allowing it to form different compounds in the process (Balaba and Smart, 2012; Shaffer et al., 2013).
Several studies have been conducted in an attempt to characterize the constituents that are found in flowback water from numerous locations across the Marcellus shale region. In 1985 Dresel and Rose (2010) sampled brines from 40 wells in western Pennsylvania and reported results for 22 constituents found in those brines. Mean concentrations for several constituents, such as Ra-226 (2,200 pCi/L), Cl (102,000 mg/L), and Ba (900 mg/L), were found to be greater than allowable EPA drinking water standards. Additionally, the researchers found concentrations of iron in the brines, which had a mean of 200 mg/L, to be a function of steel corrosion in the gas wells (Dresel, 1985; Dresel and Rose, 2010).
Blauch et al. (2009) collected more than 100 flowback samples over 18 months from both the southwestern and northeastern regions of the Marcellus shale play in order to address the issue of high salinity from flowback water. Concentrations of chloride up to 100,000 mg/L were found, depending on the number of days after fracturing. Haluszczak et al. (2012) also conducted a study in which flowback waters and production brine samples collected from various sources were evaluated. In this analysis, concentrations of Cl ranging from 1,070 to 151,000 mg/L were found depending on the flowback day. Other constituents with high concentrations include Ra-226 (73–6,540 pCi/L), Ba (76–13,600 mg/L), Mg (22–1,800 mg/L), K (8–1,010 mg/L), and Ca (204–14,800 mg/L).
In the years after high-volume hydraulic fracturing came into widespread use in Pennsylvania, a large amount of data on flowback characteristics became available due to public and regulatory attention to the process. Prior to this study, these data had not been compiled into a single electronic database. The purpose of this study was to compile available data from different sources into a single electronic database. The database was then used (1) to characterize the chemical constituents of flowback water and production brine from 92 Marcellus shale gas wells in the states of Pennsylvania, West Virginia, and New York, and (2) to prioritize constituents based on a comparison of observed concentrations with allowable concentrations for drinking water.
Methods
Data collection
Data were compiled from four sources containing detailed chemical analysis of flowback water and production brine in Pennsylvania to develop a single database of over 35,000 observations. The sampling dates of the data range from March 2008 to December 2010. The well locations in the state of Pennsylvania are shown in Fig. 2 (Created using Google Maps–©2014 Google). Table 1 shows the number of wells, constituents, and data entries obtained from each source. Descriptions of each of the sources are as provided below.

Flowback water sample locations in Pennsylvania by county.
(1) Industry data released by the Environmental Protection Agency (EPA) from six different well operators (Atlas Resources, Cabot Gas and Oil Corp., Chesapeake Energy, Range Resources, SWEPI, and Talisman Energy). The data were released to the EPA through the Freedom of Information Act in 2011 and in compliance with Section 308 of the Clean Water Act after the EPA's Mid-Atlantic Region issued information requests to the six drilling companies that hold a majority of all the natural-gas-drilling permits in Pennsylvania. The EPA requested full disclosure of the operators' disposal and recycling procedures of wastewater generated from the hydraulic fracturing process (EPA, 2011). This data source accounts for a small proportion of the overall observations but it does cover a relatively large number of wells (20), although as a result these wells are characterized somewhat sparsely.
(2) Flowback data from 19 Marcellus horizontal-fracturing wells were released by the Marcellus Shale Coalition in a Gas Technology Institute report (Hayes, 2009). Samples were obtained from locations labeled A through S from injected water (designated as day 0) as well as after 1, 5, 14, and 90 days of flowback. Sixteen wells were scattered throughout the state of Pennsylvania, while the other three wells were located in the northern section of the state of West Virginia. The sampling results were tabulated into three categories: general chemistry, metals, and organic compounds (Hayes, 2009). This source accounts for the great majority of observations (75% of the total observations).
(3) Radiological data were obtained from the Draft Supplemental Generic Environmental Impact Statement (SGEIS) on the Oil, Gas and Solution Mining Regulatory Program from the New York State Department of Environmental Conservation (NYSDEC). The draft addresses permit and licensure for Marcellus shale drilling and hydraulic fracturing while reporting results of radiological constituents found in flowback water collected from wells located in New York State (NYSDEC, 2011). While this is a relatively small database, it provided valuable information on radionuclides, a group of contaminants of particular concern.
(4) A set of flowback water samples from Marcellus gas wells was collected by the Pennsylvania Department of Environmental Protection, Bureau of Oil and Gas Management (BOGM). Samples were collected by the DEP from various drilling sites around Pennsylvania and analyzed in DEP laboratories. All samples collected were either from active drilling sites or from the most recent flowback impoundments (PA DEP BOGM, 2010). This was the second largest source of observations, accounting for 22% of the total observations.
Analysis
Data from all four sources were compiled into one database using SPSS (IBM, Inc., Armonk, NY), an analytical statistics program, in order to perform statistical analysis. For each constituent, descriptive statistics (minimum, maximum, mean, standard deviation, and 95th percentiles) were calculated. In cases where the concentrations were not detected, the results were calculated as half of the detection limit to minimize the maximum possible error for each observation.
Maximum contamination levels (MCLs) are the maximum permissible amount of a contaminant in water that is delivered to the public established under the Federal Safe Drinking Water Act. The ratios of constituent concentrations to MCL guidelines were used in order to prioritize among the many constituents in flowback water. This provided a straightforward method of screening constituents for possible health concerns. However, exceeding an MCL is not interpreted as an indication that the constituent poses a health risk, as a plausible exposure pathway would need to be present for the constituent and attenuation of constituent concentrations after release to the environment would need to be considered.
For the highest priority constituents, defined as constituents with mean concentrations that were over 10 times greater than the allowable MCL, concentrations were then compared by county using a nonparametric analysis of variance (Kruskal–Wallis test) in order to determine whether there were any significant correlations between the mean concentrations and geographical locations. Mean concentrations for each constituent were also compared by source to determine the necessity for combining all available datasets. The highest priority constituents were then paired by sample and the Spearman's rank-order correlation coefficient was calculated in order to find any relationships between the contaminants.
Results
Tables 2–6 present summaries of the concentrations of contaminants from the collected flowback water sampling data. Results are categorized by different classes of contaminants according to the MCL guidelines: inorganic chemicals, radionuclides, secondary contaminants, synthetic organic compounds, and volatile organic compounds. The results also show a comparison between the mean concentration and the MCL for each constituent. The highlighted rows in each table represent the constituents for which the mean concentration was greater than the MCL. Figures 3–7 represent the median, 5th percentile, and 95th percentile of the concentration/MCL ratios for each constituent.
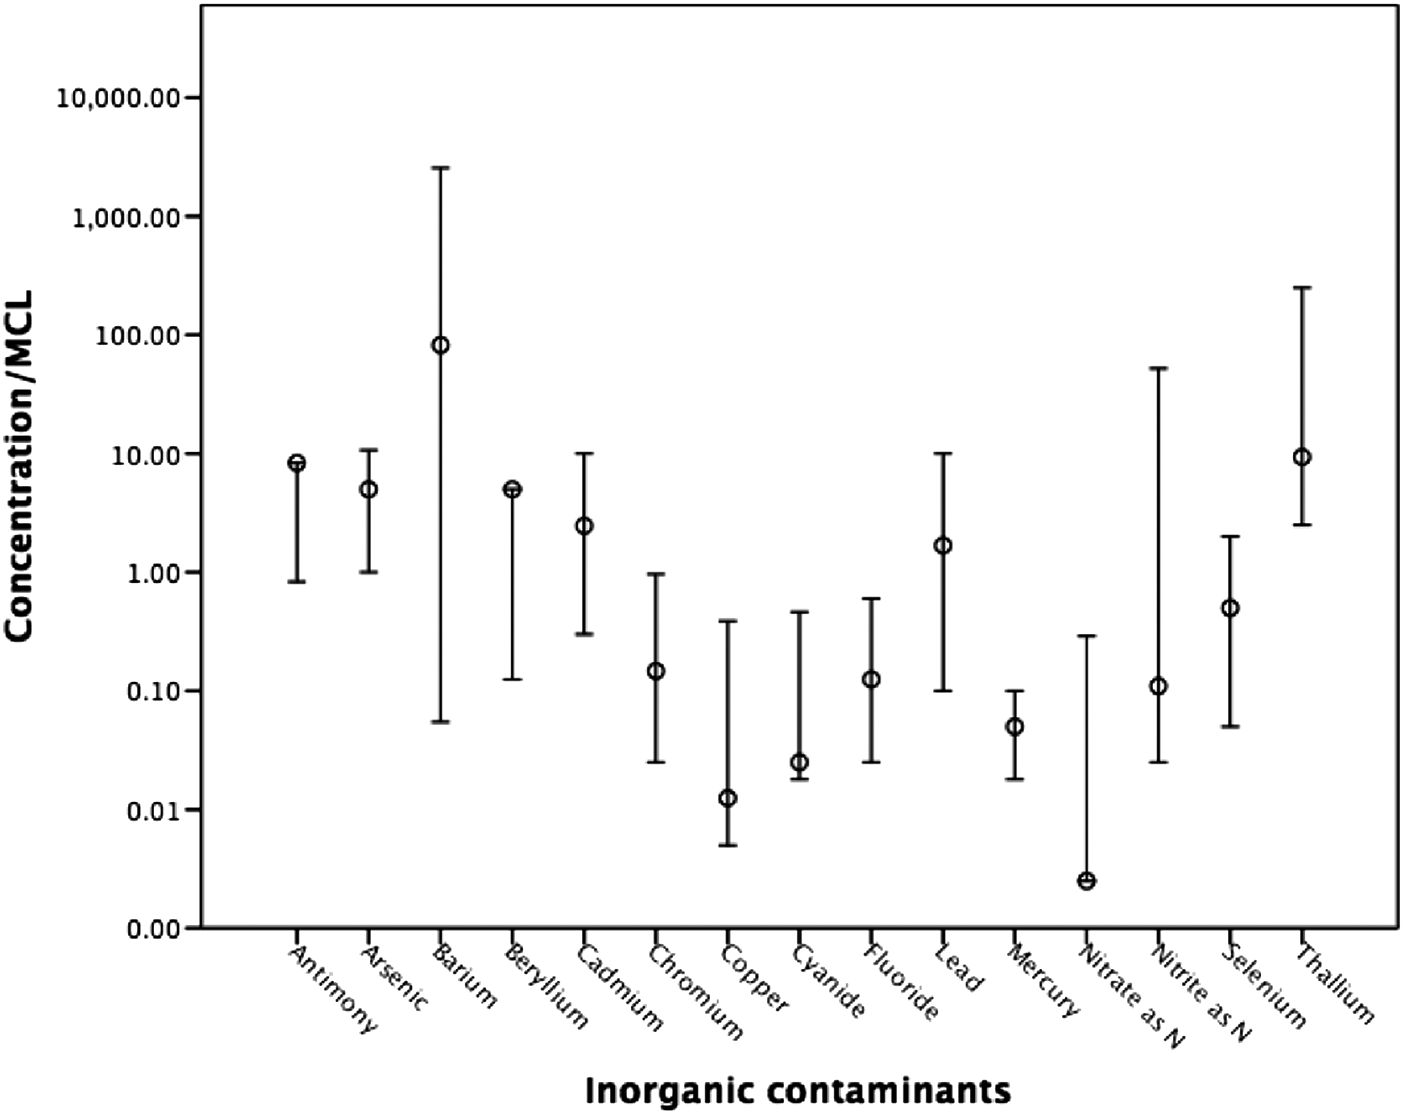
Concentration/maximum contamination level (MCL) ratios for inorganics in flowback water. Circles represent median, and whiskers show 5th and 95th percentiles.
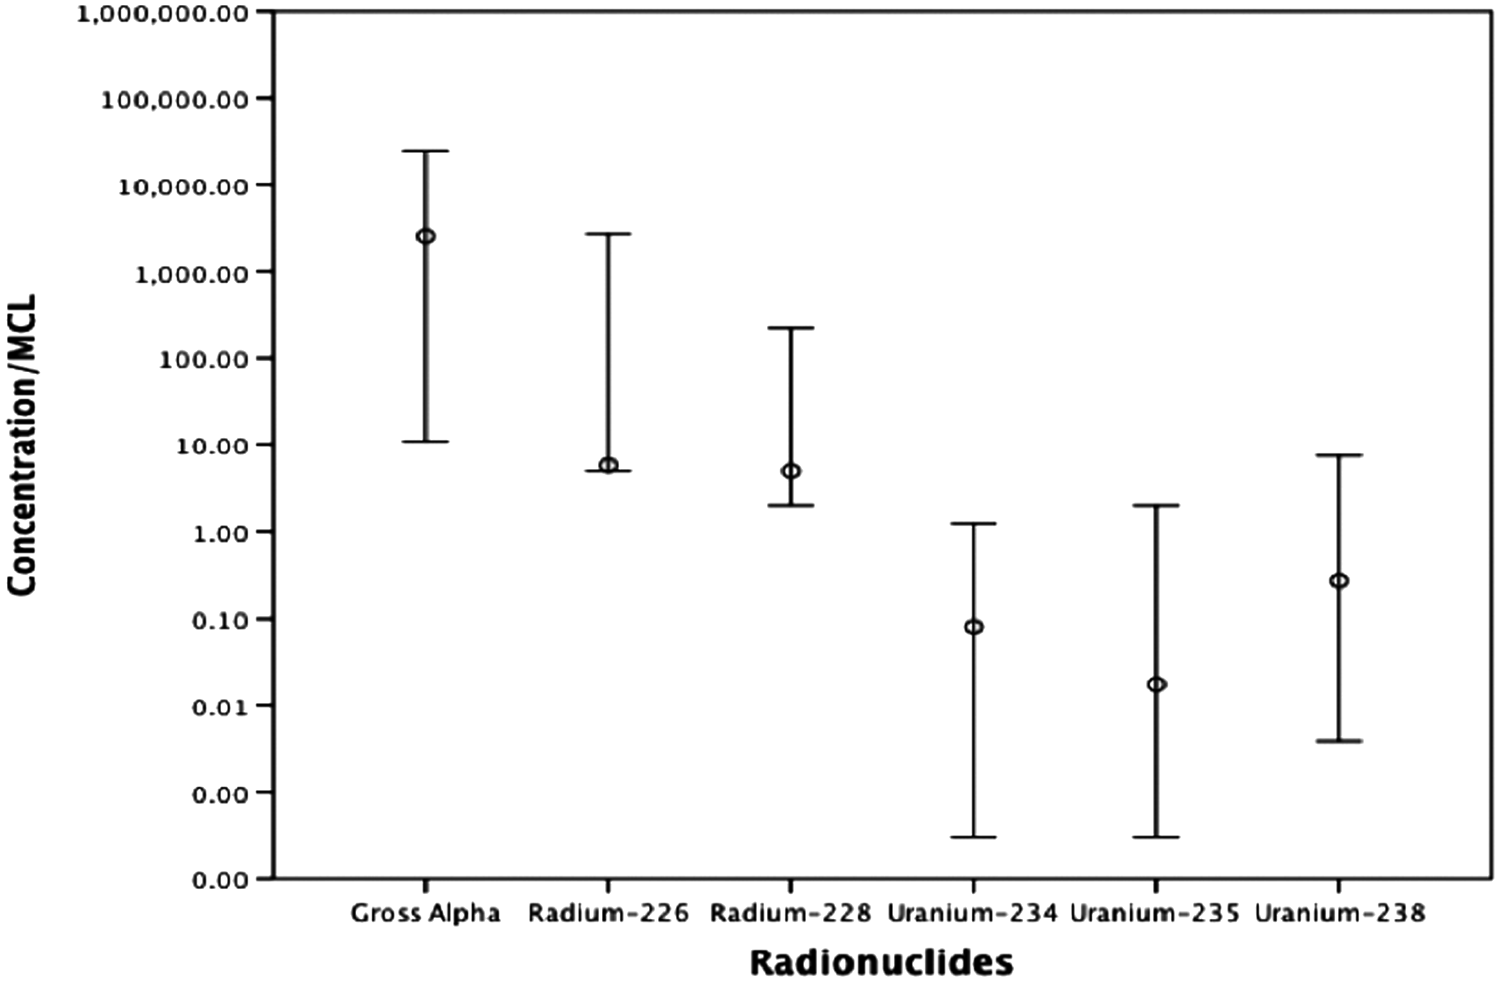
Concentration/MCL ratios for radionuclides in flowback water. Circles represent median, and whiskers show 5th and 95th percentiles.

Concentration/MCL ratios for secondary contaminants in flowback water. Circles represent the median, and whiskers show 5th and 95th percentiles.
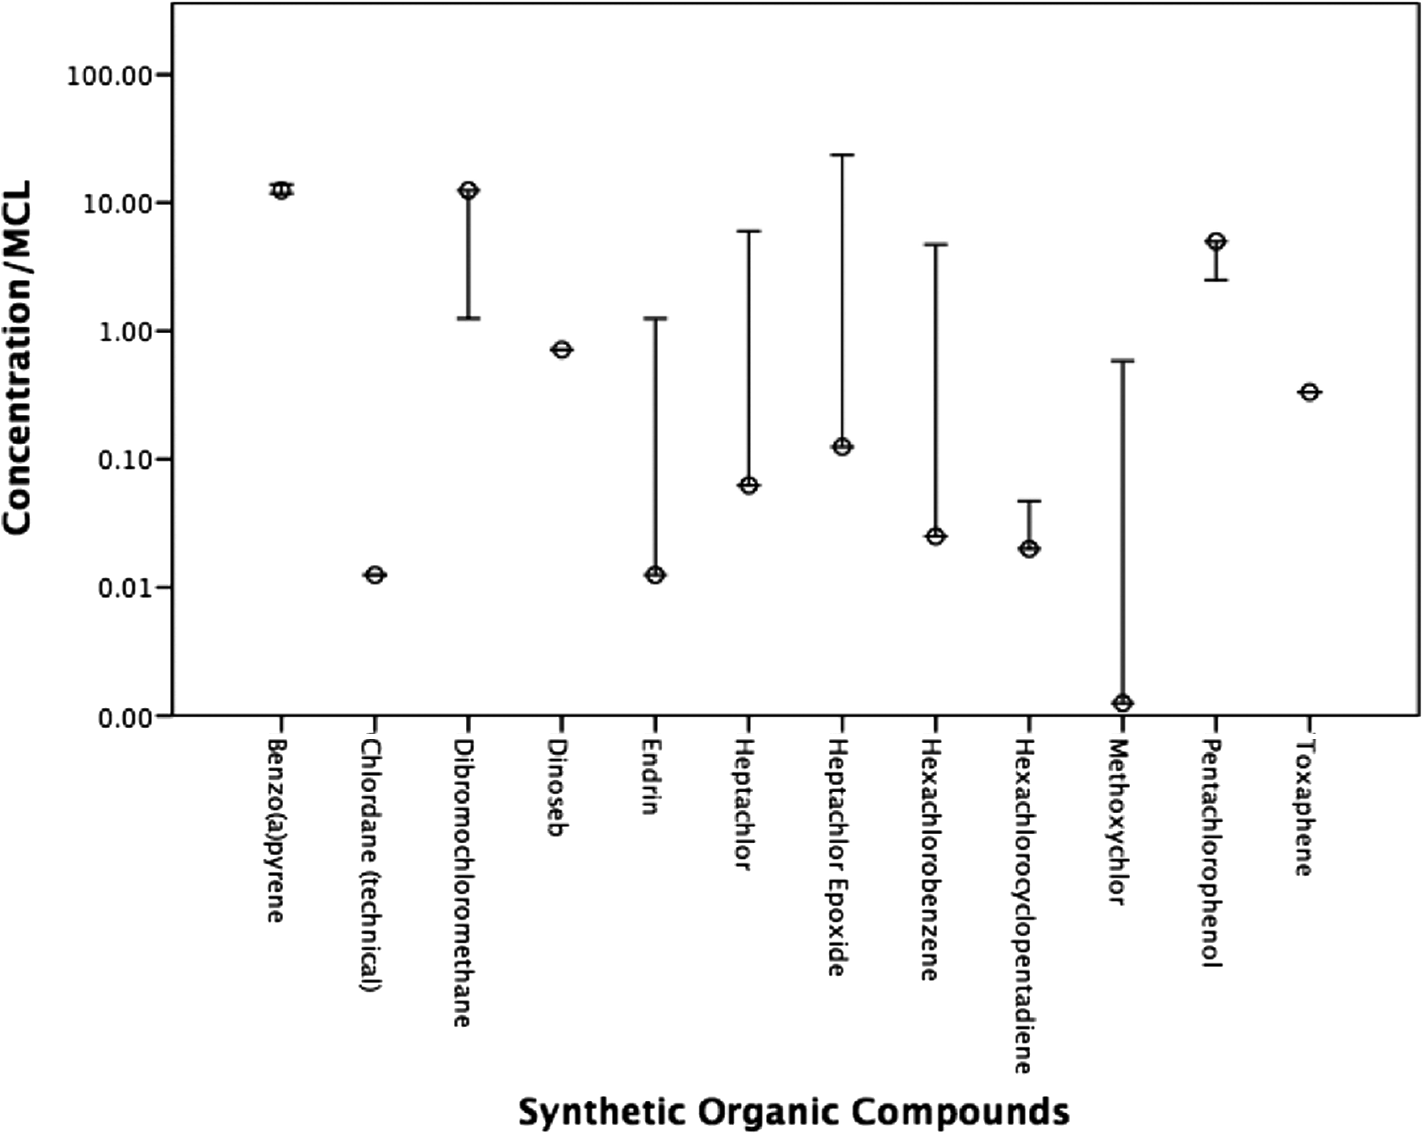
Concentration/MCL ratios for synthetic organic compounds in flowback water. Circles represent median, and whiskers show 5th and 95th percentiles.

Concentration/MCL ratios for volatile organic compounds in flowback water. Circles represent median, and whiskers show 5th and 95th percentiles.
Highlighted rows indicate Mean/MCL ratio >1.
MCL from EPA drinking water standards.
Chemicals listed as known fracturing fluid additives (FracFocus.org).
Highlighted rows indicate Mean/MCL ratio >1.
MCL from EPA drinking water standards.
Highlighted rows indicate Mean/MCL ratio >1.
MCL form EPA drinking water standards.
Chemicals listed as known fracturing fluid additives (FracFocus.org).
Highlighted rows indicate Mean/MCL ratio >1.
MCL from EPA drinking water standards.
Highlighted rows indicate Mean/MCL ratio >1.
MCL from EPA Drinking Water Standards.
Chemicals listed as known fracturing fluid additives (FracFocus.org).
Inorganic chemicals
Mean concentrations for several inorganic chemicals exceeded the allowable MCL. Barium, and thallium had mean concentrations over 10 times greater than their respective MCLs. Barium, in particular, was present in flowback water at exceedingly high concentrations with a mean of 1,200 mg/L and a mean/MCL ratio of 590 (Table 2), which is slightly higher than the mean concentration from Dresel and Rose (2010). Figure 3 shows that the ratios for barium have the most variability, with the mean/MCL ranging from <0.1 to over 14,000,000. The distribution of thallium, in contrast, shows that for this constituent the mean/MCL ratios are consistently >1, meaning that most of the sample results exceed the MCL. These constituents present a number of different health effects [see EPA (2009) for information on health impacts of drinking water contaminants].
Radionuclides
Table 3 presents the summary statistics for radionuclide concentrations in flowback water. Gross alpha and radium concentrations greatly exceed the 5 pCi/L MCL, while uranium concentrations tend to fall within drinking water guidelines. Concentrations of radium-226 from this study fall within the range of concentrations found in other studies (Dresel and Rose, 2010; Haluszczak et al., 2012). Long-term exposure to alpha particles and other radionuclides may lead to an increased risk of cancer (EPA, 2009). However, as shown in Table 3, the sample sizes for these contaminants are relatively small, resulting in large uncertainty in the distribution of these constituents in flowback water and production brines.
Secondary contaminants
Secondary maximum contaminant levels (SMCLs) are nonmandatory water quality standards that are not enforced by the EPA as they do not pose any known human health risks. However, contaminants, such as chloride and total dissolved solids, which exist at high concentrations in flowback water (Table 4), still can present quality and treatment issues concerning drinking water. The maximum concentration of Cl in this study is much higher than concentrations published by Blauch et al. (2009) and Dresel and Rose (2010).
Synthetic organic compounds
Several of the synthetic organic compounds shown in Table 5 have mean concentrations that exceed the allowable MCL. In particular, dibromochloromethane has a mean/MCL ratio of 14. Prolonged exposure to this chemical is associated with an increased risk of cancer, as well as kidney and liver problems (EPA, 2009). Figure 6 shows the distribution of mean/MCL ratios for dibromochloromethane, which has a 95th percentile of over 10. However, it should be noted that all of the 128 samples for dibromochloromethane fell below the detection limit, and the mean concentration of 2.9 μg/L was calculated by replacing the values with half the detection limit.
Volatile organic compounds
From the results in Table 6, there are three VOCs that have high concentrations in flowback water, despite the fact that they are not listed as known hydraulic fracturing fluid additives (FracFocus, 2013). Benzene, which has the potential for increasing cancer risk in exposed individuals, is high priority as it has a mean/MCL ratio of 19. From Figure 7 it can be seen that most of the sample results for benzene exceeds the MCL.
Contaminants for which mean concentrations were found to be over 10 times greater than the allowable MCL were given high priority. The results of those constituents were sorted by county in order to determine whether flowback samples with higher concentrations were associated with certain locations. A nonparametric one-way analysis of variance (Kruskal–Wallis test) was conducted in SPSS in order to determine whether the differences in concentrations for each constituent varied significantly by county. Of the 12 constituents tested, 10 of the tests yielded significant differences in concentrations across the counties from which the samples were collected. However, plotting the results for each county revealed great variability even within the county making it difficult to draw conclusions. The variation in sample size for each county as well as the potential clustering of samples by well and operator makes it impossible to say whether these differences should be attributed to well-level effects, operator-level effects, or geographic effects. Benzene, for example, had a high level of significance, indicating that concentrations were not uniformly distributed across the different counties. Looking at the variability of the results in Fig. 8 within each county, it is evident that concentrations can vary over three orders of magnitude within a county, making it difficult to associate particular counties with high or low levels of benzene.
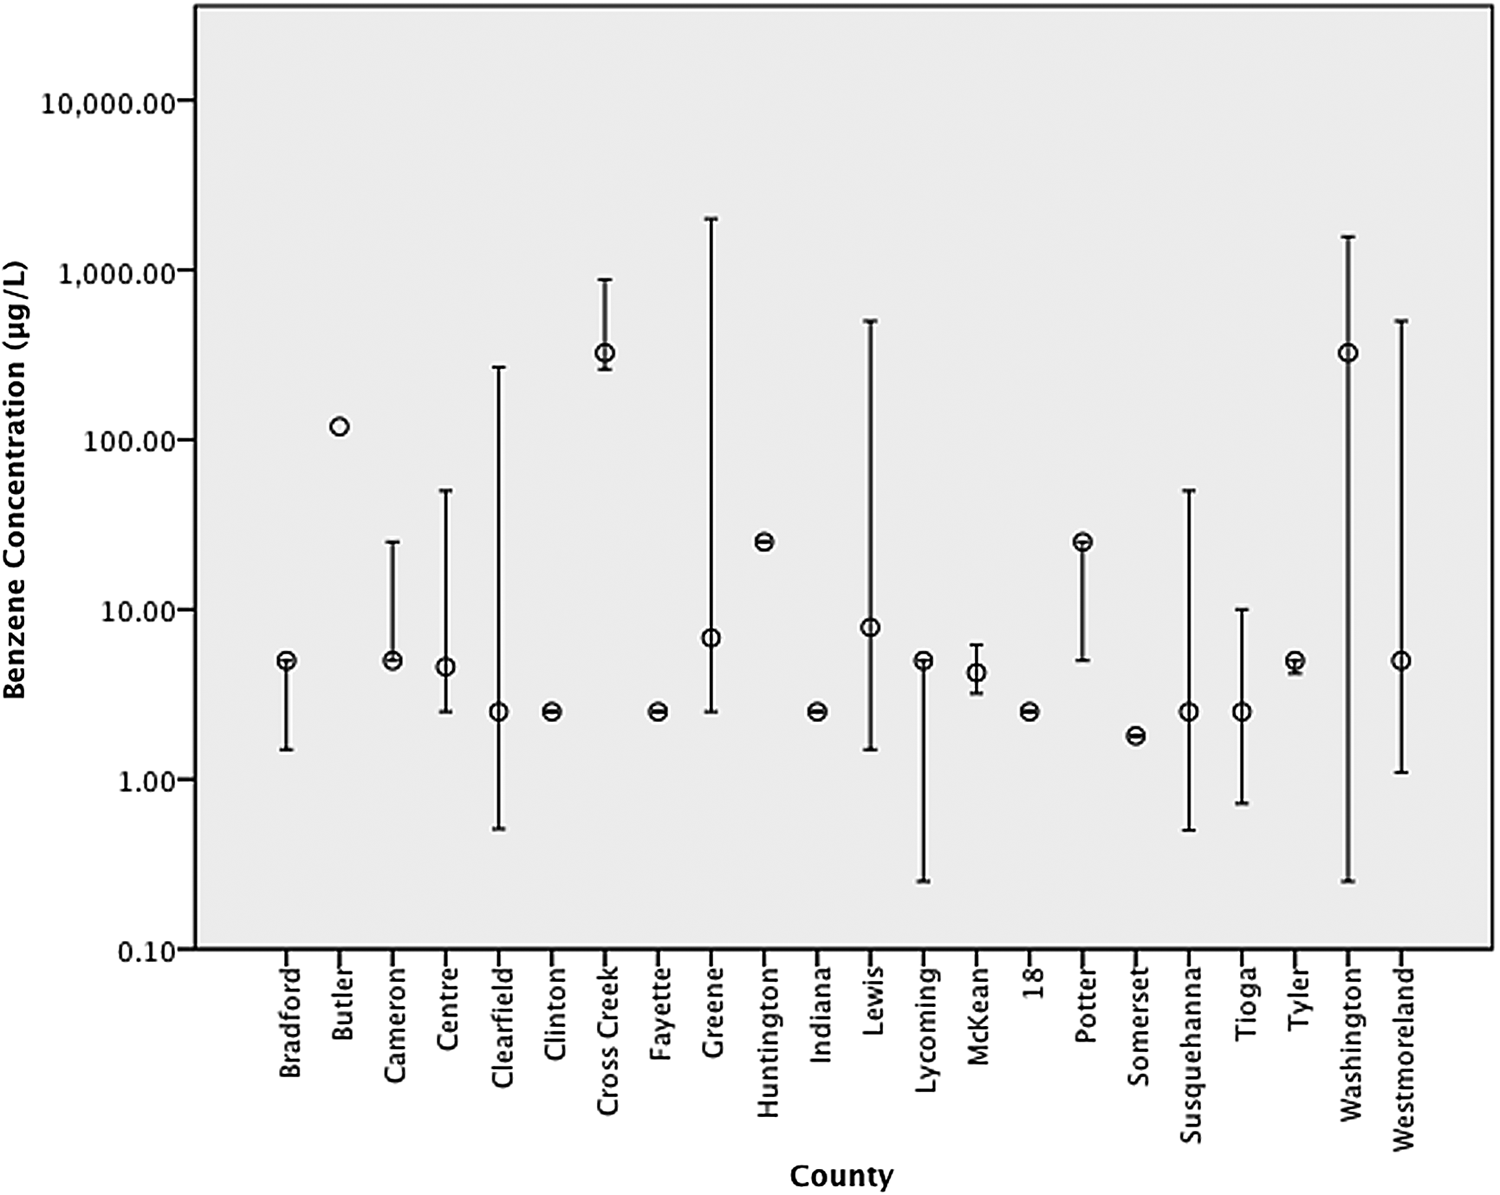
Median concentrations of benzene by county. Range indicates the 5th and 95th percentiles.
Discussion
This study combined four existing databases on flowback water and production brine samples collected from Marcellus shale gas wells in the states of Pennsylvania, New York, and West Virginia. If the different component databases provide consistent information, then there might be relatively little advantage to combining them. To assess this, a one-way ANOVA was conducted in SPSS to examine the equality of mean, and over 60% of the constituents tested revealed significant differences (significance level=0.05) in mean concentrations from each data source. The analysis also revealed that the samples obtained from the EPA had the highest salinity, while the samples from the Pennsylvania DEP had the highest average concentrations for most of the constituents. This is an indication that higher salinity does not necessarily correlate with higher concentrations of other inorganic constituents. The existence of database effects raises the question as to how to properly weight the different data sources for developing an overall characterization of flowback water. Developing such a weighting would require comprehensive information on existing wells and was outside of the scope of this study. In the authors' view, precisely weighting the different databases was less critical than using a diverse set of inputs to the screening analysis conducted by this study, such that ranges of constituent concentrations reflect input from a variety of wells.
Sampling data revealed exceedingly high concentrations of various classes of contaminants, including disinfectants, dissolved metal, and volatile organic compounds. Many of these contaminants can pose serious health risks if present in drinking water. By setting an arbitrary cutoff point (mean/MCL >10), a manageable summary of the highest-priority constituents in flowback water is presented. In particular, barium, gross alpha, chloride, dibromochloromethane, benzene, had mean concentrations over 10 times greater than the allowable MCL (EPA, 2009) for each constituent (Tables 2–6). With the exception of chloride, none of these constituents is listed as a known chemical additive to fracturing fluid (Aminto and Olson, 2012; FracFocus, 2013).
In addition to the potential health risks and water contamination associated with Marcellus shale wastewater, high concentrations of salts, radionuclides, and dissolved solids can pose difficulties regarding the disposal, treatment, and reuse of flowback and produced waters. The Marcellus region does not generally has suitable geology for underground injection as a method of wastewater disposal (Veil and Clark, 2011; Lutz et al., 2013). The growth of the industry has also caused changes in regulations that restrict the discharge of flowback, brine, or produced water to municipal wastewater treatment facilities. The remaining treatment options are treating wastewater at private, industrial facilities, or partial treatment for internal reuse (Lutz et al., 2013). The percentage of flowback water recycled for hydraulic fracturing increased from 13% before 2011 to 56% in 2011 due to the changes in regulations and constraints on other treatment and disposal options (Lutz et al., 2013; Rahm, et al., 2013). While naturally this analysis cannot substitute for a site-specific analysis when developing treatment systems, it can provide an overview of which constituents are likely to be issues across different sites.
One of the major concerns for flowback and produced water is TDS removal. As indicated in Table 4, TDS levels range between 221 and 345,000 mg/L. Chemical precipitation processes, such as coagulation and flocculation, can be used to remove suspended solids and inorganic-scale-forming compounds, but are not effective for removing dissolved solids (Fakhru'l-Razi et al., 2009). A study of shale gas wastewater effluent from publicly owned treatment facilities found that even after treatment through filtration or flocculation, certain inorganic solids remained at unacceptable mean and maximum concentrations when compared with various drinking water standards (Ferrar et al., 2013). While organic compounds may have been removed to acceptable levels, inorganics, such as magnesium, chloride, and total dissolved solids, were not reduced to drinking water MCLs after undergoing various physical treatment processes for 8–12 h of residence time (Ferrar et al., 2013).
While some industrial facilities may have the capability of removing ions to reduce TDS from shale gas wastewater (Lutz et al., 2013), the results in Table 3 indicate that flowback water also contains high mean concentrations of alpha particles (20,600 pCi/L), radium-226 (3,800 pCi/L), and radium-228 (460 pCi/L).” High concentrations of radionuclides and organic compounds found in flowback and produced waters can pose significant difficulties when treating and reusing flowback water. Radionuclide particles can be removed through different treatment processes, such as reverse osmosis, precipitation, or ion exchange, but some percentage of radium will remain in the effluent (Zhang et al., 2014), and these processes will serve to concentrate the radionuclides, which may require disposal of the treatment residuals in specialized facilities.
Organic compounds, as well as some dissolved metals, can also be removed through adsorption using porous materials, such as activated carbon, organoclays, or zeolite. This treatment method can have a high retention time and becomes less efficient at higher concentrations (Fakhru'l-Razi et al., 2009). The high concentrations of benzene (0.25–2,000 μg/L) found in flowback water (Table 6) can reduce the run lengths of adsorptive processes. In some cases, a percentage of organic and radioactive materials will accumulate even after treatment, making 100% reuse not possible without dilution of flowback water with fresh water (NYSDEC, 2011).
Calculating the Spearman's rank correlation for the top-priority constituents, there does not appear to be any strong relationship between chloride concentrations and chlorinated solvents (r<0.7). Chloride did have strong correlations with manganese (r=0.770) as well as with radium-226 (r=0.738), and radium-228 (r=0.892). Organic constituents, however, have strong relationships with each other, but no relationships appear between organic compounds and inorganics or with naturally occurring constituents. The Spearman's correlations for benzene with dibromochloromethane was 0.762. In particular organic constituents that are of likely anthropogenic origin appear to be tightly correlated, as the correlations between vinyl chloride and dibromochloromethane (r=0.945), and between 1,2-dichloroethane and dibromochloromethane (r=0.792) were very strong. Correlations between radionuclides were also strong (r=0.907), indicating that high concentrations of alpha particles would likely be accompanied with higher concentrations of radium. However, the anthropogenic chemicals 1,2-dichloroethane dibromochloromethane, were not strongly correlated with chloride, or with inorganic constituents (Supplementary Data).
Comparing the results geographically by county did not yield any readily interpretable results. Since there was a great amount of variability in the concentrations of each contaminant in different counties, county alone does not appear to be a determinant of concentration. It is likely that the samples were collected from different wells within the same county, but given the limitations of the data, it was generally not possible to identify each sample by well. For this reason, it was not possible to distinguish well-level effects from regional effects.
There are several limitations associated with this analysis. One limiting factor is that the data were not controlled for flowback day. As the data were collected from various sources with inconsistent documentation, it was not possible to sort the concentrations of all the contaminants by the day of flowback. While this may be adequate for approximating the conditions in a holding pond or storage lagoons (in which flowback and production brines from different times are mixed), it may not be quantitatively representative of the actual proportions of flowback and production brines from different time periods. More representative and detailed data would be necessary to conduct more statistical analyses as well as risk analysis for human exposure to the contaminants that exist in flowback water and production brine. Additionally, directly comparing concentrations to MCLs is a somewhat simplistic approach since the concentrations would likely be attenuated due to natural environmental processes. The results of this analysis do not necessarily indicate that the MCL for any particular constituent will be exceeded if flowback water is released into the environment. This analysis is intended only to serve as a preliminary prioritization of contaminants that are present in flowback water.
Footnotes
Author Disclosure Statement
No competing financial interests exist.
References
Supplementary Material
Please find the following supplemental material available below.
For Open Access articles published under a Creative Commons License, all supplemental material carries the same license as the article it is associated with.
For non-Open Access articles published, all supplemental material carries a non-exclusive license, and permission requests for re-use of supplemental material or any part of supplemental material shall be sent directly to the copyright owner as specified in the copyright notice associated with the article.