




Abstract
Abstract
An industrial demonstration unit using natural gas as a heat source was built to calcine the by-products of MgO wet flue gas desulfurization from power plants; influencing factors on the SO2 content in calciner gas were comprehensively analyzed; and an advantageous recycling condition of MgO and SO2 from by-products was summarized. Results showed that the SO2 content in the calciner gas was increased by more than 10 times under a lower excess air coefficient, a higher feed rate, a lower crystal water in by-products, and a higher feed port position. For the tests conducted under the excess air coefficient above and below one, the effect of the furnace temperature on the SO2 content in the calciner gas was reversed. Results of activity analysis indicate that particles of MgO generated under the calcination temperature of 900–1,000°C had a high activity. In contrast, due to the slight sintering, MgO generated under the calcination temperature of 1,100°C had a low activity. To recycle SO2 as well as MgO, a temperature range of 900–927°C for TE103 is proposed. These studies will prompt the desulfurization market diversification, reduce the sulfur's dependence on imports for making sulfuric acid, be meaningful to balance the usage of the natural resource in China, and be regarded as a reference for the development of this technology for other similar developing countries.
Introduction
A
To solve these problems, the MgO flue gas desulfurization (FGD) process can been used to replace the limestone-gypsum desulfurization process for the following reasons. First, the process system of the FGD using MgO is similar to using limestone, but simpler in comparison to it (Chai et al., 2006). It is easy to replace the process of the FGD with limestone. Second, lower sorbent consumption and fewer by-products are generated using MgO FGD compared with limestone (Rosemount Analytical, Inc., 2013). Third, Mg (OH)2 gives a higher scrubbing capacity (Sajan et al., 2007) and the by-products (MgSO3·6H2O and MgSO4·7H2O) can be recycled. Fourth, the problems of the scale and plugging in MgO FGD system can be eased (Sargent and Lundy, 2003).
In recent years, the research on the MgO desulfurization process mainly has focused on the following aspects. Sajan et al. (2007) studied the gas absorption in slurries of fine particles: SO2-Mg (OH)2-MgSO3 system. Recelj and Golob (2001) studied the absorption of SO2 in the MgO-SO2-H2O. Zhang et al. (2011) studied the effects of crystallization conditions on the performances of the by-product recovering process. Wang et al. (2013) studied the macrokinetics of magnesium sulfite oxidation inhibited by ascorbic acid. Xu et al. (2010) simulated and optimized the processes of Magnesia FGD. Shen et al. (2012) studied the kinetics and mechanism of sulfite oxidation in the magnesium-based wet FGD process. Kang (2011) studied the effect of pyrolysis temperature on the activity of MgO generated from the decomposition of the by-products using a pipe furnace. Shen et al. (2013) studied the magnesium-based wet FGD process with oxidation inhibition of the by-product. Chen et al. (2009) studied the thermo-gravimetric kinetics of MgSO3·6H2O by-product from Magnesia wet FGD. Guo et al. (2011) studied the dissolution rate of magnesium hydrate for WFGD. Bitsko and Helt (1991) studied the problems with magnesium oxide regenerable scrubbers. Besides, Koyama (1998), Yi et al. (2009), Wang et al. (2010), and Xiong (2005, 2013) have applied a series of patents in this area.
Little research has been found on the industrial application of the regenerable MgO FGD process, although this process is a feasible means of SO2 emission control, which has been evaluated objectively based on operational experience in the United States (United States Environmental Protection Agency, 1981). In this process, SO2 is removed in a wet scrubber and the MgSO3/MgSO4 product results from SO2 absorption in a scrubber. The absorbed product is dried and calcined in a calciner to regenerate MgO for FGD, and SO2 captured during calcinations is suitable for sulfuric acid production (McGlamery et al., 1973). This process is very important for China, because there are abundant resources of magnesium and poor resources of sulfur in China. In this process, the controlling SO2 mole fraction in calciner gas and the activity of MgO generated during calcinations are a key technology. However, the industrial experiment and study on the influencing factors on the SO2 mole fraction and the activity of the MgO generated during calcining have been scarcely involved.
Against this backdrop, a 0.3MWe industrial demonstration unit was built. The effects of excess air coefficient, feed rate of by-products, furnace temperature, crystal water content in by-products, and feed port position on the SO2 mole fraction in the calciner gas were studied. The effect of the furnace temperature on the activity of the generated MgO was also studied in this article.
Experimental
Materials
By-products of magnesia FGD were from a desulfurization system in a 300MWe coal-fired power plant. The composition analysis of by-products is shown in Table 1.
Methods
By-products were calcined using an industrial demonstration unit, as shown in Fig. 1a. The arrangement of testing points is shown in Fig. 1b. The image of the experimental unit is shown in Fig. 2.
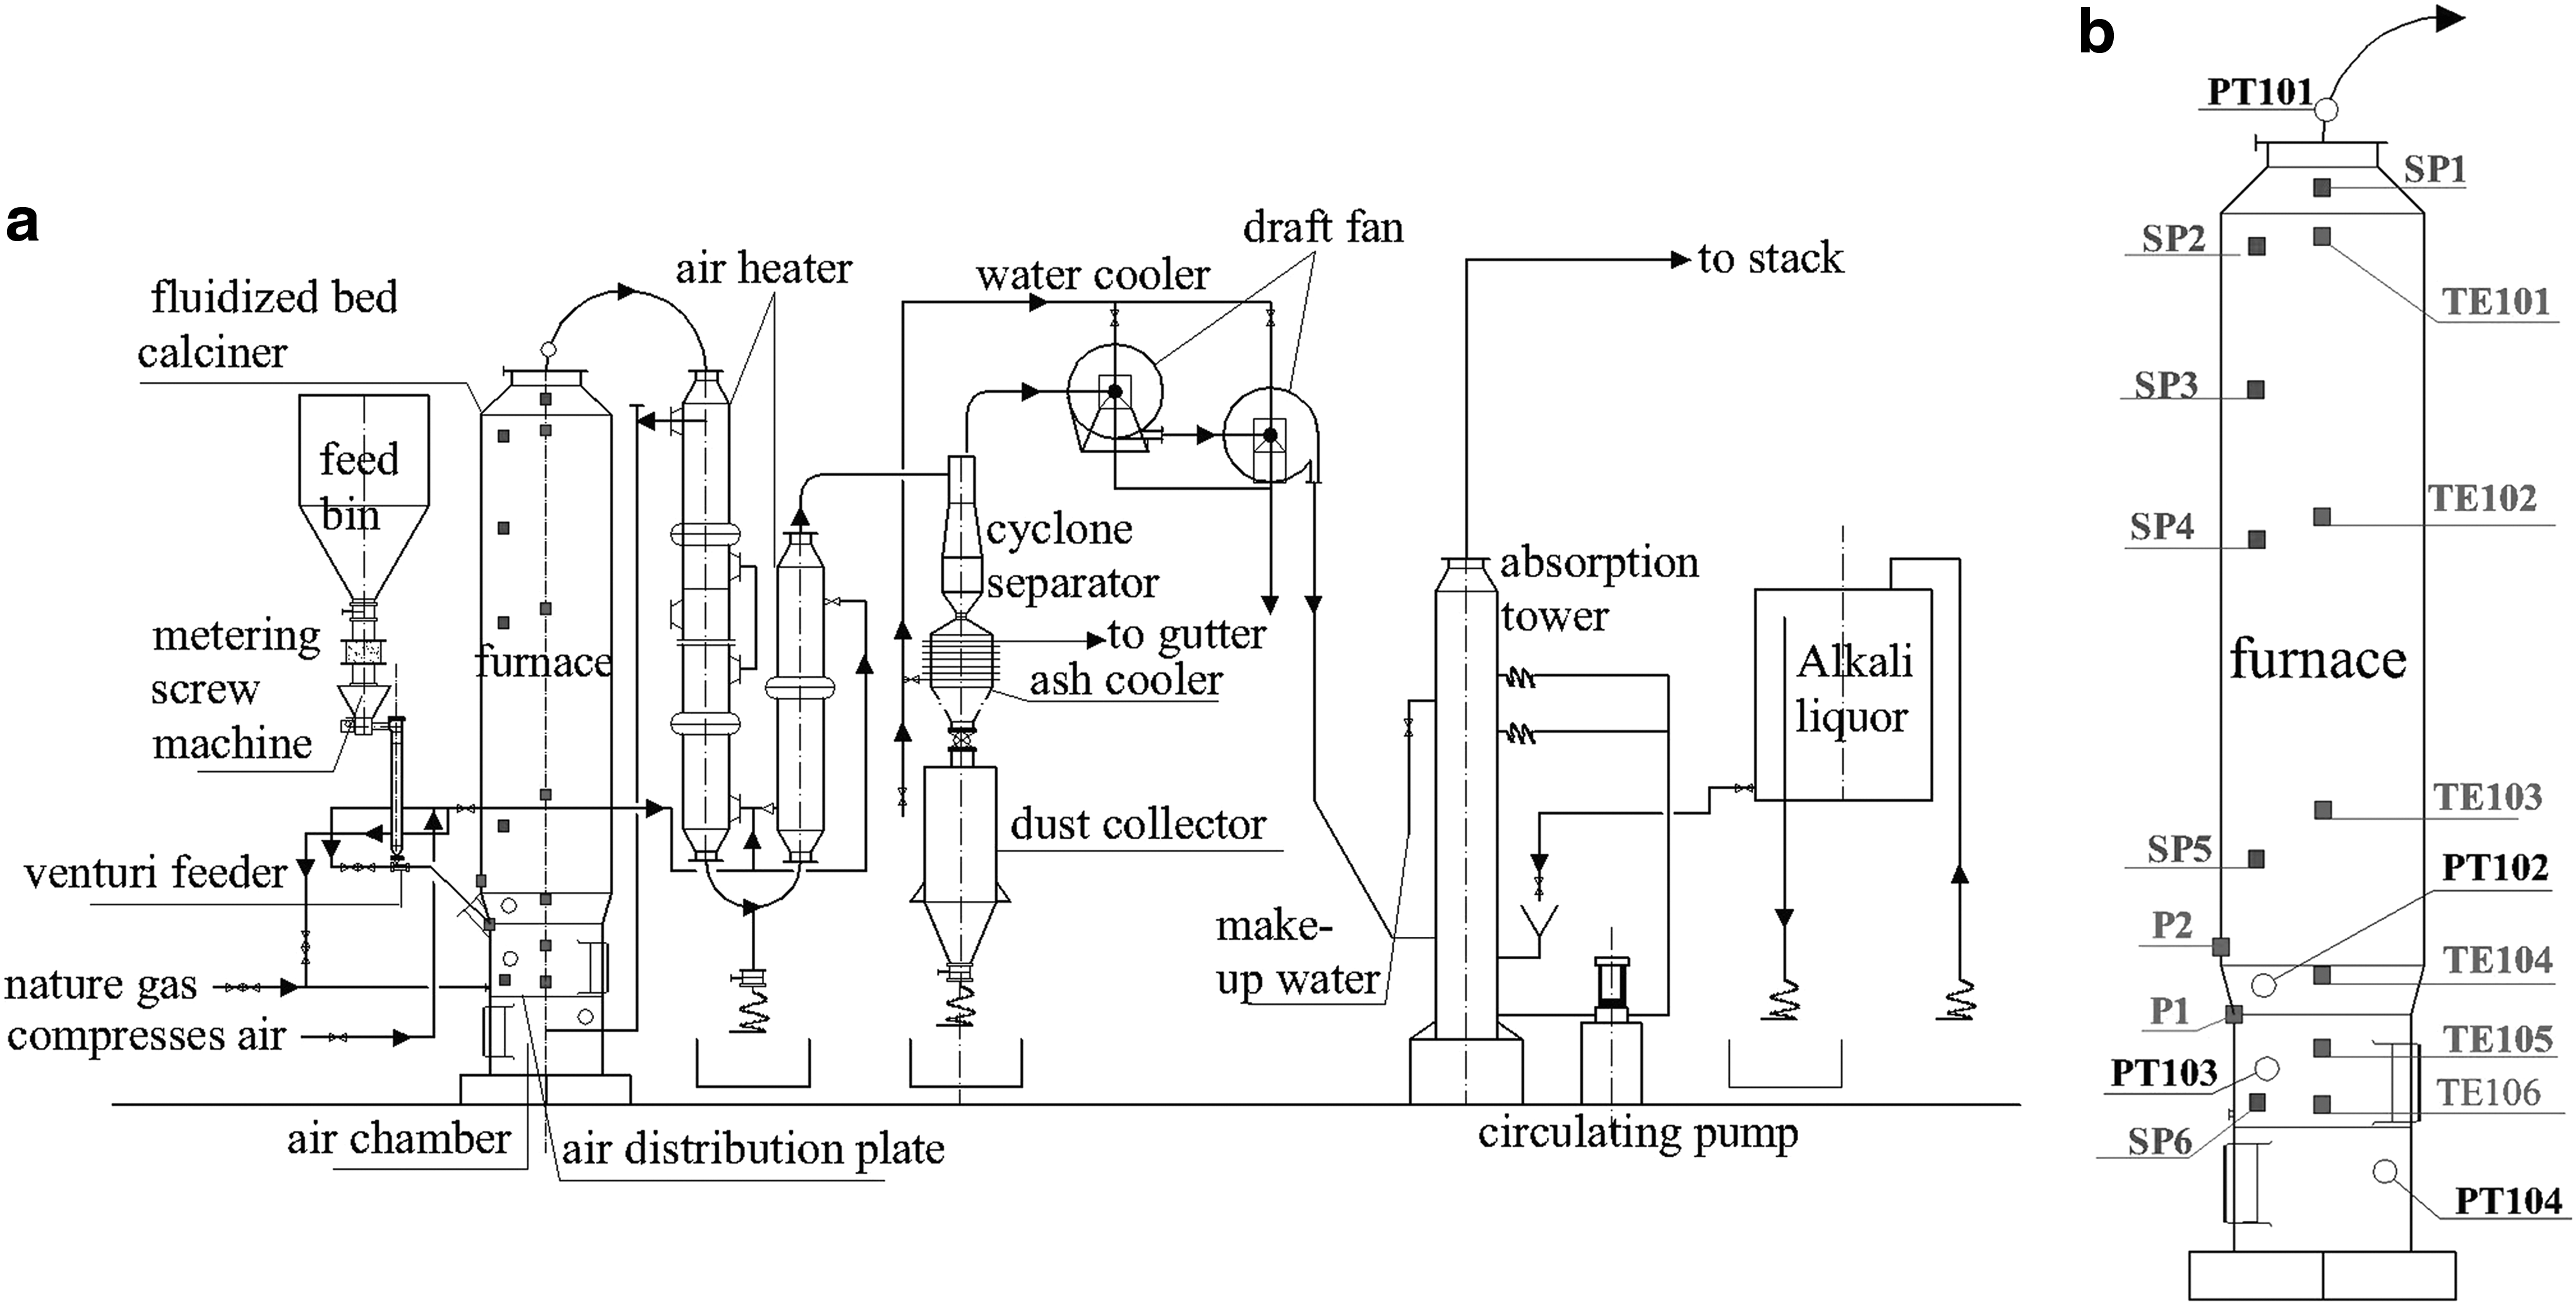
Industrial demonstration unit and arrangement of measuring points

Industrial demonstration unit.
The main body of the unit was a fluidized bed calciner, which included a cylindrical furnace (internal diameter of 500 mm and height of 7,000 mm), an air chamber, and an air distribution plate. The auxiliary systems included a feeding system, a flue gas system, a water system, and a data measurement and acquisition system. The workflow process is as follows.
Flue gas system
The high-pressure airflow from the air preheater entered the furnace from the air chamber to fluidize the bed materials. The introduced natural gas from the three nozzles evenly distributed in the same circumference of the furnace (66 mm away from the air distribution plate) was burned above the material layer. The bed material was heated until the furnace temperature reached approximately 1,000°C. After the flue gas was exhausted from the furnace, it passed through the air preheater, which acted as a heat exchanger, and then entered the cyclone segregator. After the gas-solid separation in the cyclone segregator, the remaining solid particles were cooled down by a nash cooler and collected in a dust collector. The gas was introduced into an alkali absorption tower via two draft fans, and was then discharged.
Material system
The magnesium oxide desulfurization by-products were stored in a feed bin after pulverization. A metering screw conveyor was used to send the by-products to a Venturi feeder (driven by high-pressure air), which was used to feed the materials into the fluidized bed calciner through a material nozzle.
Six sampling points (SP1, SP2, SP3, SP4, SP5, and SP6) along the calciner height direction were set to analyze the distribution of SO2 in the calciner, and the sampling point SP1 was also set to analyze the SO2 mole fraction in calciner gas exiting the furnace. The mole fractions of O2 and CO2 along the calciner height direction (SP1, SP2, SP3, SP4, SP5, and SP6) were measured online using Testo-MGA5 flue gas analyzer. The low mole fraction SO2 (0–0.5%) was also measured using this method. The high mole fraction SO2 was measured by iodometry. A set of gas and particle sampling device was made referencing GB-T-16157-1996 (State environmental protection administration, 1996), as shown in Fig. 3. The sampling conditions for the activity analysis of the MgO generated by calcinations of by-products are the case 2 in Table 1, feed rate of 89.6 kg/h, furnace temperature (TE103) of 900°C, 1,000°C, and 1,100°C, respectively. The sampling point is in SP1. The analysis of the activity includes the following contents. The particle-sized distributions of samples obtained from the calciner outlet, the gas-solid separator outlet, and the bottom of the furnace were determined. The morphology of the generated MgO by calcining by-products was characterized with SEM. The magnification of SEM images is 8,000, and the view field is 18.06 μm. Using a color indicator, the reaction of MgO and citric acid was monitored and the activity of MgO was determined.

Sampling system.
Results and Discussion
Features of furnace temperature
The curve of the average temperature increase of the furnace as a function of time is shown in Fig. 4, and the temperature distributions along the furnace under the conditions of different operating conditions are shown in Fig. 5. As shown in Fig. 4, the fluidized bed calciner could be heated to the thermal decomposition temperature of the by-products (Zhang et al., 2010; Scheidema and Taskinen, 2011), and the temperature could be maintained at a constant value over a long processing time. As shown in Fig. 5, the temperature from TE106 to TE105 rapidly decreased due to material absorbing heat for the feed port (located in the position P1) closer to TE105. The temperature from TE105 to TE103 increased due to the complete combustion of nature gas, and then again decreased for the endothermic reaction of by-products and the heat storage of the furnace wall.

Heating curve.
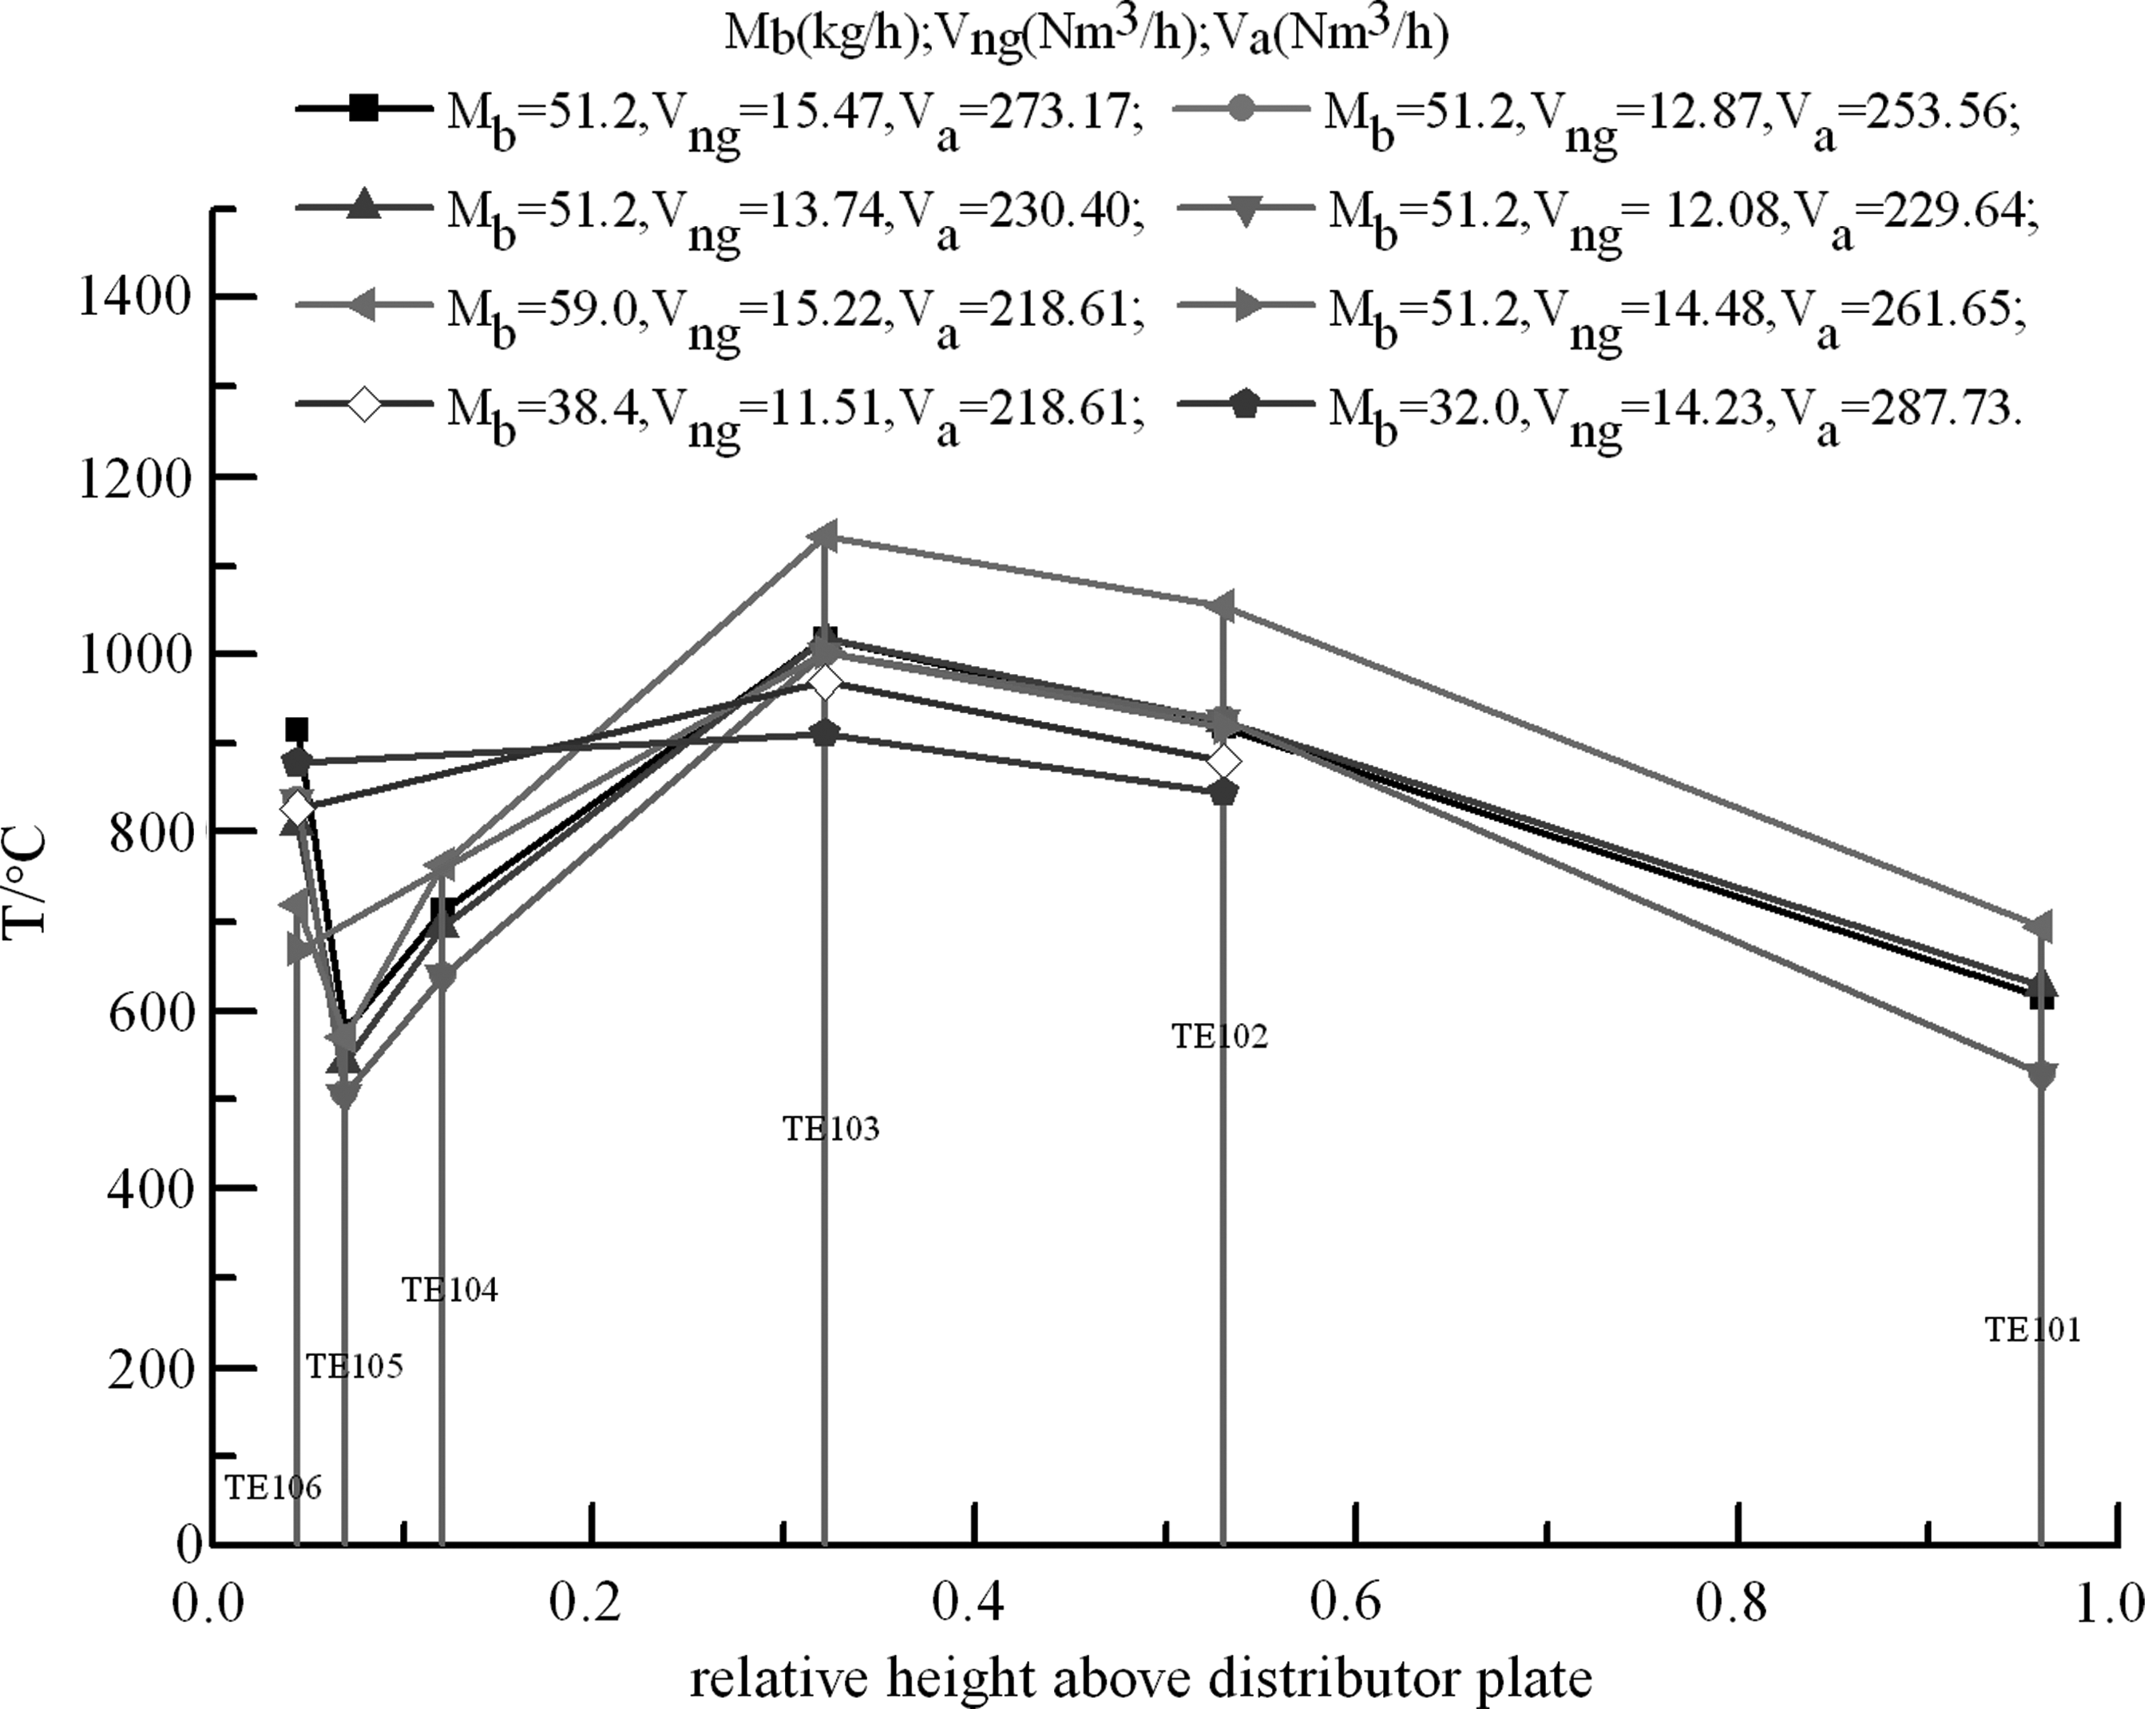
Temperature distributions along furnace.
O2, SO2, and CO2 mole fractions along the calciner height direction
In this experiment, the mole fractions of O2, SO2, and CO2 along the calciner height direction for case 1 in Table 1 are shown in Fig. 6. It can be found from Fig. 6 that there existed a transition point with a relative distance of 0.55. Downstream of this transition point, the SO2 and CO2 content rapidly increased; while e upstream of this point, variances of the SO2 and CO2 content varied slowly. The changing tendency of O2 mole fractions is contrary. This phenomenon shows that the decomposition reaction of by-products and fuel combustion mainly occurred in the lower zone of the furnace.
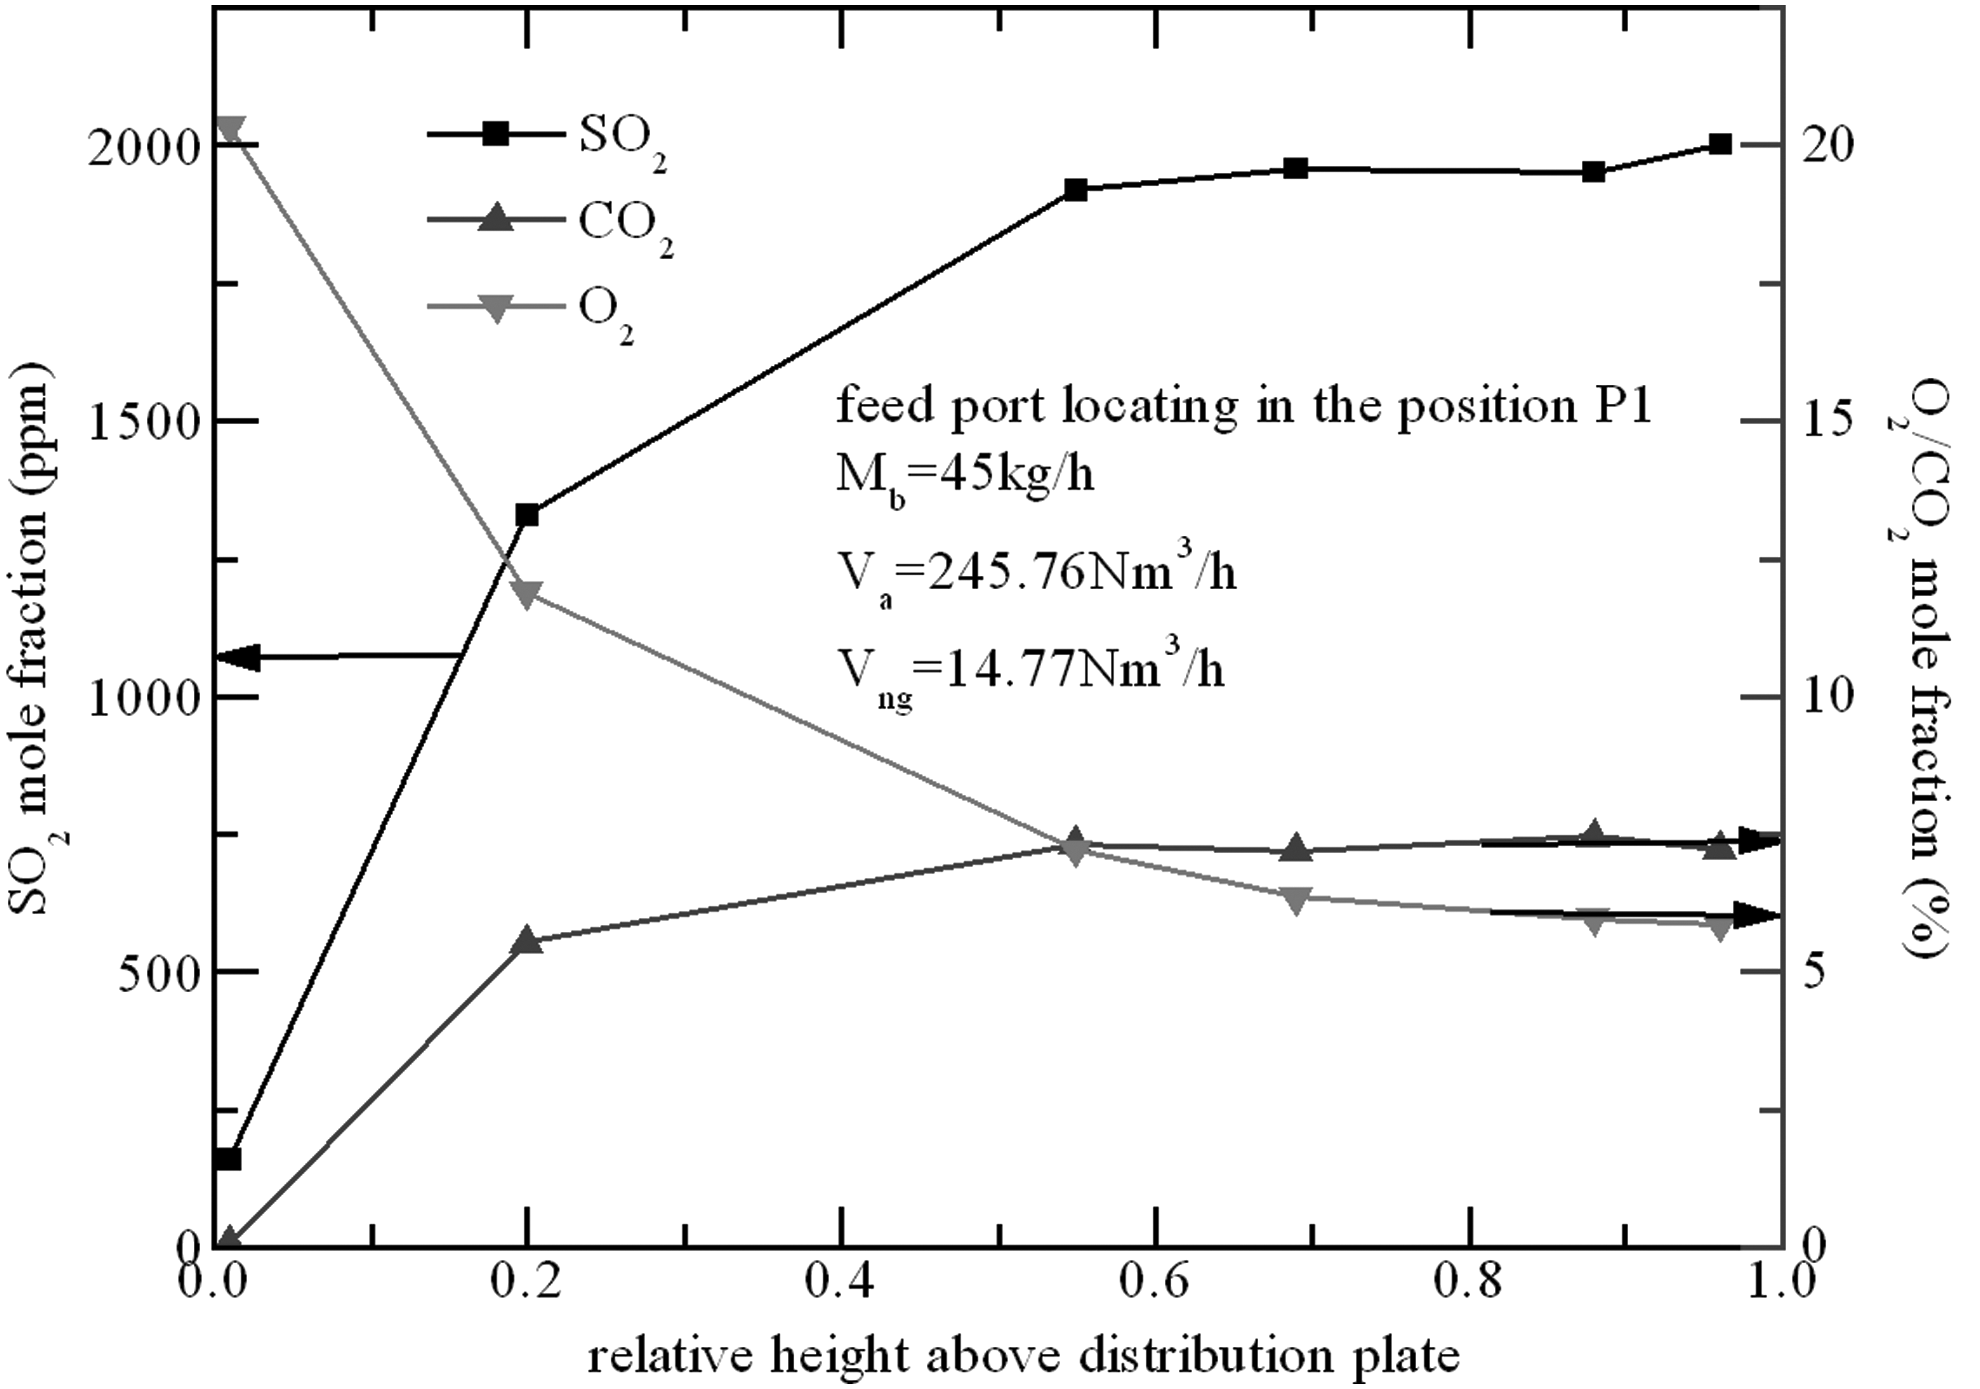
Distributions of O2, CO2, and SO2 along furnace.
It is found that the maximum value of the feed rate was 60 kg/h and the ratio of air to nature gas was larger under the conditions of the feed port located in the position P1 (525 mm away from the air distribution) and crystal water content of 30.99% in the by-products. If the feed rate was more than 60 kg/h, it was easy to spray material on the opposite furnace wall and air distribution plate. As a result, the amount of slag in the bottom of the furnace increased and the thermal decomposition rate of by-products decreased. To solve this problem, the feed port was raised to the position P2 (810 mm away from the air distribution) in the furnace and the by-products were dried. After that, the feed rate can be improved to 90 kg/h, the ratio of the air to nature gas can be decreased, and the rate of thermal decomposition of by-products can be increased.
The relationship between the SO2 mole fractions and time, and the effects of the position of feed port, excess air coefficient, feed rate, furnace temperature, and the crystal water content in by-products on the SO2 mole fractions in calciner gas are discussed as follows.
Relationships between the SO2 mole fractions and time
The relationship between the SO2 mole fractions in calciner gas and time is shown in Fig. 7 under the conditions of the different feed rate, the position of feed port, and excess air coefficient. The expression for the excess air coefficient α is shown in formula (1).

where V and V0 represent the actual and theoretical air volume for fuel complete combustion, respectively.
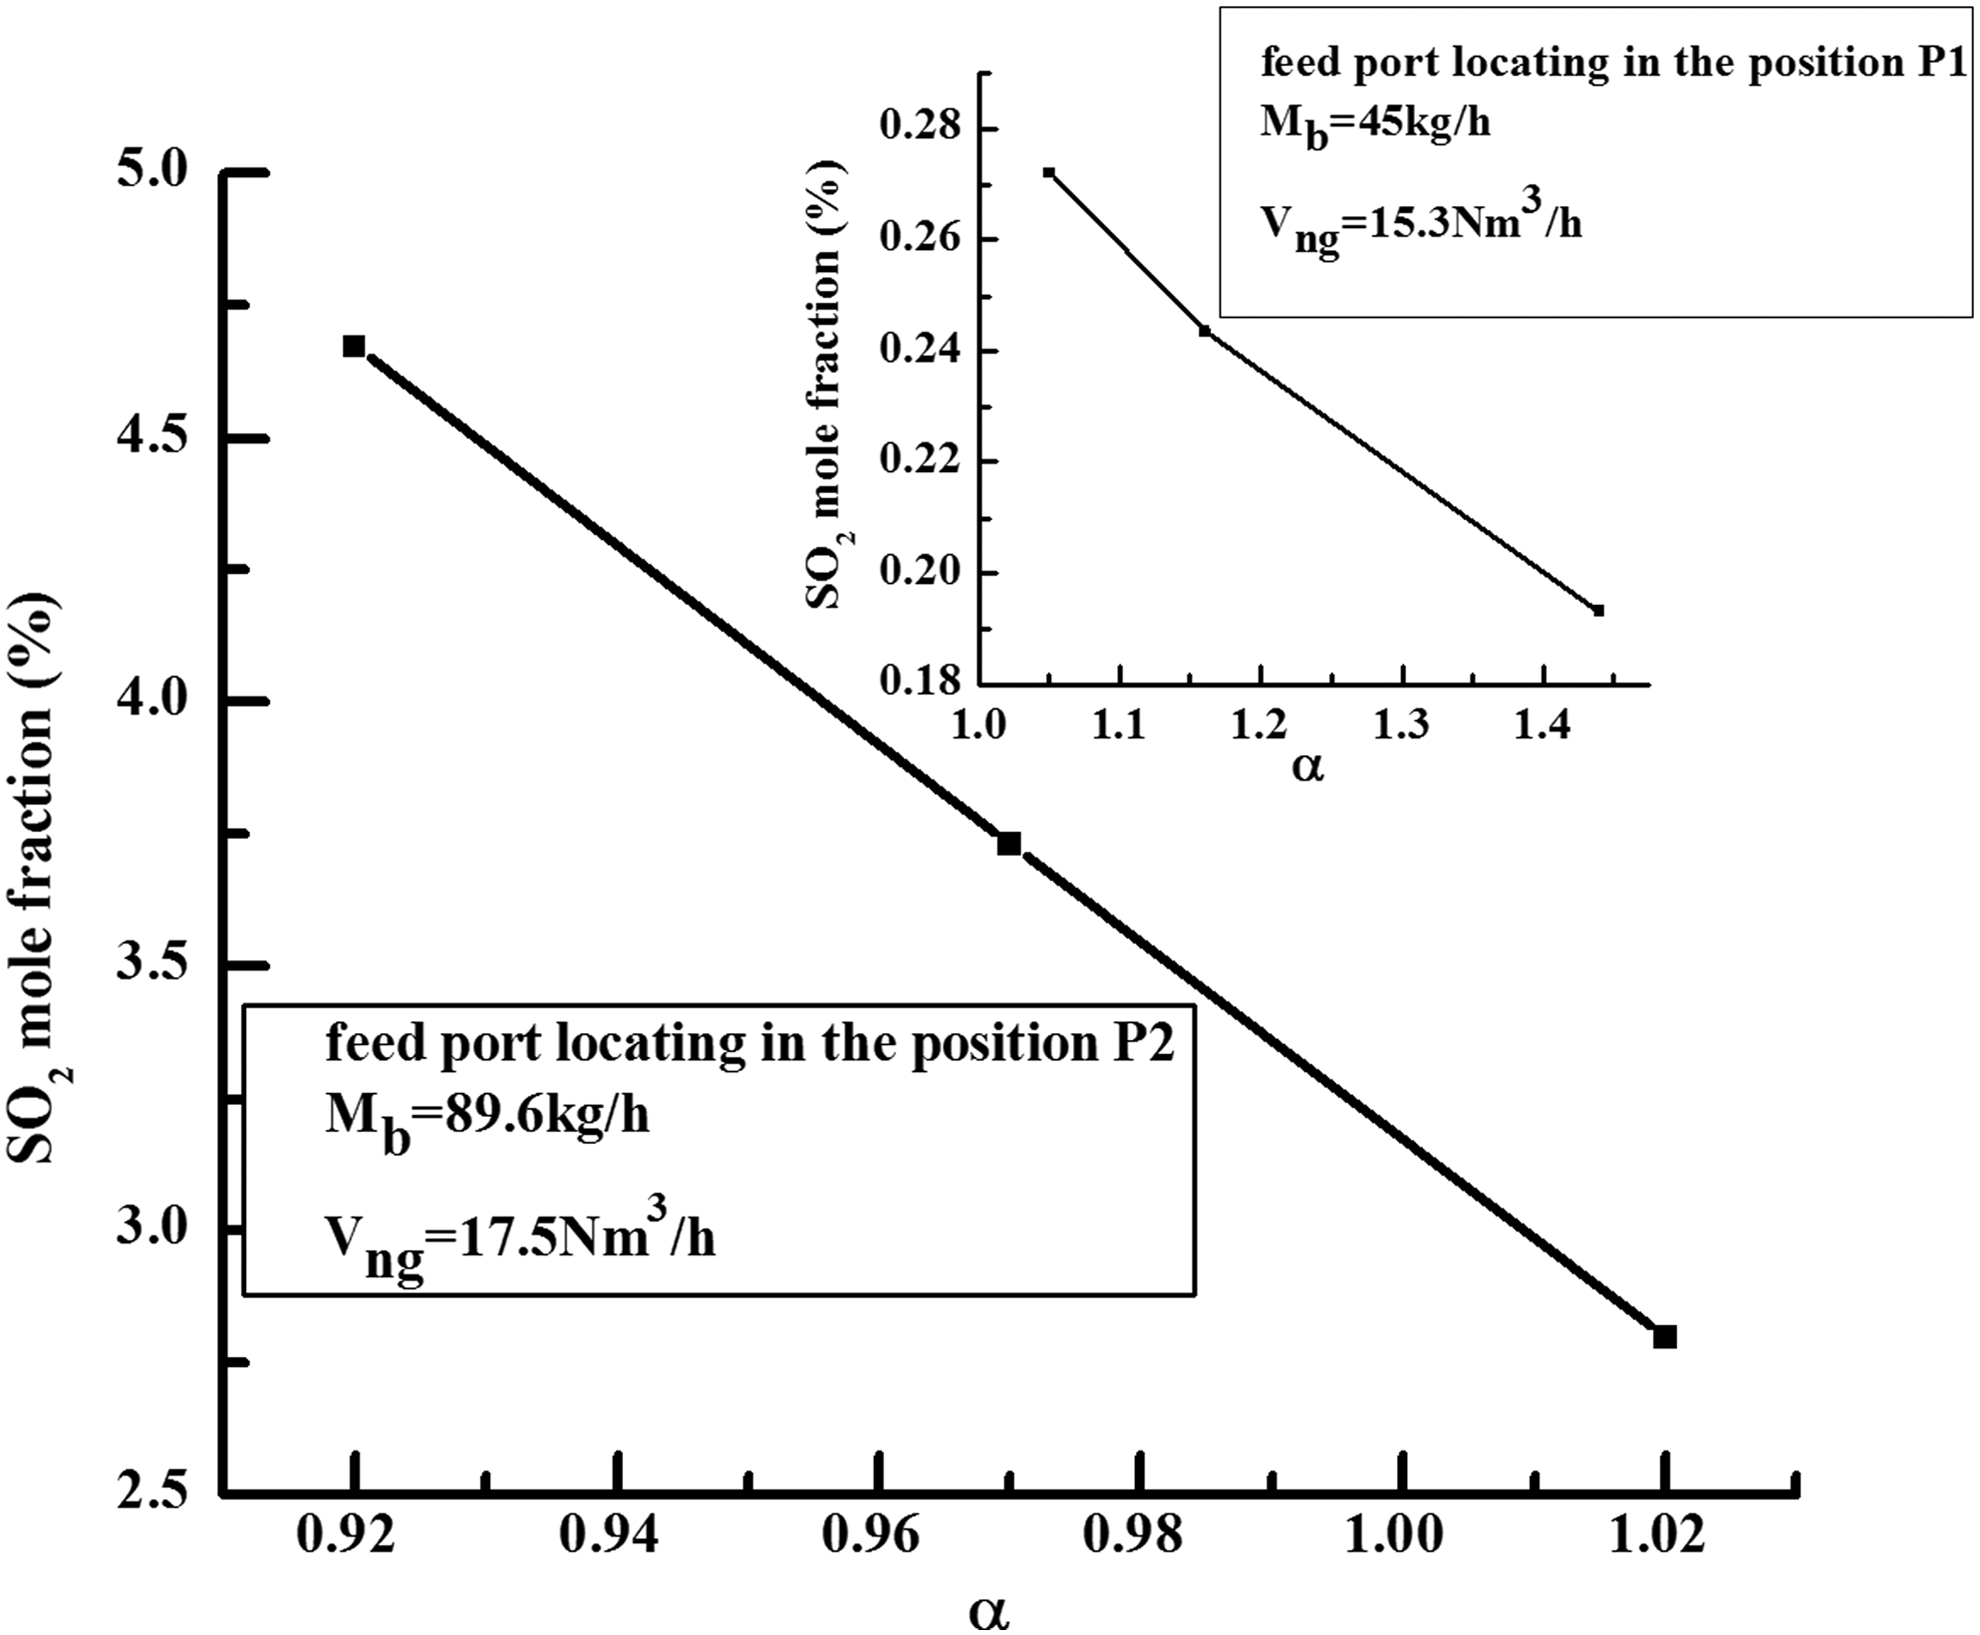
It is found that the SO2 mole fractions increased quickly in the first 6 min under the conditions of the feed port located at the position P1, feed rate of 60 kg/h, and excess air coefficient of 1.19, then changed slowly, and finally stabilized to 0.38%. Under the conditions of the feed port located at the position P2, feed rate of 89.6 kg/h, and excess air coefficient of 0.92, the SO2 mole fractions increased quickly in the first 8 min. Finally, the SO2 mole fractions stabilized at 4.67%. Ideally, the SO2 content in the calciner gas should be 4.8% depending on the S content in the by-products and the measured flow rate of the flue gas. Therefore, elevating the position of the feed port to the position P2, increasing feed rate, and decreasing excess air coefficient are beneficial to improve the SO2 mole fractions in calciner gas. This article separately analyzed the effects of these factors on the SO2 mole fractions in the next section.
Effect of excess air coefficient on the SO2 mole fractions in the calciner gas
The effect of the excess air coefficient on the SO2 mole fractions is shown in Fig. 8. Figure 8 demonstrates that the SO2 mole fractions decreased with the increment of the excess air coefficient, because the increasing excess air coefficient would change the reaction path of by-products and flue gas volume in calciner gas.
Global reaction mechanisms for the calcining processes in the furnace are shown as follows (McGlamery et al., 1973; Gangwal and Porter, 1995; Little, 1997; Pradyot, 2003; Guo, 2011).
CH4+2O2→2H2O+CO2 (R1)
MgSO3→MgO+SO2 (R2)
MgSO4→MgO+SO2+1/2O2 (R3)
CH4+3/2O2→2H2O+CO (R4)
MgSO4+CO→MgO+CO2+SO2 (R5)
CH4+2SO2→CO2+2H2O+2S (R6)
It can be found that reactions (R3) and (R5) are two main paths for the destruction of MgSO4. The path of (R3) becomes active under a high temperature and an oxidization atmosphere. With regard to the (R5) path, it is activated under the reducing atmosphere. Meanwhile, its initial temperature is 300°C or so lower than that of reaction (R3) (Zhang et al., 2010; Sun et al., 2013), implying that the materials need absorbing less heat to reach (R5)'s initial temperature in comparison with (R3). Therefore, it just needs less gas supply for the destruction of MgSO4 to be activated through the (R5) path. In addition, the amount of flue gas can be decreased, and the SO2 mole fractions can be simultaneously increased. However, the mole ratio of the earlier reactions show that if the mole ratio of nature gas to air is above 1/7.2, the generated SO2 is reduced to elemental sulfur according to (R6), which leads to a decrease of SO2 content in the calciner gas. As a result, the optimal operation can be built under the conditions of a reducing atmosphere and the mole ratio of nature gas to air lower than 1/7.2.
Effect of feed rate of by-products on the SO2 mole fractions in calciner gas
The feed rate can change the particle concentration and temperature in the furnace, which can affect particle heating, thermal decomposition of the by-products, and SO2 mole fractions in the calciner gas. The high particle concentration is needed to get the high SO2 mole fractions, while the higher particle concentration may lead to the increasing amount of the unreacted by-products in the gas leaving the furnace.
Figure 9 shows that as the feed rate increased, the SO2 mole fractions also increased. SO2 mole fraction in calciner gas was 4.67% if the feed rate of the by-products was 89.6 kg/h. The SO2 mole fractions did not decrease as the feed rate of by-products increased in this figure. The reasons are as follows.
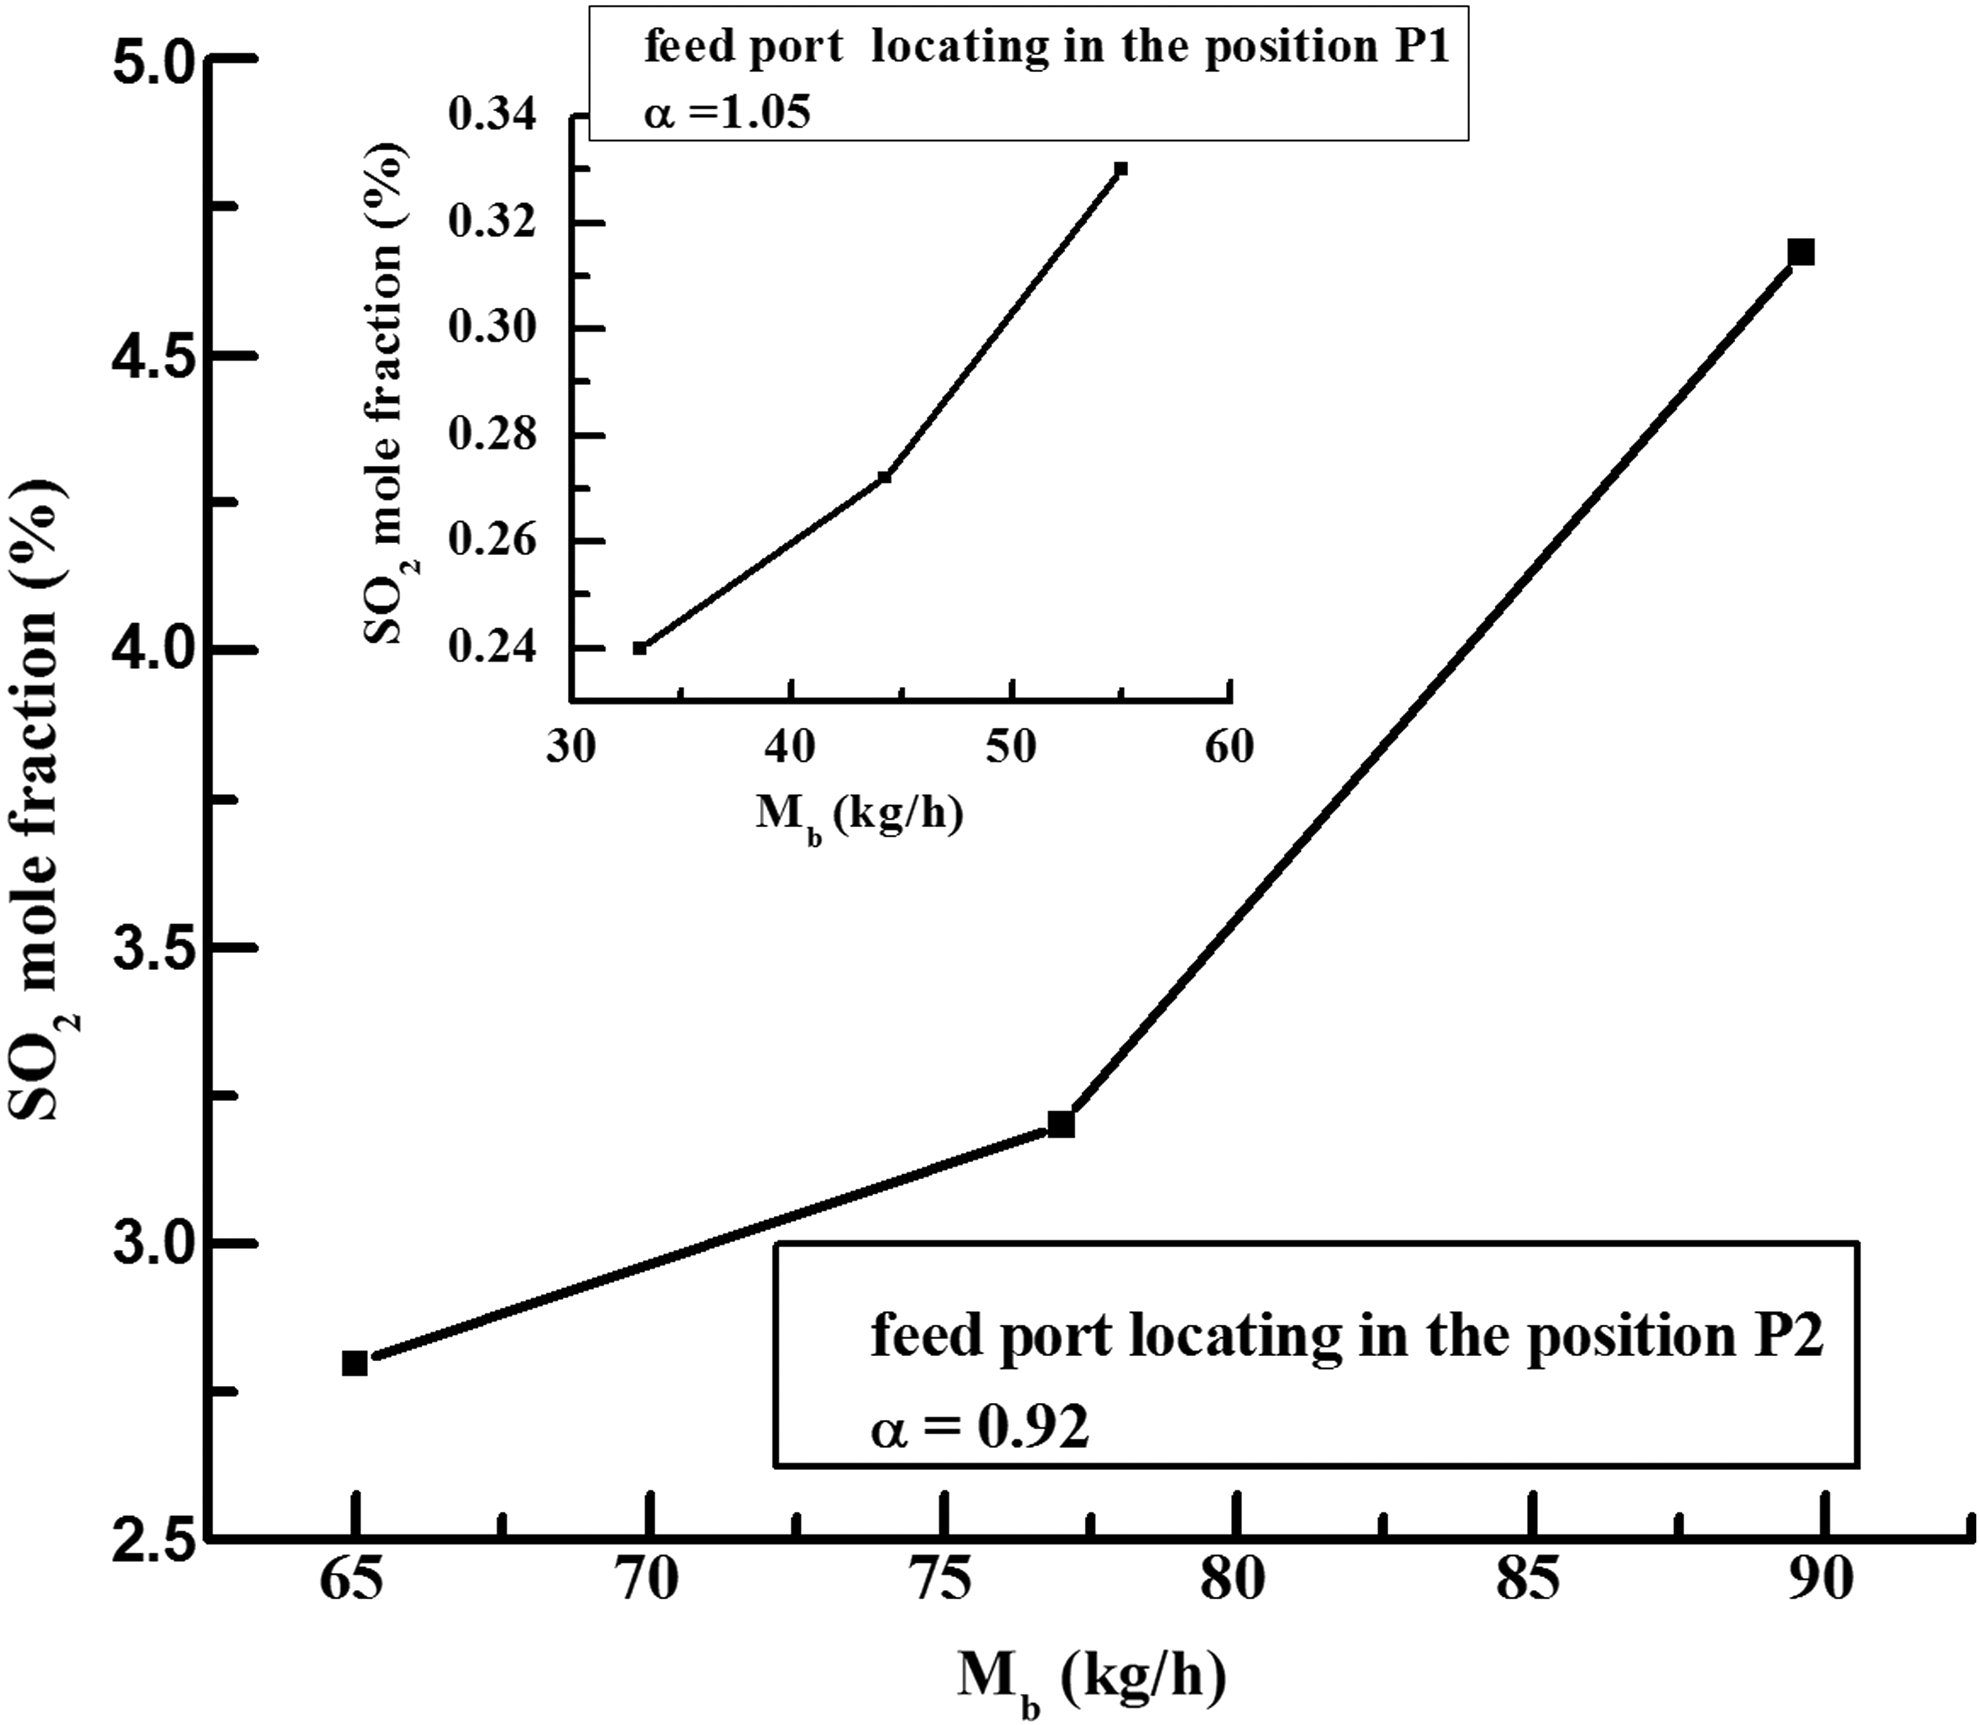
The particle concentration in furnace can be calculated by ρp=ΔP/(Δh·g) (Zhou et al., 2012), where ρp is particle concentration, kg/m3; ΔP is pressure difference along the axial direction of the furnace, and its values are 96.19 Pa, 122.30 Pa, and 179.00 Pa, respectively. The corresponding feed rates were 65.0, 77.0, and 89.6 kg/h, respectively; g is acceleration of gravity, 9.8 m/s2; and Δh is the height difference between two points, 6.50 m. The pressure difference can be calculated by the measured pressure between two points. According to the measured pressure, along the height direction of the furnace, the calculated particle concentrations were 1.51, 1.92, and 2.81 kg/m3 and the corresponding feed rates were 65.0, 77.0, and 89.6 kg/h, respectively. The gas-solid flows were dilute density pneumatic conveying. Particle dispersion was good. By-products in furnace were evenly heated and completely decomposed. Therefore, the minimum feed rate of 89.6 kg/h is feasible for an industry with the same size of the industrial demonstration equipment in this article.
Effect of furnace temperature (TE103) on SO2 mole fraction in calciner gas
It is found that the effects of the furnace temperature on SO2 mole fractions were different under the conditions of different measuring points and atmosphere in calciner. This article studied the effects of the furnace temperature of the measuring point TE103 on the SO2 mole fractions under the conditions of the feed port located in the position P1, the case 1 in Table 1 (oxidizing atmosphere, α≥1) and the position P2, the case 2 in Table 1 (reducing atmosphere, α<1), respectively, as shown in Fig. 10.
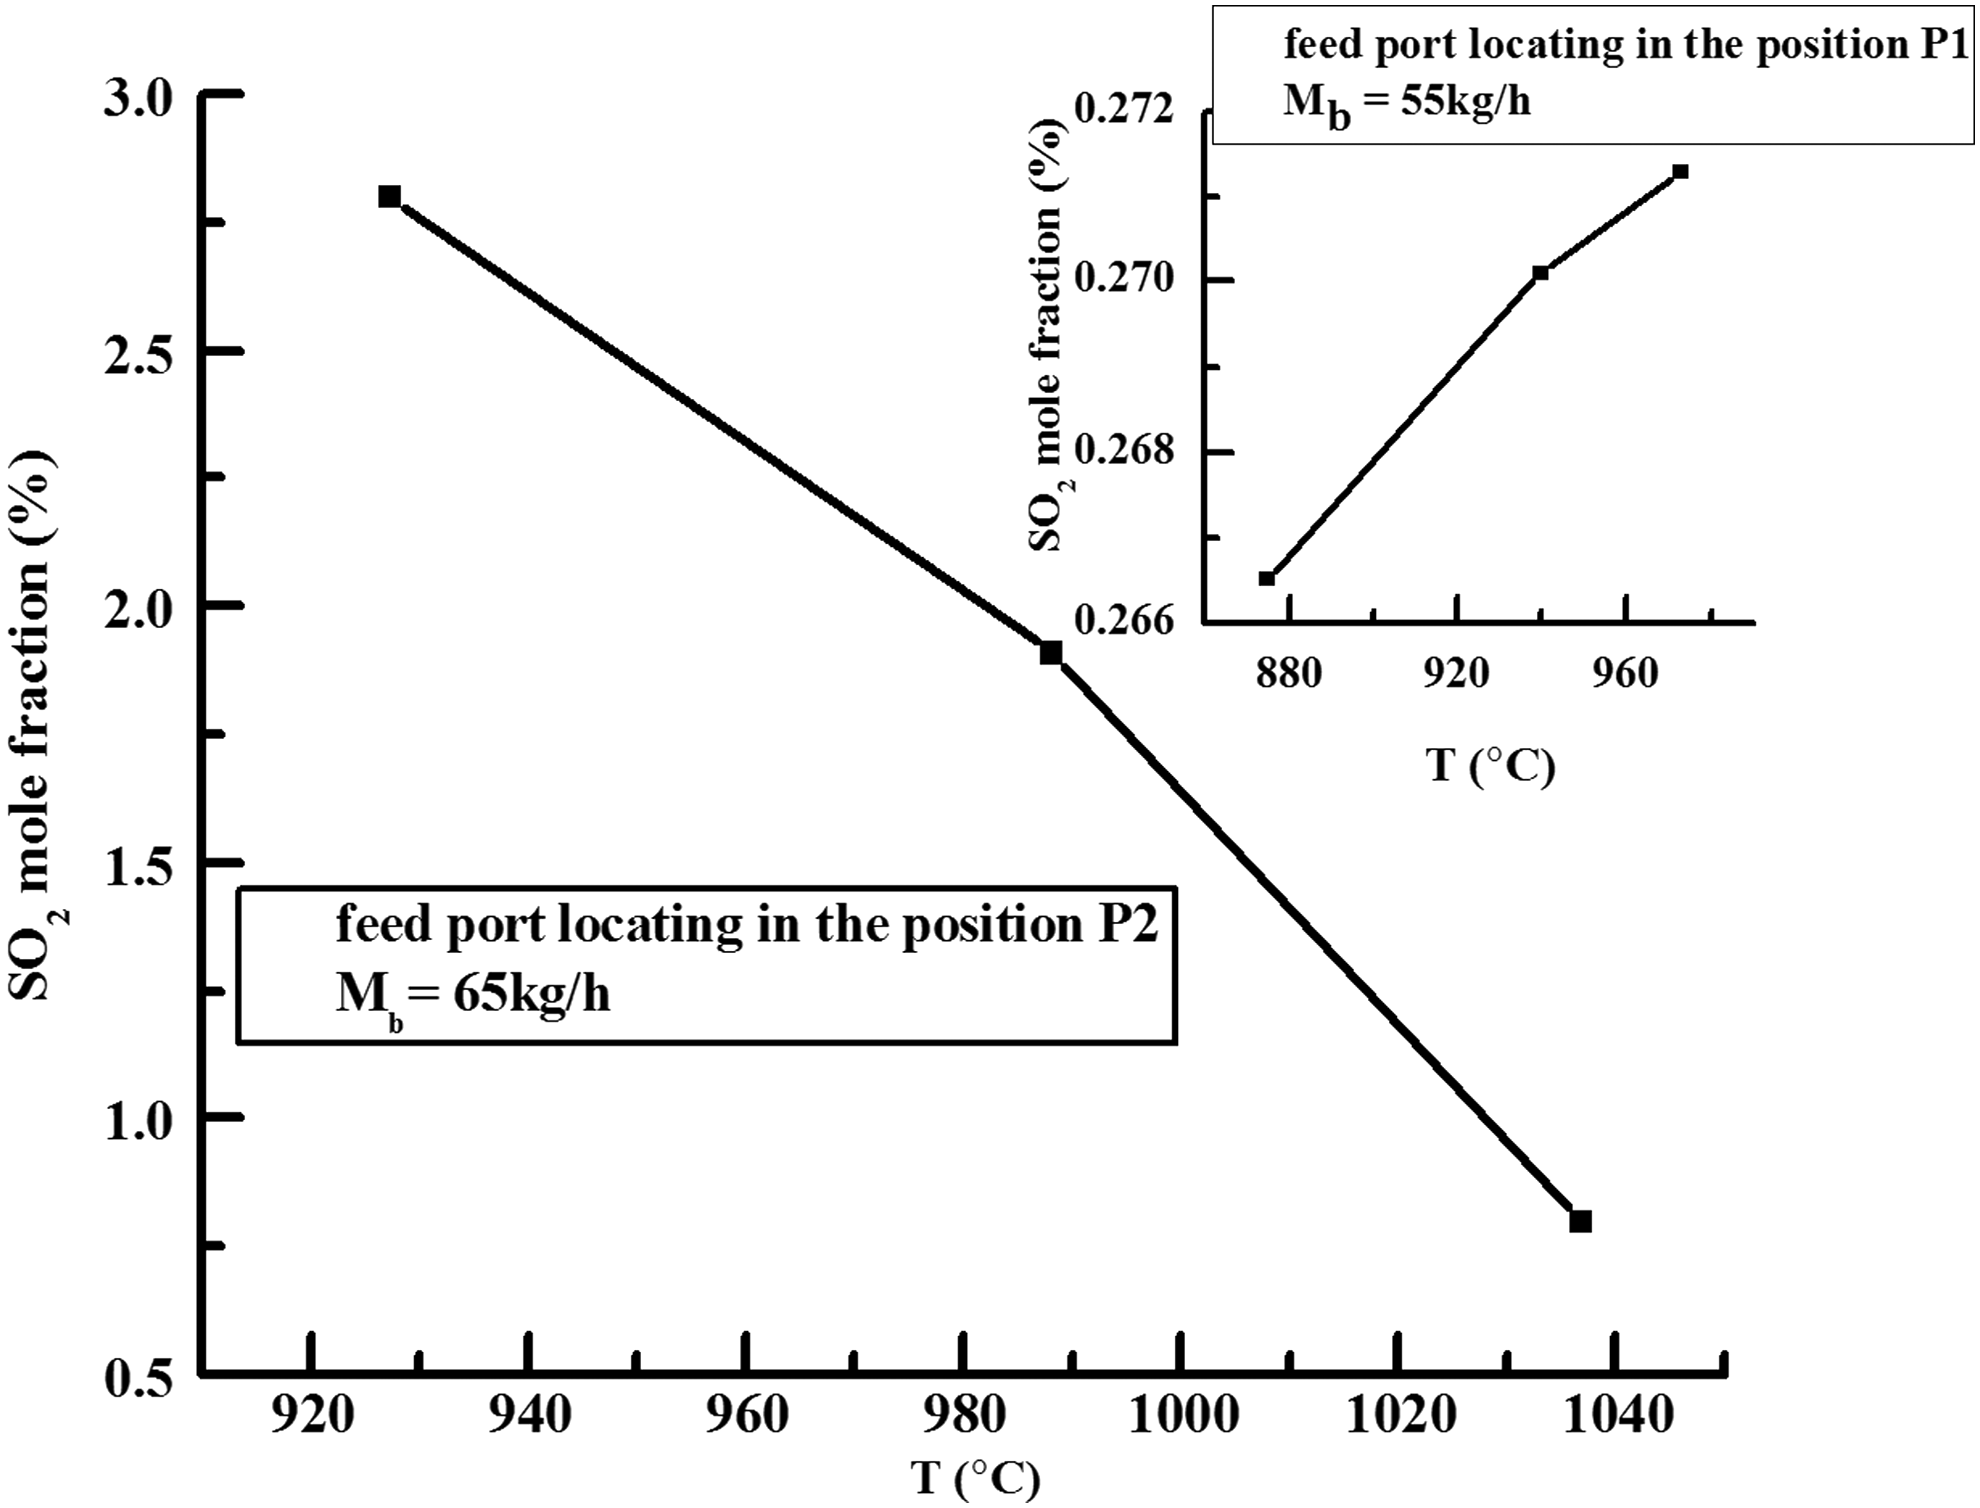
Effect of furnace temperature on SO2 mole fractions.
Figure 10 illustrates that the SO2 mole fractions increased with increasing temperature under the conditions of oxidizing atmosphere and the feed port located at the position P1. Under the condition that the flow rate of nature gas was a constant value, the cold air needed for the higher temperature of the furnace decreased, which led to low flue gas volume and high SO2 mole fractions. However, under the conditions of the reducing atmosphere and the feed port located at the position P2, the SO2 mole fractions decreased with the increasing furnace temperature. With a furnace temperature of 927°C, the SO2 mole fractions were 2.8%; while with a furnace temperature of 1,036°C, the SO2 mole fractions were 0.8%. The reasons are as follows. Under the condition of the flow rate of nature gas being a constant value and reducing atmosphere, the air needed for the higher temperature of the furnace increased, which led to high flue gas and low SO2 mole fractions.
Effect of crystal water content in by-products on the SO2 mole fractions in calciner gas
During the experiment, it is found that moisture could not be released in a timely manner, which caused by-products to cluster and material wrapped within the cluster not to decompose. Table 1 shows that the crystal water content in by-products is high and the temperature of losing crystal is 350°C for the by-products from a commercial desulfurization system (Mcglamery et al., 1973). Thus, this article studied the effect of crystal water content for cases 1–3 in Table 1 on the SO2 mole fractions in calciner gas, as shown in Fig. 11. The feed port is located at the position P1 in this figure.
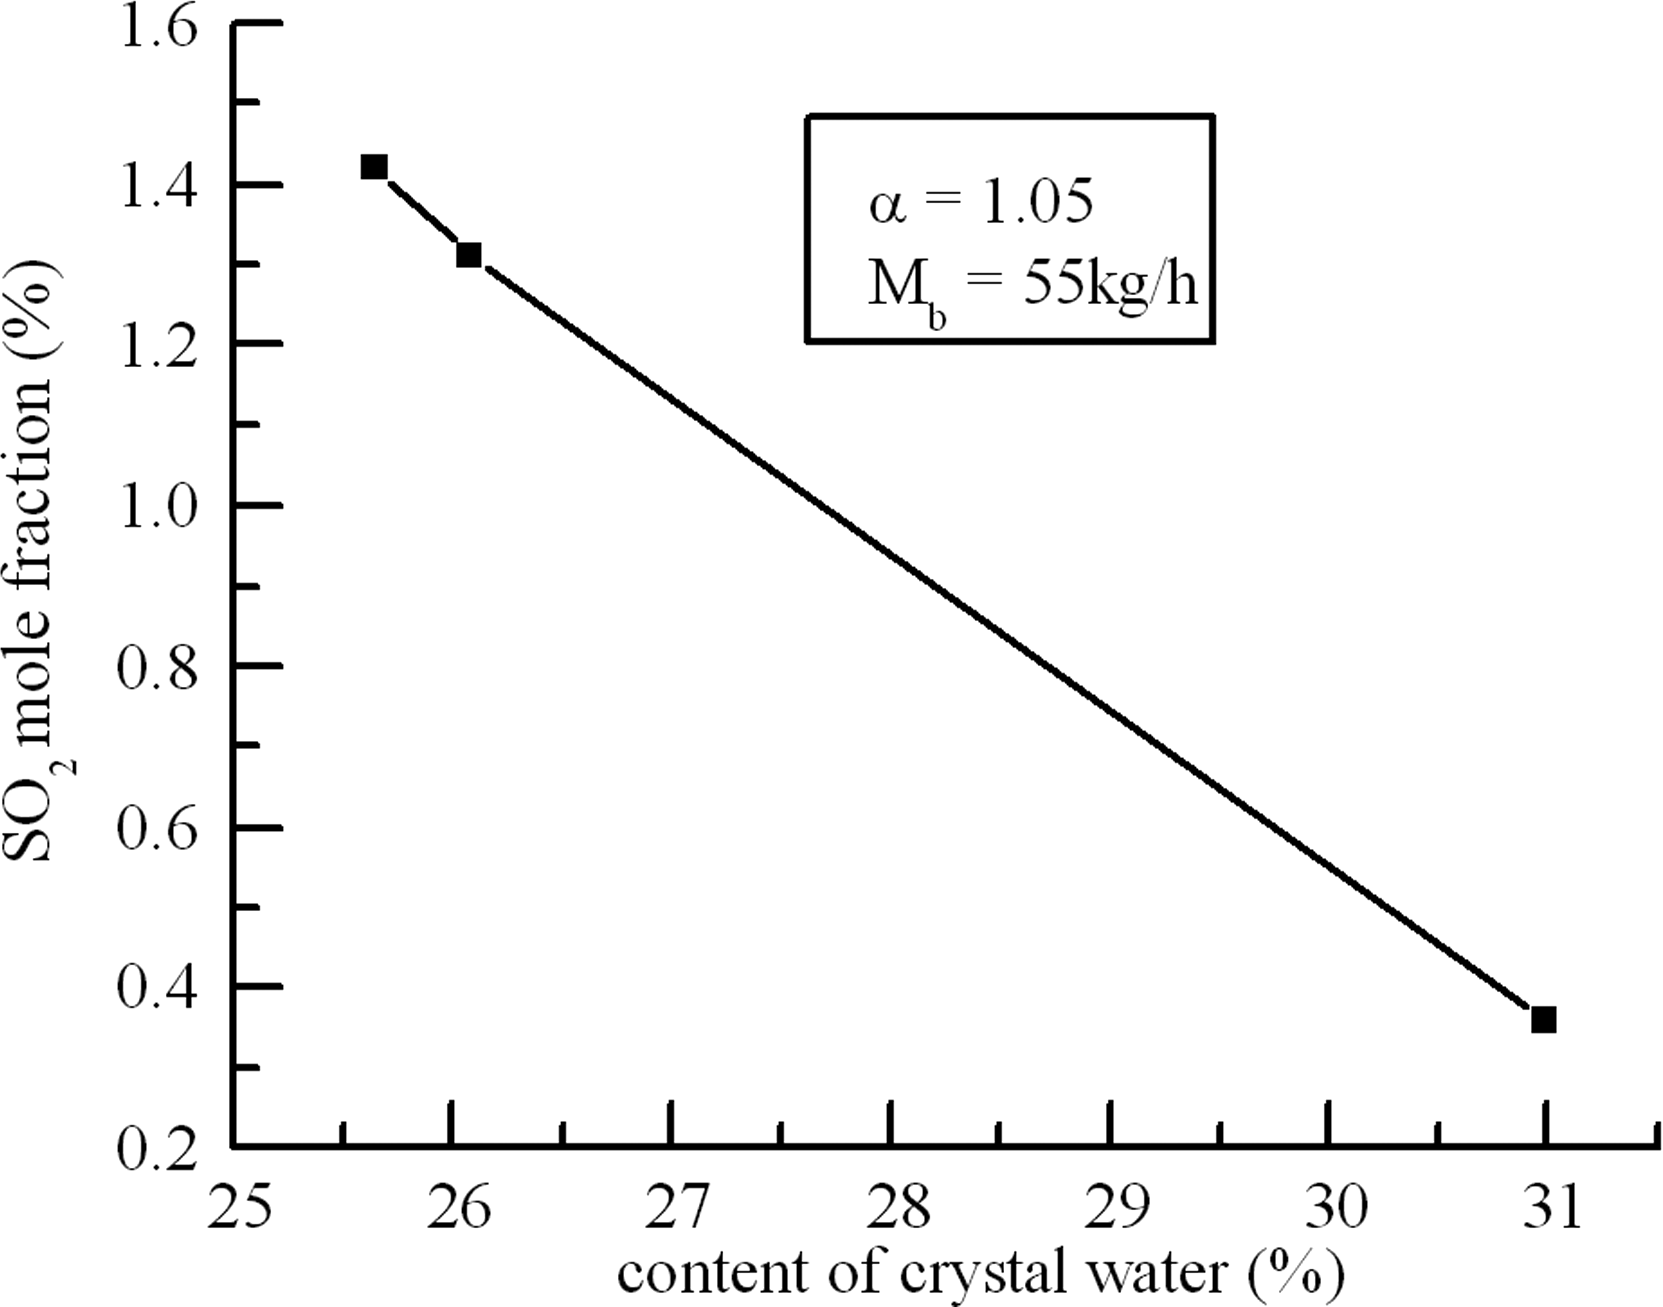
Effect of crystal water content in by-products on SO2 mole fractions.
Fig. 11 shows that the SO2 mole fractions decreased with increasing crystal water content in by-products. This is because while the crystal water rises, a certain amount of heat will be required to heat and vaporize the water, resulting in an increase of natural gas and a decrease of the SO2 mole fractions in calciner gas. In addition, the water vapor in the calciner gases is not condensed, causing some heat to be lost to the environment.
Thus, a special dewatering device before calciner should be installed, so as to improve SO2 mole fractions in calciner gas.
Earlier figures and discussions show that after the feed port was raised and crystal water content in by-products was decreased, the SO2 content in calciner gas can be increased by more than 10 times.
Particle-sized distributions
Particle-sized distributions of sample are shown in Fig. 12. It is found that the effect of the calcination temperature on the particle size distribution for MgO was insignificant. Among the samples, the particle sizes from the bottom slag with a 3.2% reduced quantity were larger than the particles from other locations. The concentrated particle-sized distributions from the calciner outlet and the gas-solid separator outlet ranged from 0 to 58 μm, whose sieving rate through a 250 mesh (58 μm) sieve was 92%. Thus, they can be used as a desulfurizer according to the technical specifications of the desulfurization (Ministry of Environmental Protection, 2005).
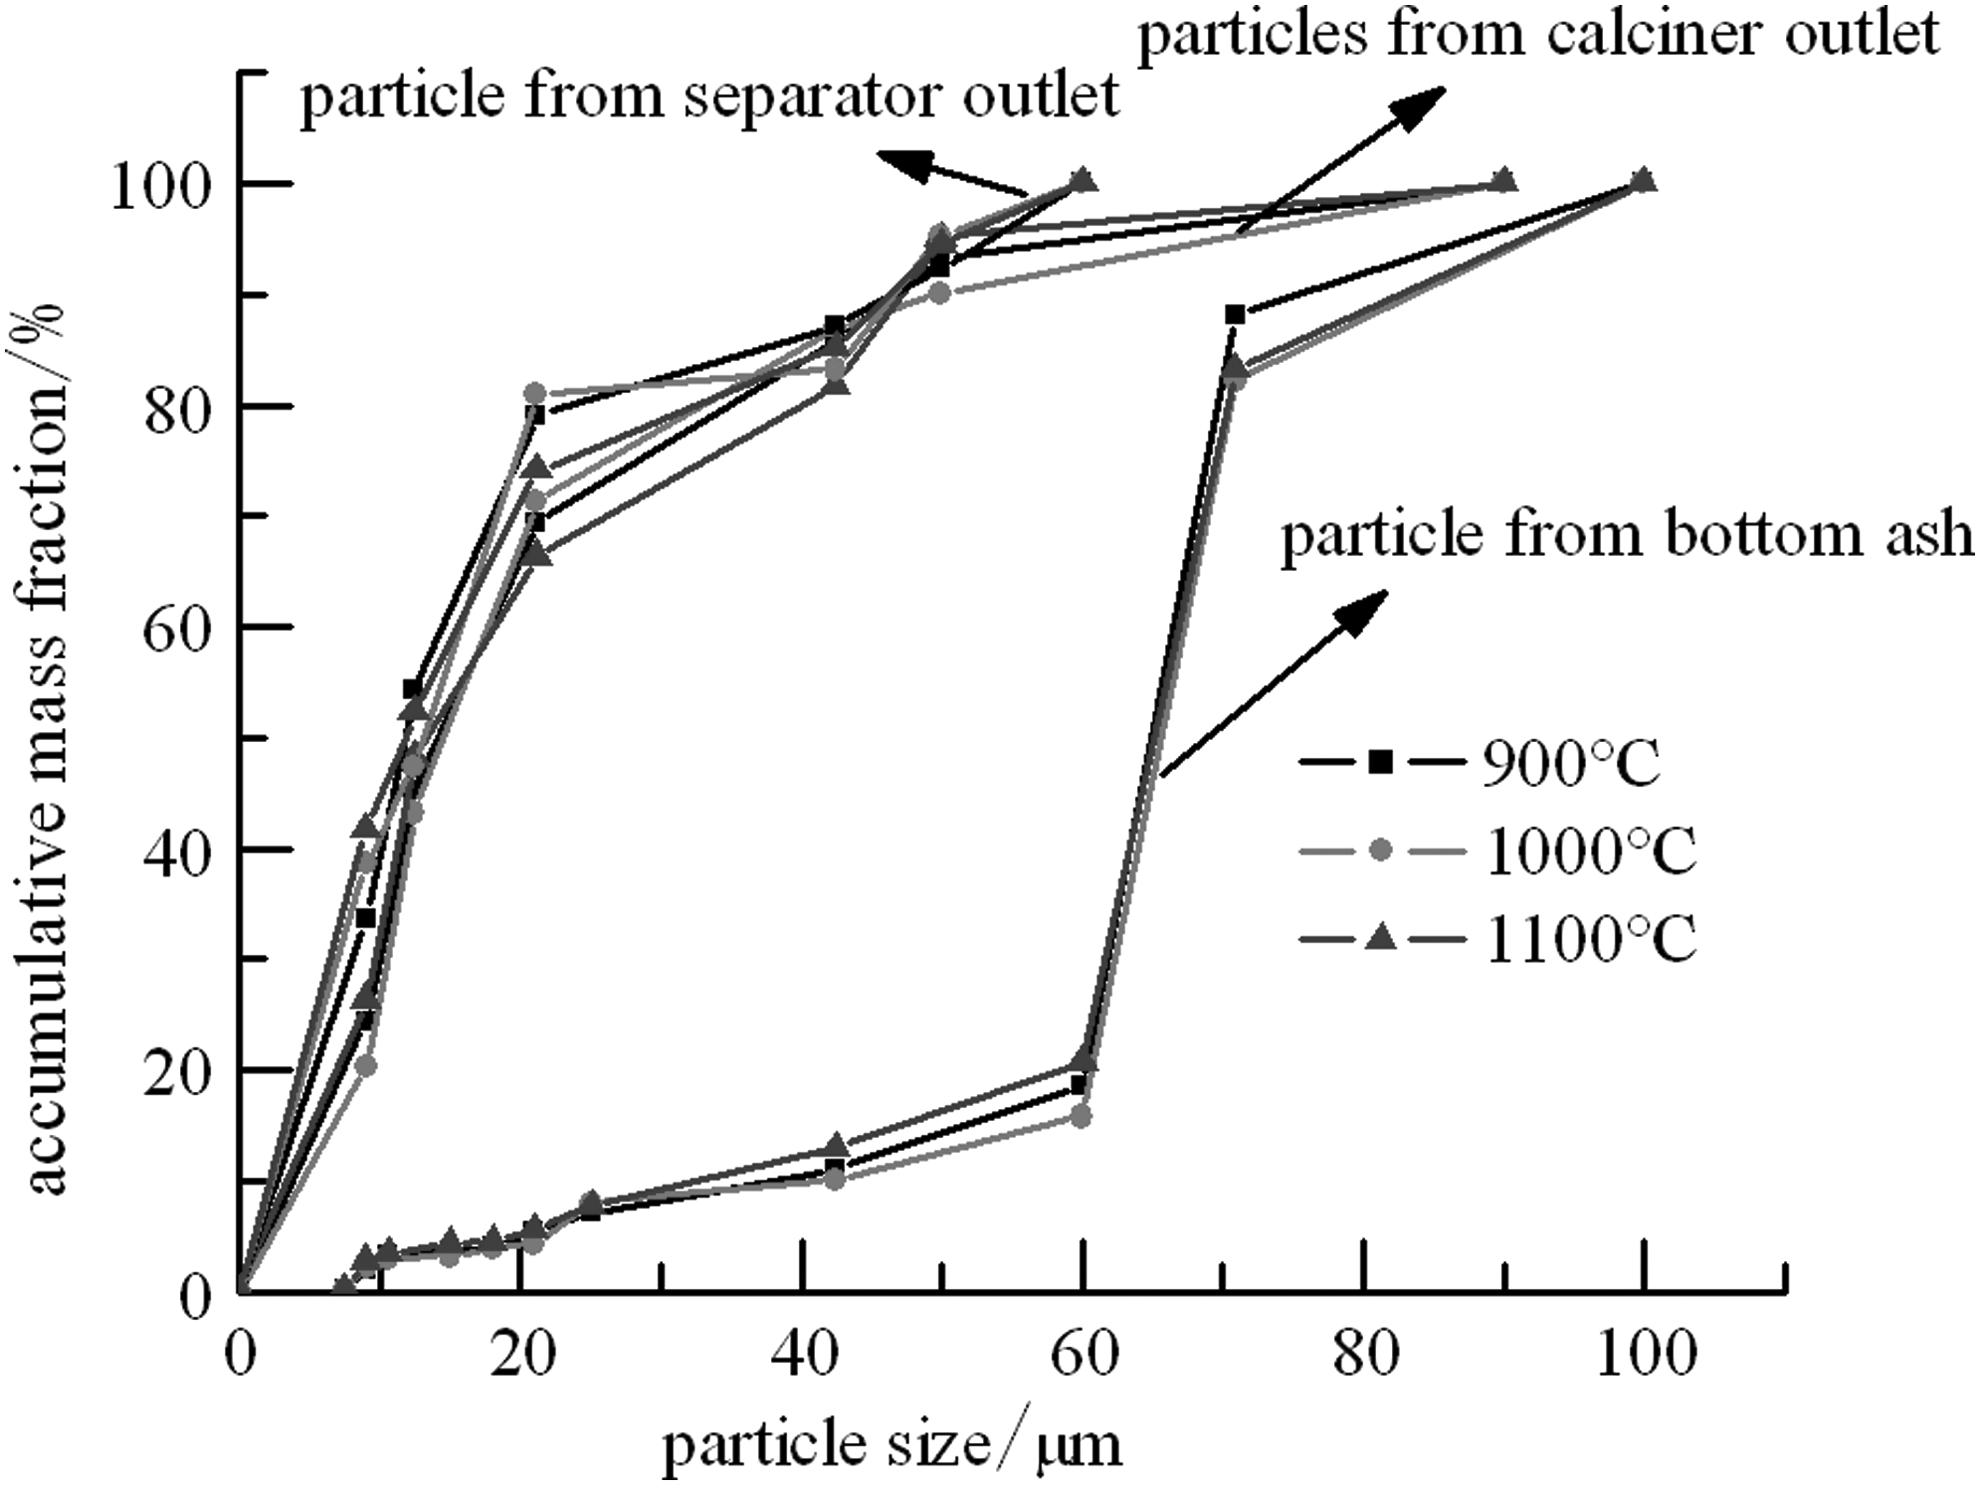
Particle-sized distribution of MgO from calcinered by-products.
SEM method
SEM images of the generated MgO by calcnining by-products are shown in Fig. 13. Figure 13 shows that the generated MgO at the calcination temperatures of 900°C and 1,000°C, with loose and pores structure, exhibited high activity, but with dense structure and slight sintering, exhibited low activity at the calcination temperature of 1,100°C.
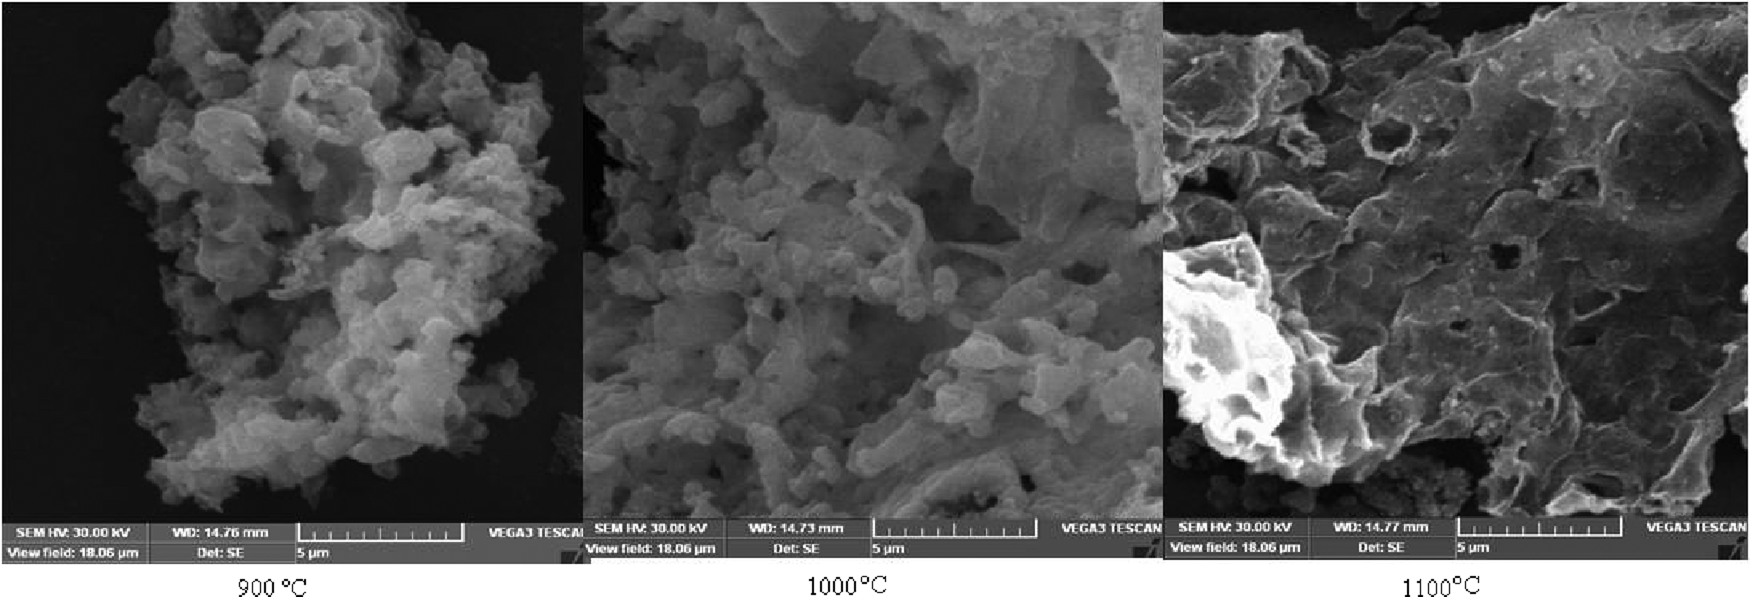
SEM micrographs of MgO.
Citric acid test
The discoloration time of the indicators for the reactions between the citric acid and the generated MgO by calcining by-products, analytical reagent MgO, and primary MgO used as desulfurizer was determined and summarized in Fig. 14. This figure shows that the discoloration time of the indicators increased with increasing calcinations temperature. The discoloration time of the indicators for the generated MgO at the calcination temperature of 900°C and 1,000°C was longer than that for analytical reagent MgO, and shorter than that for the primary MgO used as the desulfurizer, because the gas released during calcining led to increasing particle porosity and specific surface area, which increased the activity of MgO. If calcination temperature was 1,100°C, the discoloration time of the indicators for the generated MgO was longer than that for the primary MgO used as desulfurizer. As a result, the activity for the generated MgO decreased (National development and reform commission of the People's Republic of China, 2006; Kang, 2011).
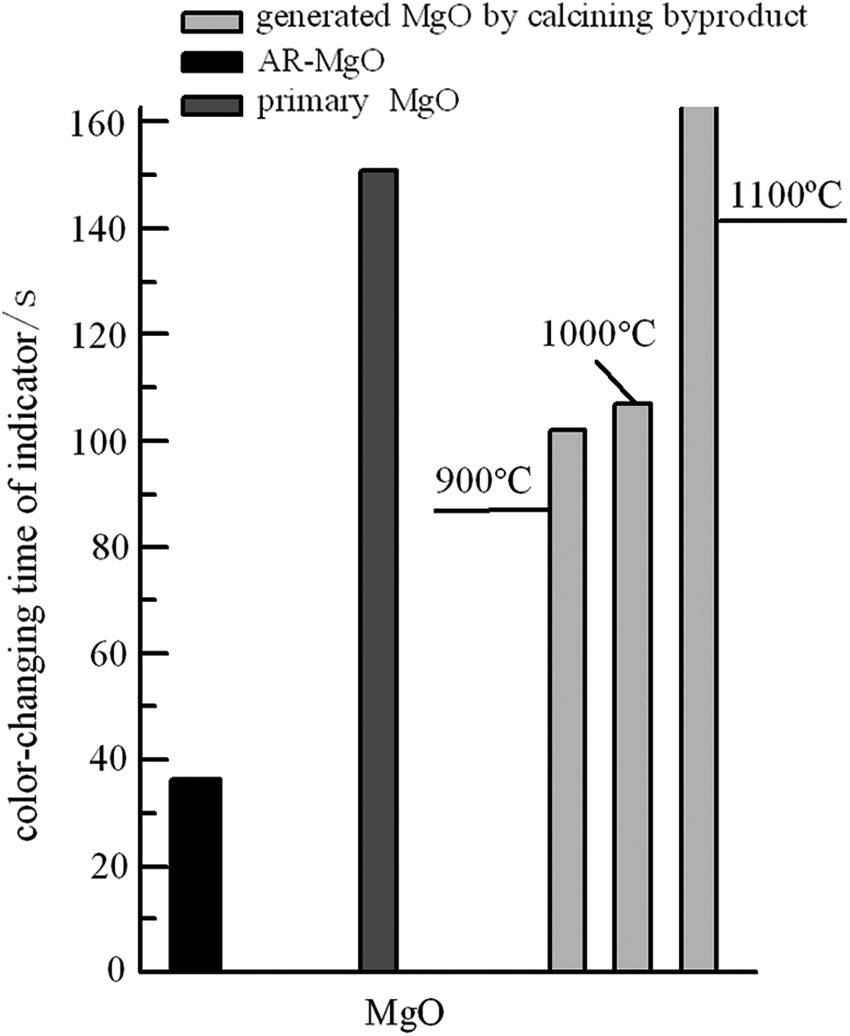
Discoloration time of the indicators in citric acid test.
Summaries
Influencing factors of SO2 mole fractions in calciner gas, including the position of the feed port, excess air coefficient, feed rate, furnace temperature, and crystal water content in by-products, were experimentally investigated in this article. The activities of the generated MgO by calcining by-products at the furnace temperature of 900°C, 1,000°C, and 1,100°C were also investigated in this article. The experiment was carried out in an industrial demonstration unit. The main findings of this study are as follows.
(1) After the position of the feed port of the by-products was raised from the position P1 to the position P2 and the crystal water in by-products was decreased, the feed rate increased, the amount of the air decreased, and reactions in the calciner were complete. As a result, SO2 mole fractions in calciner gas increased by more than 10 times. (2) The SO2 mole fractions in calciner gas were mainly dependent on the excess air coefficient, feed rate of the by-products, and crystal water content in by-products. The excess air coefficient had a strong effect on the SO2 mole fractions. The reduction in atmosphere had contributed to an increase in SO2 mole fractions, but the mole ratio of natural gas to air should be less than 1/7.2 to prevent SO2 from being reduced to element sulfur. High feed rate led to high SO2 mole fractions. By-products dewatered before calcined could improve SO2 mole fractions. (3) The effects of the furnace temperature on SO2 mole fractions were different under the conditions of different measuring points and atmosphere in calciner. The reducing atmosphere, the feed port located at the position P2, and the furnace temperature controlled to 927°C was advantageous to increasing SO2 content. (4) The changes of particle-sized distributions of MgO with different calcination temperatures may be ignored. The activity of the generated MgO by calcining by-products was greatly affected by calcination temperature. The generated MgO at the furnace temperature of 900°C and 1,000°C exhibited high activity, but exhibited low activity with slight sintering at the calcination temperature of 1,100°C. (5) To recycle SO2 as well as MgO from by-products, the temperature range of 900–920°C for TE103 is proposed.
Footnotes
Acknowledgments
The authors gratefully acknowledge the support provided by the Innovation Fund for Technology-Based Firms, Ministry of Science and Technology of China (11c26215115764), Sunic Energy and Environment Technologies (Chongqing) Co., Ltd., and the Technology Planning Project of Jiangxi Province of China (Grant No. 20122BBG70087).
Author Disclosure Statement
No competing financial interests exist.
Nomenclature
IEA: international energy agency
WFGD: wet flue gas desulfurization
FGD: flue gas desulfurization
SP: sampling point
TE: temperature-measuring point
PT: pressure measuring point
P1: the original position of feed port
P2: the position after heightening feed port
Mb: feed rate of by-products, kg/h
Va: air flow rate, Nm3/h
Vng: nature gas flow rate, Nm3/h
T: temperature, °C
t: time, min
h: height along the furnace, mm
SEM: scanningelectron microscope
α: excess air coefficient
V: actual air volume for fuel combustion
V0: Theoretical air volume for fuel complete combustion
ρp: particle concentration, kg/m3
ΔP: pressure difference along the axial direction of furnace, Pa
g: acceleration of gravity, 9.8 m/s2
Δh: the height difference between two points, m
AR: analytical reagent