
Abstract
Abstract
Diffusion of selenate in disc-shaped samples of hardened concrete and mortar pastes was studied using the through-diffusion technique. Experiments were performed under atmospheric conditions for periods of up to several months. Samples had a water to cement ratio (w/c) of 0.4. All tests showed considerable decrease in diffusion rates with time due to CaCO3, Ca(OH)2, and ettringite precipitation, identified by scanning electron microscopy–energy-dispersive X-ray analyses. Effective diffusion coefficients, De, were calculated for selenate anion in the linear region with values of 2.4×10⁻¹² and 7.2×10⁻¹² m2/s for mortar and concrete, respectively.
Introduction
I
Selenium is a significant contributor to dosing in high-level radioactive wastes (Wang and Anderko, 2001). In oxidizing natural waters, the most predominant species are selenite (SeO32−) and selenate (SeO42−) that are poorly retarded by engineering barriers. Probably, sorption on the engineered barriers will be the most effective selenium retarding process. The sorption behavior of selenite and selenate in the cement matrix has been studied, and Rd values are reported in literature by several authors (Johnson et al., 2000; Ochs et al., 2002; Baur and Johnson, 2003; Bonhoure et al., 2006; Pointeau et al., 2006, 2008; Mace et al., 2007; Rojo et al., 2009).
On the other hand, selenium diffusion data on cement matrices are available only through leaching tests with deionized water, where the diffusion coefficient is determined by measuring the trace element released from the solidified matrix into a solution. In this sense, Van der Sloot et al. (1987) reported De values ranging from 3×10⁻¹¹ to 6×10⁻¹³ m2/s in different cement-based stabilized waste products, and Inyang and Gaddam (2006) reported selenium diffusion coefficients of 2×10⁻¹⁰ m2/s in cement-ash monoliths. No effective diffusion coefficient for selenium has been determined from through-diffusion experiments, where the tracer passes from one solution to another crossing the hardened concrete and mortar paste, named through diffusion experiments.
Therefore, the aim of the present work is to provide effective diffusion coefficients and derived Rd-values of selenate from the results of through-diffusion experiments performed on concrete and mortar disc samples under atmospheric conditions.
Materials and Methods
Materials
All chemicals were of pro analysis (p.a.) grade. Stock solutions of selenate were prepared from Na2SeO4 (Fluka). Experiments were carried out at 25°C and open air.
Cementitious materials
Concrete and sealing mortar were provided as hardened materials from El Cabril Spanish low and intermediate radioactive waste repository (Andrade et al., 2006, 2011). Their formulation is given in Table 1. The large cylindrical blocks were cut into slices of ∼4 or 8 cm in diameter and around 0.5 cm in thickness to obtain concrete and mortar samples for the diffusion experiments.
w/c, water to cement ratio.
Cementitious pore water
Synthetic concrete pore water was used to reproduce real concrete pore water composition. Pore water was prepared based on a basic preparation described elsewhere (Wieland et al., 2006). The concrete pore water solution was prepared as follows: 1.38 g NaOH, 1.00 g KOH, and 0.61 mL Na2SiO3 were dissolved in 1 L Milli-Q water, and an excess of Ca(OH)2 (3 g) and CaCO3 (4 g) was added. The suspension was shaken for several days in a closed container. After filtration through a 0.22-μm nylon membrane filter, 0.0033 g Al2(SO4)3·18H2O, 0.04 g Na2SO4, and 0.12 g NaCl were added. Its final composition is given in Table 2, determined using inductively coupled plasma–optical emission spectrometry [Ca, Al(III), Na, K, Si(IV)] (Thermo Fischer Scientific/ICAP 63000MCF Duo) and high-performance liquid chromatography (Cl, SO4) (Agilent 1100 Series with Waters 432 conductivity detector) techniques. pH was measured using a Crison 52 22 electrode calibrated with pH 7.0, 9.21, 10, 11, and 12 commercial buffer solutions.
The uncertainty expresses the standard deviation of measurements in two different water preparations.
Through-diffusion experiments
Using the water immersion technique (Liu et al., 2001), the porosity of the samples was measured. In this way, the concrete and mortar slice samples were weighted dried (10 days in the desiccator) and immersed in boiled water for 3 days (water-saturated samples). Then, the porosity was calculated from the pore volume (=(water-saturated sample)−(dried sample)) divided by the total volume. These values are indicated in Table 3, together with the characteristics of the experiments.
Then, the slice samples were mounted and fixed at the poly(vinyl) chloride diffusion cell by using epoxy resin. The diffusion cell consists of a large-volume source cell (1,000 mL), a small-volume sampling cell (25 mL), and a concrete/mortar sample mount in between. Concrete pore water spiked with appropriate amounts of Na2SeO4 solution was introduced into the large-volume source cell and an amount of fresh concrete pore water was introduced into the sampling cell. To keep the solutions of both cells homogenized during the diffusion experiments, both cell solutions were recirculated with the help of a peristaltic pump (García-Gutiérrez et al., 2006).
A sample of 12 mL of solution was taken from the sampling cell weekly, and 12 mL of fresh concrete pore water was immediately added into the sampling cell after each sampling. Periodically, the source cell was also sampled to control its concentration. Diffusion experiments lasted for 11 months.
The selenium concentration was analyzed by inductively coupled plasma–mass spectroscopy (Perkin-Elmer/Elan 6000 and Agilent/7500cx spectrometers) after sample acidification.
The concentration in the sampling cell (C(t)) was never allowed to rise above 1% of the concentration in the source cell (C0). This was an experimental approximation to the downstream boundary condition [C(t)≈0, t>0] required for an analytical solution of the diffusion equation, which was used to determine De and sorption values (Sarott et al., 1992).
The scanning electron microscope (SEM) observations combined with energy-dispersive X-ray (EDX) analyses (Zeiss Ultra Plus SEM and Oxford Instruments EDX system) were performed on solid samples before and after the experiments.
Evaluation of the diffusion data
To analyze the diffusion data, the analytical solution to the diffusion equation, which describes the diffusion behavior in the steady-state (linear) region, was used. The expression of the cumulative mass tracer (M, mol) that has passed the out-reservoir, through a cross-sectional area A (m2), as a function of time (t, s) is simplified at long time periods as follows:
where d (m) is the sample thickness and α (−) is the rock capacity factor (García-Gutiérrez et al., 2006) of the porous medium.
The effective diffusion coefficient (De, m2/s) can be calculated then from the slope of the straight line fitting the long-term behavior M with time, according to Equation (2). The intercept of Equation (1) with the axis time is commonly denoted as time-lag (t0, s).
The rock capacity factor (α) can be calculated from the time-lag value and De from Equation (3).
Knowing the rock capacity factor, the distribution coefficient, Rd (m3/kg), value can be calculated using the bulk density (ρ, kg/m3) and porosity (ɛ,−) [Equation (4)].
Finally, the relationship between the effective diffusion coefficient and the apparent diffusion (Da, m2/s) is defined by Equation (5).
Results and Discussion
Selenate diffusion data
Accumulated selenate diffused mass as a function of time is plotted in Figure 1 for the experiment with concrete and in Figure 2 for the experiment with mortar. Three regions can be distinguished in the graphics. In the first region, initial 40 days, selenite starts to diffuse across the samples, which is accompanied by a fast increase in the flux values. This region is referred to as the transient region (region I). After region I, a linear relationship is obtained between the diffusion of selenate and time the steady-state region is achieved (region II). This is the region where the effective diffusion can be calculated. These two regions (region I and II) are the only ones expected in an ideal situation (Shackelford, 1991). However, from Figures 1 and 2, it is clear that, after the linear region, the cumulative diffused mass decreases, tending in the case of mortar to a plateau (region III).
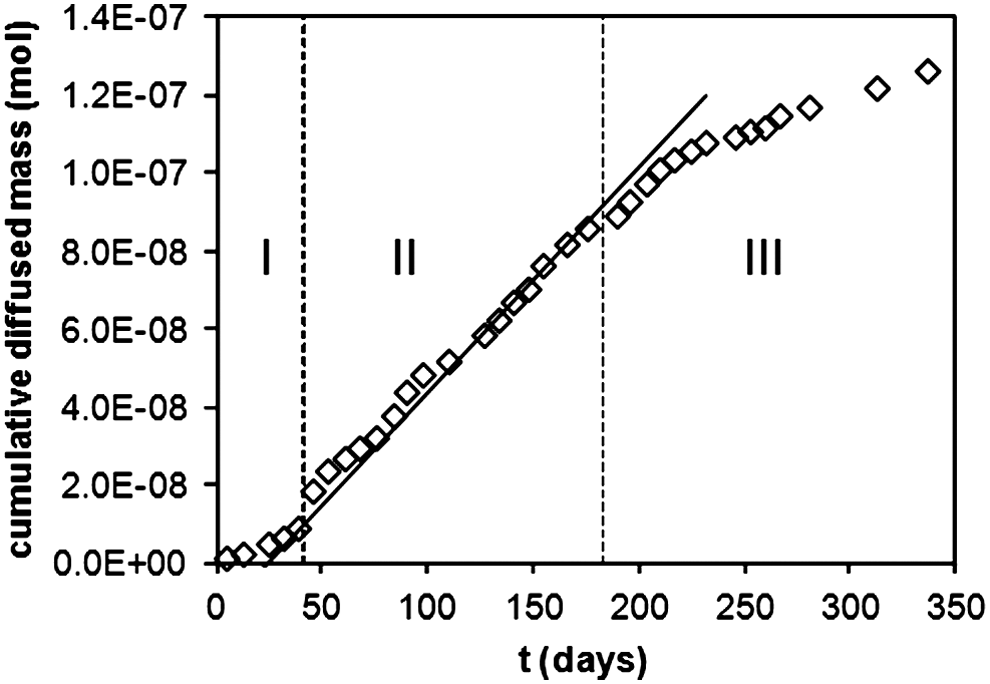
Cumulative selenate mass recovery versus time in the through-diffusion experiment with concrete. The linear fit of the steady-state region is also indicated (solid line).
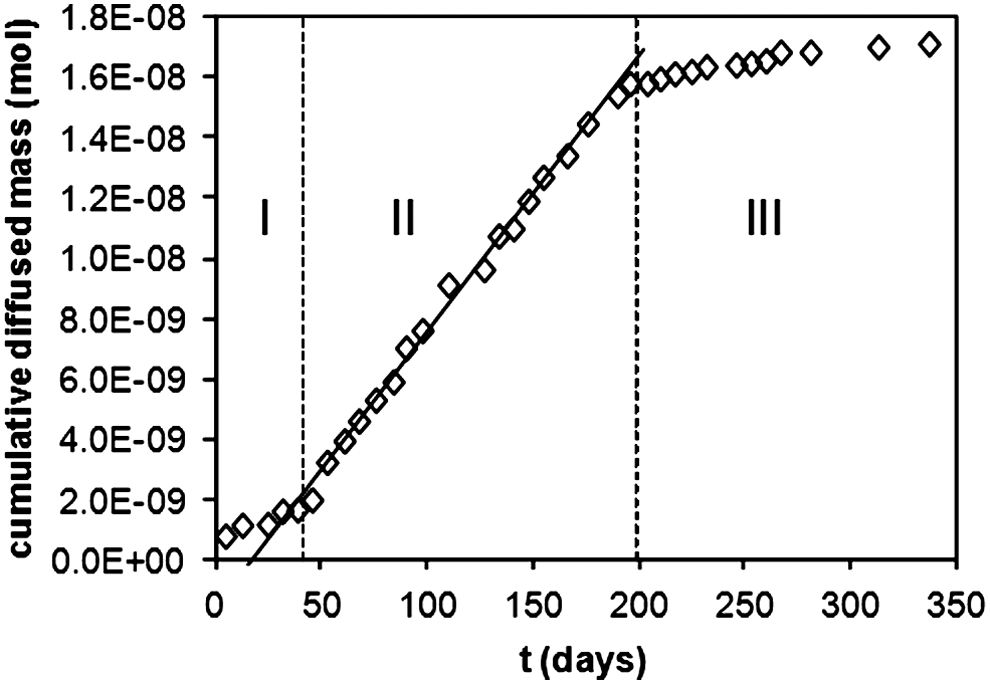
Cumulative selenate mass recovery versus time in the through-diffusion experiment with mortar. The linear fit of the steady-state region is also indicated (solid line).
From the linear regression analysis in region II, data from 38 to 195 days, the effective diffusion constant value calculated for mortar, using Equation (2), was of 2.4×10⁻¹² m2/s (R=0.995). In the same manner, a value of 7.2×10⁻¹² m2/s was obtained in concrete for the effective diffusion constant by linear regression of data between 126 and 175 days (R=0.993). The linear regression curves are also drawn in Figures 1 and 2. As it is seen, for both materials, the effective diffusion constants of selenate are of the same order of magnitude.
Although no other selenate De values have been found in literature specifically for concrete and mortar samples, several selenate De-values have been determined in other materials of interest in nuclear waste repositories. Stenhouse et al. (1996) reviewed the experimental diffusion data for different elements in clay minerals and provide diffusion coefficients. In the case of selenium, the authors recommended an apparent diffusion coefficient for selenium of 2×10⁻¹¹ m2/s. Serne et al. (1992) measured effective diffusion coefficients for numerous radionuclides through laboratory leach tests. The leach tests were performed on solid specimens made by solidification of mixture of low-level Hanford waste liquids and a mixture basically of Portland cement, fly ash, clay minerals, and blast furnace slag. The determined effective diffusion coefficients were 4.5×10⁻¹⁵ and 1.4×10⁻¹⁴ m2/s for the initial selenate concentration of 0.3 and 3 mol/dm3, respectively. More recently, Lee et al. (2009) determined the selenium diffusion parameters in through-diffusion column tests in crushed mudrock with a selenium 10−4 mol/dm3 concentration. Their Da and De values were on average 2.6×10⁻¹¹ and 1.0×10⁻¹² m2/s. Although these results are not really comparable to the present study, the order of magnitude is not so different from the values obtained in this work.
Table 4 compiles the parameters determined, in particular the De-values. The time required to establish steady-state conditions is around 20 days time-lag. The values for the rock capacity factor, calculated from Equation (3), are given in Table 4. The dry bulk density, calculated from the fraction of the dry solid weight and the total volume (from Table 3), was 2,480 and 2,548 kg/m3 for mortar and concrete samples, respectively. Applying these values to Equation (4) derives Rd values collected in Table 4.
Uncertainties were calculated by error propagation from one experiment.
Reported literature Rd values determined in batch experiments are several orders of magnitude higher than the values determined in the present work (Ochs et al., 2002; Baur and Johnson, 2003; Bonhoure et al., 2006; Rojo et al., 2009), indicating the high influence of the method and conditions of determination on the Rd.
To explain the flux decrease in region III, the discs surfaces were analyzed by SEM-EDX. Figure 3 shows the SEM images of the mortar/concrete surfaces at the beginning and at the end of the through-diffusion experiments. There are two main differences between the surfaces at the start and at the end of the experiments: (a) the disappearance of pinholes present at the initial surface and (b) the formation of white precipitates in both faces. The SEM images showed different areas with different forms of crystals, from needles and stacked trigonal crystal aggregates (Fig. 3B) to stacked rhombohedral crystal aggregates (Fig. 3C) and flowers (Fig. 3D).

Scanning electron microscope images of mortar
The EDX was used as a direct probe of crystal elemental composition. The elements found in the needle-shaped crystals were O, Al, S, and Ca with a S/Al stoichiometric ratio of ∼1.5, which is in good agreement with the S/Al ratio of ettringite (Ca6Al2(SO4)3(OH)12·26H2O), a solid that has been found to precipitate when high alumina was contacted with artificial groundwater (Ochs et al., 2002). The EDX analysis of the triangular and rhombohedral crystal areas showed an elemental composition of C, O, and Ca with an O/Ca ratio of 2, suggesting that these crystals are CaCO3. Finally, the EDX spectra of the flower crystals showed O and Ca at O/Ca of 2, which could correspond to Ca(OH)2. Precipitation of ettringite with impurities of CaCO3 and Ca(OH)2 was also observed in long-term batch experiments performed with triturated cement I-42.5 R/SR, the base cement of the concrete used in this work (Rojo et al., 2010).
Therefore, a reasonable explanation for such flux decrease in region III is the precipitation of ettringite, CaCO3, and Ca(OH)2, which blocks the pores on both sides of the concrete and mortar samples, thus reducing the diffusion rate.
Conclusions
In this article, the through-diffusion experiments were used to estimate, for the first time, the selenate effective diffusion coefficient on concrete and mortar. Results were obtained with disc samples prepared at the water to cement ratio of (w/c)=0.4, porosity ∼0.1, constant selenate concentration of 1×10⁻⁶ mol/dm3, and under atmospheric conditions (PCO2 ∼ 10−3.5 bar). The plots of accumulated selenate diffused mass versus time showed three regions: (I) a transient period, (II) a stationary state (linear period), and (III) a decreasing period. The linear regression of data in region II, gave an effective diffusion coefficient De for selenate of 7.2×10⁻¹² and 2.4×10⁻¹² m2/s for concrete and mortar, respectively. The distribution coefficients (Rd values) derived from the corresponding De values were of the order 10−4 m3/kg. Finally, the decrease in the diffusion rate observed at long time (>200 days, region III) could be explained by surface pore blocking with ettringite, CaCO3, and Ca(OH)2 precipitation detected by SEM-EDX.
Footnotes
Acknowledgments
The authors thank the Spanish Radioactive Waste Management Co. (ENRESA) for facilitating the samples and for financial support. They also thank the anonymous reviewer for improving the quality of the article.
Author Disclosure Statement
No competing financial interests exist.