
Abstract
Abstract
Laser-induced breakdown spectroscopy (LIBS) was applied to the analysis of ecotoxic metals in water samples, an issue of major importance for environmental monitoring. Pollution in water bodies around Dhaka city, Bangladesh (Lat 23.7 N, Long 90.4 E), was surveyed. Water samples were collected from Dhaka, the capital city of Bangladesh: Hazaribagh tannery area, Hatirjheel, Kamrangirchar, Dholaikhal, Sadar Ghat, and Showari Ghat. Apart from naturally occurring elements (e.g., Ca, Fe, Mg, Ti, Sr, Si, Al, Na, K, Li, and C), hazardous elements Cr, Co, and Ni were also found in these samples. To determine the concentration of chromium, we did quantitative analyses of the sample by atomic absorption spectroscopy. We found that the overall concentration of Cr is about 0.30 ppm or 0.30 mg/L in the Hazaribagh area in the rainy season, which is several times higher than the permissible limit of Cr (0.1 mg/L by EPA and 0.05 mg/L established by the World Health Organization) for drinking water. We did not detect lead in our samples, probably because the concentration of lead was below the detection limit of our LIBS system.
Introduction
L
One of the very useful applications of LIBS is the trace element analysis of pollutants in soils and environment both in laboratory and in in situ measurements using mobile LIBS systems (Ciucci et al., 1996; Hilbk-Kortenbruck et al., 2001; Capitelli et al., 2002; Corsi et al., 2006; Bousquet et al., 2008; Senesi et al., 2009; Gaudiuso et al., 2010). Multielemental analysis of marine sediments in an Antarctic expedition was done by using a compact LIBS system on board a ship (Barbini et al., 2002).
Problems and limitations of calibration LIBS, calibration-free LIBS and time-resolved LIBS in quantitative analysis and ways to overcome those have been described by a number of researchers (Ciucci et al., 1996; Tognoni et al., 2002, 2010; Corsi et al., 2006; Fantoni et al., 2008). However, the quantitative analysis of elemental content of samples has always been the weaker aspect of LIBS technique in terms of speed of analysis as compared to other methods like atomic absorption spectrophotometry (AAS).
It is also conceivable to apply the fundamentals of LIBS method to the trace elements in liquids, in particular, water. In an earlier work, LIBS was applied for quantitative measurement of trace elements in water (Nakamura et al., 1996; Arca et al., 1997).
In a subsequent work (Rai and Rai, 2008), LIBS analysis was performed, using a liquid jet, in waste water samples collected from the Cr-electroplating industry, and varying concentrations of Cr have been recorded. The detection limit of Cr was found to be 1,500 ppm, which was relatively high. In another article, the detection limit of Cr was 200 ppm (Koch et al., 2004) in coastal tidal waters. If the Cr was diluted with water, it would not be possible to detect the Cr because of a high detection limit. In another article, LIBS was used for the analysis of waste water collected from a dairy products processing plant (Hussain and Gondal, 2008) and the major elements detected in the waste water sample were Ca, Mg, P, Si, Fe, Na, and K.
In a recent work, arsenic in water in solution at the sub-ppm level has been detected by a combination of LIBS technique and adsorption, although at the cost of speed of detection (Haider et al., 2014). In this work, the multielement detection capability of LIBS was used to its full advantage. We have previously used the technique of LIBS for the study of environmental pollution of surface water in some parts of the city of Dhaka (Ahmed et al., 2009; Sadat et al., 2010).
In an actual environmental situation, pollutants in water can be found in dissolved and suspended states. Detection and control of fine particles or colloids in a solution are of particular interest in modern manufacturing. With this in mind, we performed LIBS analysis of water samples from different areas of Dhaka city, Bangladesh. Because of the low detection limit of LIBS, it is unrealistic to expect detection of many heavy metals in actual environmental samples in the dissolved state. For this reason, we filtered water samples and performed LIBS analysis on suspended solids. In this way, we expected to detect a number of heavy and ecotoxic metals whose insoluble compounds may be in suspension, such as chromium, manganese, and lead. It is well known that these metals and their compounds are widely used in tannery, electroplating, and paint industries present in and around Dhaka City.
Dhaka, Bangladesh (Lat 23.7 N, Long 90.4 E), is a densely populated megacity having a population of ∼12 million. Its condition is getting worse with increasing population and lack of proper planning. Pure water is the most essential requirement for living animals. However, in Dhaka city, it is very hard to get sufficient quantity of usable pure water due to water pollution. Water pollution is caused due to the indiscriminate discharge of untreated industrial wastes and harmful chemicals and compounds into water bodies (ponds, lakes, rivers, etc.). It is suspected that harmful elements, including heavy metals, are discharged into the water, which makes it unsuitable for drinking and other purposes. This makes the water useless for humans and also endangers aquatic life.
In the present study, an extensive survey of water bodies around Dhaka city was carried out. We collected water samples from the following areas of Dhaka city: Dholaikhal, Kamrangirchar, Hazaribagh, Hatirjheel, Sadar Ghat, and Showari Ghat to develop our methodology and the detection limit. To our knowledge, this is the first survey of pollution of water bodies carried out in any geographical area by the LIBS technique.
Experimental
Instrumentation
The schematic diagram of our LIBS system is shown in Figure 1. The excitation laser is a Q-switched Nd:YAG laser system (Spectra-Physics LAB-170-10), which has an output at a fundamental wavelength of 1,064 nm with a pulse duration of 8 ns, a repetition rate of 10 Hz, and a pulse energy of 850 mJ. The laser is also equipped with harmonic generators capable of generating the second, the third, and the fourth harmonics of the fundamental at 532, 355, and 266 nm and produces maximum energies of 450, 220, and 90 mJ per pulse, respectively. The diameter of the laser beam is ∼10 mm (Haider et al., 2012). Intense transient plasma is produced by focusing the laser beam on the sample by using a glass convex lens of 10 cm focal length.
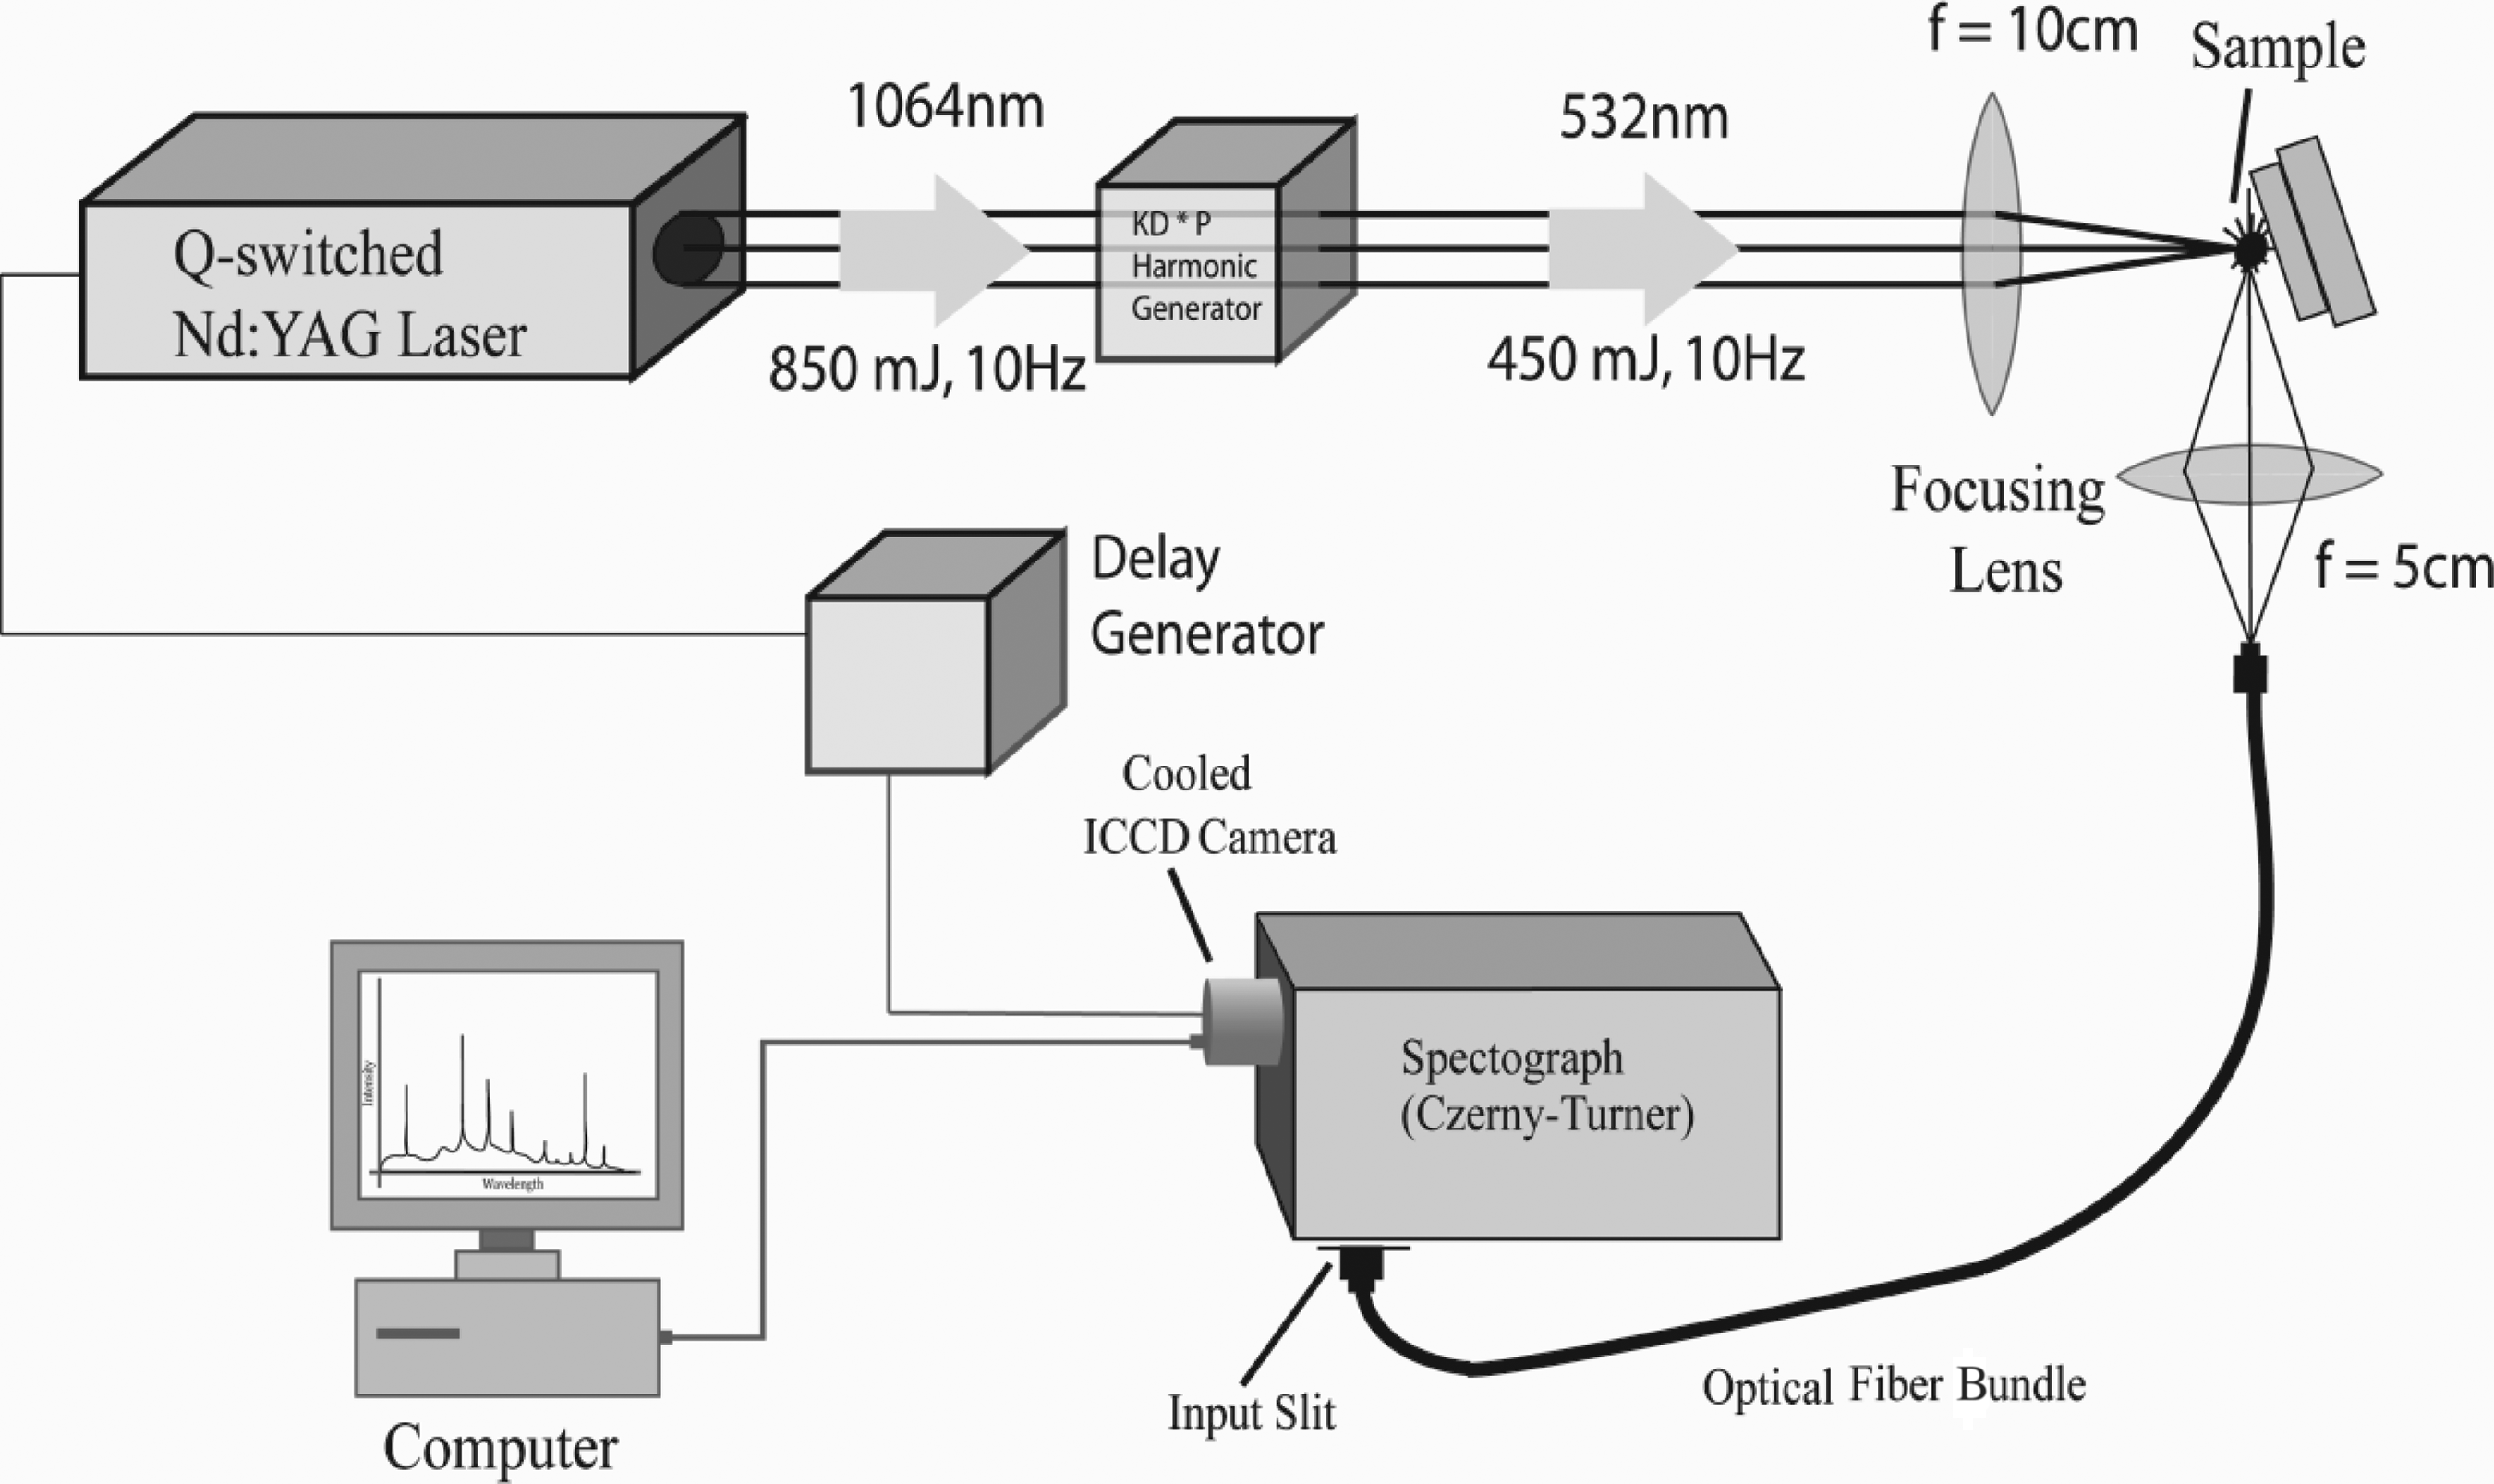
Schematic diagram of the experimental laser-induced breakdown spectroscopy (LIBS) system.
The plasma is generated at the laser frequency, that is, at 10 Hz. The light emitted from the plasma is collected by a 3-m-long multimode optical fiber and is transmitted to its other end, which is placed at the entrance slit of a 750 nm focal length computerized Czerny-Turner spectrograph (Acton Model SP-2758). The spectrograph is equipped with three ruled gratings; 300 grooves per mm blazed at 300 nm, 600 grooves per mm blazed at 500 nm, and 2,400 grooves per mm blazed at 240 nm, which are interchangeable under computer control.
The selection of the gratings determines the resolution of the instrument. If 600 grooves per mm grating is used, a spectrum of about 38 nm width can be captured without moving the grating, and for the 2,400 grooves per mm grating, it is about 8 nm. However, this width (8 nm) is insufficient to cover all the wavelengths of the emission spectrum from the sample. Hence, to cover a wider spectral range, the grating was stepped under computer control, and spectrum acquisition performed at each grating position and spectra were stitched whenever necessary.
In this LIBS setup, the output end of the spectrograph is coupled with an intensified and gated CCD camera (Princeton PI-MAX with Unigen II coating) and programmable delay generator. The ICCD camera has 1,024×1,024 pixels CCD with multichannel plates and is cooled to −20°C by a Peltier cooler. The camera is electrically triggered by the Nd:YAG laser pulses after a software-controlled, adjustable time delay.
With a suitable time delay, the intense background initially created by the high-temperature plasma can be largely eliminated and the atomic emission lines of the elements more clearly observed. In most of our experiments, a time delay of about 1.5 μs was selected. Usually, spectra from a number of laser shots (about 40–80) are acquired and averaged to increase the signal-to-noise ratio. The spectrum captured by the camera was transferred to the personal computer by the USB cable. All the functions of the ICCD camera and the Acton spectrograph can be fully controlled by WinSpec/32 software provided by the manufacturer. All the LIBS spectra were taken in air (Haider et al., 2012).
Sample
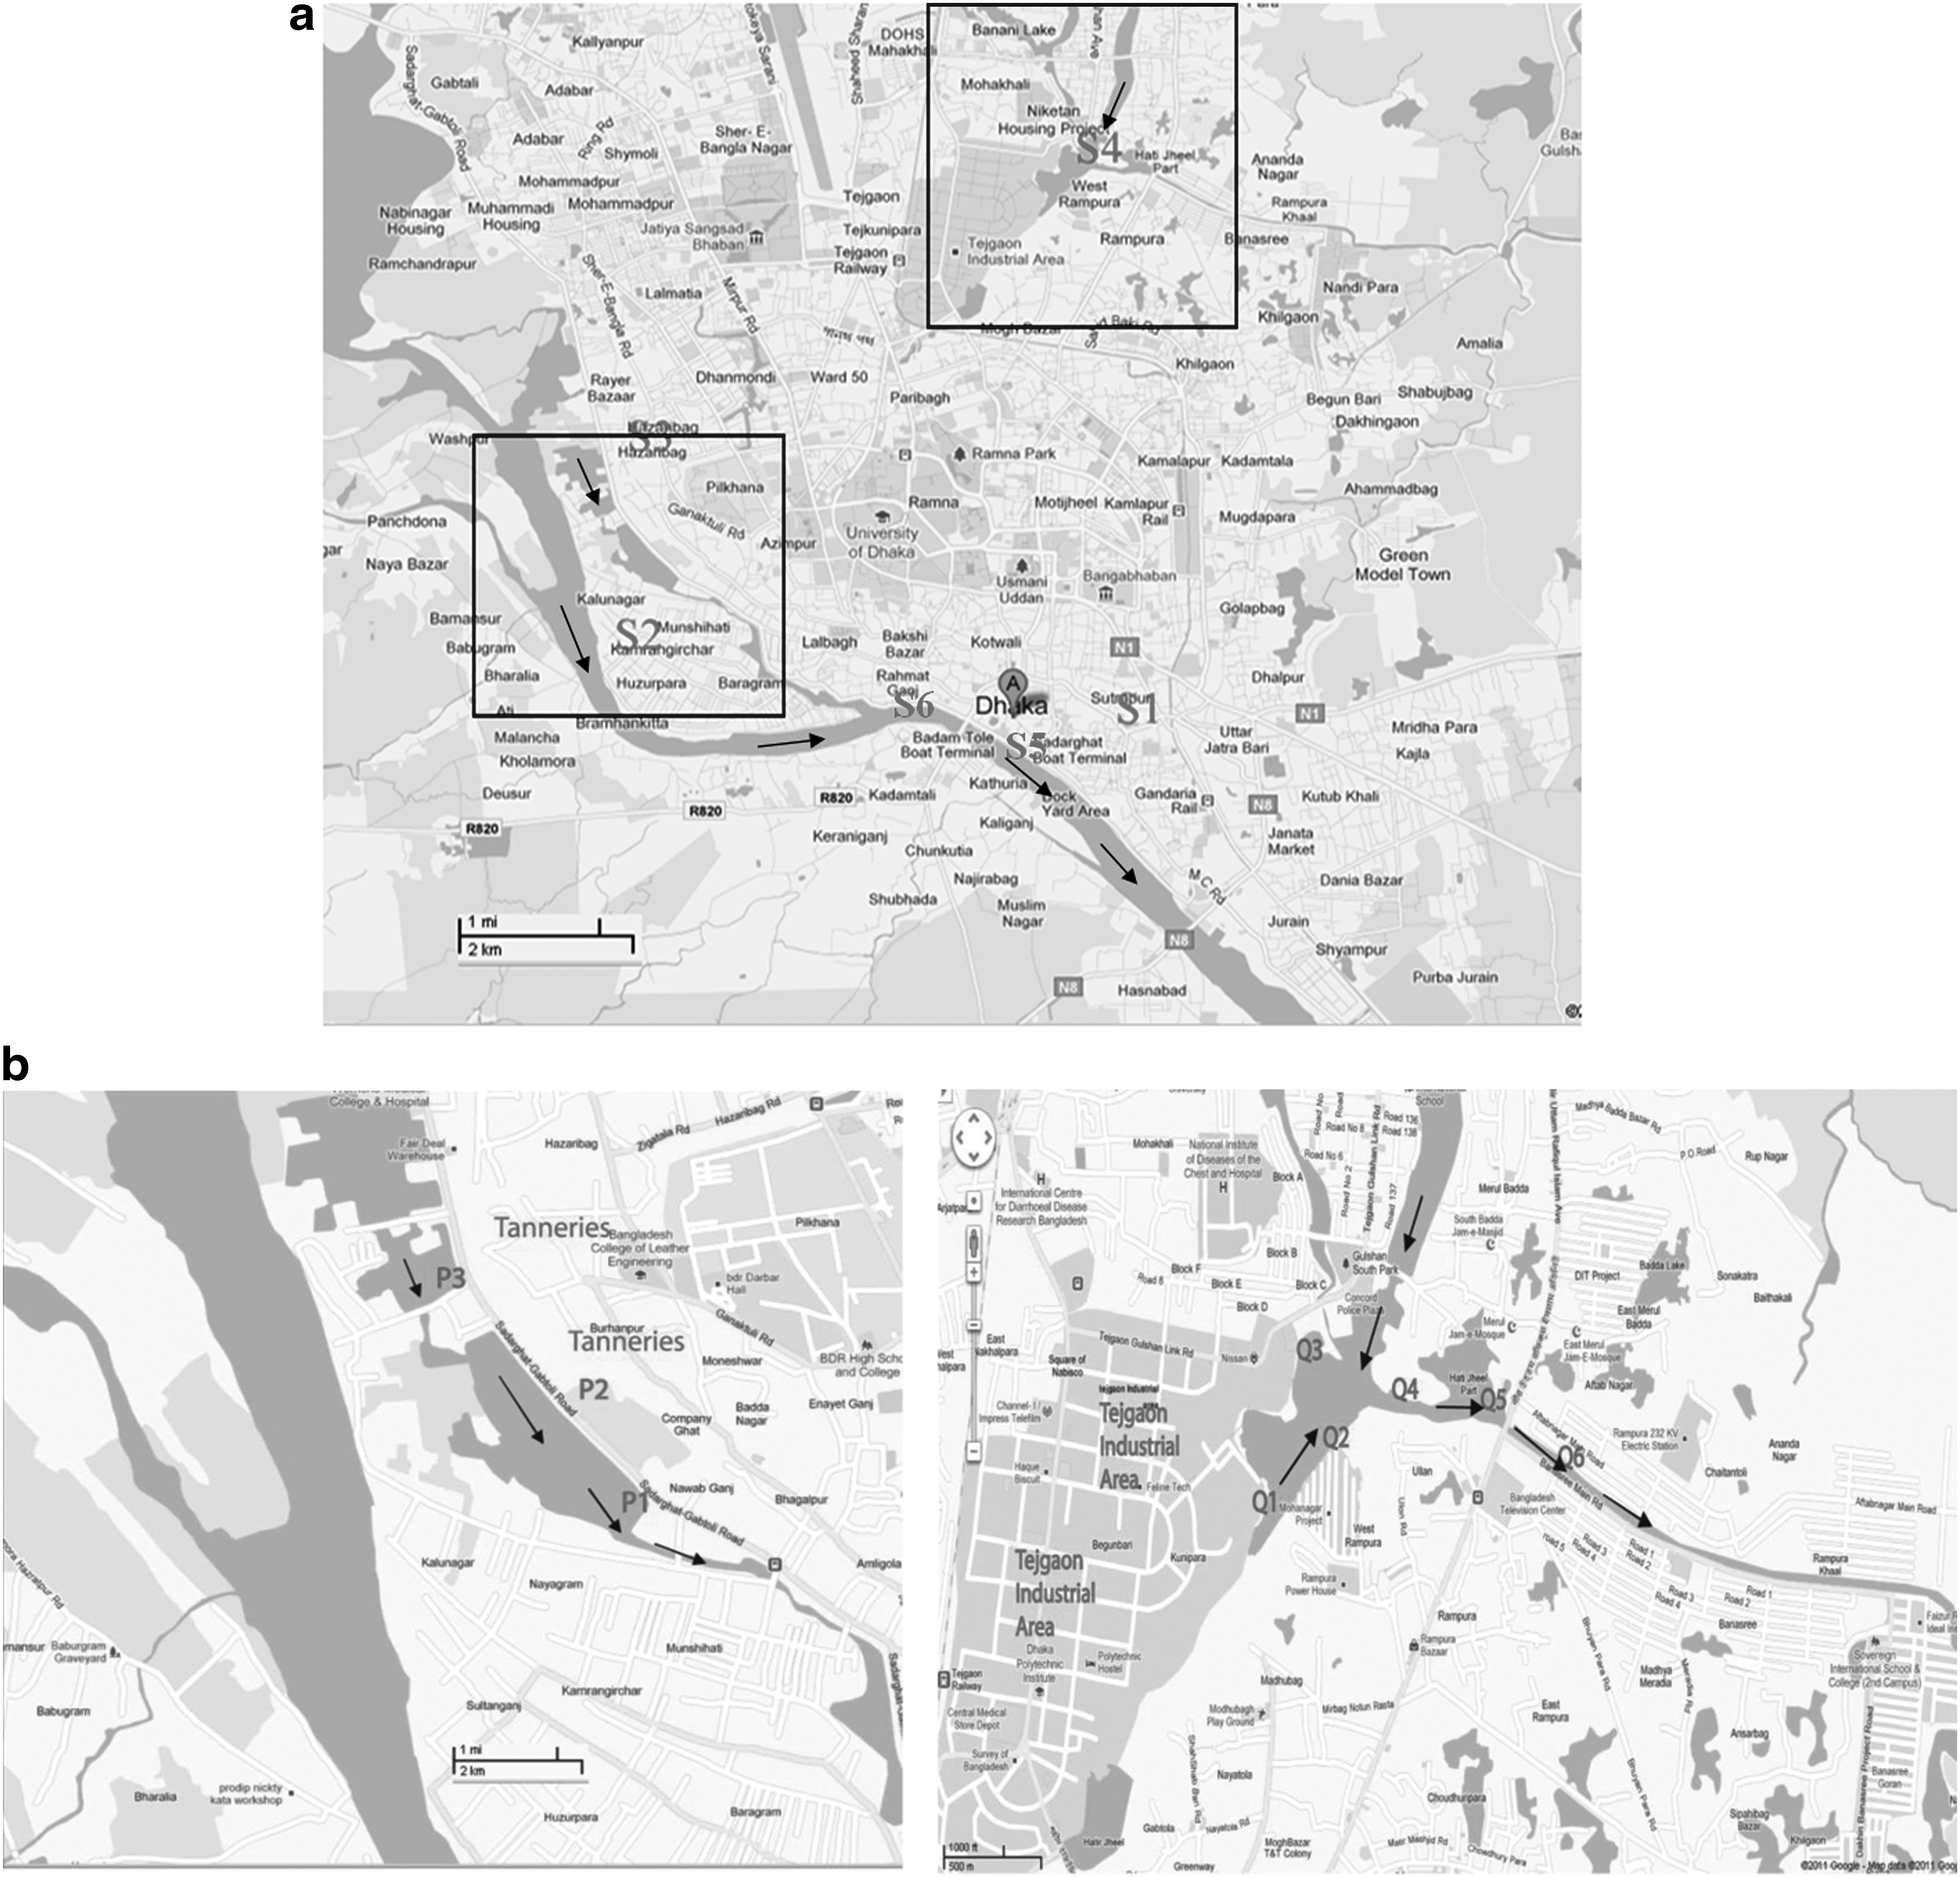
In the present study, the water samples were collected from the following areas of Dhaka City: Kamrangirchar, Sadar Ghat area, Buriganga second bridge, Hazaribagh tannery area, Hatirjheel (Begunbari), Dholaikhal, and Showari Ghat. The sample collection was done in the rainy season (June–July, 2010). These areas were chosen because of heavy concentration of various industries such as tanneries, electroplating, metalworking, and chemical industries.
In the maps (Fig. 2a, b), the approximate locations of the surveyed regions (indicated by S's, P's, and Q's, respectively) are shown. The samples were collected at a distance of ∼1 m from the bank of the river. We used 1.5 L PET bottles (polyethylene terephthalate bottles used for soft drinks) for sample collection. Before collection, water was stirred thoroughly to make it uniform. We collected three samples from each of the geographical region. Since we are highly interested in purely suspended materials, for this reason, no pH control was performed on the samples.
Collected water samples were kept in the laboratory to allow precipitation. After 4 days of precipitation, the sample was filtered by using a large (20×20 cm) folded fine cloth instead of filter paper. The cloth was used due to ease of use owing to its large size. Then, the sediment and filtered water were kept aside for further study. We kept the sediment for 3 days for normal drying. From the dried sediment, we collected the residue by scraping. The residue was powdered with a hand mortar. Finally, pellets were prepared for LIBS analysis by using a hand press with a pressure of 80 bars. This is required to avoid the breaking of the samples due to shock wave generated by the laser pulses in the LIBS experiments. The pellets were further dried in a drier for 2 h at 120°C before taking the LIBS spectra. Several pellets were made and subjected to LIBS experiment as described above.
Results
All the peaks of spectral lines were identified and their wavelength was compared with the US National Bureau of Standards and Technology database (NIST Atomic Spectra Database, 2014). If there was a reasonable match between the measured and NIST value, then the lines were tentatively identified. In identifying elements from the spectra, we tried to identify all the possible or observable lines of a given element. In identifying these lines, we tried to identify interference-free, isolated, and well-resolved lines without any ambiguity. The relative intensity of the emission lines of the elements was also taken into consideration to confirm the identification of the element. In most cases, a number of lines in different ionic states were identified.
Representative LIBS spectra of the samples obtained from the Hazaribagh and Begunbari area are shown in Figures 3 and 4. Some of the major lines of the identified elements with charge states are given in Table 1 for the Hazaribagh, Begunbari, and Kamrangirchar areas only. We could not detect any environmentally significant toxic metals in the other three areas (Dholaikhal, Showari Ghat, and Buriganga second bridge), probably because their concentrations were below the detection limit of our LIBS system; therefore, these were omitted.
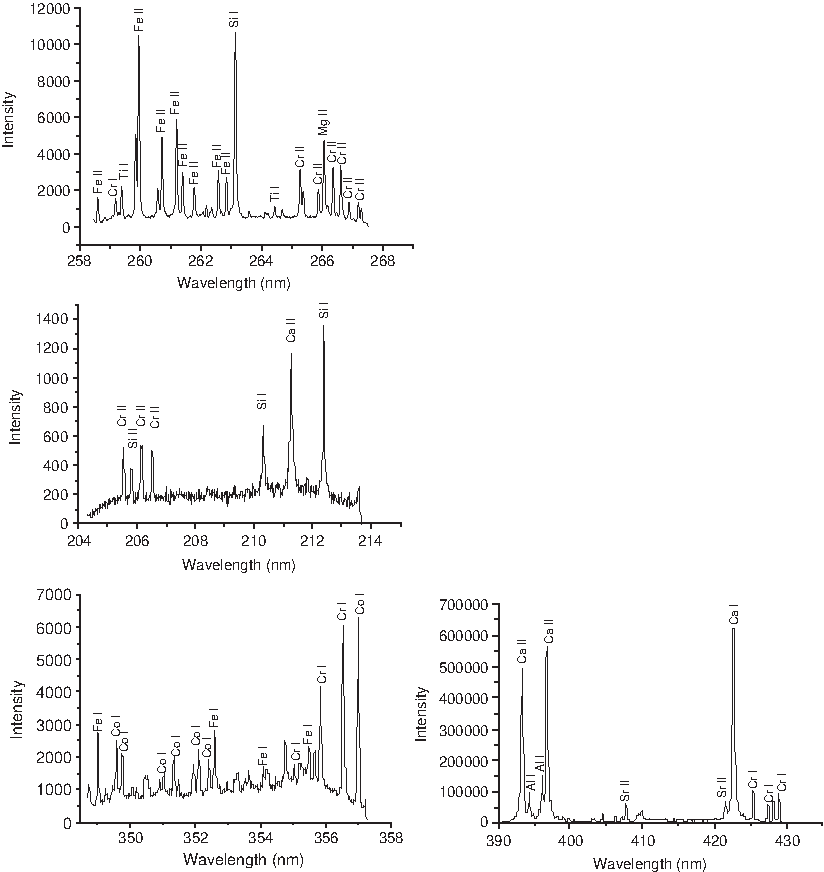
LIBS spectra of the pellet made from the Hazaribagh sample.
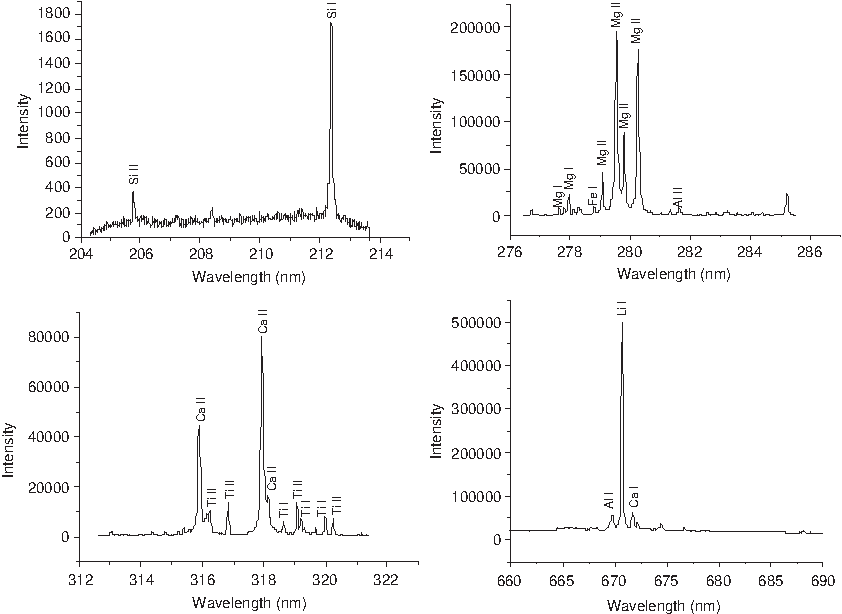
LIBS spectra of the pellet made from the Begunbari (Hatirjheel) sample.
As expected, the element chromium was positively identified in the samples from the Hazaribagh area. To determine the concentration of Cr in the Hazaribagh area, the pellet was analyzed by atomic absorption spectrophotometry (AAS). First, the pellet was digested by concentrated nitric acid and the resulting solution filtered. The solution was then analyzed in an AAS by using a Cr hollow-cathode lamp having a wavelength of 357.9 nm. Samples were aspirated through a nebulizer and the absorbance was measured.
Cr was measured at a concentration of 398 mg/L or equivalently 398 ppm by AAS. Since about 1.1 g of sediment was collected from 1.5 L of sampled water, this gives an overall concentration of chromium about 0.30 mg/L or more. Therefore, we conclude that a significant amount of chromium is present in the Hazaribagh area. In many cases, besides Cr, we were able to detect many elements such as Fe, Al, Ti, Sr, C, Li, K, Na, Ca, and Mg, including other semitoxic elements such as Ni, Zn, and Co (Table 1).
Discussion
We studied the environmental samples collected from different parts of the Dhaka city. The results of qualitative LIBS analyses showed that along with the common elements (Ca, Mg, Ti, Na, Al, Si, K, Li, Sr, C, and Fe) in all the environmental samples collected (from Hazaribagh, Kamrangirchar, and Begunbari areas), the heavy element Cr was detected in the sample of Hazaribagh. In addition, semitoxic elements Zn, Ni, and Co were present in Begunbari (Hatirjheel) samples.
Since chromium is not found naturally in this region, its origin must be the chromium-based tanning industries (anthropogenic chromium). It is obvious that tannery industries are not only responsible for the increase of chromium content but also for the increase in significant amounts of Fe, Al, Zn, Cu, etc. In the Hazaribagh area, chromium is found to be present in more hazardous amounts to human health compared to other areas.
Ecotoxic and physiological effects of chromium
Chromium is not classified as an essential for mammals (Di Bona et al., 2011). Chromium compounds can be divided into several oxidation states: Cr2+, Cr3+, Cr4+, and Cr6+. Chromium is generally present in the trivalent oxidation state (Cr3+) in sediments, but can also exist in hexavalent (Cr6+) as well as in tetravalent (Cr4+) states.
Most of the Cr3+ compounds are stable. For example, Cr2(SO4)3 is extensively used for tanning. In some cases, Cr3+ can be converted to Cr6+ (K2CrO4). Cr (III) compounds are generally insoluble in water and Cr as pure metal has no adverse effect; little toxic effect is attributed to the Cr (III) unless present in very large quantities. Because of the specific transport mechanisms, only limited amounts of Cr (III) enter into the cells. Several studies show that high concentrations of Cr (III) in the cell can lead to DNA damage (Eastmond et al., 2008). Acute oral toxicity for Cr (III) ranges between 1.5 and 3.3 mg/kg (Katz and Salem, 1993).
Cr (VI) is relatively soluble in water and can move more readily through soil to groundwater. The acute oral toxicity for Cr (VI) ranges between 50 and 150 μg/kg (Katz and Salem, 1993). According to the U.S. Environmental Protection Agency (EPA), the safe limit for total chromium in drinking water is 0.1 mg/L (U.S. Environmental Protection Agency, 2010), which includes Cr (VI). According to the WHO, the safe limit for total chromium is 0.05 mg/L.
Fortunately, most of the chromium discharged into the environment from tanneries is in the suspended state, forming colloids. The chromium detected in our experiments was of this origin. Therefore, it was found that Cr (III) was present in abundance, but probably it was relatively harmless. On the other hand, both acute and chronic toxicity is caused by Cr (VI) compounds (Baruthio, 1992). The hexavalent compounds are irritants, corrosive, and easily absorbed by the lungs, the digestive tract, and in certain circumstances by the skin. The most important health effects of chromium could be summarized as dermatological effects, lung cancers, pulmonary and upper respiratory tract noncancerous disorders, nephrotoxicity, digestive and teratogenic effects, etc. (Walsh and O'Halloran, 1996). If all the chromium detected were present in the Cr (VI) form, it would have a lethal effect on the population.
However, as LIBS cannot distinguish between Cr (III) and Cr (VI), we cannot say which chromium charge state is present. However, in any case, toxicity is present. It is safe to conclude that most of the chromium is in a stable and relatively harmless Cr (III) state (Walsh and O'Halloran, 1996). To perform a quantitative determination of chromium in the Hazaribagh area and to compare it with the toxic limits, we analyzed the Hazaribagh sample by AAS. The overall concentration of Cr in water is 0.30 mg/L, significantly higher than the maximum permissible safe limits of Cr (III) and Cr (VI).
Our present survey was conducted in the rainy season, when the concentration of toxic metals is expected to be lower. If the survey was conducted in winter, the detected concentration probably would have been higher. In contrast to Cr (III) and Cr (VI), there are few data available about the effects of Cr (II) and Cr (IV) compounds. Their toxicity is thought to be lower compared to that of Cr (VI) compounds such as chromates.
Elements other than chromium
Concentrations of the other detected elements, for example, Al, Fe, Co, Ni, Mg, and Cu might be higher than the average concentrations of the adjacent areas, which could be due to the influence of tannery activities (Zahid et al., 2006).
We also detected Zn, Cu, Co, and Ca in the Hazaribagh sample. However, we found less intense lines of Zn, Cu, Ni, and Ca in the Kamrangirchar sample. Therefore, we conclude that these elements are present at relatively lower concentrations in the Kamrangirchar area compared to the Hazaribagh area. We had to conclude that tannery industries are responsible for the increase in concentration of these elements, since the Kamrangirchar area is at a greater distance from the tanneries. We could not find any hazardous elements like Cr in this area in significant amounts.
In Begunbari (Hatirjheel) samples, we found many intense lines of Zn, Cu, Ni, and Fe and some lines of Co. We suspect that the concentration of these elements might be above the permissible limits, since many industries like battery, chemical manufacturing, electrical and electronic industries, metal finishing, paints, textiles, and pharmaceuticals are located in the adjacent Tejgaon industrial area.
In our research work, one of our objectives was to identify and determine the concentration of toxic heavy metals, especially lead, in the water using LIBS. We used the strong lead line (Pb I) having a wavelength of 405.8 nm and a relative intensity of 95,000 (NIST Atomic Spectra Database, 2014) as a reference line to detect the presence of lead. However, we could not detect the presence of this line, due to the limited detection sensitivity of our LIBS equipment.
Summaries
A survey of the polluted water collected from water bodies in Dhaka city was conducted using the LIBS technique. The presence of multiple numbers of pollutants, including chromium, cobalt, and nickel, was ascertained. To our knowledge, this is the first survey of water pollution performed using the LIBS technique. The survey convincingly demonstrates the multielement capability of the LIBS technique in environmental pollution studies. In the future, such surveys can be conducted in more detail over a wider geographical area, and in addition, the seasonal variations of pollutants (e.g., winter as compared to the rainy season) can also be studied using this technique.
In Bangladesh, finished leather is one of the most profitable and significant export items. While the economic benefit provided by the tannery industry to the country as well as to the society can be measured, the damage done by this industry to the environment as well as to the human health cannot be measured by any scale.
Footnotes
Acknowledgments
This research work was partially funded by the HEQEP/AIF/UGC/WB subproject titled “Monitoring of Surface Pollution and Atmospheric Condition in Bangladesh By Laser-based techniques.” The authors gratefully acknowledge the support provided by the HEQEP/AIF/UGC/WB.
Author Disclosure Statement
No competing financial interests exist.