
Abstract
Abstract
Heavy metals emitted by flue gas during co-processing hazardous waste (HW) in cement kilns presents a serious threat to the environment. Volatilization characteristics of three semivolatile metals (As, Pb, and Cd) in different chemical forms (As2S3, NaAsO2, Na2HAsO4, PbS, PbO, PbCl2, CdO, CdS, CdCl2) during co-processing with cement raw materials were studied. Thermogravimetric experiments were performed to tentatively predict the lower limits of volatilization temperatures. Experiments involving co-processing of these compounds with cement raw meals was carried out at different temperatures over different time periods in an electric heated tube furnace to gain more insight into the macroscopic kinetic characteristics of volatilization. Volatilization of As, Pb, and Cd during co-processing with cement raw materials increases with time initially, and after 25 min, they do not volatilize. Temperature and compound speciation significantly affect metal volatilization. For Pb and Cd, volatilization was higher at higher temperatures. Volatilization of As, however, decreased as temperature increased at temperatures above 1,000°C, which can be explained by three parallel reactions. Kinetic models on the volatilization of these compounds during co-processing with cement raw materials were obtained. These models can provide a preliminary theory basis for predicting the release of heavy metals (Pb, Cd, As) and be used to control the environmental risk posed by heavy metals through restricting their feeding rate during co-processing HW in cement kilns.
Introduction
W
Currently, domestic and international researchers have predominantly focused on the solidification properties of heavy metals, and particularly on leaching behavior (Eckert and Guo, 1998; Zhang, 2009; Siddique and Rajor, 2012; Van der Sloot and Kosson, 2012). Unfortunately, there have been few investigations of detailed processes of heavy metals being vented into flue gas at different temperatures over different time periods during co-processing of HW in cement kilns, although significant environmental concerns have been raised regarding metal emissions through cement kiln stacks. Hence, it is essential to understand the volatilization behavior of harmful metals during the various processes involved in co-processing to better understand their fate in cement kilns. Heavy metal volatilization has been studied mainly by the direct analysis of cement raw materials and clinker produced by calcining at 1,450°C; the volatilization is calculated based on the proportion of heavy metals fixed in clinker (Murat and Sorrentino, 1996). These analyses are not completely satisfactory since they can only give a view of heavy metals volatilized over a relatively long time period at a constant temperature. For the past few years, extensive studies have been developed with respect to the distribution characteristics of heavy metals under equilibrium conditions. However, it is nonequilibrium reactions that occur in the first stage and equilibrium status may not be reached at all during co-processing of heavy metal wastes in cement kilns. Kinetic analyses can show how metal volatilizations vary with time and temperature of co-processing in cement kilns. This information is very important in developing strategies to optimize flue gas treatment and to minimize the impact of metal pollutants. However, few kinetic analyses of metal emissions in flue gas at different temperatures over different time periods exist in available literature.
Lead (Pb), cadmium (Cd), and arsenic (As) are common heavy metal pollutants, and the impacts of these metals on human health and the environment have increasingly captured the attention of researchers in recent years (Linak and Wendt, 1993). Pb and Cd are typically semivolatile heavy metals and evaporate more easily during co-processing in cement kilns. As is considered to be nonvolatile matter, according to a reference document on best available techniques in the cement and lime manufacturing industries (EC, 2010). A recent study confirmed that As volatilizes easily and is released along with flue gas in cement kilns (Yan et al., 2009). Because of their hazardous effects and volatile characteristics, Pb, Cd, and As are strictly controlled in flue gas in accordance with the pollutant emission control standard of co-processing HW in cement kilns. Since the chemical forms of heavy metals directly affect their volatilization behavior during co-processing in cement kilns, As2S3, NaAsO2, NaAsO4, PbS, PbO, PbCl2, CdO, CdS, and CdCl2, which are the most common forms of As, Pb, and Cd in HW, were selected to conduct the laboratory experiments. Thermogravimetric experiments were performed to predict the lower limits of volatilization temperatures for heavy metal compounds. Since most of the heavy metal elements were incorporated in the clinker, their volatilization could be restrained in the sintered clinker phases (Barros et al., 2004). Then experiments involving co-processing of these compounds with cement raw meals were carried out to further study the characteristics of volatilization of these heavy metals. The behavior of these heavy metals during co-processing with cement raw meals was experimentally and theoretically studied in a laboratory scale tube furnace. A method was implemented to continuously monitor the concentrations of heavy metals in combustion flue gas to track the metal release process, based on successively collecting flue gas during co-processing. This is the first study to simulate the volatilization process of heavy metals through direct quantitative analysis of heavy metal concentrations in the flue gas at different temperatures and different times during co-processing in cement kilns. This article also found the abnormal volatilization behavior of As during co-processing with cement raw materials and reasonably explained it by three parallel reactions. This novel theory solved the contradiction from different literatures on the volatilization characteristics of As. In addition to experimental research, the kinetic models of heavy metal volatilization were established for the first time to simulate heavy metal volatilization tendencies under nonequilibrium conditions in the cement system during co-processing of heavy metal compounds with cement raw materials. These models can provide a preliminary theory basis for predicting the release of heavy metals (Pb, Cd, As) and be used to control the environmental risk posed by heavy metal release through restricting their feeding rate during co-processing of HW in cement kilns.
Experimental Materials and Methods
Experimental materials
For this study, analytical reagents of sodium arsenite, sodium arsenate, lead oxide, lead sulfide, lead chloride, cadmium oxide, cadmium sulfide, and cadmium chloride were chosen as heavy metal wastes because oxides, sulfides, and chlorides are the main existing forms of As, Pb, and Cd in HW. The cement raw meal used in the experiments was collected from a homogenizing and storage silo of a cement plant. Basic data of cement raw meal are shown in Tables 1 and 2.
IM, iron modulus; KH, lime saturation factor; SM, silica modulus.
Inductively coupled plasma mass spectrometry (ICP-MS; Agilent 7500a) was used to measure the heavy metal concentrations. Simultaneous differential technique (SDT Q600; TA Company) was used to obtain the thermal gravity (TG) curves, and an electric heated tube furnace was used for clinker calcining experiments.
Experimental methods
TG experiments
The pure reagents NaAsO2, Na2HAsO4, As2S3, PbO, PbS, PbCl2, CdO, CdS, and CdCl2 were analyzed with the TG method. The experiments were carried out in air atmosphere with a flow rate of 100 mL/min, and a heating rate of 20 K/min from room temperature to a final temperature of 1,400°C. The sample mass used was ∼10 mg in all cases.
Experiments of clinker calcining
The mixtures of reagents NaAsO2, Na2HAsO4, As2S3, PbO, PbS, PbCl2, CdO, CdS, or CdCl2 and cement raw meal were used in calcining experiments. The quantities of the heavy metal reagents required for co-processing with cement raw meal were chosen to be low enough to prevent the influence of heavy metals on the quality of clinker and to be high enough for the concentrations of heavy metals in flue gas to be above the detection limits of instrumentation. As a consequence, mass fractions of Pb and Cd in cement raw meal were 1%, and that of As was 0.5%. All of the above compounds and cement raw meal were kept uniformly mixed before the calcination experiments. Figure 1 shows the schematic of calcination experiment device. When the tube furnace reached the set temperature, the porcelain combustion boat with 30 g of the mixed sample was pushed into the middle of the tube furnace and the set temperature was kept constant throughout the calcination process for around 40 min in the air atmosphere. During the calcination process, the gaseous emissions were collected once every 3 min until this calcination process finished using the mixed aqueous acidic solution of 5% H2O2 and 10% HNO3, which is an adsorption solution according to United States Environmental Protection Agency Method 29 (US EPA, 1996). Finally, the combustion boat was removed from the tube furnace and cooled to room temperature.
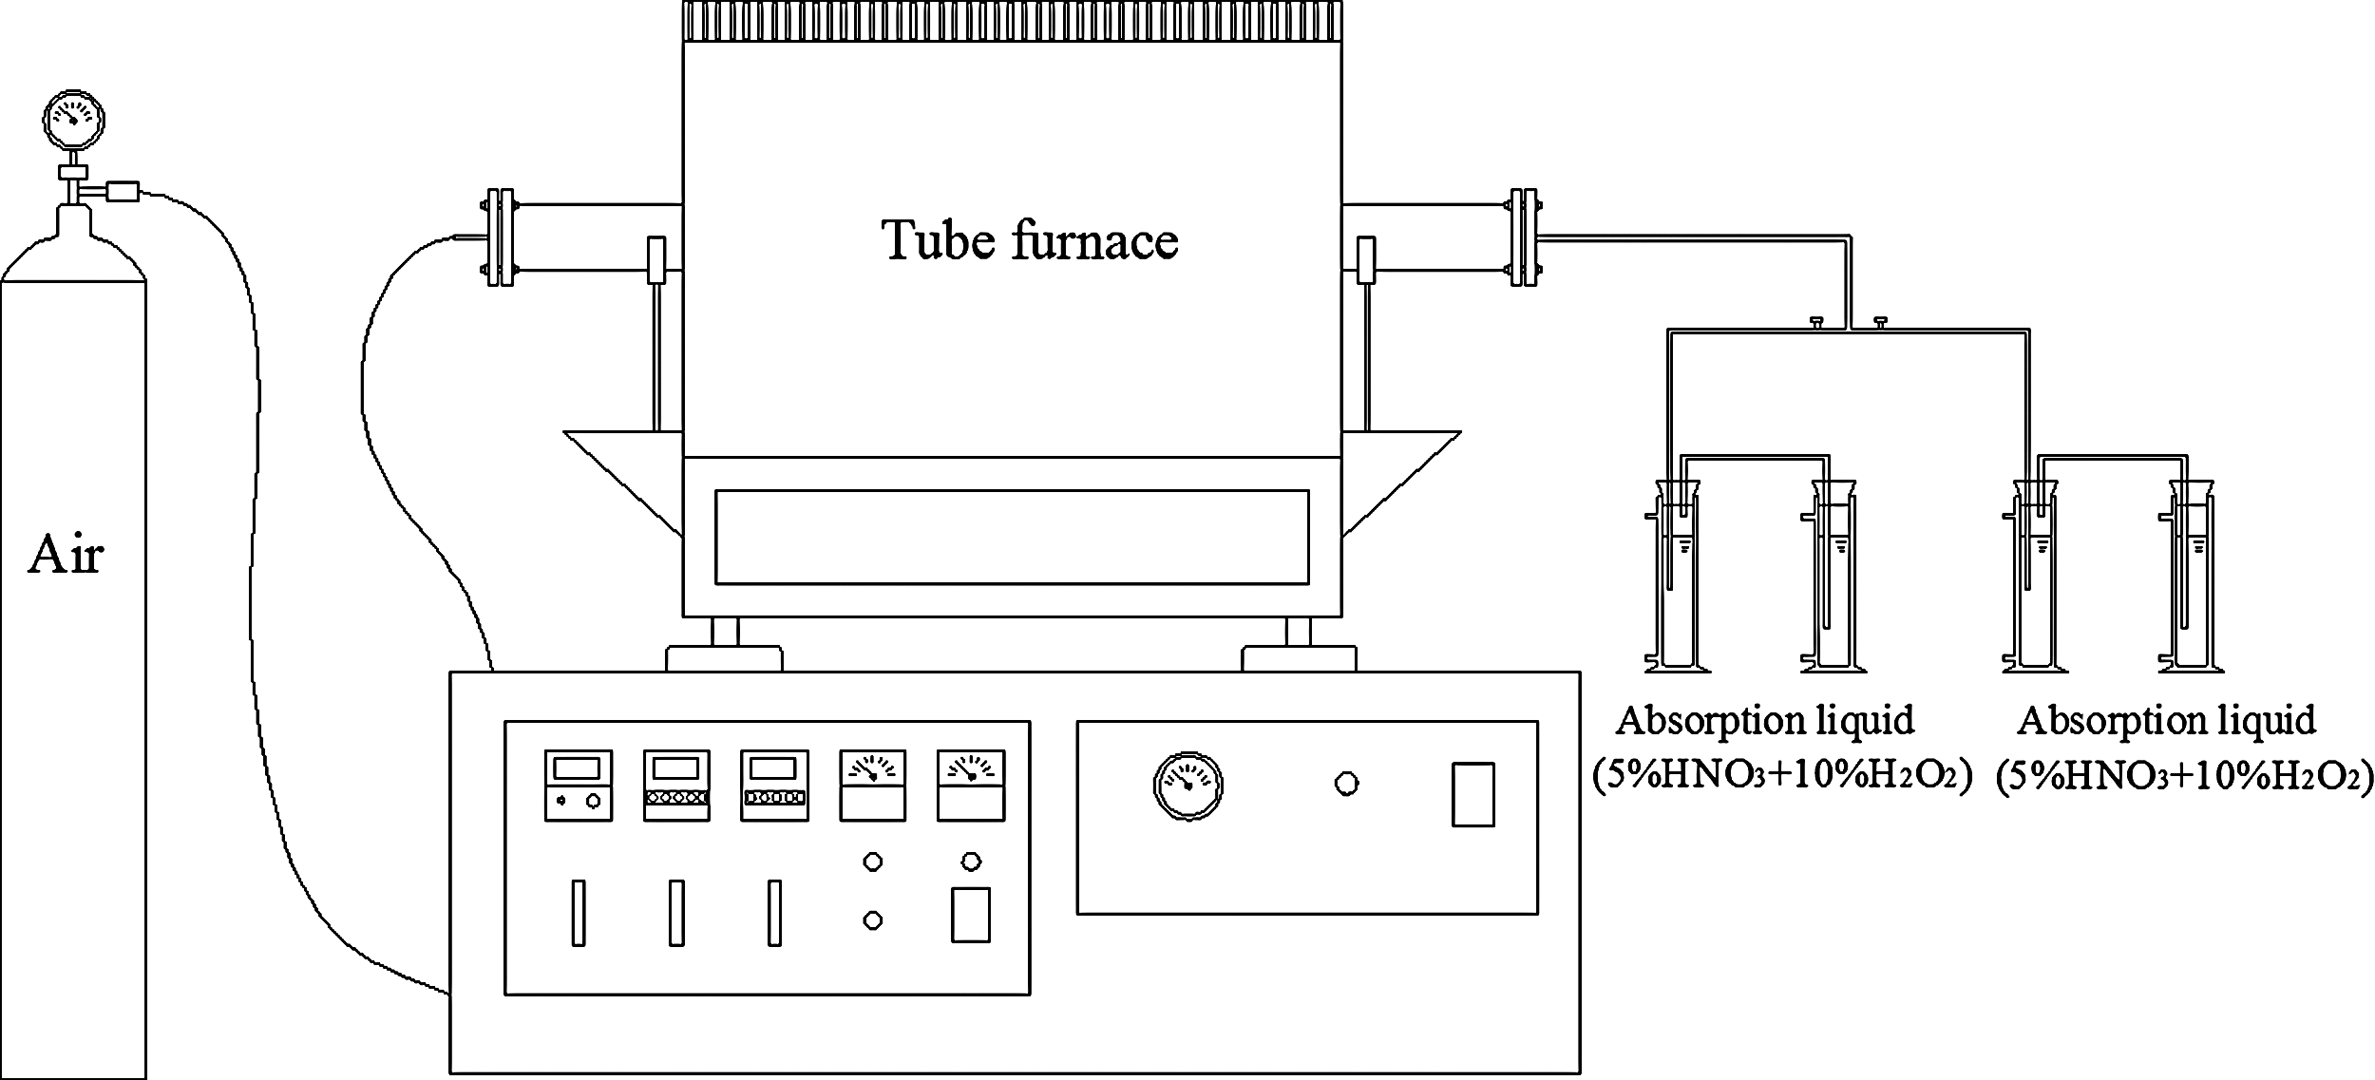
Schematic of clinker calcining experiment device.
In this study, the proportion of heavy metals volatilized is defined as α:
where V is the volume of adsorption solution (L), and C is the concentration of heavy metal in the adsorption solution (g/L). M is the mass of the heavy metal in the mixed sample (g).
Results and Discussion
Analysis of TG experiments
Figure 2 shows the TG curves and corresponding derivative thermal gravity (DTG) curves for As compounds. The DTG curve was gained by derivating the corresponding TG curve.

TG and DTG curves for As compounds (weight (%) represents the residual mass fraction of the sample). DTG, derivative thermal gravity; TG, thermal gravity.
Figure 2A shows the TG and DTG curves for As2S3. The initial weight loss temperature is ∼330°C and the final weight loss temperature is ∼600°C, with a sharp DTG peak at 419°C. As2S3 begins to melt at 300°C, and boil without decomposition when heated to 707°C (Dean et al., 1973). It can be deduced that volatility temperature of As2S3 is higher than its melting point, but lower than the boiling point. Figure 2B demonstrates the TG and DTG curves of NaAsO2. The initial reaction temperature is ∼800°C and the final reaction temperature is ∼1,150°C, with a sharp DTG peak at 1,030°C. Figure 2C shows the TG and DTG curves of Na2HAsO4. There is a distinct decline around 100°C in the TG curve owing to the vaporization of the moisture, which occupies 53.7% of the total mass. After that, with the increase in temperature, there is no remarkable weight loss. It can be concluded that As in Na2HAsO4 is not volatile during co-processing in cement kilns.
Figure 3A–C show the TG and DTG curves for PbO, PbS, and PbCl2, respectively. Figure 3A shows that the weight loss temperature range of PbO is 900–1,300°C, in which an obvious DTG peak is at 1,144°C. The volatilization temperature of PbO is lower than its boiling point of 1,516°C. Figure 3B demonstrates that the weight loss temperature of PbS ranges from 800°C to 1,300°C, and one DTG peak appears at 1,155°C. Figure 3C demonstrates that the weight loss temperature of PbCl2 ranges from 500°C to 700°C, and one DTG peak appears at 606°C. The volatilization temperature of PbCl2 is above its melting point of 501°C, but far below the boiling point of 953°C.
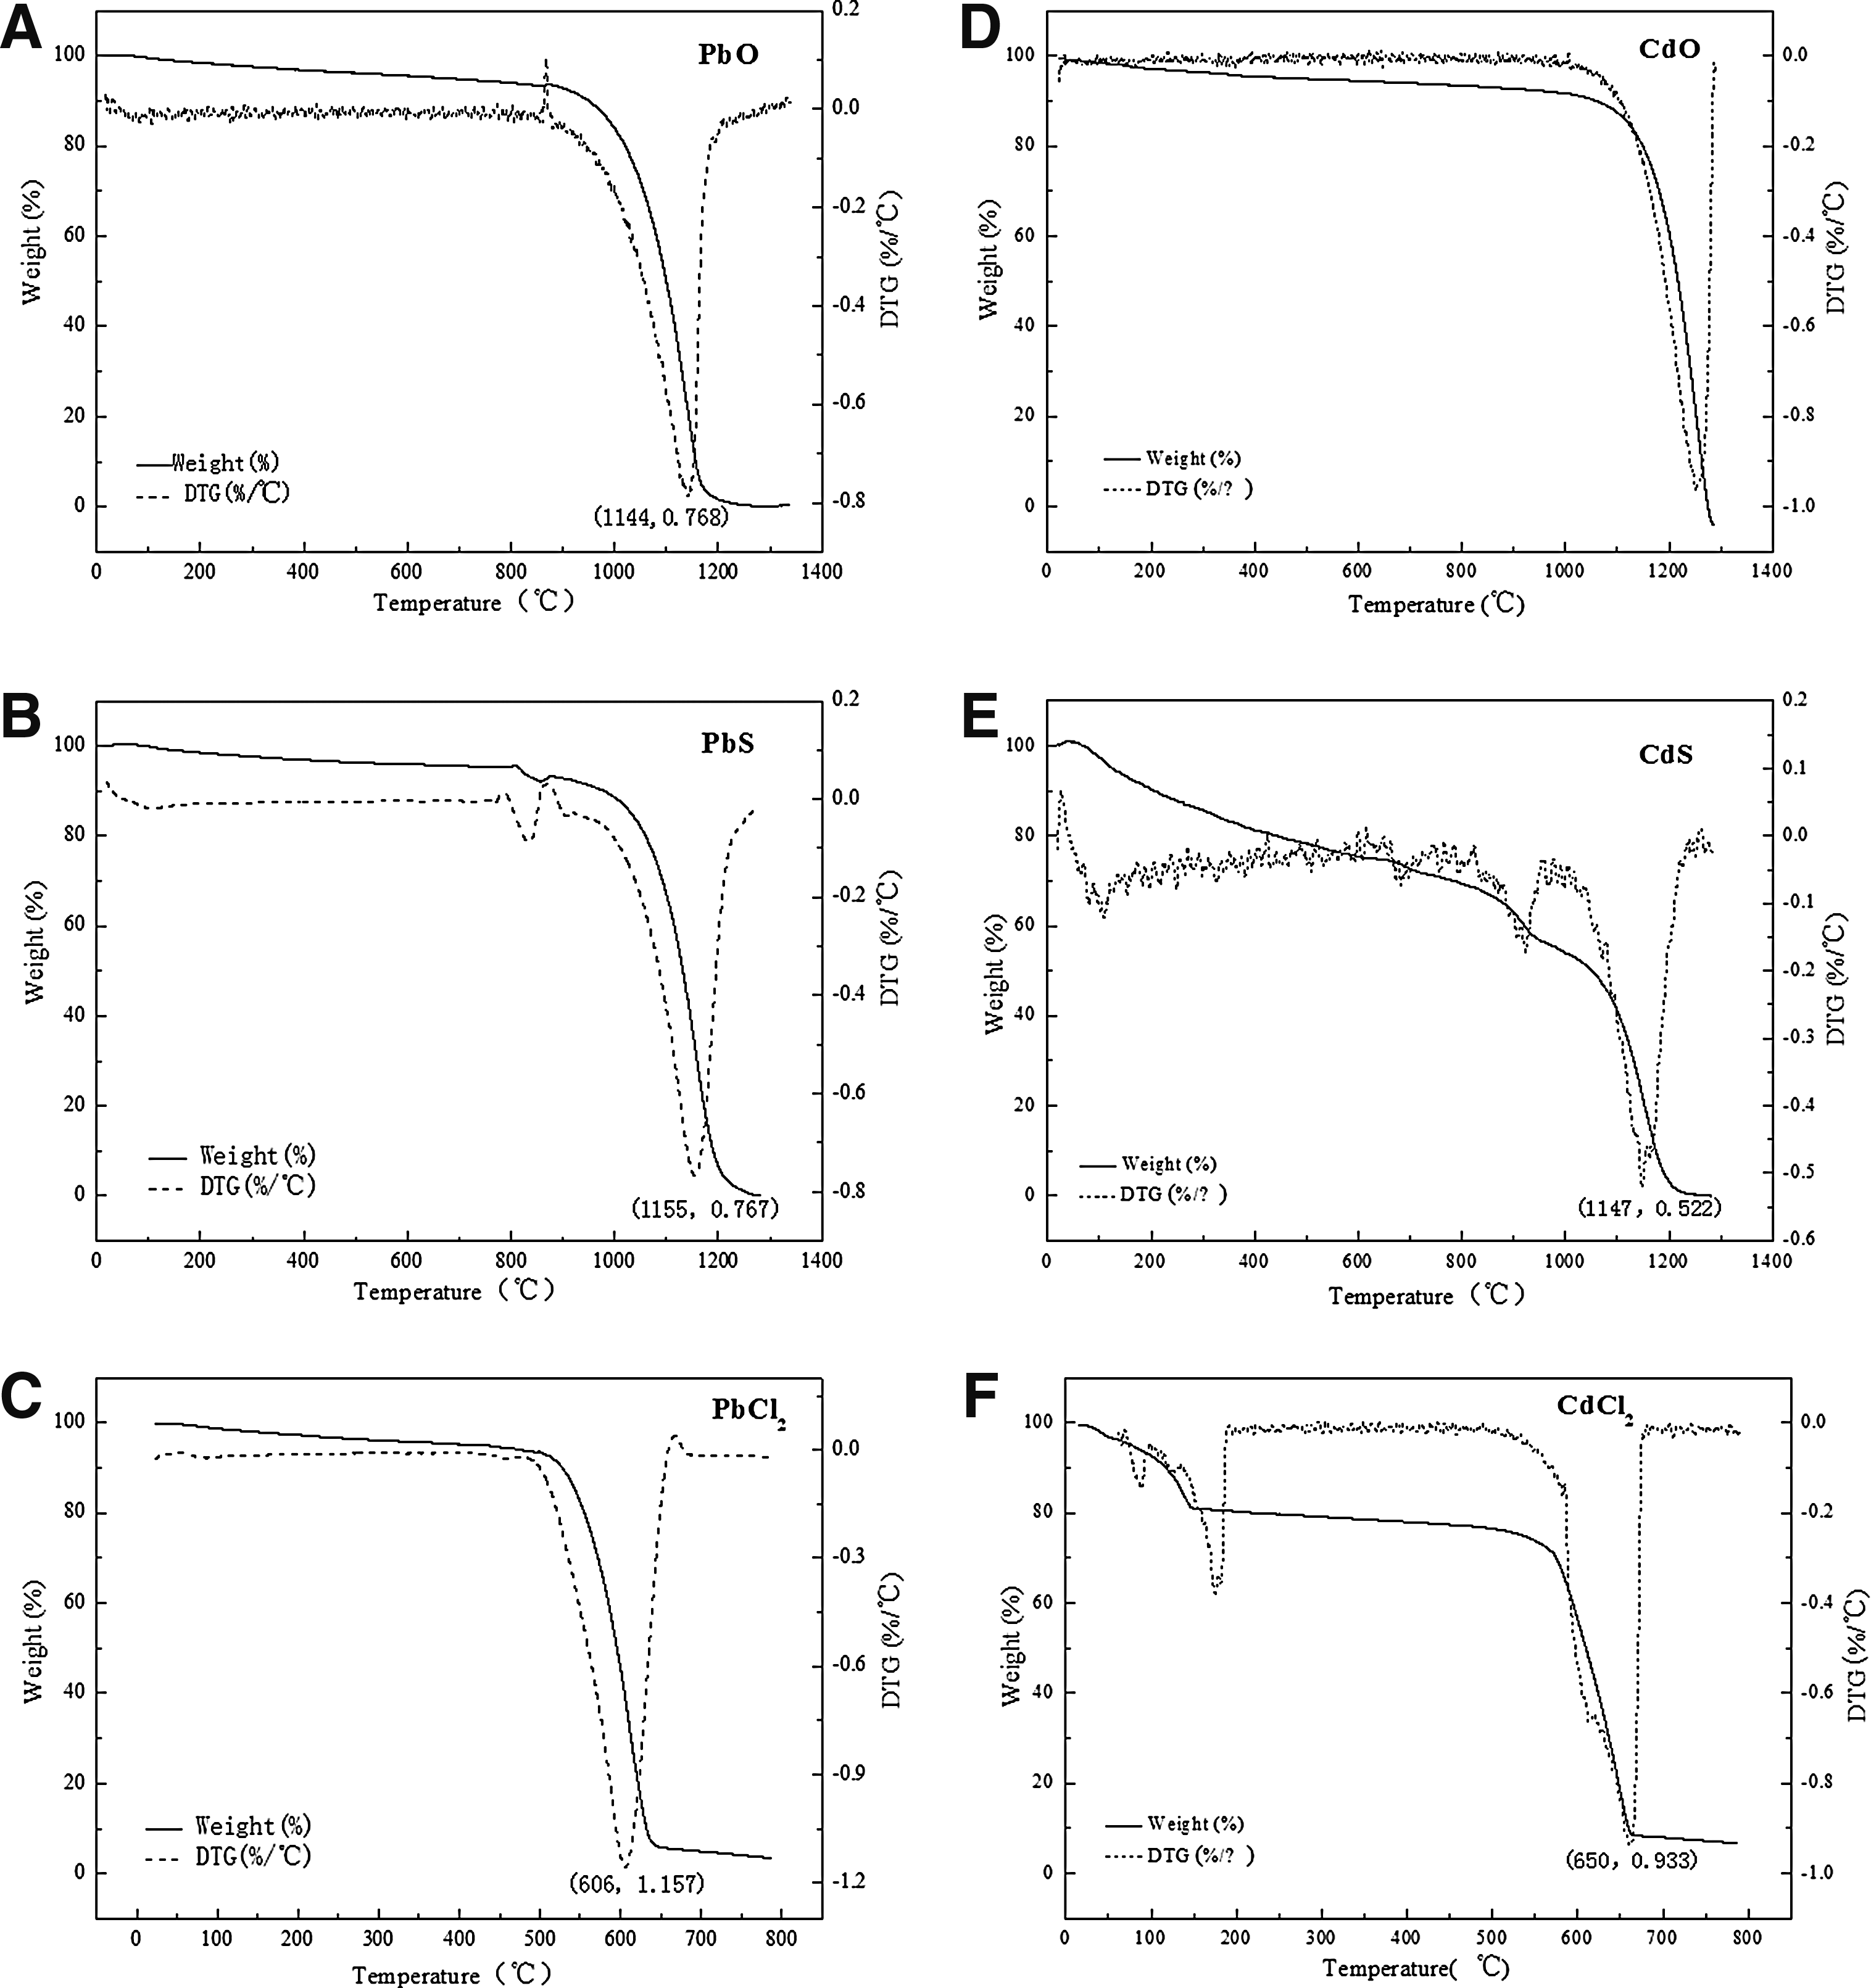
TG and DTG curves for Pb compounds and Cd compounds.
Figure 3D shows the TG and DTG curves of CdO. The initial weight loss temperature is ∼1,000°C and the final weight loss temperature is about 1,300°C, with a sharp DTG peak at 1,248°C. The TG and DTG curves of CdS are similar to those of CdO (Fig. 3E). Figure 3F shows the TG and DTG curves of CdCl2. Because CdCl2•2.5H2O was used in the experiment, the sample was completely dehydrated before reaching 200°C, which can be observed from the first peak of the DTG curve. The actual weightlessness temperature of CdCl2 ranges from 500°C to 700°C, and an obvious peak appears at 650°C. The volatilization temperature of CdCl2 is above its melting point of 568°C, but far below the boiling point of 961°C.
The TG experiments demonstrate that weightlessness temperatures vary between different chemical compounds of an element. The initial weight loss temperature is usually not the boiling point temperature, but is slightly higher than the melting point temperature. In this study, the initial weight loss temperature was used as the reference to determine the temperature range to be used in the following experiment of co-processing with cement raw materials. In addition, these results show that chlorides (PbCl2, CdCl2) are much easier to volatilize than the corresponding oxides (NaAsO2, Na2HAsO4, PbO, CdO) and sulfides (PbS, CdS), and the volatilization characteristics of oxides (PbO, CdO) are similar to those of the corresponding sulfides (PbS, CdS).
Analysis of heavy metal volatilization characteristics during co-processing with cement raw meals
Figure 4A shows the impact of time and temperature on the volatilization of As in As2S3. Volatilization increases with time over the first 25 min; after that, As does not volatilize. Volatilization increases as the temperature increases below 1,000°C, while beyond 1,000°C, volatilization decreases sharply as temperature increases. The maximum volatilization proportion below 1,000°C is 60%, and above 1,000°C is 18%. Because the TG experiment indicated that NaAsO2 is not volatile below 900°C, the calcination experiments were conducted starting at a temperature of 900°C. As shown in Fig. 4B the variation in volatilization of As in NaAsO2 with time is similar to that of As2S3, and volatilization always decreases as temperature increases.
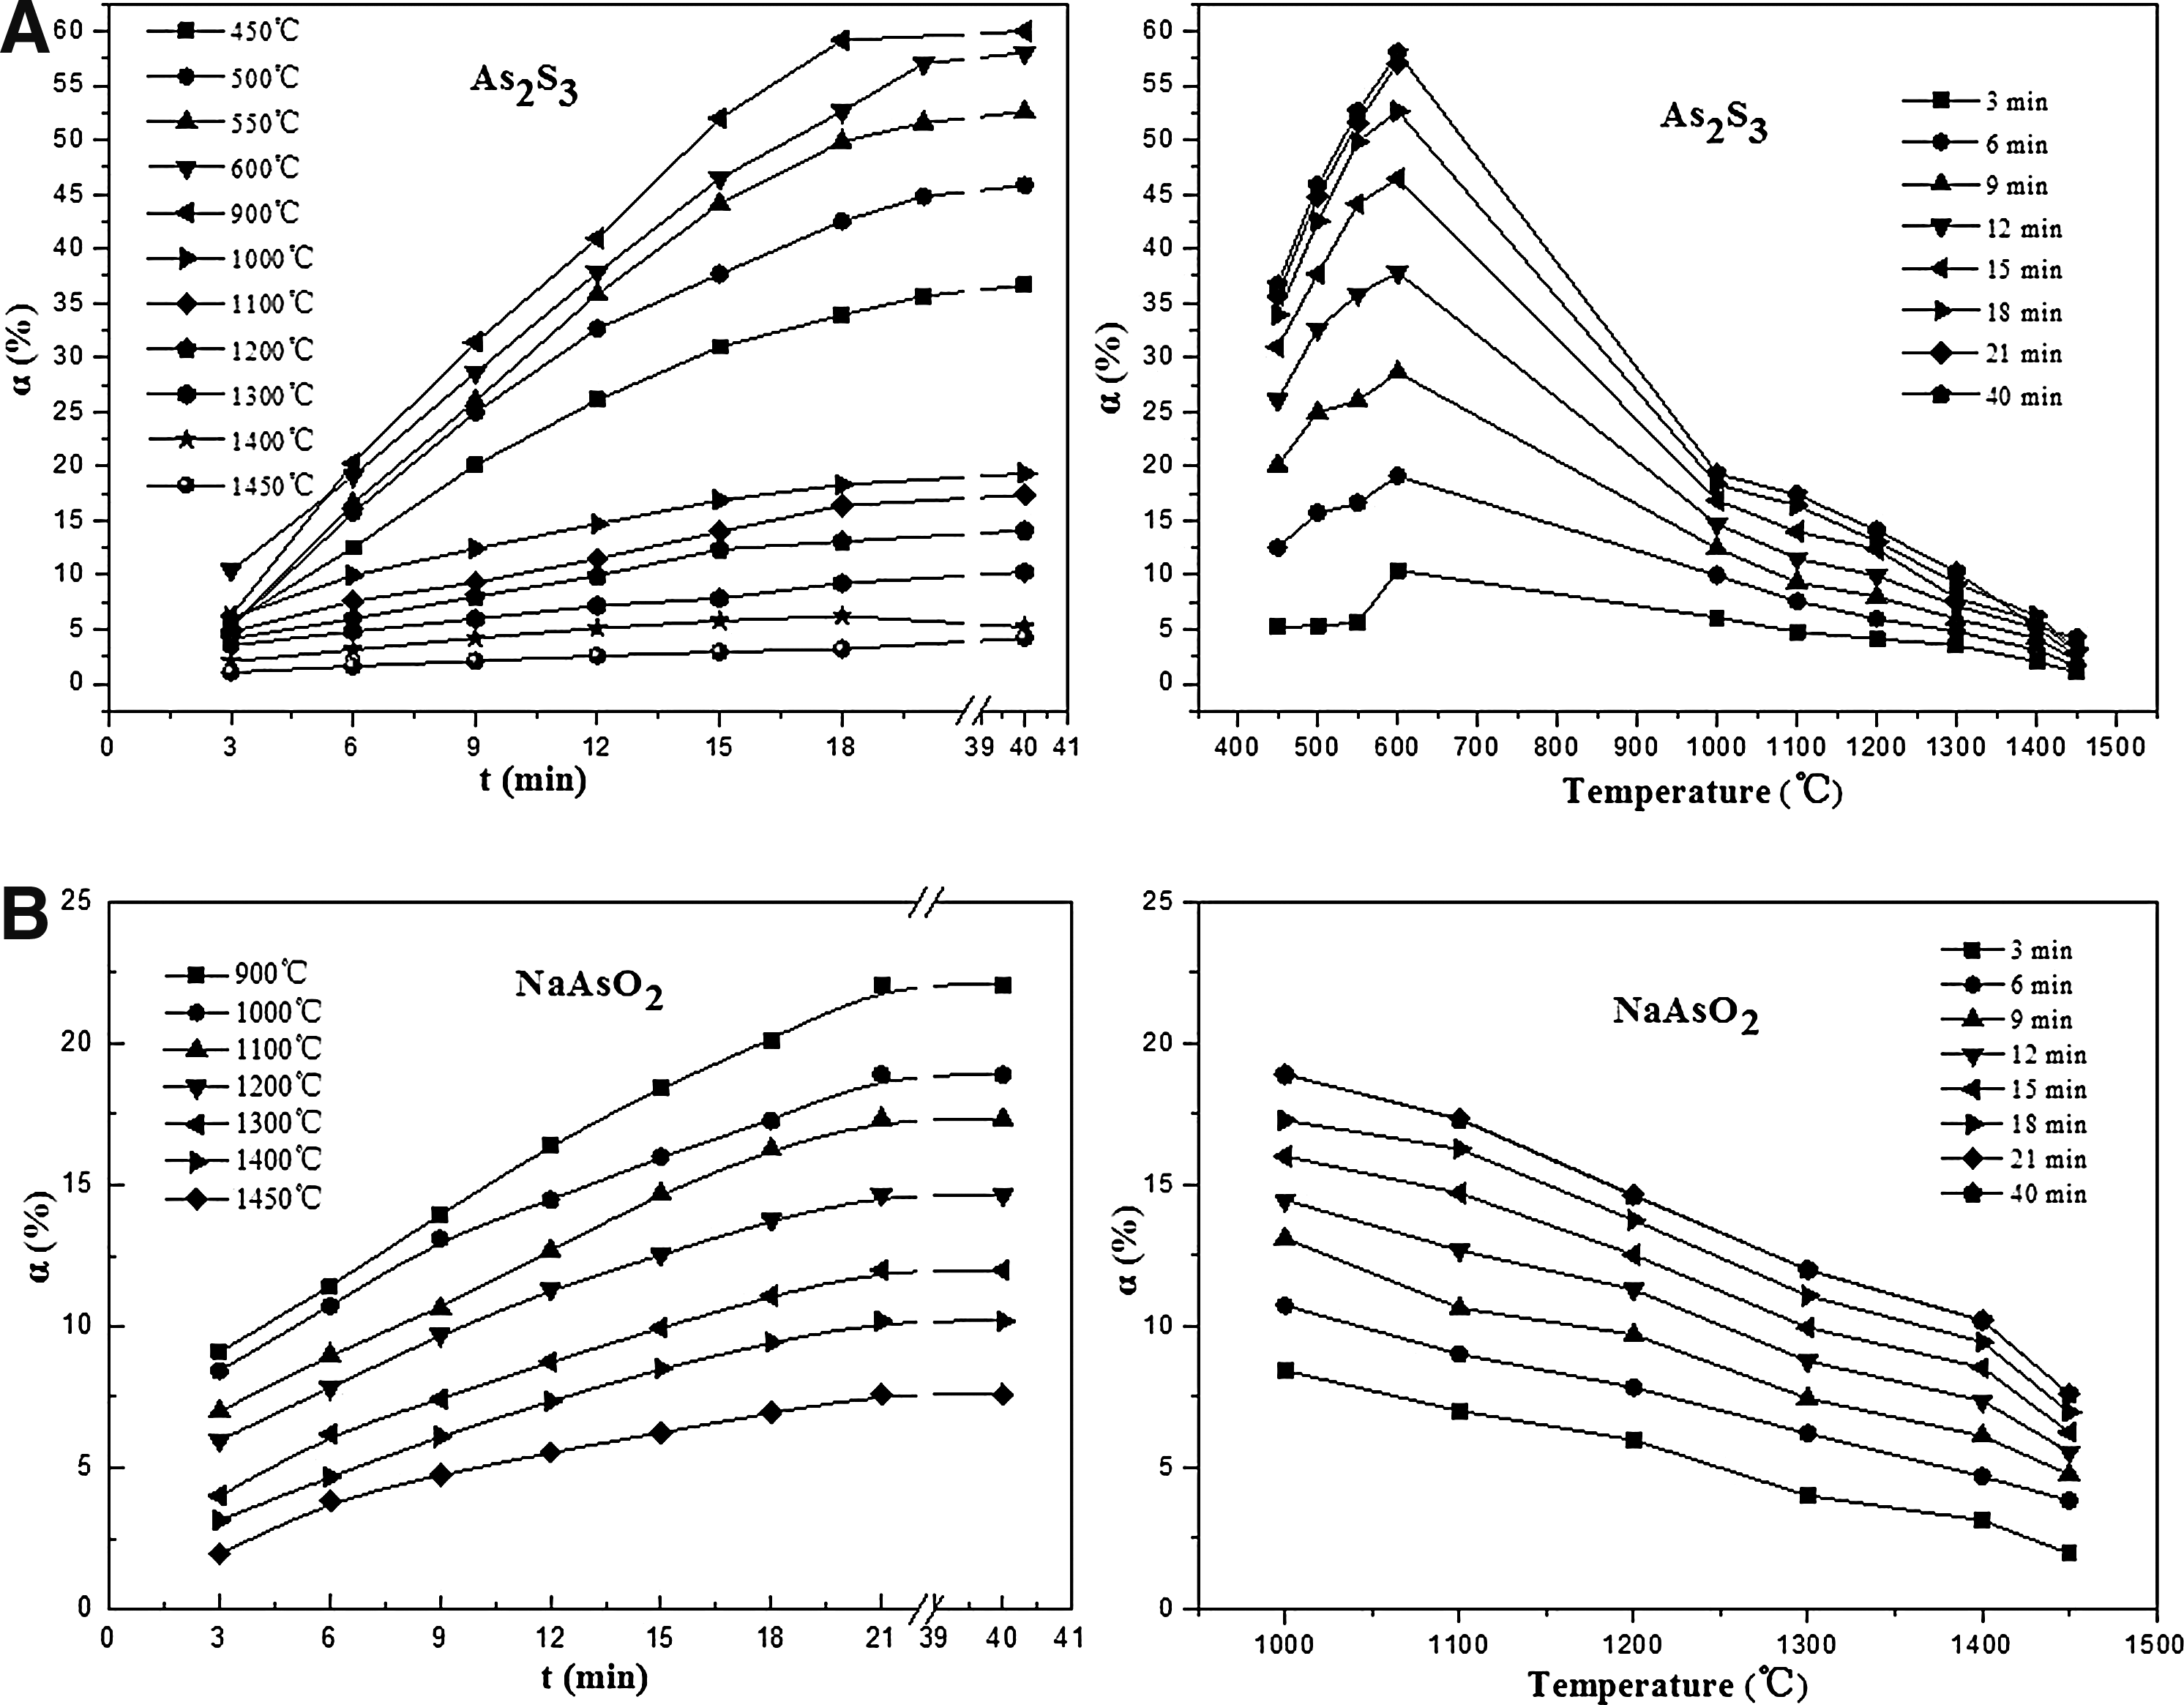
Effect of temperature and time on the volatilization of As.
In summary, the volatilization proportion of As in both As2S3 and NaAsO2 decreased as temperature increased in the high temperature zone. Volatilization proportion of As is below 20% when the temperature is higher than 1,000°C, which indicates that As is mainly solidified in the clinker. In fact, research has shown that CaO produced when the cement raw materials are calcinated could react with As to form stable solid Ca3(AsO4)2, restraining the volatilization of As (Wang et al., 2011). Volatilization of As in As2S3 increases until a threshold temperature is reached, then it decreases as temperature increases, which can be explained in more detail in Fig. 5.

Possible reactions of As during co-processing in cement kilns.
Possible reactions of As during co-processing in cement kilns include:
where AB represents the cement raw meals, AsX and AsY represent compounds of As added to the cement meals and a gaseous compound of As produced by reaction (2), respectively; AsZ represents a solid compound of As that is difficult to volatilize and is produced by reaction (3); and reaction (4) represents the slow volatilization process of compound AsZ.
As shown in Fig. 5A and B, the X-axis represents reaction time, and the Y-axis represents the proportion of As, and curves (2) and (3) represent reactions (2) and (3), respectively. Segments AB, BC, CD represent As that is volatile, unreacted, and solidified, respectively.
For As2S3, reaction (2) is the main reaction below 1,000°C, whereas reaction (3) is also occurring, but slowly, which can be seen in Fig. 5A. Therefore, the volatilization proportion of As in As2S3 increased as the temperature increased below 1,000°C.
However, when the temperature exceeds 1,000°C, the reaction rate of reaction (3) increases intensely, which is shown by curve (3) in Fig. 5B, at the same time, the reaction rate of reaction (2) also increases, which is shown by curve (2) in Fig. 5B. After a short period of time, which is indicated as intersection E of curve (2) and (3) in Fig. 5B, reactions (2) and (3) are completed, since there is no unreacted As left and all As left in the sample is in the form of AsZ, which is not easy to volatilize. After that, only reaction (4), which is shown by curve (4) in Fig. 5B occurs. When the temperature increases continually, the reaction rates of reactions (2) and (3) increase simultaneously, as indicated by curves (2)′ and (3)′ in Fig. 5B. Then intersection E of curves (2) and (3) transfers to the intersection E′ in the lower left corner compared with its original one, as shown in Fig. 5B. This causes curve (4) to decline, as indicated by curve (4)′, leading to a decrease in volatilization with an increase of temperature in the higher temperature zone.
Volatilization character of As in NaAsO2 can also be explained by the same theory. The only difference between As2S3 and NaAsO2 is that both reactions (2) and (3) are very slow in the lower temperature zone for NaAsO2.
Figure 6 A, B, C show the impact of time and temperature on the volatilization of Pb in PbO, PbS, and PbCl2. Volatilization increases with time in the first 25 min; after that, Pb does not volatilize. The maximum proportions of Pb volatilized in PbO, PbS, and PbCl2 are 96%, 93%, and 97%, respectively. Pai-Haung Shih (Shih et al., 2005) pointed out that Pb is a light volatile metal and the volatilization rate surpassed 90% in the clinker sintering process, which is in agreement with this study. Figure 6A shows that the volatilization of Pb in PbO increases with the temperature consistently throughout the entire process and increases sharply when the temperature reaches 1,200°C. Figure 6B and C also indicates that the volatilization of Pb in PbS and PbCl2 increases with temperature. However, PbCl2 appears to be more volatile than PbS. Related research has indicated that Pb is substantially lost by volatilization at high temperatures, particularly in the presence of chlorine; chlorine possibly promotes Pb volatilization (Chiang et al., 1997; Rio et al., 2007).
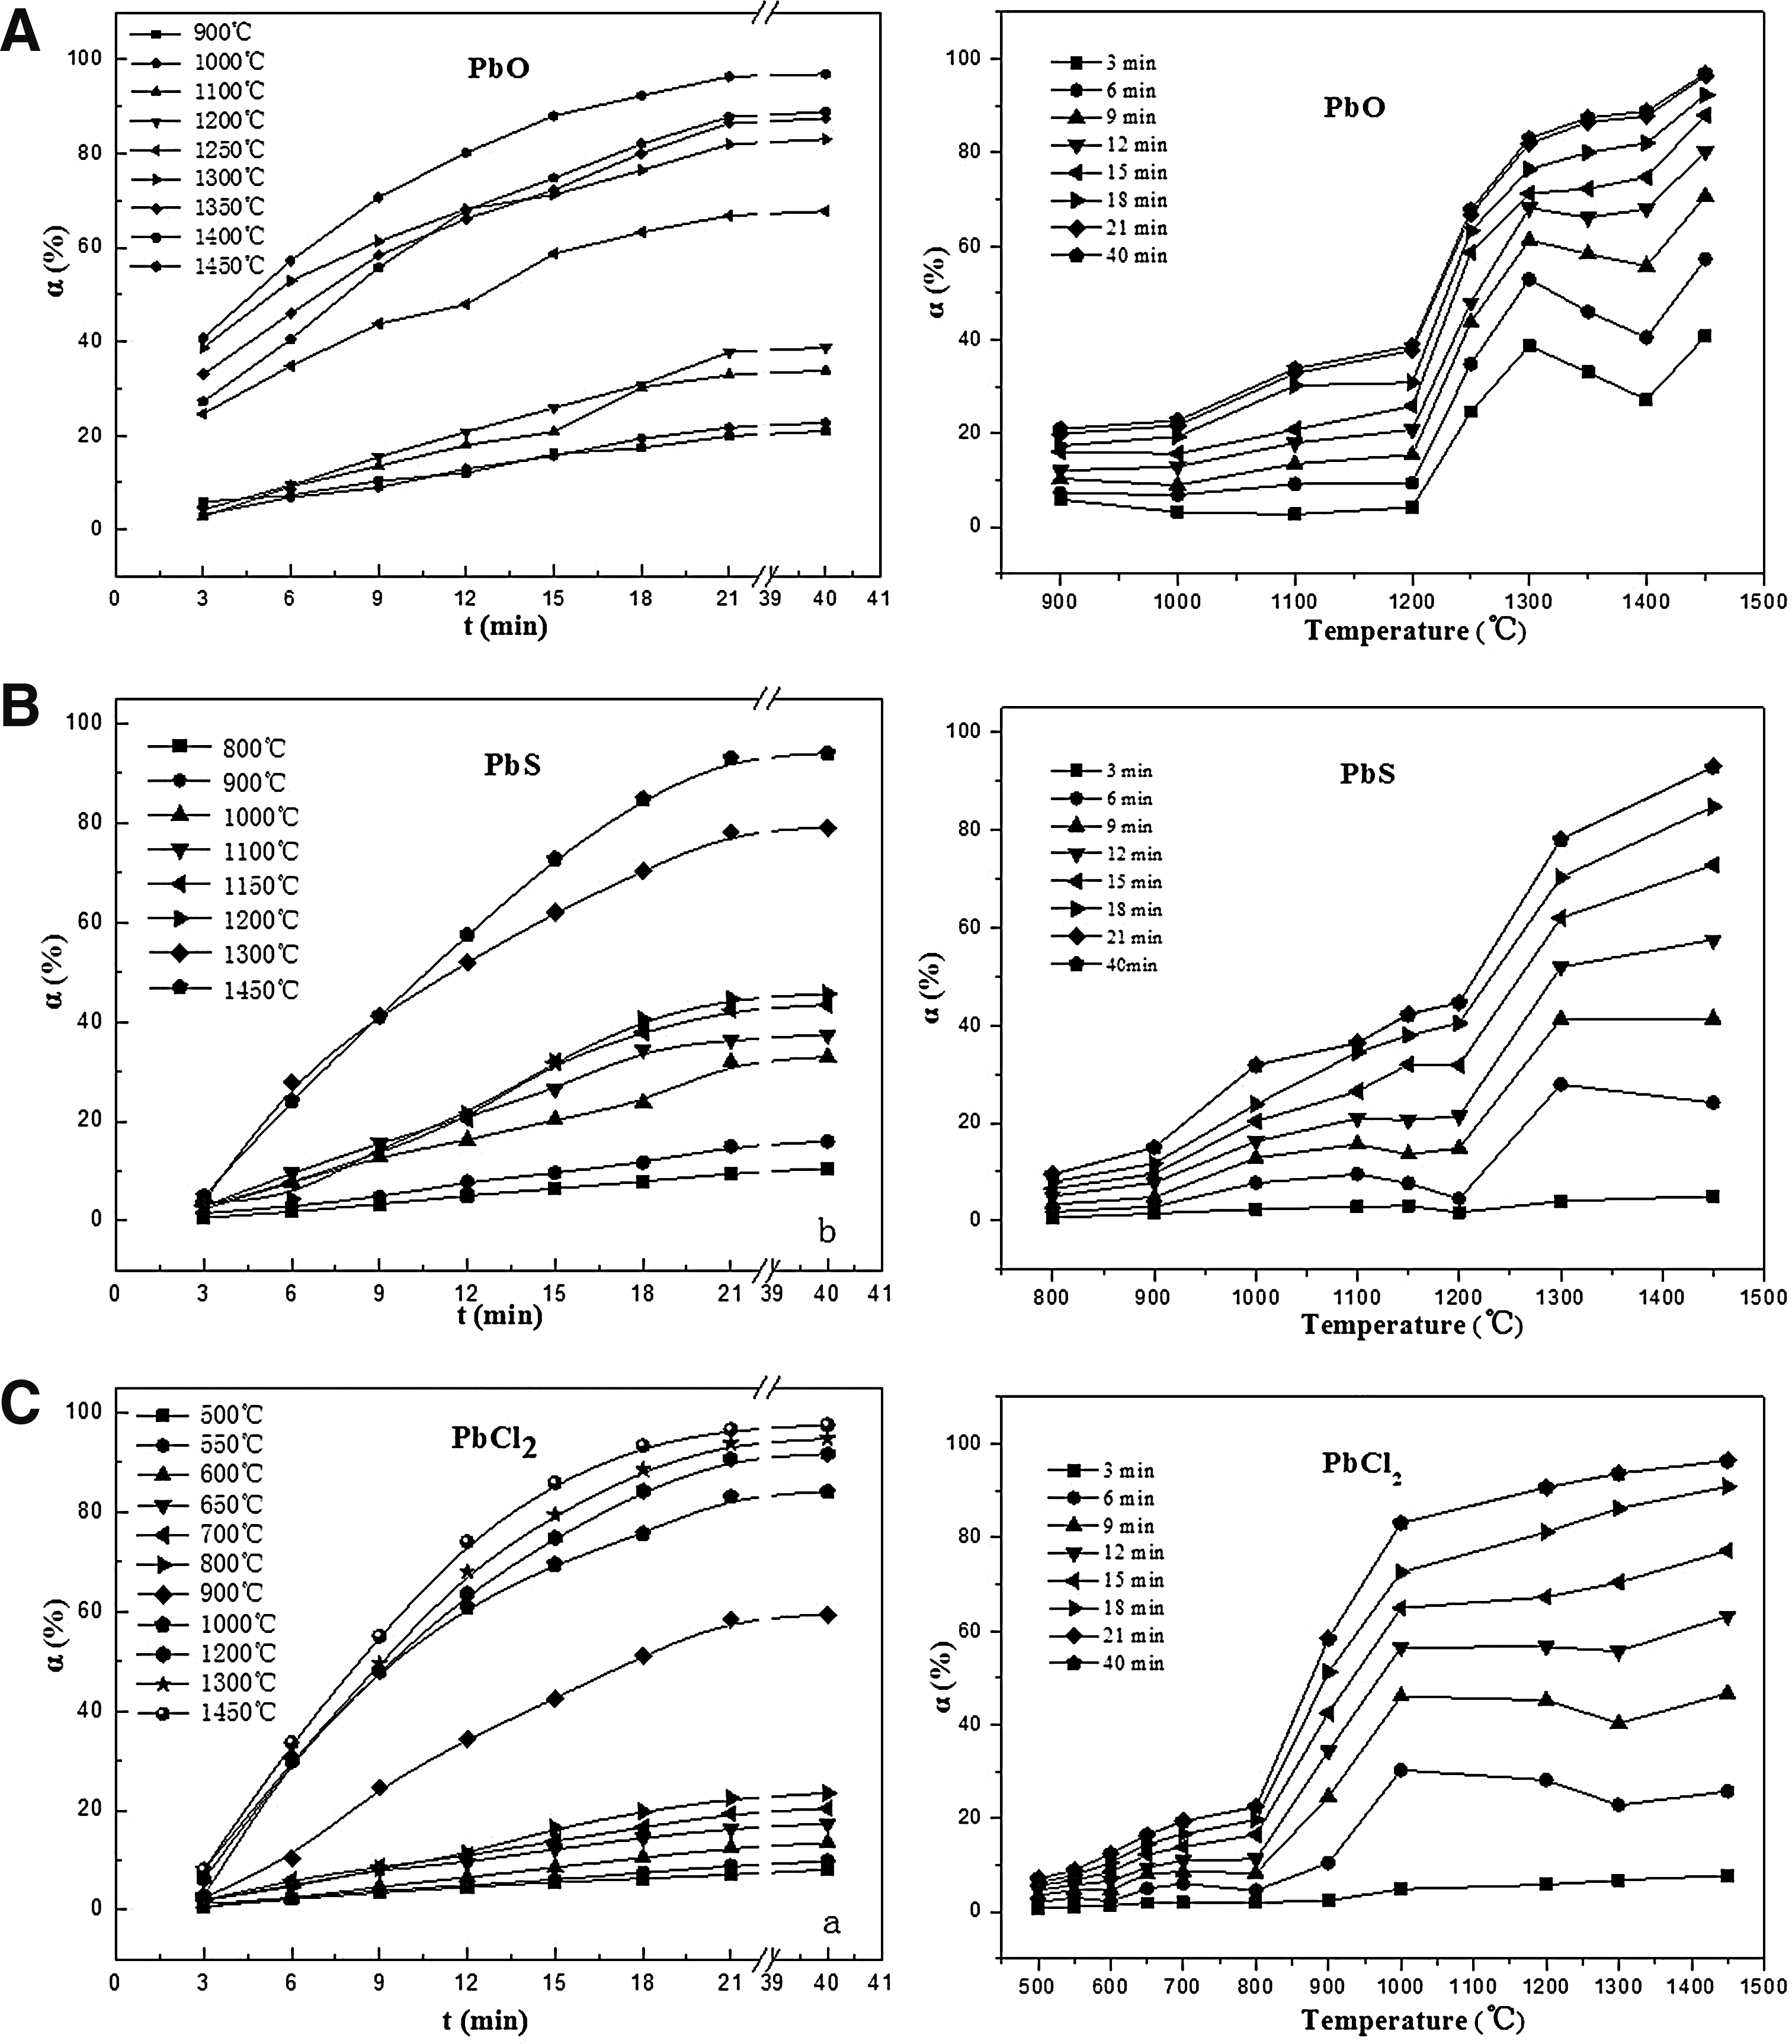
Effect of temperature and time on the volatilization of Pb.
Figure 7A–C shows the impact of time and temperature on the volatilization of Cd in CdO, CdS, and CdCl2. Volatilization increases with time for the first 25 min; after that, Cd does not volatilize. The maximum proportions of Cd volatilized in CdO, CdS, and CdCl2 are 98%, 94%, and 97%, respectively. Figure 7A indicates that volatilization of Cd in CdO increases with temperature consistently throughout the process. Figure 7B and C also indicates that the volatilization of Cd in CdS and CdCl2 increases with temperature. However, CdCl2 appears to be more volatile than CdS, which is the same as Pb.
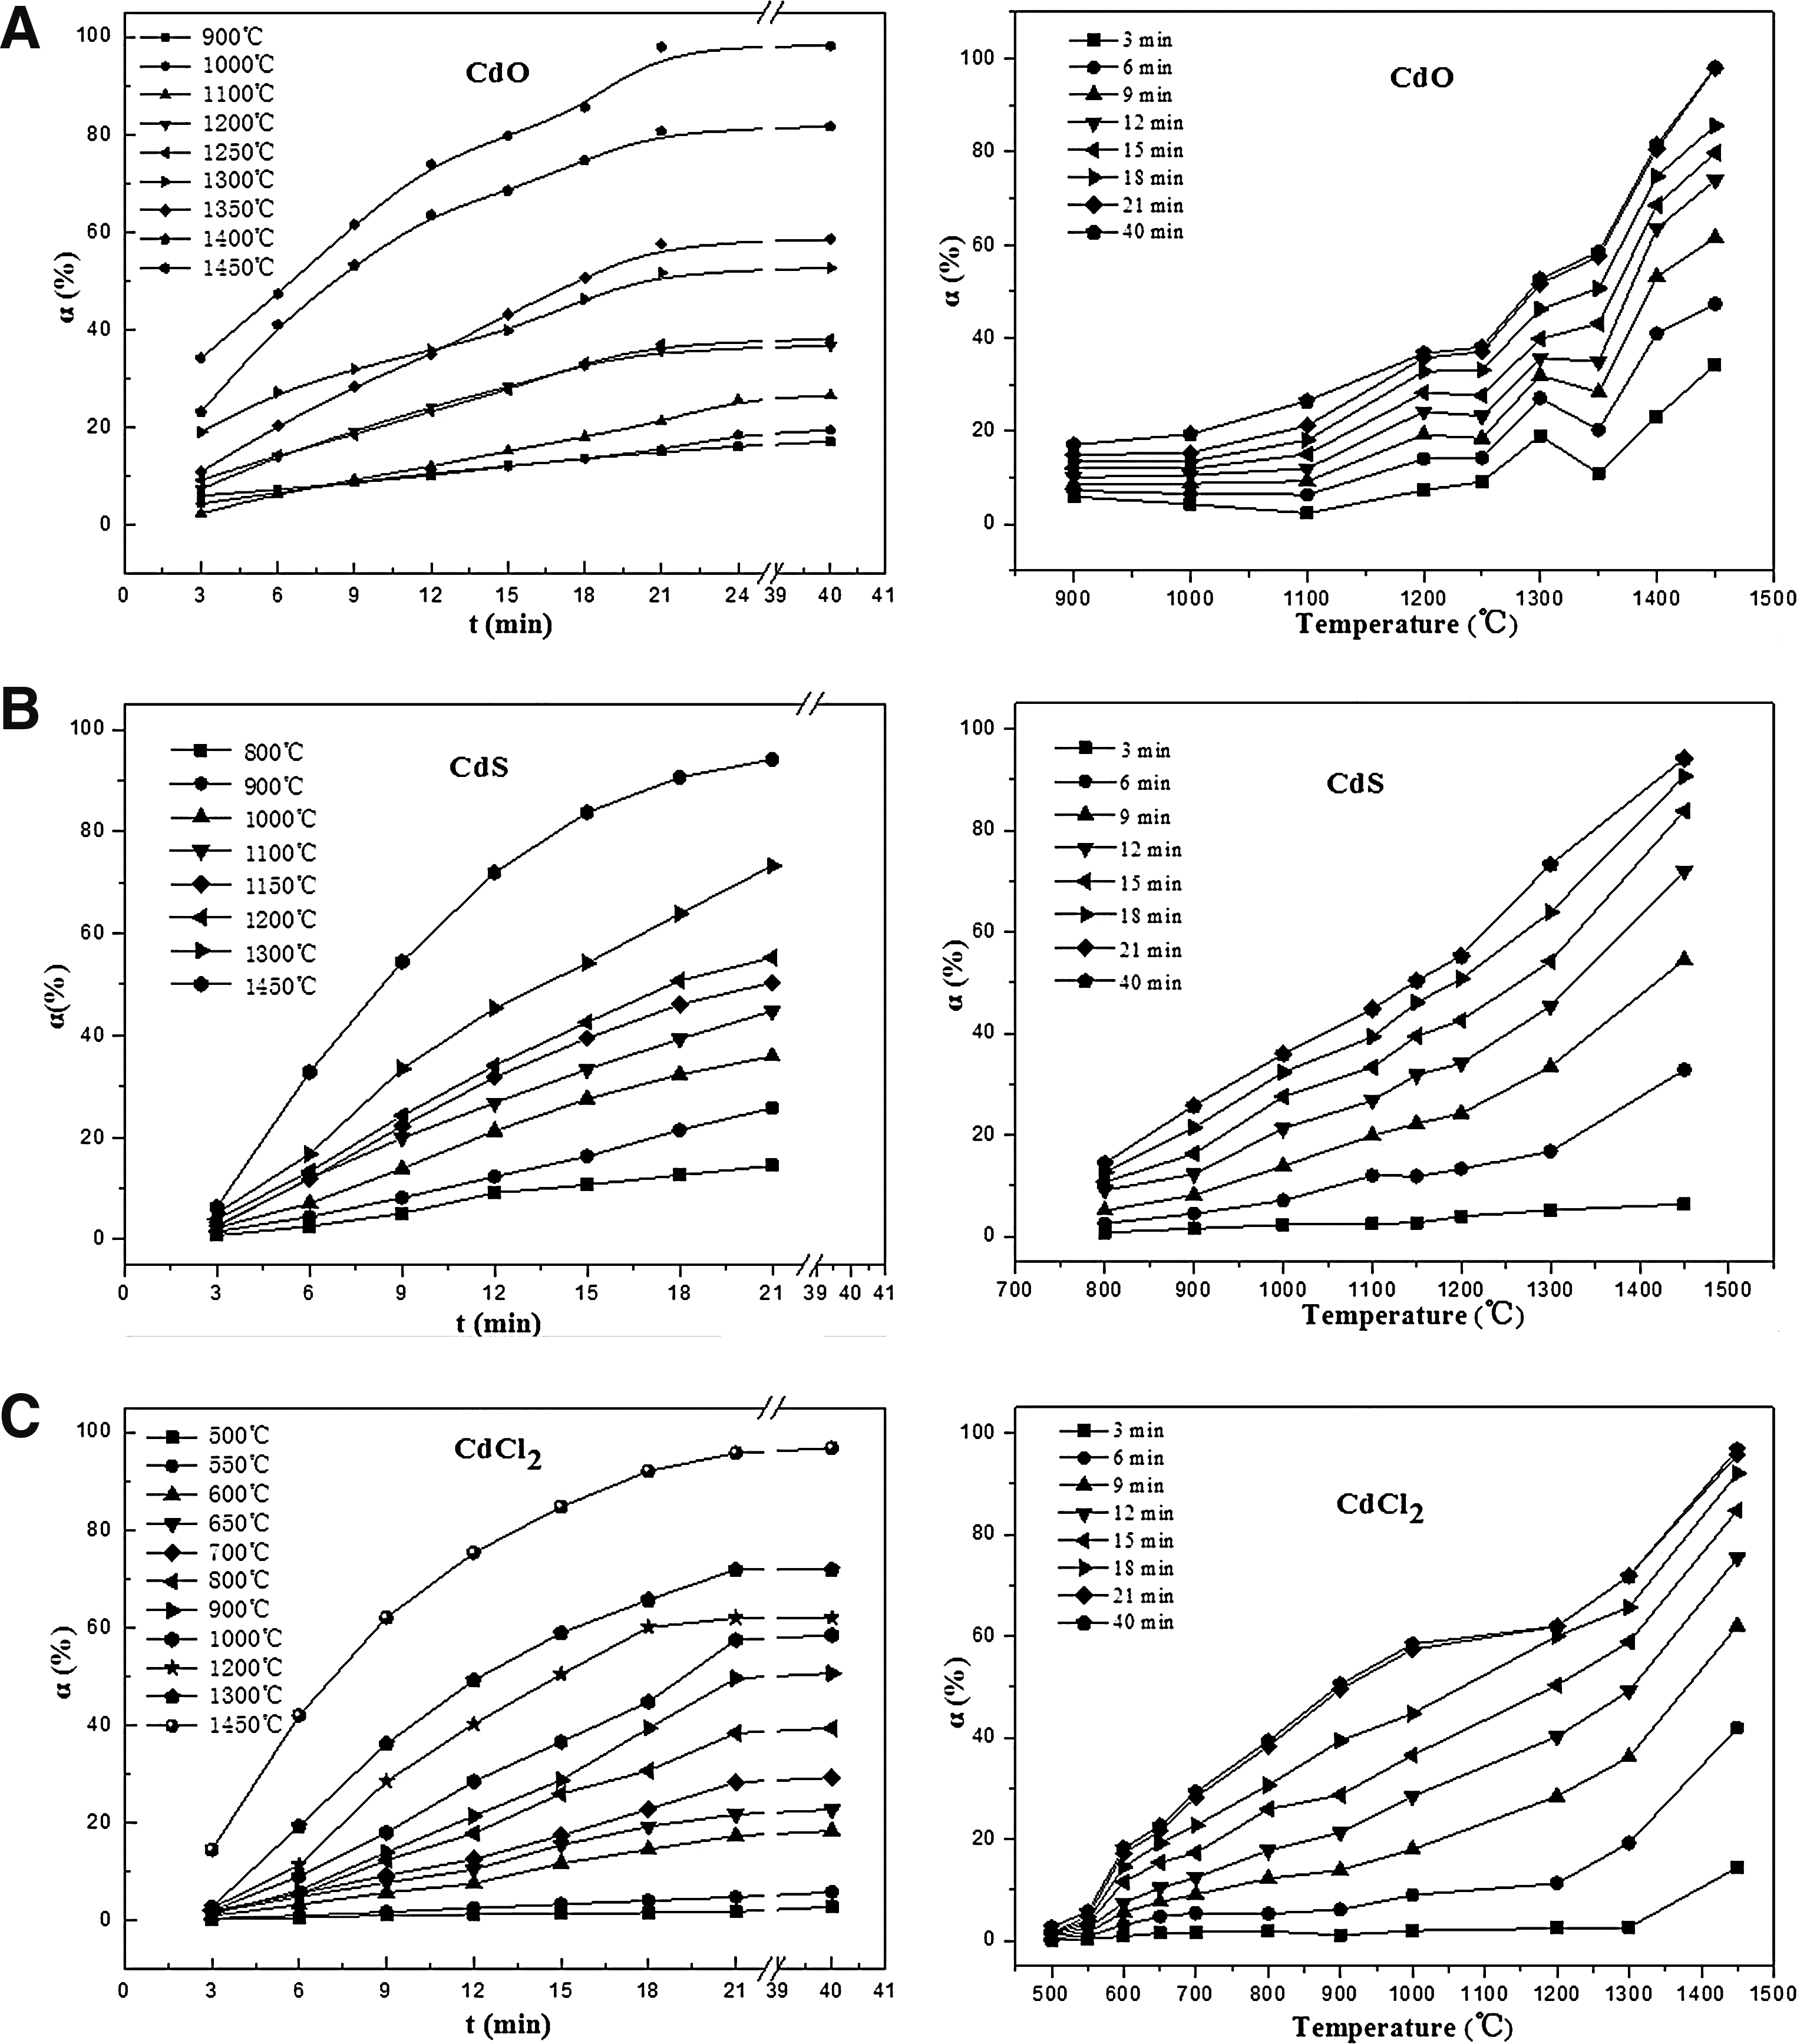
Effect of temperature and time on volatilization of Cd.
Kinetic models of heavy metal volatilization during co-processing with cement raw meals
There are many existing kinetic models, but most of these models are related to the TG experiments in which the temperature is increasing linearly with time (Coats and Redfern 1964; Font et al., 2011). However, in each set of these calcination experiments, the temperature was staying the same, and the heavy metal volatilization in the calcination experiment was an isothermal process. Then different sets of calcining experiments under different temperatures were conducted. Based on the concentrations of As, Pb, and Cd in the flue gas from laboratory scale calcining experiments, volatilization kinetic models of these heavy metals during co-processing were established according to the isothermal kinetics, which has not been widely used in recent literatures. Although the isothermal kinetics needs more set of isothermal experiments under different temperatures compared with nonisothermal kinetics, it does not need temperature to be increased linearly with time and is very suitable to the experiments conducted in tube furnaces.
Many heterogeneous reactions corresponding to volatilization are described by the model of pseudohomogeneous kinetics (Helsen and Van den, 2000; Adnadjevic et al., 2007), resulting in the following rate equation:
where α represents the volatilization proportion [in the present context, Eq. (1)], t represents the calcination time (min), k represents the reaction rate constant, T represents the absolute temperature of the reaction (K), and n represents the reaction order.
The variation of the rate constant with temperature is approximated by the Arrhenius equation, because this relationship dominates physical and chemical phenomena (Carrasco, 1993)
where A represents the preexponential factor (min−1), E represents the activation energy (KJ/mol), and R represents the universal gas constant (8.314 J/[mol·K]).
Under isothermal conditions, the integration of reaction (2) between t0 and t is easily carried out assuming t0=0, αt = t0=0:
for n=1
and for n≠1
A plot of the left-hand side of Equations (7) or (8) as a function of t, for a constant temperature T, should produce a straight line with the rate constant k as the slope.
Equation (6) can be transformed to Equation (9) as below:
A plot of the left-hand side of Equation (9) as function of 1/T should produce a straight line or polygonal line (if the reaction mechanism changes with temperature) with an intercept of lnA and a slope of E/R.
Kinetic models of As
Figure 8A shows the linear regression plot of −ln(1−α) as a function of t, assuming a reaction order of 1 for As in As2S3 using four calcining temperatures (450°C, 500°C, 550°C, 600°C). The best fit straight lines and their correlation coefficient (R) and standard deviation values for the four temperatures based on linear regression analysis are presented in this figure. The correlation coefficient and standard deviation values show good fitting effects, meaning that As volatilization can be described by a single reaction of order 1. The slopes of these lines are the reaction rate constants (k) at these particular temperatures (T). Figure 8B shows the linear regression plot of lnk as a function of 1/T. The coefficient of linear regression is 0.9769. The rate frequency factor (A) and activation energy (E) calculated are 1.77 min−1 and 26.26 KJ/mol, respectively. Therefore, the kinetic equation obtained is α=1 − exp (−1.77 exp (−3158/T)t) (10).

Linear regression plots of
When the calcination temperature is lower than 1,000°C, volatilization of As in As2S3 at any temperature and at any time can be calculated by Equation (10). Figure 9A shows the volatilization of As in As2S3 when the temperature is above 1,000°C. In this figure, b is an enlarged view of the small black box of a; and points A, B, C, D, E, and F are the intersections of the extension lines of experimental curves [reaction (4)] and theoretical calculation curves of reaction (2) by Equation (10) at the temperatures of 1,000°C, 1,100°C, 1,200°C, 1,300°C, 1,400°C, and 1,450°C, respectively. When the temperature is above 1,000°C, reactions (2) and (3) are completed in a very short period of time (less than 0.08 min), following which reaction (4) becomes the dominant reaction. Reaction (4) plays a vital role at higher temperatures, leading to a decrease in volatilization as temperature increases.
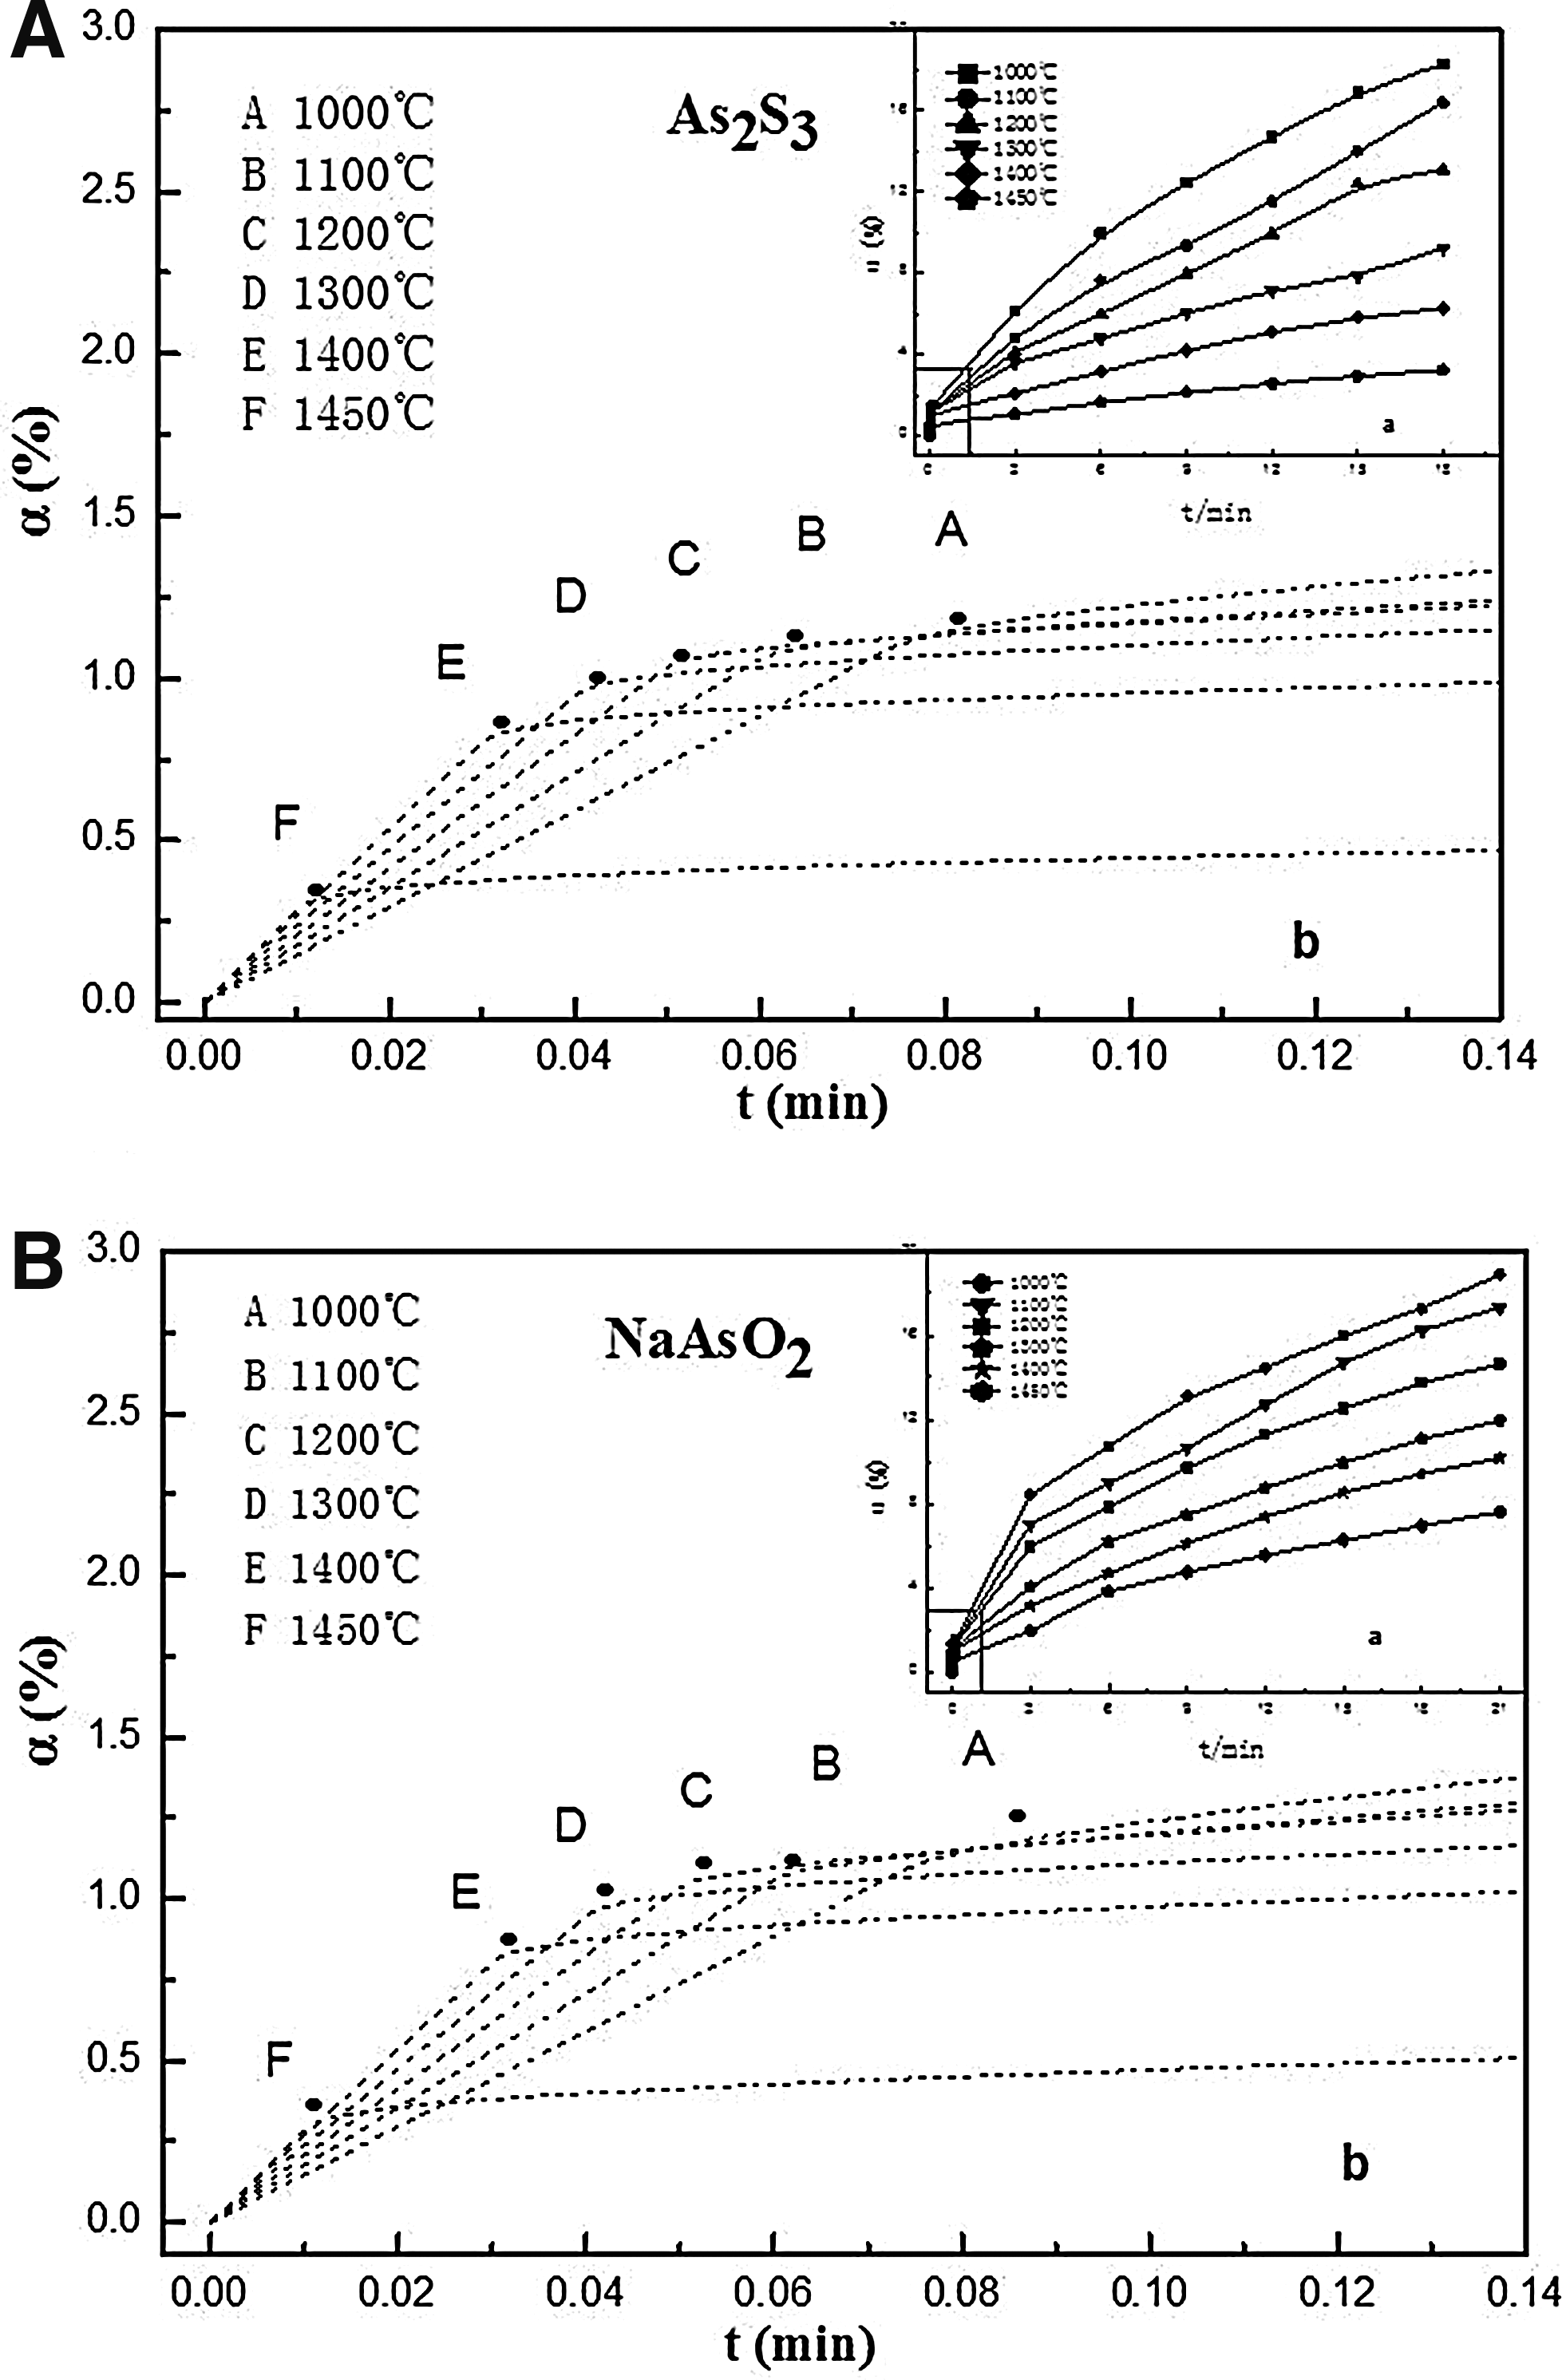
Volatilization of As in
NaAsO2 is not volatile below 900°C according to the TG experiments. When the temperature is above 1,000°C the volatilization behavior of As in NaAsO2 is similar to that of As2S3. The dynamic curve for the volatilization behavior of As in NaAsO2 is provided in Figure 9B, which can be described in the same way as As2S3. The volatilization proportion is always decreasing as the temperature rises, which indicates that reactions (2) and (3) are completed in a very short period of time.
Kinetic models of Pb
Table 3 shows the linear regression results of −ln(1 − α) as a function of t assuming a reaction order of 1 for Pb in PbCl2. The correlation coefficients show that the hypothesis of the reaction order of 1 is suitable.
Figure 10 shows the linear regression plot of lnk as a function of 1/T of Pb in PbCl2. The plots consist of two straight lines which are broken at 800–900°C. This means that the volatile kinetic equations are different when the temperature is below 800°C and when the temperature is above 900°C, which is shown in Fig. 10.
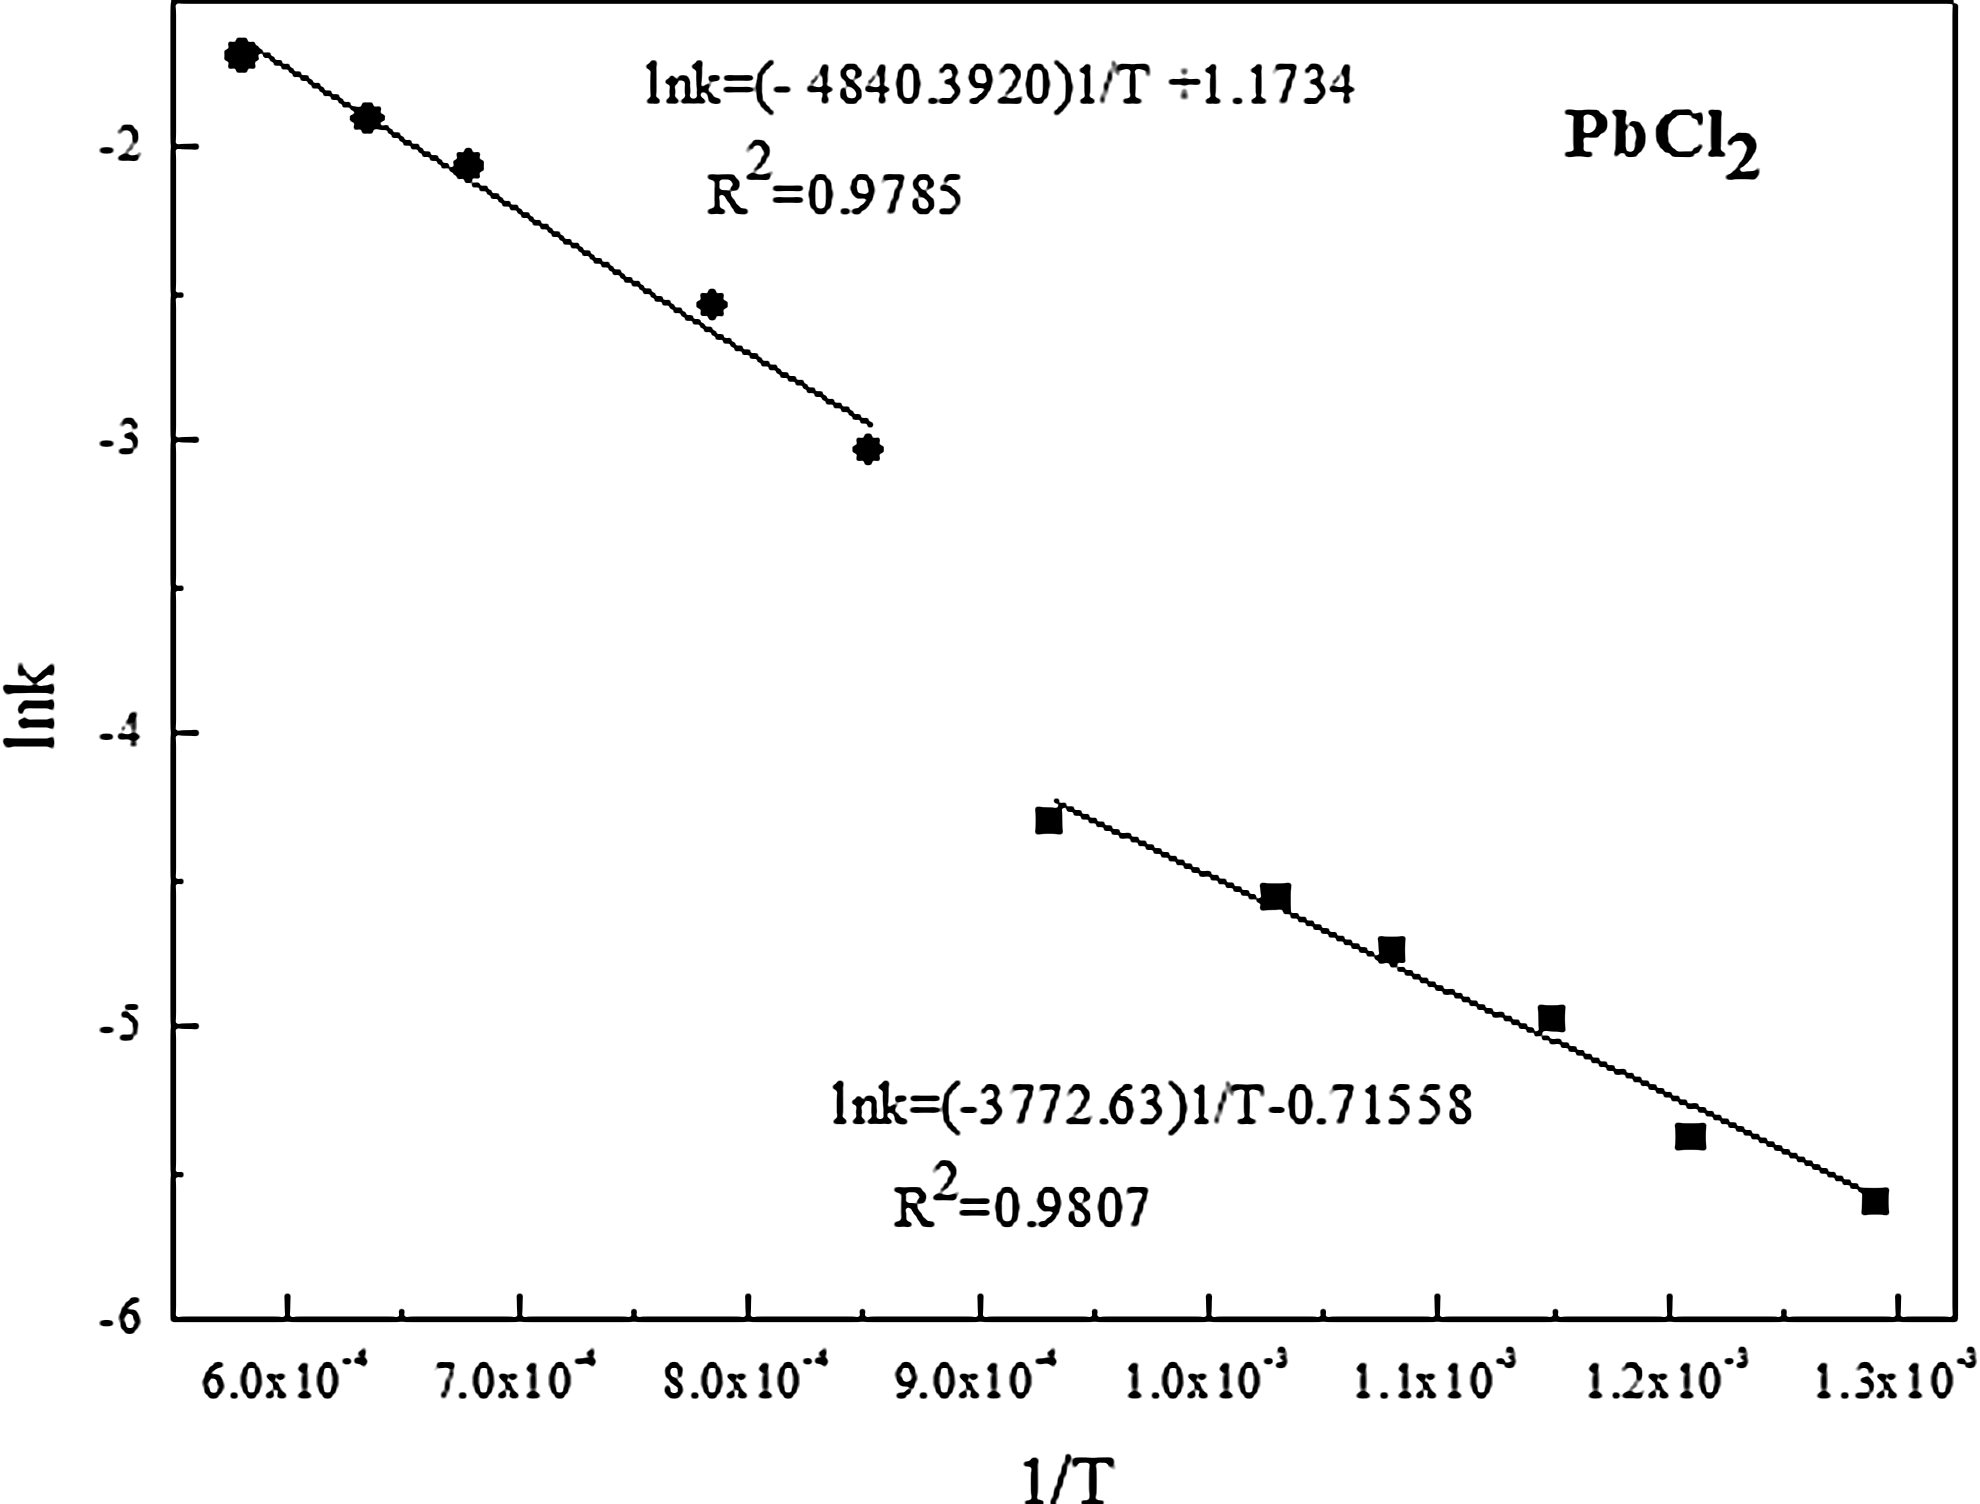
Linear regression plots of lnk versus 1/T for Pb in PbCl2.
The kinetic equations for Pb in PbO and PbS were obtained in the same way and are also shown in Table 4.
Kinetic models of Cd
Kinetic equations for Cd in CdO, CdS, CdCl2 were obtained in the same way and are summarized in Table 5.
Conclusions
The processing temperature and compound speciation have significant effects on the volatilization of heavy metals during co-processing in cement kilns. Na2HAsO4 does not volatilize, and the volatilization of As2S3, NaAsO2, PbS, PbO, PbCl2, CdO, CdS, and CdCl2 increases with the calcination time initially. However, after 25 min they no longer volatilize. The volatilization of Pb and Cd increases with an increase in temperature. However, the volatilization of As in As2S3 increases until a threshold temperature around 1,000°C; following this, volatilization decreases as temperature increases. NaAsO2 volatilizes only when the temperature is above 900°C and the volatilization of As in NaAsO2 always decreases as the temperature increases. The particular volatilization behavior of As can be explained by three parallel reactions. The volatility of different chemical forms of Pb and Cd is in the order chlorides>sulfides>oxides. Kinetic equations of As, Pb, and Cd in different chemical forms were obtained according to first-order kinetics. According to these equations, the volatilization proportion of these heavy metals contained in HW at any time and any temperature during co-processing in cement kilns can be accurately calculated.
Footnotes
Acknowledgments
This work was supported by the Environmental Public Welfare Project of China: “Environmental risk control technology study on co-processing HWs in boilers and industrial furnaces” (201209023) and the Sino-Norwegian project phase II: “Environmentally Sound Management of Co-processing Hazardous and Industrial Wastes in Cement Kilns in China” (CHN 2150 09/059).
Author Disclosure Statement
No competing financial interests exist.