




Abstract
Abstract
Vapor pressure osmometry (VPO) was used to measure the number-average molecular weights (Mn) of natural organic matter (NOM) that was isolated using reverse osmosis, hydrophobic acids (HPOA) that were isolated by adsorption on XAD-8 resin, and transphilic acids (TPIA) that were isolated by adsorption on XAD-4 resin. All samples were isolated from the headwaters of the Suwannee River in southeastern Georgia, USA, in May 2012. NOM, HPOA, and TPIA samples had Mn of 634±11, 583±8, and 498±7 g/mol, respectively. Novel methodology was introduced wherein VPO measurements were made at room temperature, and Mn values were rendered from a robust analysis of data that considered not only the well-known effect of hydronium ion but also the contributions of inorganic solutes present in the samples. The method was validated by results on a known sample (benzenehexacarboxylic acid), whose molecular weight was determined accurately to within 0.5% of the true value. The VPO-determined Mn are compared to those from noncolligative methods to highlight uncertainty regarding a fundamental parameter of matter found in nearly all terrestrial waters.
Introduction
T
Complex mixtures such as FA, HA, and NOM from soil and water contain many thousands of compounds that vary in size, shape, elemental composition, and molecular structure. Several experimental methods have been used in the past 60 years to investigate the distributions of molecular weight and various types of average molecular weights in these complex natural materials (Shapiro, 1957; Gjessing, 1965, 1970; De Borger and De Backer, 1968; Hansen and Schnitzer, 1969; Beckett et al., 1987; Schulten, 1987; Reid et al., 1990; Chin and Gschwend, 1991; Brown and Rice, 2000; Egeberg et al., 2002). The methods used to examine molecular weight distributions of FA, HA, and NOM may be classified as either colligative methods or noncolligative methods. Colligative methods exploit some property of the solvent that depends on the total molality of solutes but not the nature of the solutes. A good example is vapor pressure osmometry (VPO). Noncolligative methods exploit some property of the solutes (size, diffusion coefficient, mass-to-charge ratio, etc.). In noncolligative methods, instruments are calibrated using a range of solutes of known molecular weight, and calibration parameters are then used to estimate molecular weights of components of a complex mixture. Two common noncolligative methods are high-performance size exclusion chromatography (HPSEC) and flow-field flow fractionation.
VPO was chosen for this study, mainly because the total molality of nonvolatile solutes can be determined from their collective effect on the vapor pressure of water. The ratio of the mass concentration of solutes (g/kg H2O) to the total molality of solutes (mol/kg H2O) is the number-average molecular weight (Mn) of the solutes. When using VPO with a complex mixture, Mn may be expressed as a weighted-average of the molecular weights of individual components of the complex mixture.
where W is the mass concentration of solutes (g/kg H2O), mTOT is the total molality of solutes (mol/kg H2O), and wi, ni, and Mi are the mass concentration, molality, and molecular weight of the ith solute, respectively. Because only the total molality of solutes is determined by the colligative method, the molecular weights of individual components of a complex mixture are unknown and the distribution of molecular weights cannot be determined. Only the number-average molecular weight of the mixture is accessible.
The Mn values that were obtained using VPO in this study will be compared with other estimates of molecular weights of similar materials, most of which were obtained using noncolligative methods. Noncolligative methods usually yield a spectrum of molecular weights from which both Mn and the weight-average molecular weight (Mw) can be estimated. The weight-average molecular weight is defined as:
The ratio of Mw/Mn is known as the polydispersity of a mixture and must be greater than or equal to one. Summaries of average molecular weights of FA, HA, and NOM determined by colligative and noncolligative methods are presented in the literature (Zhou et al., 2000; Perdue and Ritchie, 2014).
Experimental
Sample collection and processing
NOM, HPOA, and TPIA samples were taken from the Suwannee River outflow of the Okefenokee Swamp (30°48′14′′N, 82°25′03′′W). This field location has been the source of IHSS standard samples and reference samples for over 30 years. For the NOM sample (2R101N), river water was concentrated by reverse osmosis, desalted by cation exchange, and then freeze-dried (Green and Perdue 2014). A history of the sampling location and conditions at the time of collection of the current samples are also provided in Green and Perdue 2014. The HPOA and TPIA samples were isolated by extraction from raw filtered surface water onto XAD-8 and XAD-4 resins, respectively, H+ saturated, and then freeze-dried (Kuhn et al., 2014). The VPO analyses and all supporting analyses were done on reconstituted solutions of the above-described isolates using ultrapure water.
pH measurements
An Orion Star A211 pH meter with automatic temperature correction was used to determine pH for all sample solutions. The temperature of samples and pH standards were maintained using a constant temperature water bath set to 25.00°C. After the pH meter was calibrated using standard pH buffers at pH values of 4.01 and 1.68, the pH values of sample solutions were measured, and then the calibration curve was verified using the pH 1.68 buffer. The pH values of samples were converted into the corresponding molality of H+ using the Davies equation to calculate the activity coefficient of H+. Ionic strength is required by the Davies equation, so the molality of H+ is calculated, approximating ionic strength initially as 10–pH and iteratively modifying ionic strength to equal the previous molality of H+ until the molality of H+ converges to a consistent value. In this approximation, the charge of H+ is assumed to be balanced by singly charged organic anions, which might not be a bad approximation, given the lower probability of multiply charged organic anions at the low pH (1.2–2.2) of the solutions under investigation.
Analyses of inorganic ions
Aliquots of the samples used in VPO measurements were diluted with ultrapure water to mass concentrations of ∼0.1 g/L. Concentrations of major cations and anions were determined using a Dionex ICS-5000 high-performance liquid chromatograph. Species were detected by electrical conductivity after elution from either an AS-15 column using 8.0 mM methanesulfonic acid (anions) or a CS-19-beta column using a 38–60 mM gradient of potassium hydroxide (cations). Concentrations were calculated from external calibrations for each analyte.
Silica analyses
Silica was measured in the solutions prepared for ion analysis according to a modified EPA Method 370.1. Dissolved silica was converted to molybdosilicic acid followed by a reduction to the heteropoly blue complex. Absorbance was measured at 815 nm on a Shimadzu UV-1800 spectrophotometer, and concentrations were calculated based on a linear calibration conducted with sodium silicate standards.
Solutions for VPO
Each molecular weight determination required a run set of five or six varied-concentration aqueous solutions for a given sample. Initial solutions were prepared by transferring portions of powdered sample into 15-mL Teflon centrifuge tubes, adding ultrapure deionized and vortex mixing. Serial dilutions of initial solutions were made to complete each run set. The serial dilutions were done so as to retain about 1.5 mL at each concentration, ensuring sufficient volume for both VPO analysis and pH determination. Initial solutions typically contained between 65 and 114 mg of sample. Masses of added water and aliquots of solutions used for serial dilutions were determined gravimetrically to a precision of 0.1 mg. Each run set typically spanned ranges of mass concentrations between 6 and 12 g sample/kg H2O. A run set of benzenehexacarboxylic acid (mellitic acid) was likewise prepared to be used as a quality control standard for precision and accuracy evaluation of the VPO method. Benzenehexacarboxylic acid was selected because of its similarities to NOM, a polyacidic organic compound.
Vapor pressure osmometry
A Knauer K-7000 vapor pressure osmometer was used in this study. Ultrapure water was used for the blank and the reference solution, and the calibration standard was a KCl solution of known molality. Measurements were made at 25°C with a head temperature of 27°C (The manufacturers recommended temperature range for water as a working solvent is 37–60°C. See the Supplementary Data for comments on room temperature measurements; Supplementary Data are available online at www.liebertpub.com/ees). Rather than relying on the internal software of the Knauer K-7000, the analog output from the instrument (voltage versus time) was transferred through a Labjack Model U12 analog-to-digital converter to a personal computer running DAQ-Factory data acquisition software and Microsoft© Excel. All baseline corrections and data processing were accomplished using Excel. After baseline corrections, the voltage (θ) of each standard and sample was calculated as the average voltage measured over the last 60 s of stable response.
Blank, reference, sample, and standard solutions were loaded into clean, dry 1-mL glass syringes and placed in sample slots of the Knauer K-7000. Drops of reference and blank solutions were applied to the reference and working thermistors, respectively. Once a stable zero-voltage baseline was achieved, a drop of standard solution was applied to the working thermistor, and the system was allowed to stabilize at a new voltage (up to 12 min). See Supplementary Data for comments on equilibration time. Sample solutions were analyzed in the same manner. The blank solution was analyzed after every three to four sample solutions and also at the end of each data collection to enable any necessary corrections for baseline drift. When progressing from one solution to the next, 5–10 successive drops of the new solution were used to eliminate carryover of the previous solution.
Data treatment
The output of VPO analysis is a voltage response (θ) that can be related mathematically to the total molality of solute by the following:
Here, θo is the linear calibration offset that has a nonzero value except at very low solute levels. The value of A and θo can be determined by linear regression of response values from standard solutions. Neglecting all terms beyond the first-order term, the response function is simplified to:
where θ′ is the corrected instrument response. The total solution molality includes all solute species, including organic matter, H+, inorganic cations, inorganic anions, and inorganic neutral solutes. If VPO measurements are conducted in a nonaqueous solvent, then adsorbed H2O in the sample is another low-molecular-weight solute for which a correction is necessary. The hygroscopic nature of tetrahydrofuran, the nonaqueous solvent typically used for VPO measurements of NOM (Aiken and Malcom, 1987), poses another significant obstacle; determination of water content in the sample drop at the precise time of measurements would be required. With water as the solvent, sample moisture content is simply added to the solvent mass and ambient humidity during determinations is of negligible concern.
Building upon earlier derivations (Reuter and Perdue 1981; Aiken and Gillam, 1989), dissociated protons together with other inorganic impurities are summed into a molality of inorganic solutes (mINORG).
where
When a dry sample is weighed and dissolved in water, the total mass includes organic matter and inorganic matter. The mass of organic matter is obtained by subtracting the mass of inorganic matter, as calculated from analytical measurements of inorganic constituents, from the total mass of a weighed dry sample. The mass concentration of organic matter (WORG) is simply the mass of organic matter per kg of H2O. The molality of organic matter (mORG) is proportional to WORG, the proportionality constant being (1/Mn). Equation (5) thus leads to:
or, solving for Mn:
Equation (8) can be solved to obtain Mn for a single solution; however, due to data scatter (Adicoff and Murbach, 1967; Meeks and Goldfarb, 1967), a single “best fit” value of Mn is preferable and was obtained in this study by minimizing the error between θ′ and θ′CALC within sets of colligative measurements that are obtained over a range of WORG. Equation (7) naturally yields Equation (9) from which θ′CALC was determined:
To find the best fit single value of Mn for a set of measurements, the root mean square error (RMSE) for the set of data was minimized, where RMSE is defined in Equation (11). Because θ′CALC is a nonlinear function of Mn, the optimization of Mn was achieved via nonlinear regression. The Solver tool in Microsoft© Excel is well adapted for this purpose and may be used directly to minimize the RMSE. Equation (10) is a reworking of Equation (9) so that θ′CALC is a linear function of the parenthetical term with Mn as its slope. If observed θ′ values for a data set are plotted versus corresponding values of the parenthetical term of Equation (10), using the best fit Mn to evaluate the parenthetical term, the slope of least-squares linear regression of these data should have the same value as the best fit Mn. This procedure provides an internal consistency check of the best fit Mn and has the further advantage of providing an estimate of the standard error in Mn, which was taken to be the standard deviation of calculated slope. The regression was performed using the Analysis ToolPak in Microsoft© Excel with the forced-through-origin option employed.
Alternatively, an iterative linear regression method described by Reuter and Perdue (1981) may be used. In that method, the parenthetical term in Equation (9) is first evaluated with an initial guess of Mn=0 (analogous to treating the sample as a nonelectrolyte), and linear regression is used to find the slope of the best straight line that passes through the origin. A new estimate of Mn is obtained from the slope and that Mn can then be used to re-calculate the parenthetical term in Equation (9). The overall process is repeated until the Mn inside the parenthetical term and the Mn from the slope converge to the same value. For the data presented here, the two methods yield Mn values that differ by less than 0.05%.
Results and Discussion
Concentrations of inorganic solutes in the solutions used for VPO measurements on benzenehexacarboxylic acid, NOM, HPOA, and TPIA samples are given in the Supplementary Data (Supplementary Tables S1–S4). The most striking detail is the relatively high molality of inorganic solutes (0.01–0.03 m in the most concentrated samples). The measured ash contents of the dry NOM, HPOA, and TPIA samples are 4.01%, 1.55%, and 3.47%, respectively. Such low ash contents do not interfere significantly with most methods of chemical and spectroscopic characterization of NOM, HPOA, and TPIA. In the case of VPO, however, small mass percentages of solutes having low formula weights strongly affect the apparent Mn of a sample. As a simple example, suppose a sample contains 97.7% NOM with an actual Mn of 800 g/mol and 2.3% Na as a contaminant. When the sample is dissolved in water, the ratio of molalities of Na+ and NOM is 0.82. If the presence of Na+ is overlooked, the Mn calculated from a VPO measurement will be around 440 g/mol rather than 800 g/mol, even after correction for the H+ formed by dissociation of acidic functional groups. The authors are unaware of the correction for inorganic impurities having been made in earlier studies.
The actual data sets used to obtain Mn are given for benzenehexacarboxylic acid, NOM, HPOA, and TPIA in the Supplementary Data (Supplementary Tables S5–S8). The instrument constants A and θo [see Eqs. (3)–(10)] were obtained by linear regression fitting of calibration data that were generated for KCl solutions of known molality. The optimum parameters were A=19.32 V·kg/mol and θo=0.044 V. The data in Supplementary Tables S5–S8 were used in Equation (8) to calculate Mn at each data point, and those results are tabulated. Simple unweighted averages of the point-by-point estimates of Mn in Supplementary Tables S5–S8 for benzene-hexacarboxylic acid, NOM, HPOA, and TPIA are 350, 650, 577, and 506 g/mol, respectively. Nonlinear regression was also used to solve Equation (9) for a best fit value for Mn by minimizing the RMSE in Equation (11). The best fit values of Mn are 343±4, 634±11, 583±8, and 498±7 g/mol for benzenehexacarboxylic acid, NOM, HPOA, and TPIA respectively. Because the best fit result for benzenehexacarboxylic acid was more accurate (t.v.=342.16 g/mol), the best fit Mn values will be used subsequently in this article. Graphical validation is shown in Figs. 1–4, where θ′ vs. mTOT is plotted for each sample using the best fit Mn; the slope in each case is highly consistent with the calibration constant “A” indicating that Equation (7) has been duly satisfied.
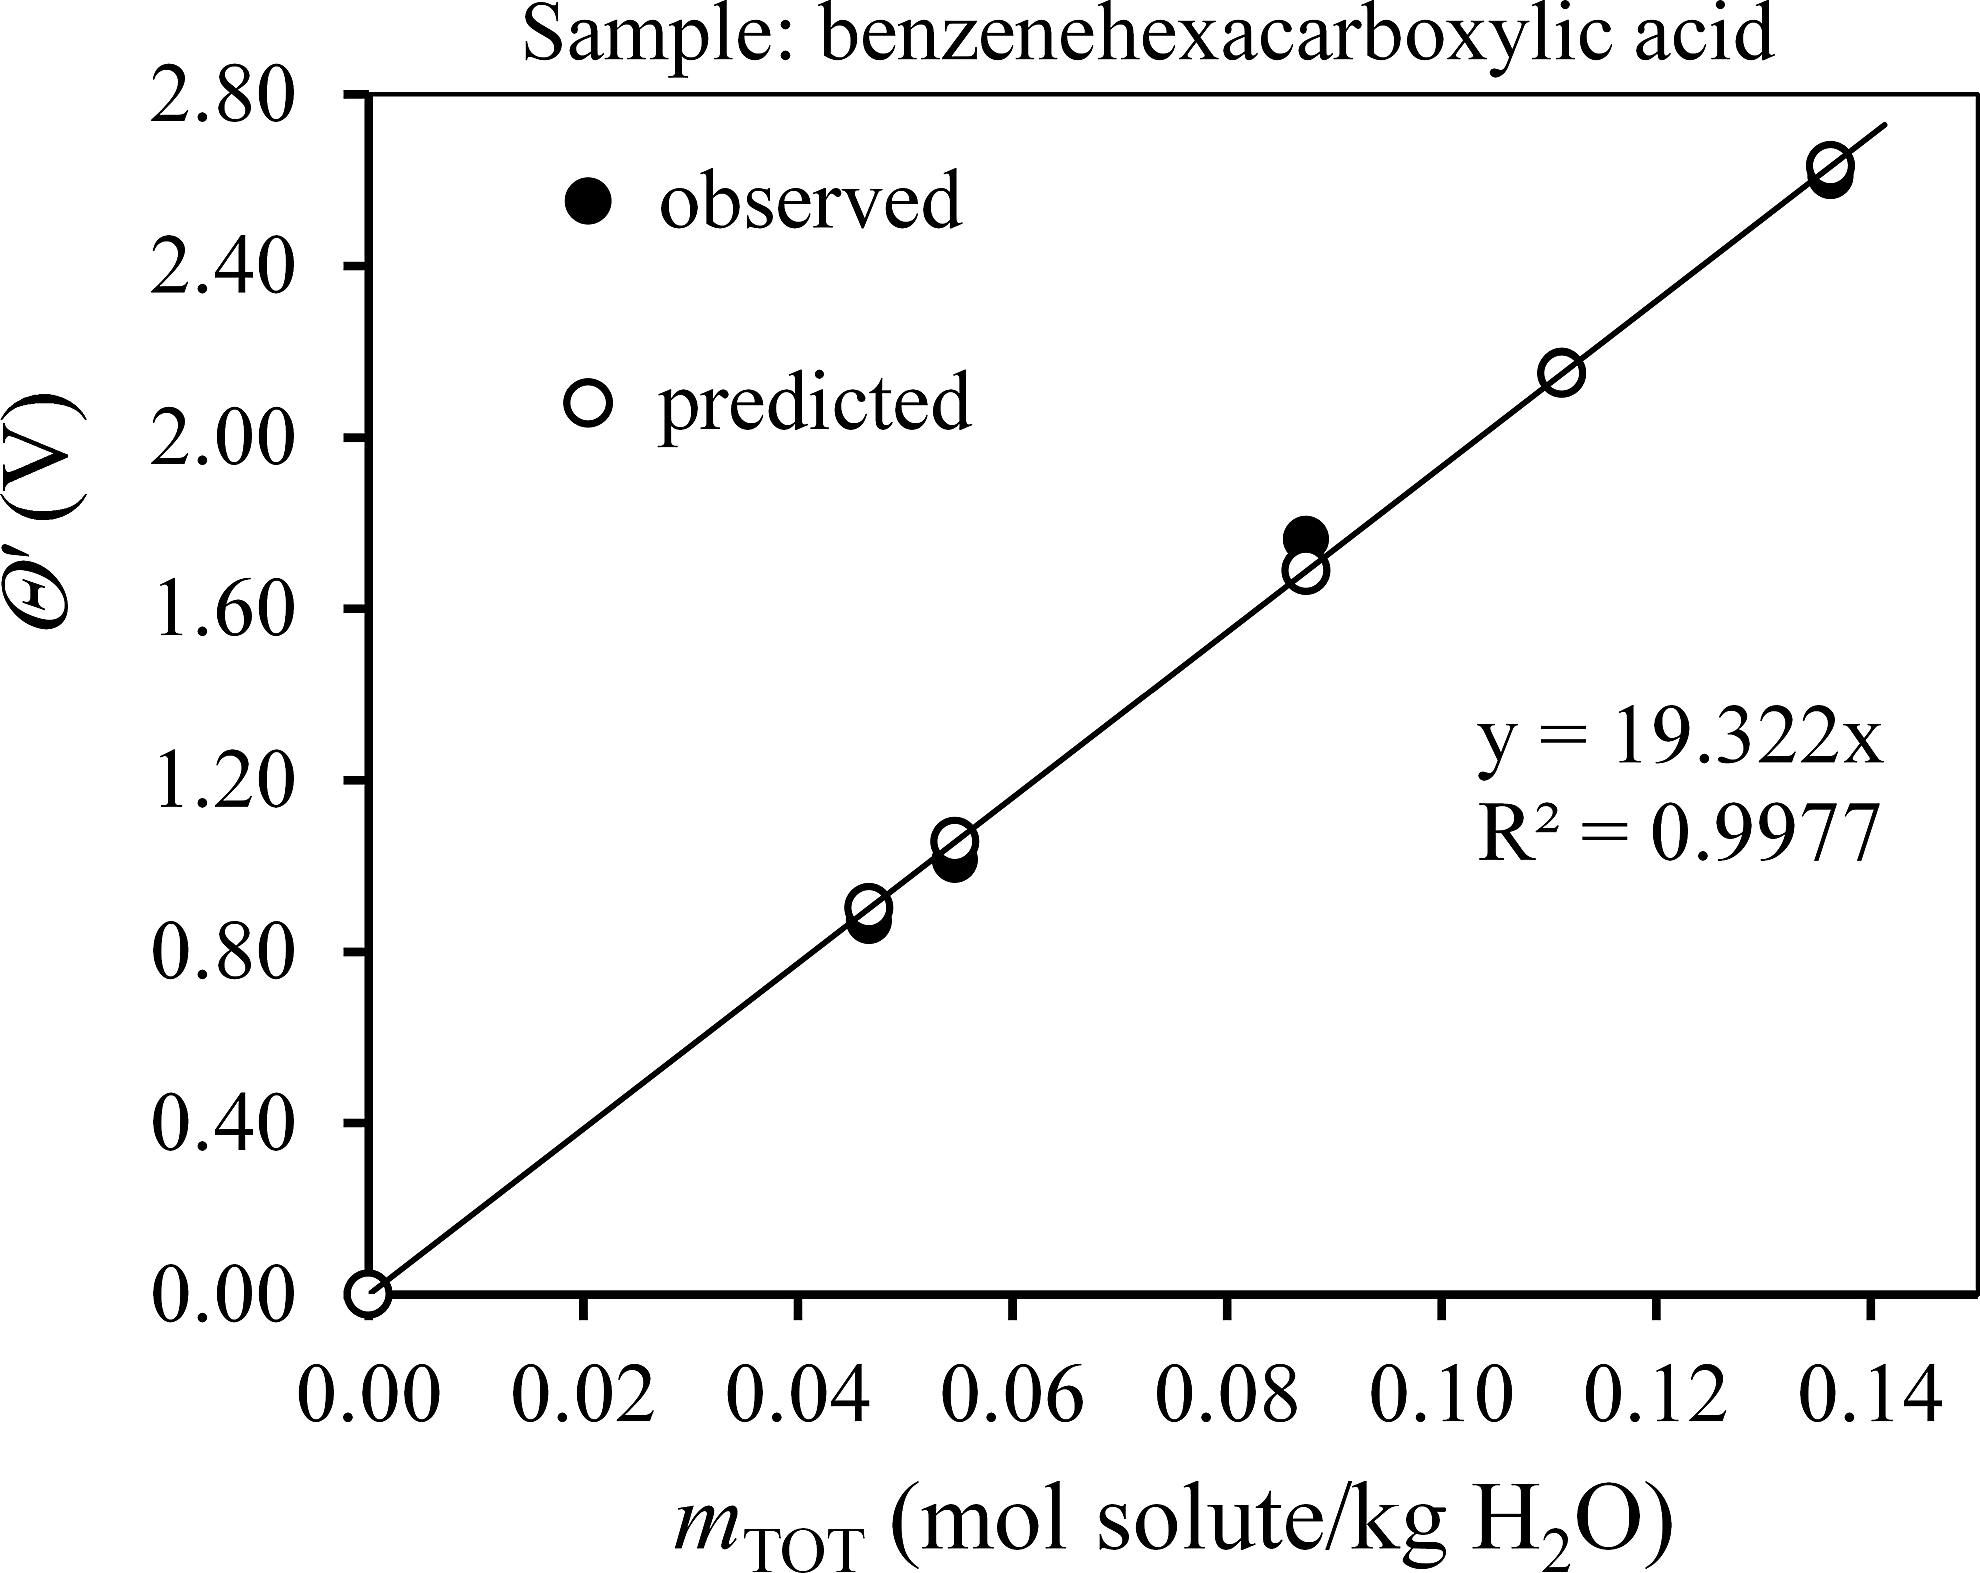
θ′ vs mTOT for the quality control standard, benzenehexacarboxylic acid. The line shown is for predicted data and therefore has a slope of precisely 19.32 V·kg/mol, the linear calibration constant A. The equation shown is for observed data. The best fit Mn was used to calculate observed and predicted x-values.
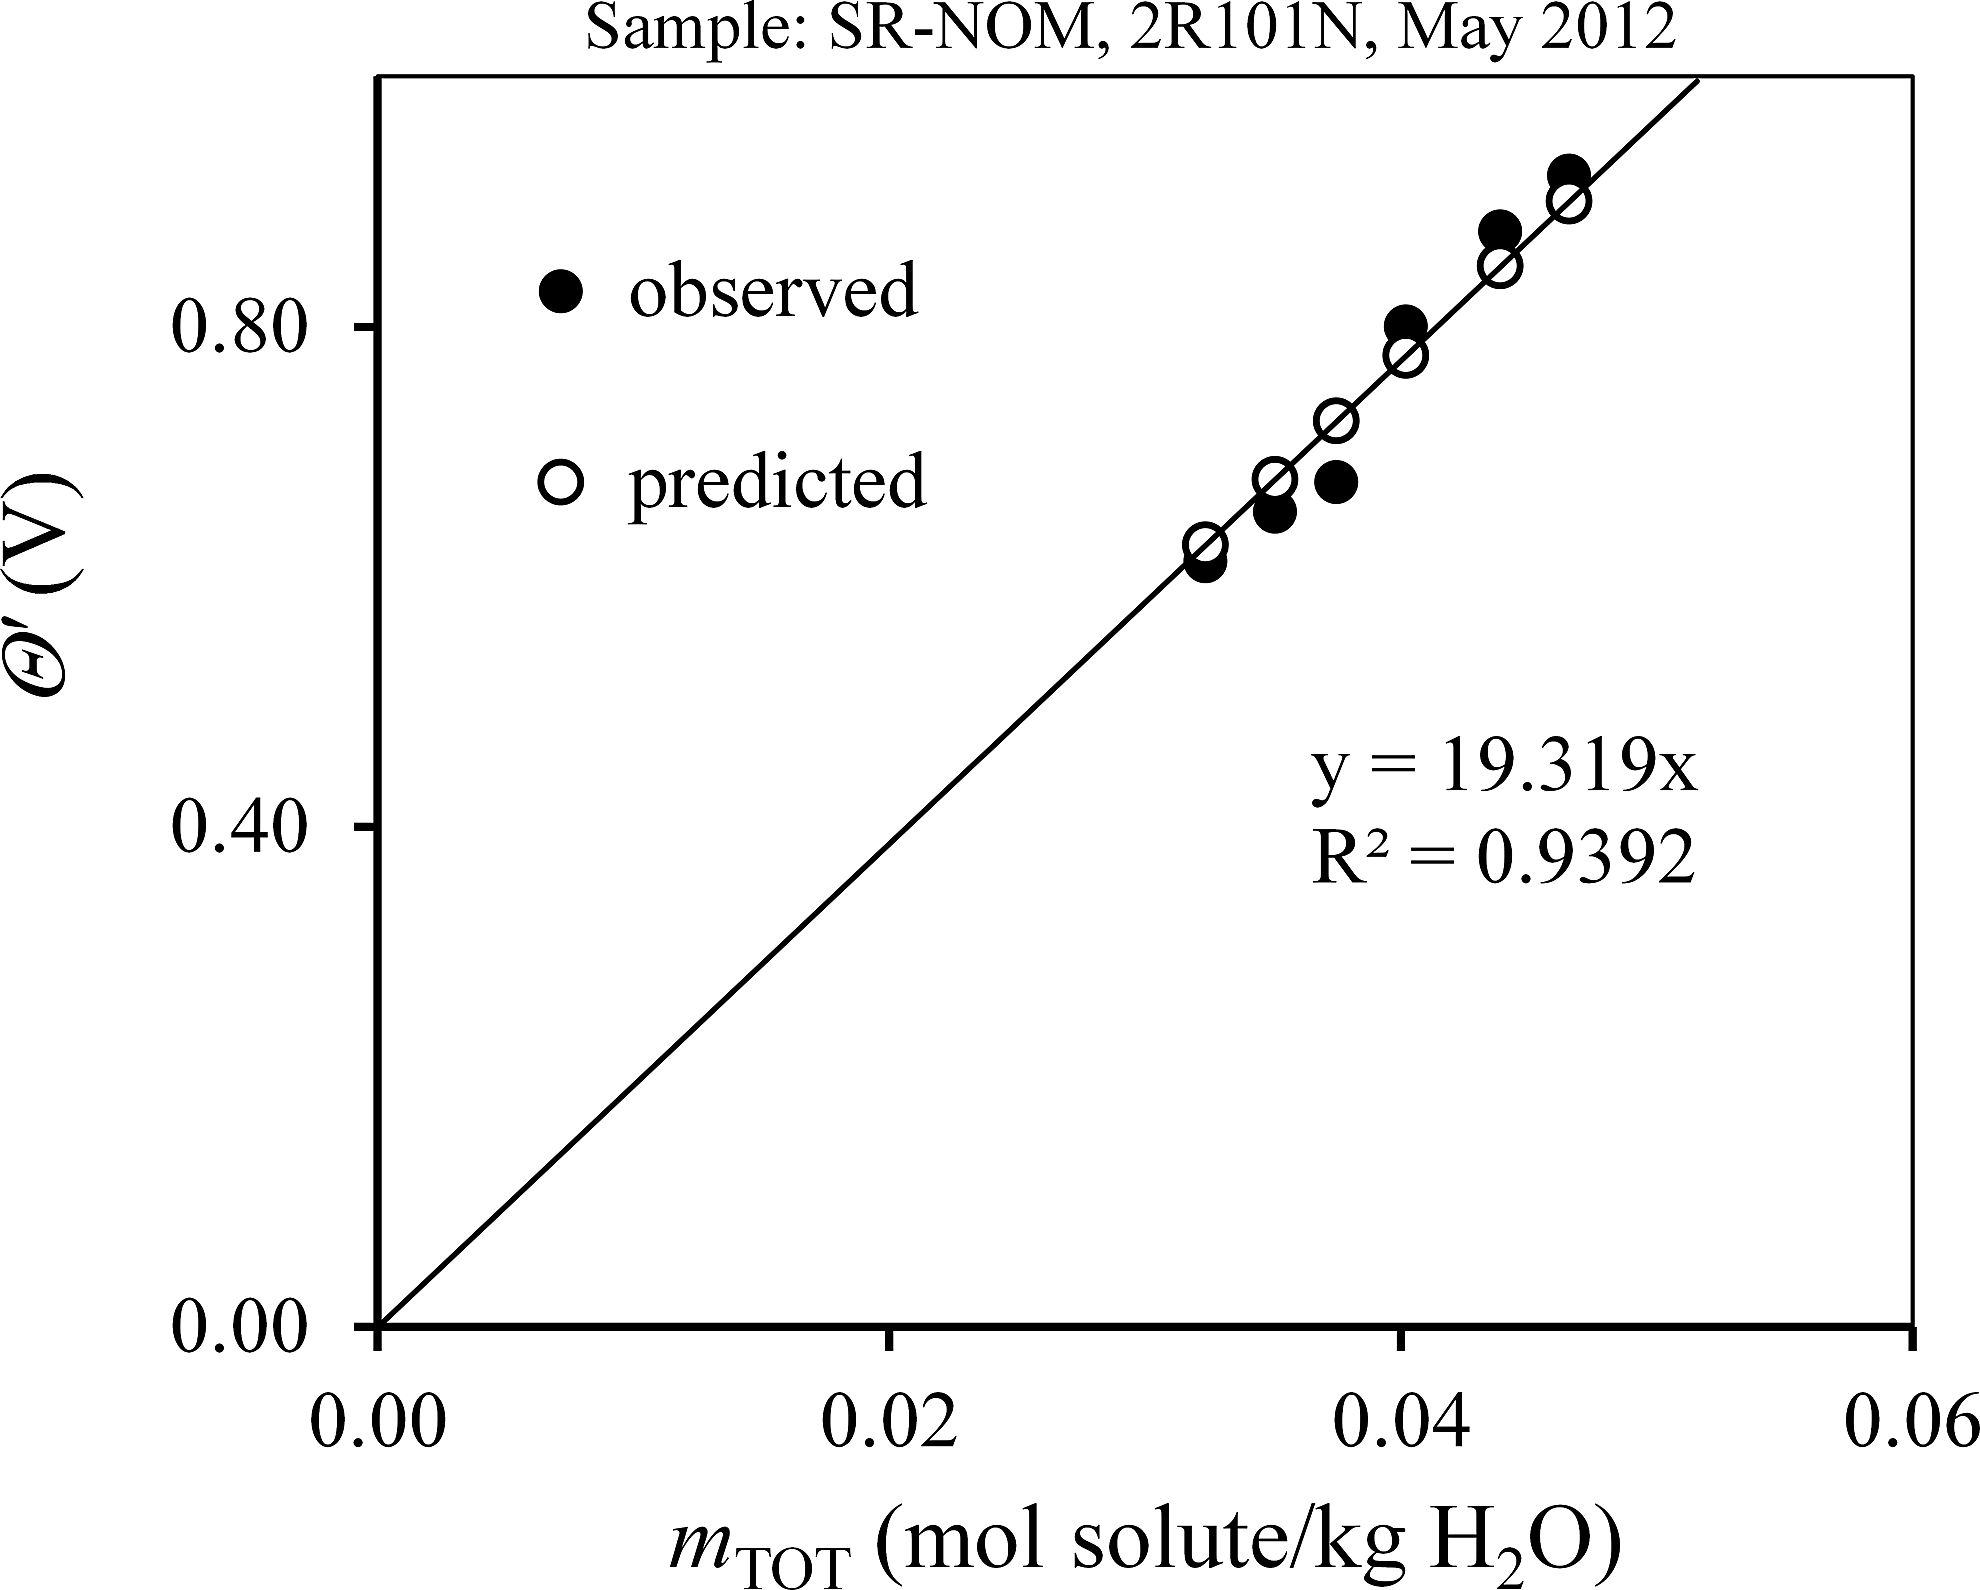
θ′ vs mTOT for NOM. The line shown is for predicted data and therefore has a slope of precisely 19.32 V·kg/mol, the linear calibration constant A. The equation shown is for observed data. The best fit Mn was used to calculate observed and predicted x-values. NOM, natural organic matter; SR, Suwannee River.

θ′ vs mTOT for HPOA. The line shown is for predicted data and therefore has a slope of precisely 19.32 V·kg/mol, the linear calibration constant A. The equation shown is for observed data. The best fit Mn was used to calculate observed and predicted x-values. HPOA, hydrophobic acids.

θ′ vs mTOT for TPIA. The line shown is for predicted data and therefore has slope of precisely 19.32 V·kg/mol, the linear calibration constant A. The equation shown is for observed data. The best fit Mn was used to calculate observed and predicted x-values. TPIA, transphilic acids.
As a group, the Mn values for NOM, HPOA, and TPIA in the present study are relatively low. The authors have used the same experimental protocol to determine Mn for 10 additional samples of FA and NOM that were isolated from the same sampling site on the Suwannee River between 1982 and 2006 (unpublished data). The overall average Mn for those 10 samples is 724±68 g/mol, and the median Mn is 736 g/mol. So, even compared to other identically treated samples from the same sampling site, the Mn values in the present study are somewhat low. The senior author has sampled the Suwannee River at this sampling site intermittently since 1987. The samples of NOM, HPOA, and TPIA in the present study were isolated at a time (May 2012) when the water level in the Okefenokee Swamp was extremely low, the concentration of total organic carbon was extremely high, and pH was significantly low, 3.7 compared to our 20-year average of 4.0 (Green and Perdue, 2014). We suspect that the high TOC concentration and low pH might reasonably be expected to shift the distribution of molecular weights of organic solutes in the Suwannee River water to lower values of Mn.
The Mn value of the NOM sample is somewhat greater than that of the HPOA sample, and both NOM and HPOA have significantly greater Mn than the TPIA sample. The methods of isolation all have biases that might contribute to these differences in Mn. Reverse osmosis membranes reject solutes primarily on the basis of size and, to a lesser degree, charge. Consequently, solutes with low molecular weight are less well rejected by RO membranes and might escape while the sample is being concentrated. The loss of such solutes would increase the Mn of the isolated NOM sample relative to the original NOM in the source water. The XAD-8 and XAD-4 resins are hydrophobic adsorbents that preferentially adsorb uncharged hydrophobic solutes from aqueous samples that have been acidified to pH 2, including those carboxylic acids that are protonated at pH 2. Other charged solutes and uncharged hydrophilic solutes are not adsorbed efficiently. In addition, the XAD-8 and XAD-4 resins are used in tandem, with the XAD-4 resin receiving as its feed solution the effluent from the XAD-8 resin. The overall process involves more than the size and charge of solutes, so it is unclear how Mn of HPOA and TPIA should be expected to differ from the Mn of NOM in the original source water, the Mn of the isolated NOM sample, or from each other.
Comparison with other measurements of Mn and Mw
Perdue and Ritchie (2014) have summarized the available data from the literature for Mn and Mw of FA, HA, and NOM from freshwaters. Their summary statistics are in Table 1, excluding a few measurements using multiangle laser light scattering, for which both Mn and Mw were roughly one order of magnitude greater than results from any other method. Almost 90% of the measurements in Table 1 were obtained for FA and NOM. The Mn values of NOM, HPOA, and TPIA in this study will be compared with average and median Mn values of pooled data for FA and NOM in Table 1. This approach is justified by the low percentage of HA in the Suwannee River, the much more robust statistics for FA and NOM, and the similarity of their average and median Mn values. Using the pooled data, the average Mn for FA and NOM that was determined using the colligative method is 674±115 g/mol, with a median value of 626 Da. For noncolligative determinations of Mn, the average is 1,132±412 g/mol, with a median value of 1,120 Da. For noncolligative determinations of Mw, the average is 1,775±723 g/mol, with a median value of 1,690 g/mol.
Summarized from Wilson and Weber (1977), Dawson et al. (1981), Reuter and Perdue (1981), Aiken and Malcolm (1987), Beckett et al. (1987), Reid et al. (1990), Chin and Gschwend (1991), Chin et al. (1994), Dycus et al. (1995), Peuravuori 1998 and Schimpt and Petteys (1997), Pihlaja (1998), Croue et al. (1999), Everett et al. (1999), Westerhoff et al. (1999), Cabaniss et al. (2000), Cho et al. (2000), Thang et al. (2001), Benedetti et al. (2002), Egeberg et al. (2002), Maurice et al. (2002), Egeberg and Alberts (2003); colligative (C) methods include vapor pressure osmometry and cryoscopy; noncolligative (NC) methods include size exclusion chromatography, high performance size exclusion chromatography, flow field-flow fractionation, multiangle laser light scattering, ultraviolet scanning ultracentrifugation, diffusivimetry, and molar absorptivity-ultraviolet spectrophotometry. All molecular weights are in units of g/mol.
FA, fulvic acids; HA, humic acids; N/A, not applicable; NOM, natural organic matter.
The Mn of NOM, HPOA, and TPIA were determined using the colligative method, so they are most directly comparable to other colligative measurements of Mn. The results presented here for NOM and HPOA (634 and 583 g/mol) are similar to the average and median Mn values from colligative measurements for other samples of FA and NOM (674 and 626 g/mol, respectively); however, the Mn of TPIA (498 g/mol) is somewhat lower than any of the colligative measurements of Mn in Table 1 and well below the average and median results for FA and NOM. Our result is in fair agreement with what is, to our knowledge, the only other reported Mn for a TPIA fraction of NOM; 411 g/mol for a TPIA sample (then referred to as HPIA) recovered from the Yakima River (Aiken et al., 1992). It is somewhat surprising that the results in this study are in better general agreement with Mn values of FA and NOM samples from many sampling sites than with the long-term average Mn at this sampling site, but the differences are small and probably unimportant.
The colligative results presented here for NOM, HPOA, and TPIA (634, 583, and 498 g/mol) and the colligative estimates of Mn in Table 1 are both roughly a factor of two lower than the corresponding noncolligative estimates of Mn in Table 1. This result is consistent with the literature, where noncolligative estimates of Mn typically exceed colligative estimates by roughly a factor of two. The results of Chin et al. (1994) are noteworthy because they were able to use HPSEC (the noncolligative method) to obtain Mn that were only slightly elevated (by an average of 24%) compared to the values others had obtained using VPO. The overestimation of Mn by noncolligative methods has been attributed, at least in part, to widespread use of UV absorbance as a method of detection of organic matter (Chin et al., 1994; Her et al., 2002). Her et al. (2002), using HPSEC to obtain molecular weight distributions, found that the use of UV absorbance rather than TOC increases Mn values by 10–20%. Other factors must be invoked to explain the larger differences found in Table 1 (Perminova et al., 1998; Perminova, 1999). The authors greatly prefer colligative measurements of Mn because colligative measurements are based on some physical property of the solvent that depends on the mole fraction of a nonvolatile solute. The properties of the solvent (melting point, boiling point, vapor pressure, osmotic pressure, etc.) are generally well known.
In recent years, mass spectrometry has more commonly been employed as the noncolligative method of analysis of the molecular weight distributions of FA, HA, and NOM. In a few such studies, Mn and Mw values have been calculated by assuming that peak intensity is a surrogate for the number of moles of molecular formulae having a given exact mass. A brief summary is given in Table 2. Fifteen results are for FA and NOM. Neglecting two results that are a factor of three greater than the other 13 results, the average Mn is 625±199 g/mol, with a median Mn of 591 g/mol.
The similarity of the results from Table 2 to the colligative estimates of average Mn in Table 1 (696±208 g/mol, with a median Mw of 695 g/mol) is striking and entirely unexpected. The agreement between colligative results and mass spectrometric results is probably fortuitous. Unlike colligative methods, which depend on the total molality of solutes but not on the nature of the solutes, mass spectrometric methods depend on the method by which ions are generated, the ease of formation of ions, and so on and are not believed to respond uniformly to all components of a sample of FA, HA, or NOM (Kujawinski et al., 2002).
Conclusions
Samples that were isolated from the Suwannee River, Georgia, USA, in May 2012 were obtained under the most extreme conditions of drought, high TOC concentration, and low pH that the senior author has encountered at this sampling site. Number-average molecular weights of NOM, HPOA, and TPIA samples were consistently lower than long-term average values of Mn that were determined using exactly the same experimental approach for other samples that have been isolated from this sampling site between 1982 and 2006. Speculatively, the extreme conditions may have suppressed the accumulation of larger molecules and favored the accumulation of smaller molecules in waters draining into the Suwannee River from the Okefenokee Swamp. The Mn values of NOM, HPOA, and TPIA from this study again confirm the long-standing disagreement between Mn values that are determined by colligative and noncolligative methods. For example, the median value of Mn for 16 other samples of NOM, FA, and HA is also somewhat lower than those of comparable samples from a variety of environments when measurements were conducted using colligative methods. The VPO results are even more compelling considering the relatively high solution concentrations required for the measurements; the low molecular weights were observed despite conditions favorable to aggregation. Estimates of Mn from noncolligative methods for other samples are roughly a factor of two greater than results obtained in this study.
Footnotes
Acknowledgments
We thank the IHSS and Ball State University for providing financial support. We thank Dr. George Aiken of the U.S. Geological Survey and Dr. Patricia Maurice of the University of Notre Dame for kindly providing the HPOA and TPIA samples. Our appreciation also extends to Nelson Green for implementing the digital interface to the VPO instrument and to the reviewers for their insightful comments and suggestions that helped improve the article.
Author Disclosure Statement
No competing financial interests exist.
References
Supplementary Material
Please find the following supplemental material available below.
For Open Access articles published under a Creative Commons License, all supplemental material carries the same license as the article it is associated with.
For non-Open Access articles published, all supplemental material carries a non-exclusive license, and permission requests for re-use of supplemental material or any part of supplemental material shall be sent directly to the copyright owner as specified in the copyright notice associated with the article.
