
Abstract
Abstract
Photochemical properties of dissolved organic matter (DOM) are of interest due to their effects on natural and engineered systems, including the fate and transport of organic contaminants and pathogen inactivation. DOM absorbs energy and produces different reactive intermediates (RI), including the hydroxyl radical (HO·), singlet oxygen (1O2), and excited triplet states (3DOM*). Recently, a new set of DOM samples, including natural organic matter (NOM), the hydrophobic organic acid fraction (HPOA), and the transphilic acid fraction (TPIA) from the Suwannee River, were collected. Apparent quantum yields for the formation of HO·, 1O2, and 3DOM* were measured for DOM samples using a solar simulator. Values were 2.09–4.20×10⁻⁴ for triplet states, 2.74–6.54×10⁻² for singlet oxygen, and 0.95–1.65×10⁻⁵ for hydroxyl radical for the different samples. In addition, fluorescence quantum yields were measured with obtained values between 0.79–1.3×10⁻². In some cases, values obtained were different from older DOM samples, indicating potential changes in properties of DOM in the Suwannee River over time.
Introduction
D
The formation of these RI occurs through different mechanisms, all from the excited states of DOM. When a moiety in DOM absorbs light and enters an excited singlet state, it has the potential to follow different paths back to the ground state. The excited singlet can undergo internal conversion and return to the ground state through a nonradiative process. An excited singlet state can also return to the ground state by emitting a photon, which is called fluorescence. Alternatively, a fraction of the chromophores that were excited could also go through intersystem crossing and form 3DOM*. The excited triplet state could be quenched by molecular oxygen, which results in the formation of 1O2 (Zepp and others, 1977). The formation of HO· occurs through the photochemical reactions of DOM; however, the source of this radical is still under investigation (Vaughan and Blough, 1998; Pochon and others, 2002; Gan and others, 2008; Page and others, 2011). A proposed mechanism includes the formation of an excited triplet state from the absorbance of specific chromophores within DOM followed by a hydrogen abstraction from water to form HO·. The basis for this mechanism comes from studies examining the formation of HO· from organic compounds in aqueous systems (Ononye and others, 1986; Alegria and others, 1997; Alegria and others, 1999; Pochon and others, 2002; Gan and others, 2008). There is also evidence that HO· could be formed using a hydrogen peroxide-dependent pathway or through Fenton-like reactions (Vione and others, 2014).
The steady-state concentrations of these RI vary by many orders of magnitude, based on their general reactivity and selectivity toward reactions with organic and inorganic compounds. The concentrations of 1O2 in surface waters are on the order of 10−14–10−13 M (Haag and Hoigne, 1986; al Housari and others, 2010; Peterson and others, 2012). For HO·, the steady-state concentrations in surface waters vary from 10−15 to 10−18 M (Mopper and Zhou, 1990; Mostafa and Rosario-Ortiz, 2013). Although values for steady state (and formation rates) of RI are generally reported, a better characterization of the process is through the measurement of apparent quantum yields (Φa), which represent the overall efficiency by which these RI are formed. The values of Φa for 1O2 (ΦO2) are in the order of 0.0059–0.045, as reported for DOM samples and isolates obtained from the Suwannee River (Haag and others, 1984; Dalrymple and others, 2010; Mostafa and Rosario-Ortiz, 2013), whereas the values for HO· (ΦHO) are on the order of 3–4.6×10⁻⁵ for the same samples (Dong and Rosario-Ortiz, 2012). A study reported values for ΦHO that ranged from 1.1 to 3.0×10⁻⁴ for three bay waters and 7.5×10⁻⁵ for Suwannee River fulvic acid (SRFA) when irradiated at a wavelength of 320 nm under anaerobic conditions (Vaughan and Blough, 1998). The same study also examined SRFA at nine wavelengths in the range of 290–360, and the average ΦHO was 5.4×10⁻⁵. For 3DOM*, the values for the quantum yield (ΦTMP), measured by following the degradation of trimethylphenol (TMP) as a probe compound, were 0.000131 for Suwannee River DOM (Mostafa and others, 2014). It is worth noting that the values cited above are obtained mostly using polychromatic light with wavelengths above 290 nm. Other studies examining monochromatic radiation at 254 nm have shown slightly different values for the same RI and previously collected Suwannee River humic and fulvic acid isolates distributed by the International Humic Substances Society (IHSS) (Lester and others, 2013).
The purpose of this study was to quantify the quantum yields for the production of RI (HO·, 1O2, 3DOM) for three newly collected DOM samples that will be available through the IHSS. These reference materials include natural organic matter concentrated by reverse osmosis (NOM), a hydrophobic organic acid fraction isolated using XAD-8 resins (HPOA), and a transphilic fraction isolated using XAD-4 resin in series following XAD-8 resin (TPIA). In addition to quantifying RI production, fluorescence excitation emission matrices (EEMs) were recorded and used to calculate fluorescence quantum yields (ΦF) at different excitation wavelengths.
Experimental Protocols
Samples studied
All DOM samples were kindly provided by Patricia Maurice and were aliquots of the same material that will be distributed by the IHSS as the new Suwannee River reference and standard materials. Details of the collection and processing of these samples can be found in this issue (Green and others, 2014; Kuhn and others, 2014). The three DOM samples, which included NOM, HPOA, and TPIA, were prepared by dissolving ∼3 mg of the standards in 500 mL of 5 mM K2HPO4 buffer, adjusted to pH 7.2 using HCl (concentrated) or NaOH (5 M) and stored at 4°C until analysis.
Analytical methods
Dissolved organic carbon (DOC) measurements were conducted using a TOC-VCSH (Shimadzu Corp.) at the Kiowa Environmental Chemistry Laboratory in Boulder, CO. Size exclusion chromatography (SEC), used to assess apparent molecular weight (AMW), was performed using an Agilent 1200 series high performance liquid chromatograph with a Waters Protein-Pak™ 125 7.8×300 mm column (Milford) and an Agilent diode array detector that monitored UV absorbance at 254 nm. The mobile phase buffer consisted of 0.0024 M NaH2PO4, 0.0016 M Na2HPO4, and 0.025 M NaSO4 at a flow rate of 0.7 mL/min. An injection volume of 100 μL was used for all samples.
Solar exposures
The Oriel SOL1A solar simulator, which was used for all experiments to quantify RI (described below), was equipped with a 1,000 W xenon lamp accompanied by an Air Mass 1.5 filter. The system mimics the solar light spectrum with an intensity of approximately 71 W/m2 from 290 to 400 nm. The irradiance was measured using an Ocean Optics spectrophotometer. The samples were irradiated in capped headspace-free clear glass vials positioned on their side and chilled to 25°C±2°C throughout the experiments in a water bath that covered only the bottom half of the vials. Φa values for the solar simulator experiments were calculated from 290 to 400 nm because of the relative insignificance of the sum of Φ for wavelengths>400 nm observed elsewhere (Mostafa and Rosario-Ortiz, 2013). Significant photobleaching of the DOM samples over the solar simulator exposures (2–4 h) was not observed.
Measurement of optical properties
UV-Vis absorption of DOM was measured on a Varian Cary 100 Bio UV-Visible spectrophotometer using a quartz cuvette. Specific ultraviolet absorbance (SUVA254) values were determined by dividing the ultraviolet absorbance measured at a wavelength of 254 nm by the DOC concentration. SUVA254 is positively correlated with aromaticity and molecular weight, therefore providing insight into the composition of DOM (Chin and others, 1994; Weishaar and others, 2003). The E2:E3 ratio is calculated from the absorbance at 254 nm divided by that at 365 nm (Peuravuori and Pihlaja, 1997). This ratio has been used as a surrogate for molecular weight (Peuravuori and Pihlaja, 1997), the production efficiencies of RI (Dalrymple and others, 2010; Mostafa and others, 2014), and also for the extent of charge–transfer interactions, which are hypothesized to explain the tailing of the UV-Vis spectra of DOM (Del Vecchio and Blough, 2004).
Fluorescence EEMs were collected using a Horiba Jobin Yvon Fluoromax-4. EEMs were produced over an excitation wavelength range of 240–450 nm with an increment of 5 nm and an emission range of 300–700 nm with an increment of 2 nm in a 1-cm quartz cuvette. The excitation and emission bandpass was set to 5 nm. Fluorescence scans were collected in a signal/reference ratio mode with an integration time of 0.25 s. EEMs were corrected for instrument optics within the Fluoromax-4 software before data export. Using Matlab® software, corrections for inner-filter effects (Ohno, 2002), Raman normalization (Lawaetz and Stedmon, 2009) and blank subtraction were performed. The Raman area was calculated using a left-hand rectangle approximation at an excitation wavelength of 350 nm between emission wavelengths of 370 and 450 nm with the baseline area subtracted. Then, all data points in the instrument corrected EEM were divided by the calculated Raman area. An 18 MΩ-cm laboratory-grade water blank that was instrument corrected and collected with the same exact method as the samples was subtracted as the last step for correcting the fluorescence EEMs. Corrected spectra were smoothed to remove second-order scattering effects before quantum yield calculations.
All indices were calculated on corrected EEMs. The Fluorescence Index (FI), which describes DOM compositional differences (McKnight and others, 2001), was calculated as the ratio of the emission intensities at 470 nm and 520 nm at an excitation wavelength of 370 nm (Jaffe and others, 2008). A higher FI value (e.g., 1.8) indicates a blue-shifted emission spectrum that is lower in aromaticity and associated with microbial DOM. A lower value (e.g., 1.2) indicates a more red-shifted emission spectrum that is higher in aromaticity and associated with terrestrial, humic-rich material.
Fluorescence quantum yields (ΦF) were calculated according to fundamental literature (Birks, 1970; Valeur, 2002) using quinine sulfate (QS) as a reference according to Equation (1).
The integral terms in Equation (1) represent the integrated fluorescence intensity (I) at a single excitation wavelength (λex) across a range of emission wavelengths (λem) and determined using the trapezoid integration method. The quantum yield of QS (Φ QS ) in 0.1 N H2SO4 is well characterized as being equal to 0.51 (Velapoldi and Mielenz, 1980). For each excitation wavelength, the DOM quantum yields were calculated with respect to the fluorescence (IQS) and absorbance (AQS) of quinine sulfate at an excitation of 350 nm. This assumption is valid since the fluorescence spectra are corrected across excitation wavelengths (Valeur, 2002) and this assumption was validated on this instrument. Quinine sulfate EEMs were measured on the same day using the same method as DOM EEMs. A low quinine sulfate concentration (6.39×10⁻⁸ M in 0.1 N H2SO4) was used, so that the fluorescence signal was within the linear range of the signal detector, because signal attenuation and distortion can occur beyond this range. At this concentration, it is difficult to get a smooth UV-Vis spectrum due to instrument noise, even using a 5-cm pathlength cuvette. A working 1.28×10⁻⁶ M quinine sulfate solution was measured in a 1 cm cell in triplicate, and a 6.39×10⁻⁸ M solution was measured in a 5-cm cuvette with eight replicates. Of the eight replicates, the highest and lowest samples were excluded, and the six retained measurements were used in the calculation. The calculated average molar absorptivity (ɛ) for both concentrations at 347 nm was confirmed to be within 1% and 8%, respectively, of the National Institute of Science and Technology (NIST) values (Velapoldi and Mielenz, 1980). The error bars presented represent the propagated error of all four measures (two fluorescence and two absorbance). An example calculation is provided in the Supplementary Data.
RI measurements (HO·, 1O2, 3DOM*) and calculation of apparent quantum yields
Furfuryl alcohol (FFA) was used as a chemical probe to measure the formation of 1O2. FFA was added to the samples at an initial concentration of 22.5 μM along with methanol (0.1 M) to quench HO·. Probe concentrations were monitored after light exposure using liquid chromatography (Agilent, 1200 LC). Plotting ln[FFA]/[FFA0] versus irradiation time generates a straight line as expected from a pseudo-first-order reaction rate (with 1O2 at steady state). The slope obtained is divided by the second-order reaction rate constant between 1O2 and FFA of 1.2×10⁸ M/s to obtain the [1O2]SS. To calculate the quantum yield, Equation (2) is used.
In this equation, ka is the specific light absorbance [calculated using Eq. (3) for λ=290–400 nm] of the water matrix (assumed to be dominated by OM), S represents a photosensitizing molecule with a singlet oxygen quantum yield of Φ
SO
, kx represents the reaction rate between singlet oxygen and any species X present in the water matrix (including but not limited to DOM), and kd is the rate of decay of oxygen back to its ground (triplet) state due to physical quenching without undergoing a reaction. In the case of 1O2, the overall decay is dominated by physical quenching by the solvent, that is, water (kd,H2O=2.5×10⁵ s−1), and the physical or chemical quenching due to OM or other species can typically be ignored at environmentally relevant concentrations. The expression for the specific rate of light absorption, ka (for a solution with only one chromophore-DOM), is shown in Equation (3).
In this expression,
The HO· formation rate was measured with the hydroxylation of benzene (99.8% Alpha Aesar) to phenol, with an assumed average yield of 0.85 (Dong and Rosario-Ortiz, 2012). DOM samples were spiked with 3 mM benzene. Dark controls and time zero samples were collected, but no detectable phenol was produced. Previous work by Dong and Rosario-Ortiz (2012) has shown that the scavenging potential of DOM as compared to benzene is two orders of magnitude smaller; therefore, benzene is the main scavenger in the system. To eliminate the potential formation of HO· through a hydrogen peroxide-dependent pathway, bovine liver catalase (Sigma-Aldrich) was added at a concentration of 20 U/mL to quench the formation of hydrogen peroxide. One unit of catalase will decompose 1.0 μM of hydrogen peroxide to oxygen and water per minute at pH 7.0 at 25°C at a substrate concentration of 50 mM hydrogen peroxide. From the formation rate of HO· (RHO), the value for the quantum yield (ΦO2) can be calculated as shown in Equation (4).
In this expression, ka is given by Equation (3) and RHO· is derived from the change in phenol concentration over light exposure time with an efficiency of 85% (Dong and Rosario-Ortiz, 2012).
TMP was used as a probe to assess the formation of DOM excited triplet states (Canonica and Freiburghaus, 2001; Richard and others, 2004; Cawley and others, 2009; Golanoski and others, 2012). TMP was spiked into buffered DOM solutions from an initial concentration of 3.67 μM. In the case of TMP, the analysis was similar to that of FFA degradation, where pseudo-first-order kinetics are assumed and the degradation rate, kTMP, represents the slope of the linear regression curve of ln[TMP]/[TMP]0 versus irradiation time. Quantum yields for TMP degradation (ΦTMP, indicative of 3DOM* formation) were calculated based on the ratio of TMP degraded, divided by the total number of photons absorbed per unit time over the wavelength range of the polychromatic light source used in this study (λ=290–400 nm) using Equation (4) and a kTMP based on the first-order degradation of TMP calculated for each SR sample (Canonica and others, 1995).
Phenol, FFA, and TMP were measured using an Agilent 1200 series high performance liquid chromatography (HPLC) with a C18 XDB column and online ultraviolet (UV) detection. The HPLC-UV methods have been published previously and are available online in the Agilent Chromatography library (Trenholm and others, 2008). Photochemical experiments were run in triplicate and the error bars presented in the figures below represent the propagated error of the replicates.
Results and Discussion
Characterization of samples
Optical properties and concentration of carbon and nitrogen of the three Suwannee River solutions in the PO4 buffer are summarized in Table 1. The SUVA254 values (units of L/[cm·mgc]) for HPOA (5.55), NOM (3.92), and TPIA (2.28) indicate that the HPOA and NOM samples have higher aromaticity than the TPIA sample. These results are consistent with the expected sorption of different DOM components by the resins (Aiken and others, 1992). The XAD-8 resin used to isolate the HPOA fraction preferentially sorbs the most hydrophobic fraction of the DOM, which is likely to be more aromatic (Aiken and others, 1992). The E2:E3 ratio for TPIA (5.99) was higher than for either the NOM (4.56) or HPOA (4.2). The E2:E3 ratio of TPIA reported here is similar to the smallest molecular weight fraction of an ultrafiltered Suwannee River NOM sample, while the NOM and HPOA E2:E3 ratios are more similar to the bulk SRNOM and midmolecular weight size fraction (Mostafa and others, 2014). This suggests that TPIA is less aromatic and of a lower molecular weight, which is a common characteristic of samples isolated using this method (Aiken and others, 1992).
FI values follow the opposite trend as SUVA254, with TPIA having the highest FI (1.39) and HPOA and NOM having a lower FI (1.28 and 1.29, respectively). This lower FI for HPOA and NOM indicates a more red-shifted spectrum (McKnight and others, 2001). This is consistent with the chemical processes used to isolate the organic matter and highlights that DOM fractionation methods do have a large bearing on the chemical quality of the samples. In addition, it highlights the highly terrestrial nature of the material in the Suwannee River water.
In addition to optical properties, the results from the SEC show that there are differences in the AMW distribution of the Suwannee River samples. Although all three SEC chromatograms show two overlapping peaks, NOM had a higher UV absorbance at a shorter retention time peak (larger AMW) compared to HPOA and TPIA, which had higher intensities at the longer retention time peak (smaller AMW) (Fig. 1). The chromatogram for the TPIA fraction is shifted to longer retention times indicating molecules with lower AMW compared to NOM or HPOA (Fig. 1). It is likely that the samples, especially NOM, may contain some nonchromophoric organic matter that was not detected using this method. Therefore, we do not have information on the AMW distribution of the nonchromophoric organic matter fraction.

Size exclusion chromatograms plotted versus retention time, where longer retention times correspond to lower molecular weight compounds being detected at a UV absorbance of 254 nm.
The fluorescence EEMs for all three samples are dominated by humic substance-like peaks in the A and C region, consistent with the high SUVA254 values (Coble, 1996) (Fig. 2). There was no discernable protein or polyphenolic-like peak (B or T) in any of the EEMs. TPIA also had the highest fluorescence quantum yield (0.0127±0.00053) compared to NOM (0.0086±0.00042) and HPOA (0.00791±0.00032), which were similar (Table 2 and Fig. 3). The ΦF value for the SRNOM has been previously measured for samples collected from the Suwannee River (Del Vecchio and Blough, 2004; Korak and others, 2014; Mostafa and others, 2014), but it is difficult to compare these values to previous ones due to different methods for the calculations.
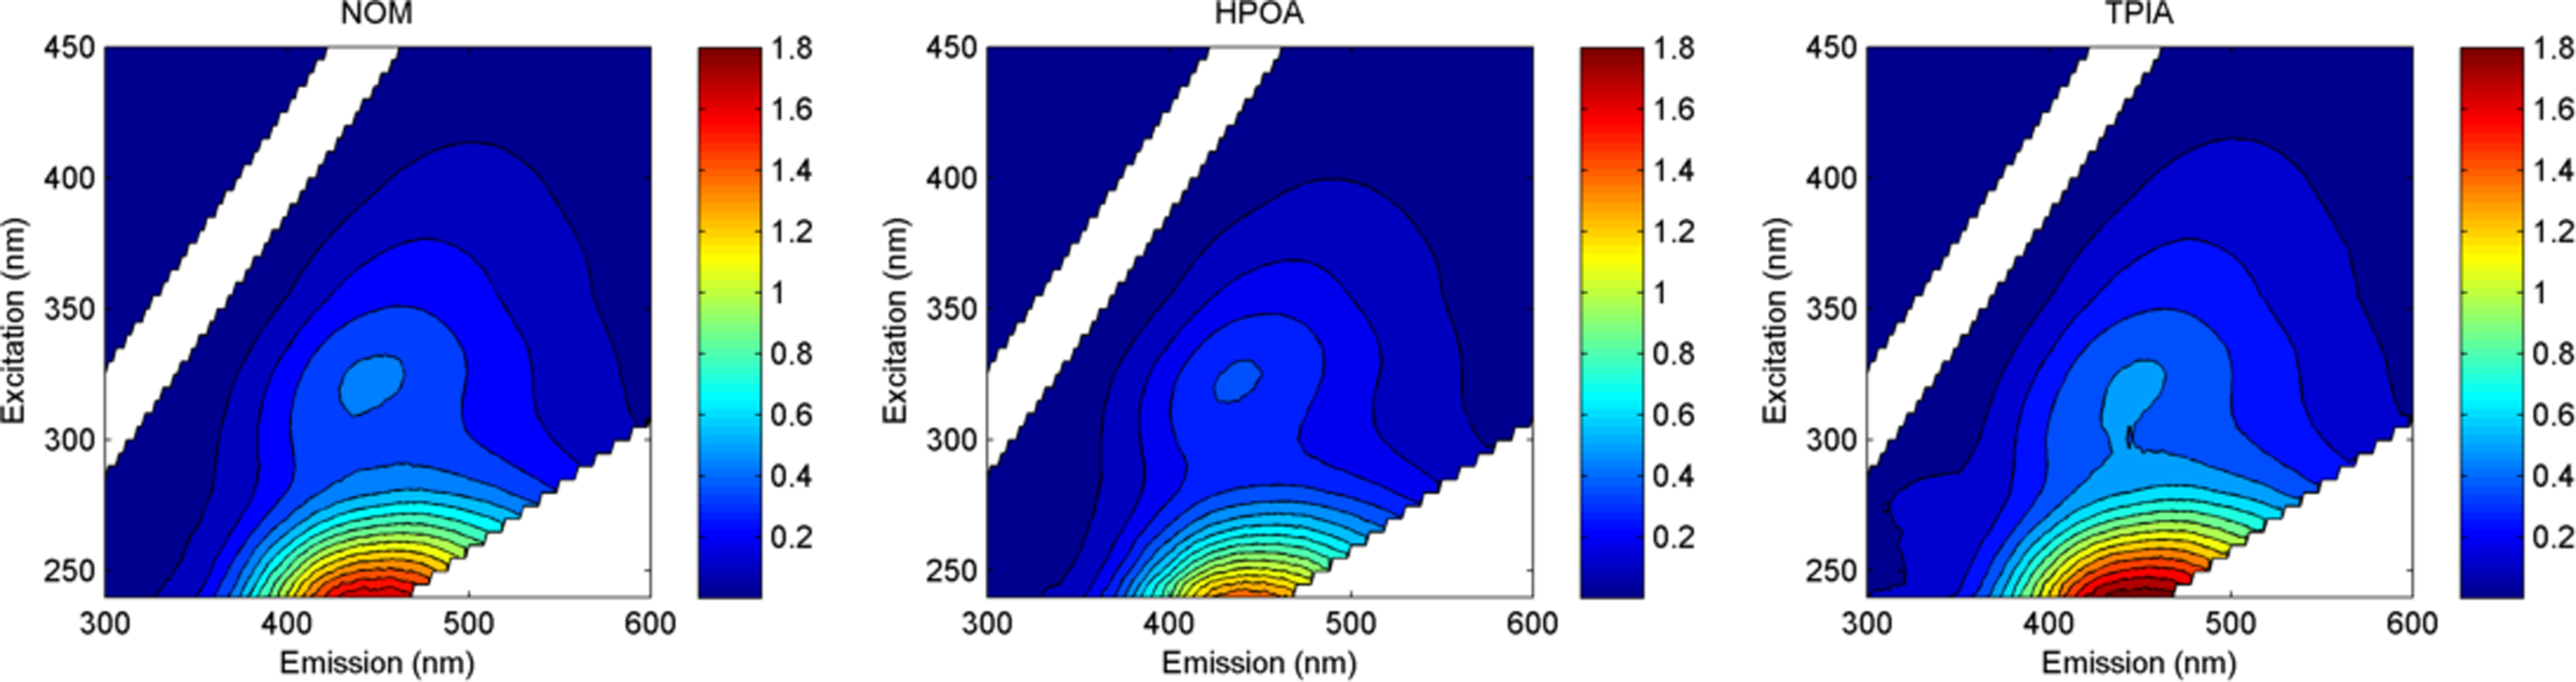
Excitation emission matrices (EEMs) for the three Suwannee River samples. Excitation wavelength is plotted on the y-axis and emission wavelength is plotted on the x-axis.

Fluorescence quantum yields as a function of excitation wavelength.
The similarities between the NOM and HPOA samples are likely due to an overlap in the compounds isolated by each method. The HPOA fraction represents 60% of the total DOC in the Suwannee River water (Kuhn and others, 2014). NOM contains >90% of the total Suwannee River DOC. However, the TPIA fraction only accounts for 18% of the Suwannee River DOC (Kuhn and others, 2014).
Quantum yields for RI
The degradation of TMP allows for a quantum yield estimation for the formation of 3DOM*. The ΦTMP for TPIA was measured as 4.2×10⁻⁴. This value was nearly double that of HPOA or NOM, which were 2.09 and 2.61×10⁻⁴, respectively (Table 2). Previous work on the quantification of ΦTMP for DOM samples from the Suwannee River (Sample 1R101N) had measured a value of 1.31×10⁻⁴ for the bulk sample, which increased to 2.84×10⁻⁴ for the fraction of the material with AMW less than 1 kDa (Mostafa and others, 2014).
In the case of 1O2, the measured quantum yields followed a similar trend as those for ΦTMP. The values of Φ1O2 were 6.54×10⁻², 2.74×10⁻², and 2.87×10⁻² for the TPIA, HPOA, and NOM, respectively. The higher E2:E3 ratio of TPIA is consistent with the higher singlet oxygen yields reported for this fraction. This trend of increasing E2:E3 with increasing singlet oxygen formation has also been reported for wastewater samples (Mostafa and Rosario-Ortiz, 2013).
Last, in the case of the quantum yield for the formation of HO·, the values for ΦHO also followed the same trend observed for the other RI. The values of ΦHO for the different samples were 1.65×10⁻⁵, 0.95×10⁻⁵, and 1.25×10⁻⁵ for the TPIA, HPOA, and NOM samples, respectively. In the case of both 1O2 and HO·, the values for the respective quantum yields obtained for the samples used in this study were different when compared to previous collections at the Suwannee River (Dong and Rosario-Ortiz, 2012; Mostafa and Rosario-Ortiz, 2013). The value for 1O2 was higher, whereas the value for HO· was lower. Taken together, these results indicate differences in the photochemical properties of the current samples compared to previous DOM samples collected and isolated from the Suwannee River.
Footnotes
Acknowledgments
The authors acknowledge Simon Mostafa and Sarah Almutlaq for assistance with 1O2 formation and TMP degradation experiments and Garrett McKay and Caitlin Glover for relevant input during the preparation of this manuscript. The authors gratefully acknowledge support from the National Science Foundation (CBET #1235288).
Author Disclosure Statement
No competing financial interests exist.
References
Supplementary Material
Please find the following supplemental material available below.
For Open Access articles published under a Creative Commons License, all supplemental material carries the same license as the article it is associated with.
For non-Open Access articles published, all supplemental material carries a non-exclusive license, and permission requests for re-use of supplemental material or any part of supplemental material shall be sent directly to the copyright owner as specified in the copyright notice associated with the article.