
Abstract
Abstract
The combined technology of electrokinetic (EK)-assisted bioremediation was used on field soil from a Beijing Coking Plant in China to assess its feasibility in remediating field soils. Total polycyclic aromatic hydrocarbon (PAH) concentration in the soil was 91.4 mg/kg, with a high level of high-molecular-weight PAHs. During 200 days of EK-assisted bioremediation, neutral soil pH was maintained by periodically changing the direction of the electronic field. Electrical conductivity of the soil in the EK cell was higher than that in the control soil. Meanwhile, ammonium and phosphate could be effectively injected into the soil by the electric field. Degradation rates of all 16 U.S. Environmental Protection Agency (EPA) priority PAHs at different sampling positions in the EK cell were twice as high as those in the control soil. The number of PAH degraders in the EK cell was enhanced compared to those in the control at the end of the experiment. Polymerase chain reaction–denaturing gradient gel electrophoresis (PCR-DGGE) results indicated that the soils sampled near the electrodes in the EK cell showed relatively greater biodiversity compared to those in the control system. Hence, the present study provides a promising bioremediation technology for remediation of soils contaminated by PAHs.
Introduction
B
Electrokinetic (EK) technology was developed for the cleanup of contamination in low-permeability soils or heterogeneous soils containing low-permeability zones (Ho et al., 1997). Hydrophobic organic contaminants, such as PAHs, can also move under a direct electric field by the process of electroosmosis, in which they are incorporated in soil water that has a positive charge due to the negative charge on the surface of soil particles (Ko et al., 2000; Li et al., 2009; Xu et al., 2010). Thus, bioavailability of PAHs in soil was significantly elevated, which would promote the degradation of PAHs in soil. Moreover, EK also has the capacity to assist in the introduction of charged nutrients, electron acceptors, and even the active organisms by a process called electrophoresis, enhancing the degradation rate of PAHs in soil. Hence, EK provided a solution to the critical problem limiting the efficiency of PAH bioremediation.
The above features make EK a good technique to combine with bioremediation. An increasing number of studies have been conducted on the EK-assisted bioremediation (EKAB) of soils contaminated with organic pollutants that has included the following aspects: EK injection of nutrients, surfactants, and electron acceptors, EK transport of microorganisms, and the selection and optimization of different electric field patterns (Ko et al., 2000; Lear et al., 2004; Wick et al., 2004; Luo et al., 2006; Niqui-Arroyo and Ortega-Calvo, 2007; Park et al., 2007; Li et al., 2010). In these studies, it was found that the EK injection of nutrients and microorganisms can enhance PAH remediation efficiency. EK injection of surfactants/cosolvents increased the removal of PAHs (Saichek and Reddy, 2004, 2005; Khodadoust et al., 2005; Maturi and Reddy, 2006; Park et al., 2007; Yeung and Gu, 2011).
However, the combined technology still presents a series of problems. Foremost, pH values change significantly during EK remediation due to the electrolysis of water molecules around the electrodes (Chandrasekhar and Venkata Mohan, 2012; Xu et al., 2012). The pH is a crucial parameter for the growth of microorganisms. Second, charged nutrients move in one direction to accumulate at the electrode with the opposite charge, which leads to an uneven distribution of microorganisms (Gill et al., 2014; Schmidt et al., 2007). Furthermore, the impact of EK processes on the growth and biodiversity of the active microorganisms has not been assessed well (Lear et al., 2004; Wick et al., 2004; Luo et al., 2006; Niqui-Arroyo and Ortega-Calvo, 2007; Park et al., 2007). The activity of microorganisms or a specific active microorganism species is an unavoidable parameter in biodegradation studies, but the available information on biodiversity reveals a change in the soil's microbial population.
To further develop EKAB technology for the remediation of actual field-contaminated soil and the mechanisms behind this remediation, we carried out a 200-day remediation test on field soil from the Beijing Coking Plant using a new EKAB technology. This EKAB technology incorporates pH controlling, microbial remediation, and the EK injection of nutrients and cosolvents. In the study, we used Lasiodiplodia theobromae, a new microorganism species with a high capacity to degrade high-molecular-weight PAHs that had been screened from contaminated soil of the Beijing Coking Plant (Fan et al., 2015), for the EKAB technology. The activity of PAH degraders was selectively enumerated in the soil. Soil bacterial diversity after EKAB was also elucidated by polymerase chain reaction–denaturing gradient gel electrophoresis (PCR-DGGE).
Materials and Methods
Tested soil and materials
The soil tested was obtained from the Beijing Coking Plant, China. All of the soil was air dried, passed through a 1-mm mesh sieve to remove gravel, and thoroughly mixed. Several physicochemical properties of the soil were determined according to the Chinese standard methods (Liu et al., 1996a). Briefly, pH was measured in a 1:2.5 (w/w) soil-CaCl2 water suspension. Electrical conductivity (EC) was measured with a conductivity meter in a 1:5 (w/w) soil-deionized water suspension. The organic matter content was determined by the potassium dichromate external heating method. Particle size distribution was determined by a particle size analyzer (BT-90; Dandong Bettersize Instrument Ltd., Dandong City, Liaoning Province, China). Soil texture was sandy loam with the following composition: 63.5% sand, 34.2% silt, and 23.8% clay. Soil pH and EC were 7.95 and 129 μs/cm, respectively, and the organic carbon content was 1.03%.
A mixture of 16 U.S. Environmental Protection Agency (EPA) priority PAH stock standards [naphthalene (Nap), acenaphthene (Ace), acenaphthylene (Acy), fluorine (Fl), phenanthrene (Phe), anthracene (Ant), fluoranthene (Flu), pyrene (Pyr), benz[a]anthracene (BaA), chrysene (Chr), benzo[b]fluoranthene (BbF), benzo[k]fluoranthene (BkF), benzo[a]pyrene (BaP), dibenzo[a,h]anthracene (DBA), indeno[1,2,3-cd]pyrene (INP), and benzo[ghi]perylene (BgP)] were purchased from J&K Chemical. A mixture of internal standards (naphthalene-d8, acenaphthene-d10, phenanthrene-d10, chrysene-d12, and perylene-d12) was obtained from J&K Chemical. Hydroxypropyl-β-cyclodextrin (HPCD) was purchased from the Deli Biochemical Industry Company. Hexane and dichloromethane were of HPLC grade (Baker). Other reagents were of analytic grade.
Microorganism
L. theobromae was isolated from the contaminated soils of the Beijing Coking Plant in a previous study (Liu et al., 2011). The isolation method and morphology of the species can be found in the Supplementary Data and Supplementary Fig. S1. The strain obtained was maintained at 4°C in a refrigerator and subcultured every month on potato dextrose agar slants during storage. Since it was difficult for PAHs from the field historically contaminated soil to be degraded, L. theobromae, with an efficient ability to degrade PAHs, was induced into the electrolyte solution to coordinate soil native microorganisms to degrade PAHs together.
EK test setup
The experiment was conducted in a cylindrical polyvinyl chloride reactor (750 mm long and 300 mm in diameter). As shown in Fig. 1, the test setup was made up of independent cells. Each cell could work independently, and more cells could be connected in series to work together. During the experiment, one cell was used as the representativeness of the test.
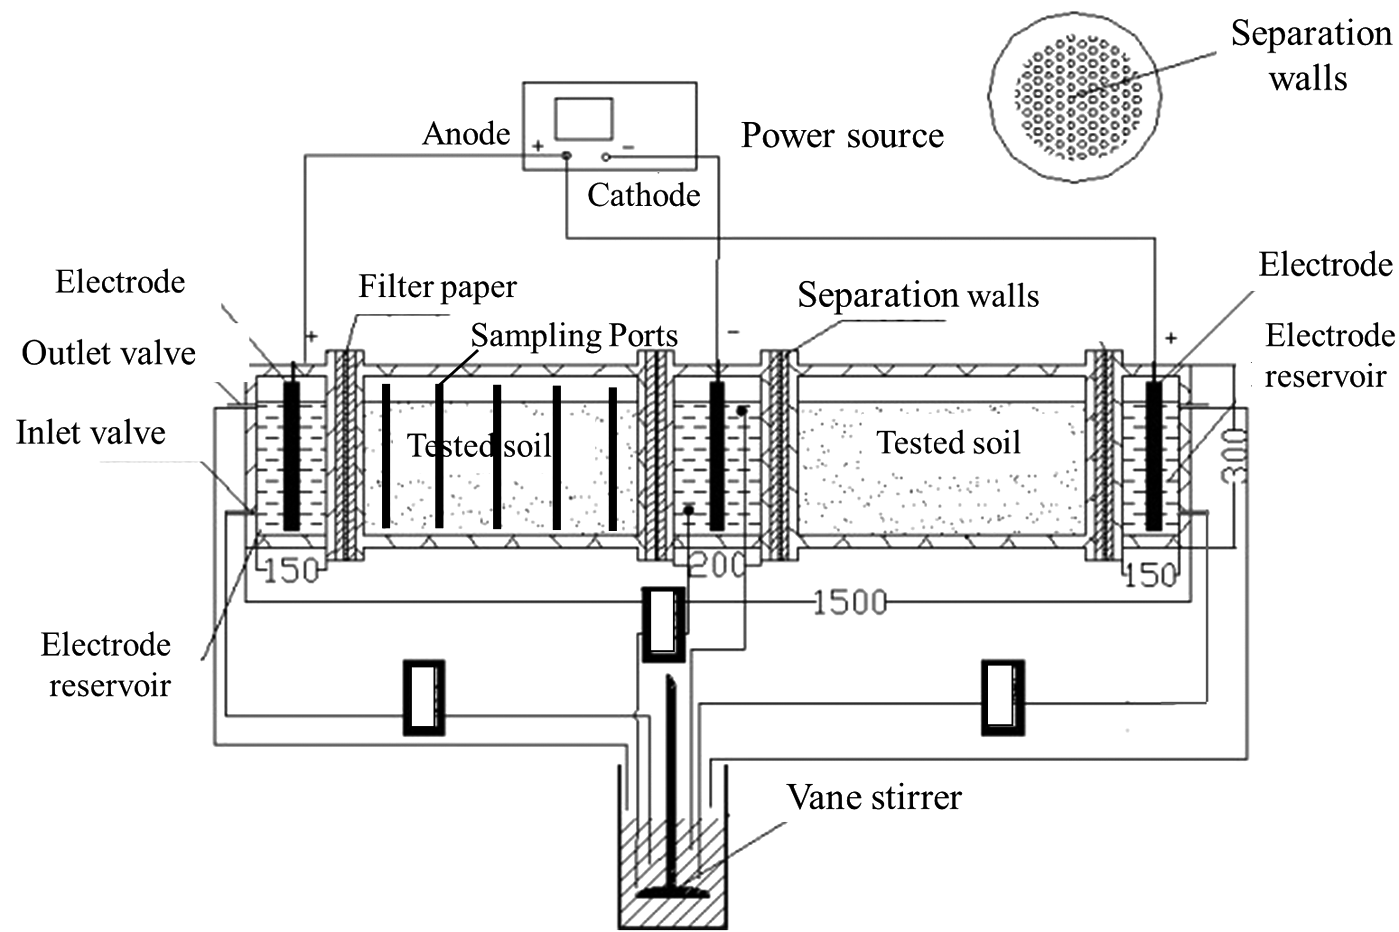
Schematic view of the laboratory electrokinetic (EK) apparatus. Values in units of mm.
Two sets of testing systems, an EK-assisted bioremediation system and a control system (CK), were studied. The EK test cell consisted of a soil cell, two electrode compartments, an electrode reservoir, a solution circulation system, and a power source. Separation walls with pores (5-mm pore size) and filter paper adhered to these porous walls were placed between the electrode compartments and the soil cell to prevent soil particle leakage from cell to compartment. The electrodes (graphite plates of 10-mm thickness and 260-mm diameter) were connected to a direct current power supply (WYK 5010B2; Yangzhou Dongfang Group Company). Gas vents in the electrode compartments allowed gases generated by electrolysis reactions to escape. Electrolyte was recirculated to the electrode reservoirs with a peristaltic pump (BT00-300T; Baoding Lange Peristaltic Pump Company) to avoid pH changes in the electrode compartments. The outlet valves in the electrode compartments kept the water table at a constant height throughout the experiment. The electrolytes were well mixed in the reservoir with a vane stirrer (SGJ90; Shanghai Shanggui Company).
The control system had the same setup as the EK system, but without the electrodes and electric source.
Experimental procedure
Soil was placed in the soil cell in layers and compacted uniformly. Electrolyte was added to both electrode compartments with a peristaltic pump. The soil was then allowed to settle for 1 week. A small fraction of soil was collected to determine the initial PAH content before the EK test was conducted.
The mineral salts medium (MSM), which was often used as base nutrient of microorganism, was prepared according to Tao et al. (2007). Preparation of microorganism suspension was described in our previous study (Wang et al., 2009). Then, microorganism suspension and HPCD (1 g/L) were added into the MSM and the mixture was used as electrolytes. During the study, electrolyte was replenished once every week. A constant voltage gradient of 1.0 V/cm was applied to the cell. During the experiment, the anode and cathode of the power source were reversed manually periodically. Specifically, it was reversed every 12 h in the first 30 days to improve nutrient injection and then every 2 days for better injection of microorganisms.
Five sampling points were evenly distributed along the middle line of the soil cell from anode to cathode (Fig. 1), marked as Sample 1–5. Samples were collected by perpendicularly inserting a slim tubular sampler (diameter 0.8 cm) at the predetermined sites. After the samples were collected, the sampling sites were carefully smoothed to minimize the disturbance. The experiment lasted for 200 days at room temperature. The EK test was run without interruption except during sampling and electrolyte renewal. Soil samples were collected at 3, 5, 10, 20, 30, 45, 60, 100, 150, and 200 days. Soil samples were divided into two parts. One part was dried using a vacuum freeze drier (ALPHR1-2 LD; Martin Christ Gefriertrocknunsanlagen GmbH) for the analysis of PAHs and physicochemical properties. The other parts were stored in a refrigerator for most-probable-number (MPN) procedure and DNA extraction. According to the previous study, the soil pH changed rapidly during EK process. The samples in the early days were obtained mainly to monitor the pH change in soil.
Experimental procedures for the control system were the same as in the EK system, except for the electric field.
Analysis of selected soil physicochemical properties
Then, the samples were ground and passed through an 80-mesh screen (Zhejiang Huafeng Hardware Instrument Corporation). Soil pH and EC were determined by the methods briefly described above. Soil-extracted ammonium and phosphate concentrations were also analyzed.
Analysis of extractable soil ammonium followed the methods of Xu et al. (2010) with minor modifications. The ammonium in electrolytes was determined by the Nessler's reagent colorimetric method (Liu et al., 1996). Distilled water was used as the control. The available phosphate in soil and phosphate in electrolytes were determined using the Mo-Sb colorimetric method (Liu et al., 1996). All analyses were conducted in triplicate, and the results are presented as the average of the triplicates.
Extraction and analysis of PAHs
PAHs analytical method was conducted according to Yu et al. (2009). Soil samples were freeze dried, ground, and meshed. The internal standard mixture was then added to the soil, and the soil was subjected to Soxhlet extraction for 48 h with dichloromethane after mixing with an equal quantity of anhydrous sodium sulfate. The total extract was concentrated to near dryness under a gentle stream of nitrogen and redissolved in 1 mL of hexane. Concentrated extracts were purified by passing through a multilayer silica–alumina column (i. d. 1.0 cm) filled with neutral silica (12 cm), alumina (6 cm), and anhydrous sodium sulfate (1 cm) from bottom to top. The column was eluted sequentially with 20 mL of hexane and 75 mL of dichloromethane/hexane (v/v = 3/7). PAHs were eluted in the second fraction, which were concentrated to 1 mL by rotary evaporation followed by a gentle stream of nitrogen.
The samples were analyzed on an Agilent 6890 series gas chromatograph coupled to an Agilent 5975 mass spectrometer (Agilent) with helium as the carrier gas at a constant flow rate of 1 mL/min. PAHs were analyzed in selected ion monitoring mode. The GC column was a 30 m × 0.25 mm i. d. × 0.25 μm TR5-MS capillary column (Thermo Scientific). One microliter of the sample was injected with splitless injection. The initial GC oven temperature was held at 70°C, increased to 260°C at 10°C/min, held for 2 min, increased to 300°C at 10°C/min, and held for 5 min. The injector and detector temperatures were maintained at 280 and 300°C, respectively. The ion source temperature was 250°C, and the electron impact energy was set to 70 eV. All analyses were conducted in triplicate, and the results are presented as the average of the triplicates plus and minus the standard error of the mean.
MPN procedure
A modified MPN procedure was used to selectively enumerate PAH degraders. The MPN method was carried out according to the study by Wrenn and Venosa (1996) with minor modifications. PAH degraders were enumerated in separate 96-well microtiter plates. A mixture of four PAHs (10 g phenanthrene/L, 1 g anthracene/L, 1 g fluorene/L, and 1 g dibenzothiophene/L) was used as the selective growth substrate. The PAH substrate mixture was added to the microtiter plates as a solution in pentane (10 μL/well). PAHs were deposited on the surfaces inside each well after the pentane evaporated rapidly. Then, the plates were filled with the Bushnell–Haas (B–H) medium (Bushnell and Haas, 1941) supplemented with 2% NaCl as the growth medium (180 μL/well).
Samples were diluted in a saline buffer solution that contained 0.1% sodium pyrophosphate (pH 7.5) and 2% NaCl. A five-tube MPN dilution series with nine dilutions (10−1 to 10−9) were used for each tube. We inoculated 96-well plates by adding 20 μL of each dilution to 1 of the 12 rows of the five wells. The first row of each plate was inoculated with 20 μL of undiluted sample, and row 12 remained uninoculated to serve as a sterile control. PAH-degrader plates were incubated for 3 weeks before 50 μL of iodonitrotetrazolium violet (INT, 3 g/L) was used to identify the positive wells. In positive wells, INT was reduced to an insoluble formazan that deposited as a red precipitate. Positive wells were scored after an overnight room-temperature incubation with INT. The MPN value was determined with an MPN method (ISO, 1991).
Community analysis
DNA extraction
Total community DNA was extracted from 250 mg of the soil samples using the Omega DNA Extraction Kit (OmegaBiotek) following the manufacturer's instructions.
PCR amplification
Partial 16S rRNA genes were amplified from the extracted genomic DNA by PCR using a PTC thermal cycler (Bio-Rad Laboratories). The variable V3 region of the domain bacteria was amplified using the primers P63F and R1378r (Garbeva et al., 2003) with a GC clamp attached to the forward primer. PCR amplification was performed as follows: initial denaturation at 94°C for 5 min; 94°C for 1 min, 65°C for 1 min, 72°C for 1 min, followed by 10 times of the same cycle with every cycle at a 1°C lower annealing temperature; 25 cycles of 94°C for 1 min, 55°C for 1 min, and 72°C for 1 min; and finally 72°C for 7 min.
For DGGE analysis, the product of the first PCR reaction was diluted by a ratio of 1:100 and used as a template for a second PCR based on the bacterial GC-P338F and P518r primers (LaPara et al., 2002). The program used for the second PCR was the same as the first. PCR samples were then stored at 4°C until further processing.
DGGE analysis
DGGE was performed on 8% polyacrylamide gels (acrylamide: bisacrylamide, 37.5/1) with a gradient of 30–60% denaturants (100% denaturant was defined as 7 mol urea and 40% formamide). The gels were run at 60°C (140 V) for 4 h in a Dcode Universal Mutation Detection System (Bio-Rad Laboratories). After staining with ethidium bromide in 1× TAE for 45 min, the gels were visualized under UV illumination and photographed. DGGE banding patterns were digitized and subsequently processed using the Quantity one image analysis software (version 4.3.1; Bio-Rad Laboratories).
Results and Discussion
Concentration of PAHs in soil
Supplementary Figure S2 shows the concentrations of 16 priority PAHs in the soil of the Beijing Coking Plant, China. The total concentration of the 16 U.S. EPA priority PAHs was 91.4 mg/kg. According to the criteria suggested by Maliszewska-Kordybach (1996), the soil used in this test is heavily contaminated soil. Besides, the 4–6 ring PAHs represented ∼75% of the total PAHs. It is notable that the 4–6 ring PAHs are carcinogenic, which implies that the soil from the Beijing Coking Plant exhibits a high risk. Remediation for this historically contaminated soil is extremely necessary.
Variation in soil physicochemical properties
Variation in soil pH, EC, and nutrients during the EKAB was measured.
Variation in pH
Soil pH was controlled by circulation of the mixed electrolyte solution and reversal of electrode polarity in this study. Supplementary Figure S3 shows that no significant changes in soil pH were observed during the 200 days of EK bioremediation, and all values were close to neutral. Soil pH varied within a very narrow range (7.5–8.3) at the five sampling sites during remediation. The highest pH (8.3) was observed at Site 1 on day 150 and was within the suitable pH range for the growth of L. theobromae. These observations indicate that the circulation of electrolyte could effectively control soil pH in the cell. Previous studies have shown that the application of EKs induces a pH gradient across the bioreactor cell due to water electrolysis reactions that produce protons at the anode and hydroxyl ions at the cathode (Zhou et al., 2005; Li et al., 2009). Soil pH is a crucial parameter for nutrient bioavailability and soil microbial growth (Lear et al., 2004). The majority of soil microbes prefer a neutral pH (Saichek and Reddy, 2004), and it was found that the soil microbial community and its activity were significantly affected by the low pH generated by the EK process. It was also reported that a change in soil pH may also affect the transport of microorganisms and the injection of nutrients (Rhoades et al., 1989; DeFlaun and Condee, 1997). Therefore, maintaining a neutral pH is essential to the success of the combination of EK with bioremediation.
Variation in EC
Soil EC is related to the surface charges of the soil mineral particles and ion concentrations in the soil solution (Rhoades et al., 1989). Hence, the change in soil EC could, to a certain degree, reflect the efficiency of nutrient injection. Figure 2 shows that the soil EC significantly changed on the 5th day of EKAB. Overall, soil EC values both in the EK cell and CK group increased over the 200-day remediation. The increase in soil EC in the CK group may have been induced by the diffusion of mineral salts from the electrolyte solution into the soil. On day 200, the ECs of the soil in both the EK and CK cells were evenly distributed. The soil EC varied from 266 to 273 μs/cm and 224 to 240 μs/cm in the EK and CK cells, respectively. The soil EC values in the EK cell were ∼10% higher than those in the CK cell (p < 0.05). The additional increase in soil EC in the EK group was likely related to the reinforcement of pore fluid ionic strength as a result of soil mineral dissolution and ion mobilization from the electrolytes through electromigration and/or electroosmosis. Hence, it is reasonable to conclude that significant amounts of ions were driven into the soil cell by EK processes in the EK cell, and a more remarkable enhancement in field applications can be expected because the mass transfer resistance in the control cell in this study was very limited due to the small size of the cell.

Soil electrical conductivity values for the EK-assisted bioremediation and control (CK) cells during remediation. The five sampling sites were evenly distributed from the anode to the cathode.
Injection of nutrients
The removal rate of organic contaminants in soil by biodegradation depends on the activities of microbes, which, in turn, depend on nutrients and the concentration of terminal electron acceptors (Kim and Han, 2003). Therefore, ammonium and available phosphate concentration in tested soil were monitored as an auxiliary indicator for microbe activities. According to a previous study, the addition of nutrients to the soil could accelerate the biodegradation process (Pelaez et al., 2013; Zhang et al., 2014). The soil used in this study was nutrient deficient for microbes. Thus, MSM was injected into soil to supply mineral salts using EK injection in this study, which provided nutrients for the microorganisms. Figure 3 shows that ammonium concentrations in the soil of both the EK and CK groups increased in the initial stage of EKAB and then slowly decreased after the 10th day. Soil ammonium concentration increased again when the electrolyte was renewed. This was conducted on the 30th day when we found that the extracted ammonium concentration had dropped below the initial concentration. The loss of ammonium during EK-combined remediation has not been reported before. This was presumably ascribed to the nitrification of microorganisms and electrolysis in the EK cell, which can be described by the equation below:
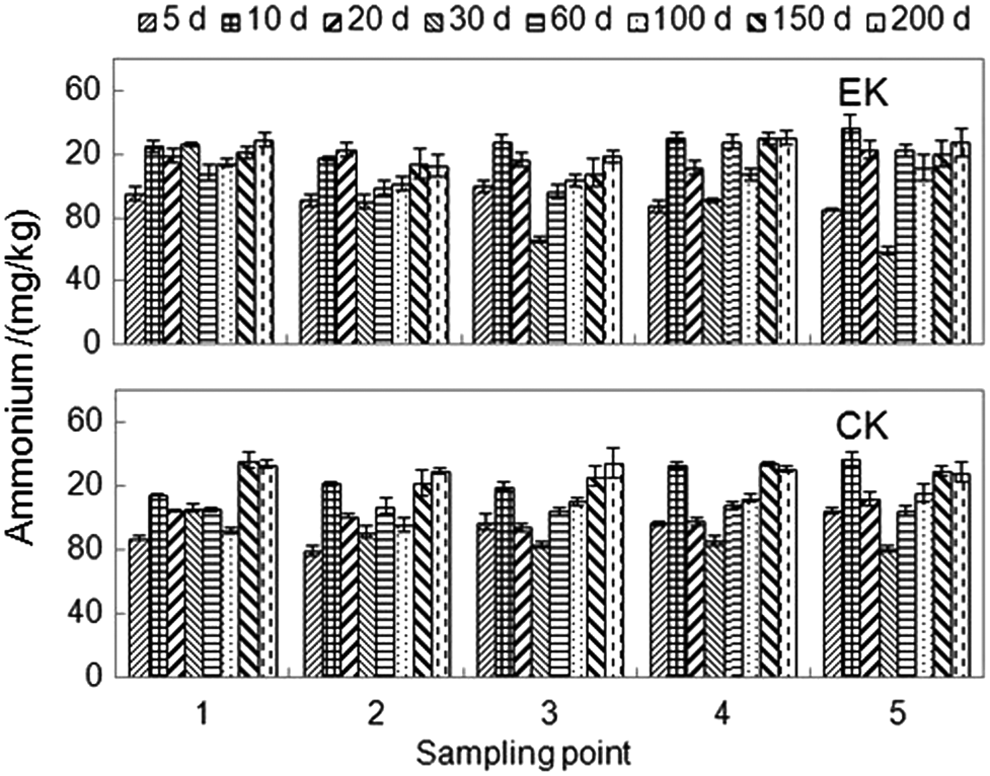
Ammonium distribution in the soils of the EK-assisted bioremediation and CK cells during remediation. The five sampling sites were evenly distributed from the anode to the cathode.
Microorganism nitrification (Stark and Firestone, 1995)
Electrolysis (Logan and Rabaey, 2012)
Extracted ammonium concentration in the EK soil ranged from 128.5 to 134.5 mg/kg soil, slightly higher than the CK soil (113.0–130.2 mg/kg soil) after 200 days of remediation. Ammonium was evenly distributed between the five sampling points in both the EK and CK groups.
The coking plant soil was depleted in available phosphate (2.1 mg/kg). Soil-available phosphate changed in a similar way as extracted ammonium did during the remediation, but no significant increase was observed after the first 60 days (Fig. 4), making the available phosphate in the EK cell comparable to that in the CK cell. To improve the available phosphate in the tested soil, its concentration was doubled in the electrolyte solution on day 80. Soil-available phosphate was increased to thrice the initial concentration, which was twice as much as in the CK group.
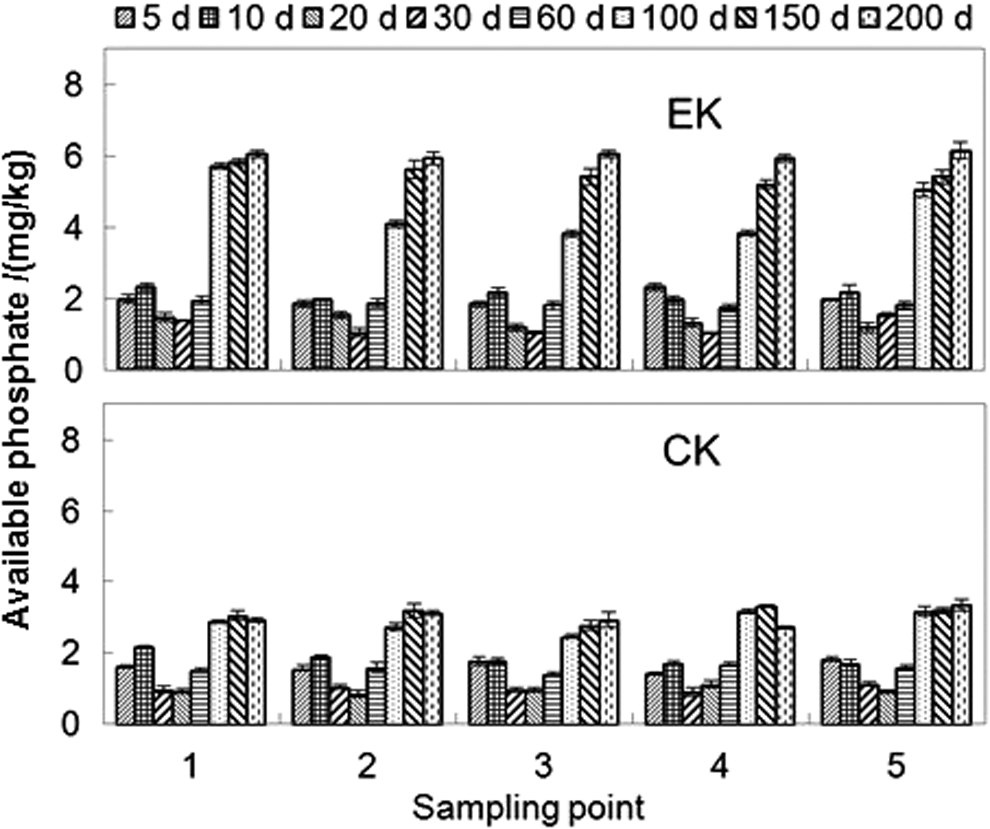
Available phosphate distribution in the soils of the EK-assisted bioremediation and CK cells during remediation. The five sampling sites were evenly distributed from the anode to the cathode.
Ammonium and phosphate levels in the electrolyte solution in the electrode compartments were also monitored during the remediation (Fig. 5). In the EK cell, the ammonium and phosphate concentrations in the electrolyte solution ranged from 89 to 202 and 6.7 to 87, respectively; while in the CK cell, the corresponding values ranged from 150 to 226 and 46 to 146, respectively. Hence, the extracted ammonium and available phosphate in the EK soil were both higher than in the CK soil, while the ammonium and phosphate levels in the EK cell electrolyte solution were lower than those in the CK cell (p < 0.05). These results indicate that the nutrient ions were effectively injected into the soil by the direct current field. It should be noted that the extracted ammonium and available phosphate concentrations evenly distributed at the five sampling points in EK bioremediation, which is favorable for the prevention of biofouling (Acar et al., 1997; Kim and Han, 2003), indicated that the migration of inherent cations in soil under EK might cause an uneven distribution of ammonium ions, which would lead to a dramatic microbial growth at a single site (biofouling). Reversing electrode direction and maintaining a neutral pH by mixing the electrolytes proved to be a promising solution to this problem in this study. Hence, the EK procedure used in this study provides favorable conditions for bioremediation and an ideal EK injection technology.
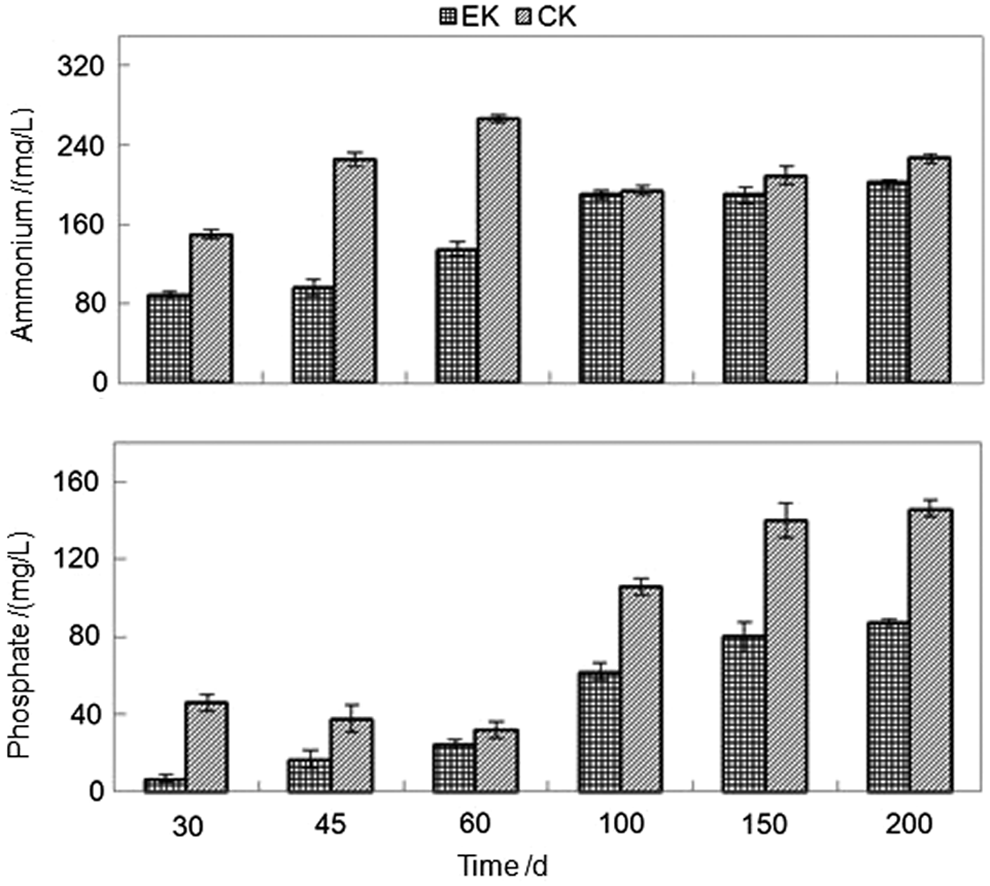
Ammonium and phosphate distribution in the electrolyte in electrode compartments of EK-assisted bioremediation and CK cells during remediation.
PAH degradation in soil
The degradation rates of PAHs in the soil of the EK bioremediation cell were higher than those in the CK soil (Fig. 6). The degradation rates of the total 16 PAHs at different sampling positions in the EK cell ranged from 50.6% ± 4.3% to 56.8% ± 1.7% after 200 days of remediation, which were twice as high as those in the CK group (28.8% ± 3.4% to 31.8% ± 2.0%). Figure 7 shows the average degradation rates of the 16 individual PAHs in the soils at the five sampling sites. The average degradation rates of low-molecular-weight PAHs were significantly higher than those of high-molecular-weight PAHs in both the EK and CK cells. However, the degradation of high-molecular-weight PAHs was enhanced much more by EK than for low-molecular-weight PAHs. In the present study, bioremediation of high-molecular-weight PAHs (5–6-ring PAHs) from a field-contaminated soil was enhanced more than twofold by the application of EK technology assisted by HPCD.
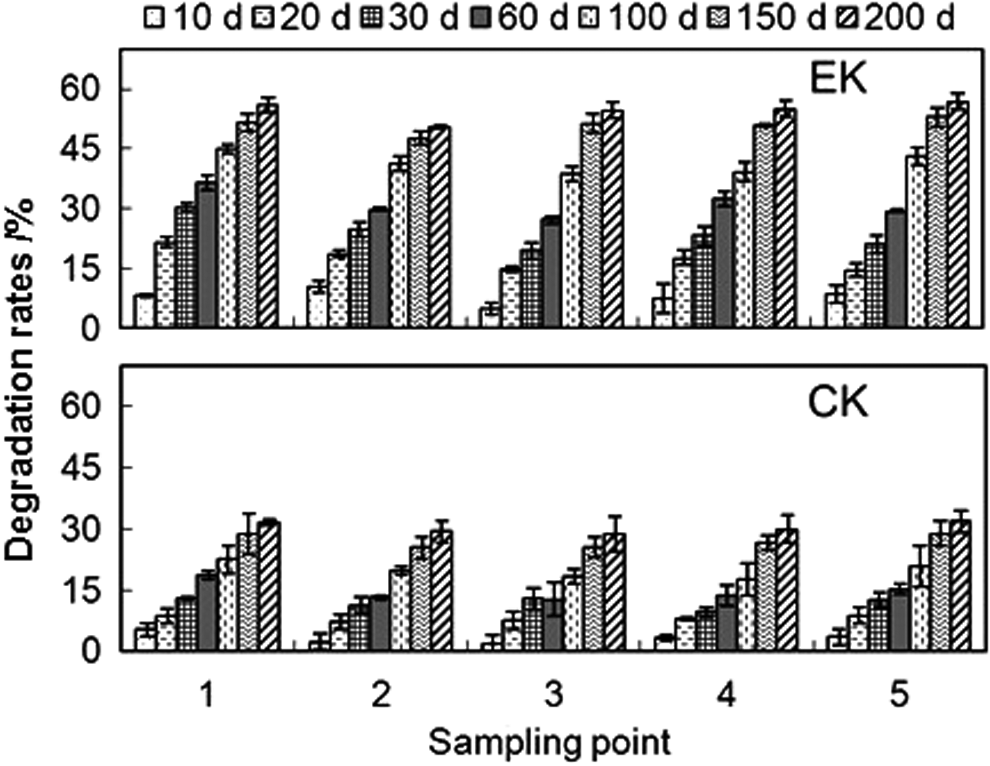
Degradation ratio of the total 16 PAHs in the soils of the EK-assisted bioremediation and CK cells at different sampling positions. The five sampling sites were evenly distributed from the anode to the cathode.
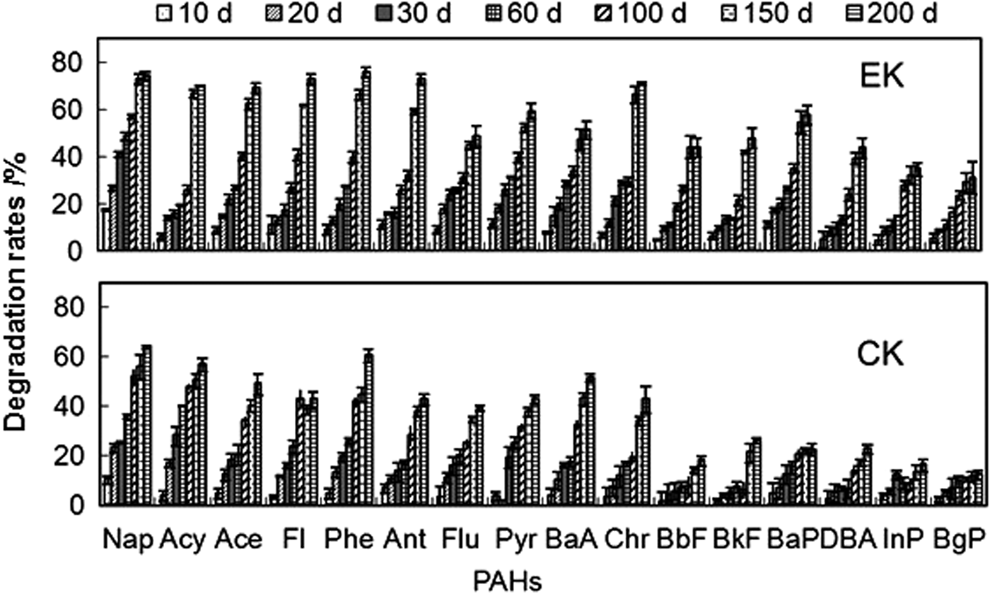
Average degradation rates of the 16 individual PAHs in the soils of the EK-assisted bioremediation and CK cells. The five sampling sites were evenly distributed from the anode to the cathode.
PAH-degrader MPN
Soil microorganism quantity, especially viable microorganism number, is used to infer the contaminant degradation ability of the soil. However, traditional methods are unable to selectively and accurately enumerate PAH-degrading microorganisms. The modified MPN procedure used in this study was able to selectively enumerate PAHs degraders. Figure 8 shows the PAH degraders after the 200-day remediation in the EK and CK soils. The PAH degraders in the EK soil at the five sampling sites ranged between 7.5 and 8.0, while the CK value ranged between 6.6 and 6.9. The PAH degraders in the soil of EK cell significantly increased (p < 0.05). The average number of PAH degraders at the five EK sampling points was eight times higher compared with the control group at 200 days, illustrating the electric field's ability to promote the transport of electrolyte microorganisms into the soil. The application of direct current between two electrodes in the soil generates three processes: electromigration, electroosmosis, and electrophoresis. Electroosmosis can effectively drive microorganisms into soil, while electrophoresis will also transport microorganisms together with the aqueous layer (Wick et al., 2004).

PAH degraders after 200 days remediation in the soil of the EK-assisted bioremediation and CK cells at different sampling positions. The five sampling sites were evenly distributed from the anode to the cathode.
Community analysis
Cultivable microorganisms constitute only a minor fraction (1–5%) of the whole microbial community (Leonardi et al., 2008). Thus, DGGE analysis of PCR-amplified 16S rRNA was conducted to provide an overview of the impact of an electric field on microorganisms. Comparing the microorganism communities of the EK and CK soils showed that biodiversity changed slightly in the EK group (Fig. 9a, b). Significant increases in population structure were noted in the 6 and 10 lanes near the EK electrodes, compared to the 1 and 5 lanes for CK, demonstrated by the appearance of new bands (Fig. 9b). These results indicate that an electric field increases the indigenous microbial population, which could be ascribed to the electric field's ability to transmit ample nutrients to the indigenous microbes. Furthermore, the population increase in soil bacterial communities after EK may have contributed to the enhanced PAH degradation.

DGGE fingerprint file
Cluster analysis was performed with the UPGMA algorithm to reveal the general patterns of community similarity among the different soil samples. Supplementary Figure S4 shows the cluster analysis of the DNA banding patterns. The similarity value of the microorganism communities from all of the 10 samples ranged between 0.49 and 0.84, and the soils sampled near the electrodes in both the EK and CK cells showed relatively greater biodiversity than those in the middle of the cell, possibly due to soil adjacent to the electrolyte compartment accessing more nutrients and water.
It can be concluded from the above result that under the effect of EK, cosolvent was injected into the soil and bioavailability of PAHs in soil was elevated. Nutrient injection provided favorable conditions for microorganisms. Besides, microorganisms can be effectively driven into soil under an electric field. Hence, the EK procedure used in this study promoted the efficiency degradation of PAHs.
Conclusions
EK-assisted bioremediation was studied, and its feasibility was comprehensively studied through remediation of field soil from the Beijing Coking Plant, China. Circulating a mixed electrolyte effectively controlled soil pH in the device, as indicated by the stable neutral pH maintained over the 200 days of remediation. EC, extracted ammonium, and available phosphate of the soil in the EK-bioremediation group were higher than in the control. However, the extracted ammonium and available phosphate in the electrolyte of the EK device were lower than in the control. Nutrient ions were effectively injected into the soil by the current field, and periodically changing the direction of the electric field successfully distributed the above nutrients evenly. The degradation rate of PAHs in the EK group were twice as high as those in the CK group, while degradation rates of high-ring PAHs were more enhanced by EK than low-ring PAHs. The amount of PAH degraders in the soil of the EK-bioremediation group was eight times higher than in the control at 200 days. The PCR-DGGE results showed significantly greater increases in population structures near the electrodes of the EK cell compared to that of the CK cell, indicating that the electric field increased the indigenous microbial population.
Footnotes
Acknowledgments
We acknowledge the Tianjin Key Programme of Basic Research (10JCZDJC24200), the National Natural Science Foundation of China (41225014), and the National 863 Program (2008AA06Z333) for their financial support.
Author Disclosure Statement
No competing financial interests exist.
References
Supplementary Material
Please find the following supplemental material available below.
For Open Access articles published under a Creative Commons License, all supplemental material carries the same license as the article it is associated with.
For non-Open Access articles published, all supplemental material carries a non-exclusive license, and permission requests for re-use of supplemental material or any part of supplemental material shall be sent directly to the copyright owner as specified in the copyright notice associated with the article.