
Abstract
Abstract
The hydrophobic organic acid (HPOA) fraction of the dissolved organic matter (DOM) collected in 2012 at the headwaters of the Suwannee River (SR) was interacted with a metal (Fe, Al) oxide-coated quartz sand, which was sourced from Oyster, VA (referred to as Oyster Sand, “OS”). The adsorption, adsorptive fractionation, and competitive displacement interactions of SR-HPOA on OS were investigated. The novelty of this work is based on the experimental technique employed. Most prior studies of DOM-adsorbent reactions have been performed with either batch or continuous-flow column techniques. However, in this work, the DOM adsorbate and geosorbent were reacted using a rapid and data-rich liquid chromatographic method in which discrete (i.e., noncontinuous) additions of adsorbates are made onto manually adsorbent-packed columns, and eluting fractions are monitored in multiple optical detector channels. All experiments were performed under the same conditions [mobile phase pH 4 and ionic strength 0.005 M (NaCl)]. Fractions of HPOA preferentially adsorbed on OS included relatively aromatic, strongly UV absorbing but weakly fluorescing high-molecular-weight (MW) mixture constituents. These adsorptive fractionation trends were inferred by comparing signals from the different optical detection channels and were also confirmed by size exclusion chromatography analyses of column effluent fractions. Adsorption experiment results were confirmed by desorption studies; SR-HPOA materials released from organically-saturated OS surfaces by injections of KOH or KH2PO4 were relatively high in MW and aromaticity as well as relatively nonfluorescent.
Introduction
D
Differences in retardation factors for various DOM fractions could be important for contaminant fate and transport. Various inorganic or organic contaminants may associate more or less strongly with organic matter components that differ in size and other properties. Hence, it is worthwhile to investigate adsorptive fractionation and its potential effects on transport in greater detail.
In this work, the hydrophobic organic acid (HPOA) fraction (consisting of humic and fulvic acids) of DOM retrieved in 2012 from the Suwannee River (GA, USA, denoted as “SR”) was interacted with surfaces of a naturally occurring metal (Fe, Al) oxide-coated quartz sand (retrieved at Oyster, VA [USA], herein called “Oyster Sand,” OS). The interactions studied included adsorption, adsorptive fractionation, desorption, and competitive displacement. These interactions between DOM and adsorbent surfaces also have implications for element cycling, wastewater treatment, as well as contaminant transport. Readers seeking detailed background on the nature of DOM, the nature of the isolation of the HPOA organic matter fraction of SR-DOM, and a thorough review of the nature of DOM-geosorbent surface interactions are encouraged to refer to the articles by Green et al. (2015) and Kuhn et al. (2015) in this issue.
In the studies reported here, we used an experimental approach based on liquid chromatography (LC) to react SR-HPOA adsorbate and OS geosorbent. We have used this experimental approach in our laboratory to investigate a variety of DOM interactions with adsorbent surfaces (Kreller et al., 2012a, 2013). The current article, however, marks the first application of these methods to a geosorbent of broad environmental interest and to the HPOA sample collected at the SR (GA, USA) in May 2012.
The LC-based technique provides additional detailed information that can supplement traditional (i.e., batch and continuous-flow column) methods, which have been used in most previous studies of DOM-surface interactions (e.g., Tipping, 1981; Schlautman and Morgan, 1993; Gu et al., 1996; Chi and Amy, 2004; Seders-Dietrich et al., 2013). The LC experiments share fundamental similarities with continuous-flow column experiments in which adsorbates are fed continuously into adsorbent-packed column reactors. However, these LC experiments employ LC injection systems to make pulsed (i.e., noncontinuous) additions of adsorbate to absorbent surfaces. Our LC experiments also utilize multiple channels of optical chromatographic detection to continuously detect and characterize eluting (i.e., nonadsorbed, desorbed, or displaced) DOM over the chromatographic run time of each injection.
In most laboratories, DOM is generally only available in limited quantities. Hence, the small-scale and data-rich LC experiments are useful in DOM research because they consume only relatively small quantities of adsorbate. Data pertaining to DOM adsorption (or breakthrough), DOM adsorptive fractionation, and DOM desorption (or displacement) can all be efficiently collected in individual experiments that consume only single adsorbent-packed columns. In terms of time efficiency, these experiments are also completed in the timeframes of typical multi-injection chromatographic runs. The time efficiency of this approach will be the greatest when the LC has automated injection, as was the case in the work reported here.
The LC-based approach also permits excellent control over the adsorbent's level of surface coverage with bound adsorbate. Such precise control of surface loading is important when investigating (and potentially modeling) phenomena sensitive to surface loading. For example, it has been reported that the interfacial electric potential of hydrophilic membranes, which can control both the kinetics and thermodynamics of DOM adsorption on them, depends on their loading with adsorbed humic substances (Jones and O'Melia, 2000). A principle factor controlling surface loading in these experiments is total adsorbate “dosage” that has been injected onto and contacted with particle surfaces in the adsorbent-packed column. In LC experiments, total dosage is controlled by the concentration of the injected solution and the number and volumes of injections. The latter factors are readily controlled in LC. This precise control over surface loading, combined with the high sensitivity of chromatographic detectors, promises to afford the study of phenomena that are sensitive to surface loading with relatively higher levels of precision than have generally been available with conventional batch and column experiments. A further source of interest in the LC-based approach might be based on the data, which become available through the unique (chromatographic run) time axis. Hence, we argue that the LC method provides a set of potential benefits in DOM research as well as being a rich source of data that supplement traditional batch adsorption and column transport experiments.
Materials and Methods
SR organic matter HPOA
Details of the isolation and processing of the SR-HPOA (humic acid) are described in the article by Kuhn et al. (2015). To prepare the SR-HPOA solution (i.e., adsorbate mixture), which was injected in these LC experiments, a quantity of the dehydrated (i.e., freeze-dried) HPOA was dissolved in 100 mL of premade LC mobile phase (LC Adsorption Experiments section). The DOM concentration of the adsorbate HPOA solution was determined to be 103.5 ppm C/L using high temperature catalytic oxidation (Shimadzu TOC-500, auto-sampler mode) with potassium hydrogen phthalate standards.
Geosorbent
As mentioned in the introduction, SR-HPOA was interacted with a naturally Fe and Al oxide-coated quartz sand retrieved at the U.S. Department of Energy research site in Oyster, Virginia. The sand is herein referred to as “Oyster sand”, OS. The properties of this geosorbent have been described elsewhere (Dong et al., 2002; Seders-Dietrich et al., 2013). This adsorbent was chosen because it is a representative of a wide class of naturally occurring quartz sands having partial metal oxide coatings that enhance DOM uptake relative to unmodified quartz (Chi and Amy, 2004; Wei et al., 2010). Before shipment to the laboratory (Georgia Southern U.), where these adsorption experiments were conducted, the sand had been pretreated (U. Notre Dame) by dry sieving with a 20×40 mesh sieve (0.842×0.420 mm) and repeated rinsing with distilled DI H2O. Before its use in these experiments, the sand was washed with 0.1 M NaOH and then 0.1 M HCl, rinsed multiple times with DI H2O, dried at room temperature, and then heated overnight at 700°C in a muffle furnace.
LC adsorption experiments
Methods used in these experiments were similar to those recently reported (Kreller et al., 2012a, 2013). The LC system (Waters) was controlled by Empower (2) software and consisted of a Delta 600 pump, 717plus autosampler, 2487 dual wavelength UV/vis absorbance detector, 2475 fluorescence detector, and Waters Fraction Collector (III). Blank LC columns (100×4.6 mm, Restek) were dry-packed with analytically weighed quantities of OS. The columns held an average of 2.77 g of sand. Injections of acetone were made onto each manually OS-packed column before its use in an adsorption experiment. Acetone, which behaved essentially as a homogeneous nonadsorbing tracer and was presumably subject to only diffusion and mechanical dispersion in the column, was used to verify the column's packing integrity and to measure its void (or dead) time.
Each of the adsorption experiments consisted of 60 consecutive 50 μL injections of the SR-HPOA solution being made onto an OS-packed column. Mobile phases (experimental flow rate 0.5 mL/min), which were prepared from DI H2O (Barnstead ePure), were (1) adjusted in ionic strength with 5 mM NaCl, (2) adjusted to pH 4 with 0.1 M HCl or 0.1 M NaOH, and then (3) passed through 0.45-μm filter membranes (Millipore).
Chromatographic recoveries and adsorption
In the initial step of data processing, a custom computer program called “Chromatogram Handler” developed by Kreller et al. (2012b) was used to sort the raw LC detector data according to optical detection channel and injection number and then to determine the areas of broad DOM chromatographic curves by integration. The program also calculated recovery values (Ri) for each of the injections using Equation (1).
In Equation (1), Areai is the chromatographic peak area of the ith injection and Arearef is the chromatographic peak area of a reference injection in which the behavior of DOM approached that of a nonadsorbing (i.e., quantitatively recovered) tracer.
Our LC-based DOM adsorption experiments were designed to optimize the balance between two factors: (1) nearly total surface saturation by the end of the experiment and (2) consumption of experimental time. We chose to perform 60 successive injections (all identical in HPOA concentration [103.5 mgC/L] and injection volume [50 μL]) to provide a total injected “dosage” of SR-HPOA that would result in near-saturation of the OS surfaces by HPOA by the end of the experiments (∼0.3 mg total). The total number of experimental injections needed to be limited to avoid excessive consumption of time, mobile phases, and so on. It is noted that a condition of total saturation and equilibration at the sorbent surface may be very difficult to achieve, if not in principle unattainable, by this method. The per-injection recovery (Fig. 2) may take the shape of a slowly rising power law and in principle requires an infinite input of adsorbate solution for the attainment of a perfect plateau in recovery. Further insight into the nature of the kinetic limitations (of this and other column-based adsorption methods) may be found in the work of Hur and Schlautman (2003), who found that 50–100 h of DOM-sorbent contact time were required for full equilibration (i.e., stabilization within the system in terms of both the amount of carbon absorbed and the MW of residual DOM in the solution) in a system of humic acid and hematite.
In this work, we used the mean chromatographic peak area of the final five injections of an experiment as the reference area (Arearef) for that experiment. The resulting uncertainty in the reference area used in Equation (1) due to the failure to truly reach a reference saturation condition may create a small amount of error in the recovery functions, which may propagate further to estimates made using Equations (2) and (3) of the amounts of DOM adsorbed on per-injection and cumulative bases, respectively.
In Equations (2) and (3), Ca, Vinj, and SA are the [DOC] of the injected DOM solution, injection volume, and total packing particle surface area, respectively. Estimates of DOM quantities adsorbed made using optical data (rather than [DOC]) are also expected to be biased (either high or low) when the operative adsorptive fractionation effects include preferential adsorption of strongly optically active (or inactive) mixture constituents. Based on previous reports of interactions between humic substances and metal oxide minerals (e.g., Dunnivant et al., 1992; Namjesnik-Dejanovic et al., 2000; Guo and Chorover, 2003; Hur and Schlautman, 2003; Chi and Amy, 2004; McInnis et al., 2014), preferential adsorption of organic mixture constituents that are relatively high in MW and molar absorptivity is expected to occur in the type of system comprising the HPOA adsorbate mixture and OS geosorbent. When this pattern of adsorptive fractionation occurs (Fig. 2), the absorbance data will lead to an overestimation of the quantity of DOM adsorbing.
The reader should keep in mind that any potential error in our estimates of the total amounts of HPOA adsorbing on OS will not affect or weaken the primary observations reported in this article. Rather than quantifying the amount of DOM adsorbing in this system, the current work is aimed at reporting observations made using the LC-based approach that may help elucidate DOM transport and preferential adsorption effects that occur in the HPOA/OS system (and potentially other similar systems).
Characterization of eluting DOM with spectroscopic indices
In these experiments, detection data were collected in three different absorbance channels (204, 254, and 340 nm) and one fluorescence channel (λexc=350 nm, λem=450 nm). Specific absorbance wavelengths were chosen at strategic points across the UV range over which the aquatic humic substances exhibit their strongest absorption of electromagnetic radiation (Green and Blough, 1994). Fluorescence excitation and emission wavelengths were chosen to correspond with the broad fluorescence peak observed for most terrestrial and aquatic humic substances (Mobed et al., 1996; Chen et al., 2003). Based on the collection of this optical detection data in multiple channels, three different spectroscopic indices/ratios were used to characterize DOM that eluted in each of the injections. The first ratio we report below, which we call the “absorbance” index (RiAbs), is calculated [Eq. (4)] as the ratio of the chromatographic peak areas in 254 and 340 nm absorbance channels:
This ratio has a strong similarity with the E2:E3 index, which in other work has been calculated as the ratio of cuvette-based DOM absorbance readings at 254 and 365 nm. To interpret trends in this index across injection series of the current experiments (shown in Fig. 3B), we refer to a previous work (Peuravuori and Pihlaja, 1997) which demonstrated that a wide variety of DOM samples have an inverse relationship between E2:E3 and average MW. Similarly, DeHaan and De Boer (1987) studied ultrafiltered DOM fractions from Lake Tjeukemeer (Netherlands) and reported that the ratio of 250 and 356 nm absorbances was inversely correlated with average MW. These authors hypothesized that as molecular size increased, E2:E3 decreased due to the increase in the light absorbance at longer wavelengths by higher MW humic mixture subcomponents.
The second optical index employed in this work is denoted the “fluorescence index” (RiFluor). This index is calculated [Eq. (5)] for each injection as the ratio of the peak areas in the fluorescence (λexc=350 nm, λem=450 nm) and 254 nm absorbance channels:
To interpret trends in this index across injection series (Fig. 3B), we again refer to the previous report by DeHaan and DeBoer (1987) in which these authors reported that the ratio of fluorescence (λexc=365 nm, λem=470 nm) to 250 nm absorbance (F:E250 ratio) increased with decreasing molecular size for Lake Tujerkemeer DOM.
The third optical signature employed here, which we refer to as the “aromaticity” index (RiArom), is constructed as the ratio of 254 and 204 nm absorbance signals [Eq. (5)]:
Previously, Korshin et al. (1997) and Her et al. (2004) used the ratio of UV absorbance at one wavelength in the range of 251–256 nm to absorbance at a second wavelength in the range of 202–205 nm as an indicator of the relative proportion of unsaturated to saturated (i.e., aromatic to aliphatic) moieties present in DOM. More recently, Hur et al. (2006) reported that the ratio of 254–204 nm absorbance was strongly and positively correlated with the specific ultraviolet absorbance (SUVA, the ratio of absorbance at a wavelength in the 254–280 nm range to [DOC]) for mixtures of Suwannee River fulvic acid (SRFA) and purified Aldrich humic acid. SUVA values for a variety of DOMs have been shown to be related to their aromaticity as measured by 13-C nuclear magnetic resonance (Traina et al., 1990).
Each of these spectroscopic indices, as reported in the aforementioned literature, was constructed (numerator and denominator) using signals from cuvette-based measurements (i.e., readings at single time points) recorded on nonflowing aliquots of the DOM solutions. Alternatively, the indices used in the work reported here [Eqs. (4)–(6)] were constructed using integrated areas of broad chromatographic DOM peaks in various spectroscopic detection channels. Despite this difference, we expect that indices calculated by either approach will carry the same essential information about the character of DOM mixtures and can be used to infer compositional/MW changes in eluting (nonadsorbed) DOM arising due to adsorptive fractionation effects.
Desorption/displacement
To investigate the nature of DOM materials, which had accumulated on organically saturated OS surfaces, injections of potassium hydroxide (KOH) and potassium dihydrogen phosphate (KH2PO4) solutions were made onto HPOA-saturated OS-packed columns to promote the release of bound HPOA. When hydroxide ions were used to promote the release of bound DOM, a 50 μL injection of 0.1 M KOH was made onto the column, which had been employed in a previous SR-HPOA adsorption experiment. When H2PO4− ions were used to promote DOM release, a 100 μL injection of a 0.1 M KH2PO4 solution was made onto the saturated column. Data from detection and characterization of the DOM released by these injections are presented in Figs. 4 and 5.
Size exclusion chromatography
Size exclusion chromatography (SEC) methods very closely followed those described recently (Kreller et al., 2012a) with the exception that the SEC column used in this work was a TSK G3000pwxl (Tosoh Biosciences). SEC was performed using a Shimadzu LC chromatograph controlled by Lab Solutions Lite (v5.52) software and consists of an LC-20 AT LC pump, SIL-20A HT auto-sampler, SPD-20A UV/vis detector, and CBM-20A communications module. Fractions of column effluent collected during injections of LC adsorption experiments were stored for subsequent SEC analyses in 2-mL amber sample vials with 250-μL glass inserts (Restek).
Results and Discussion
SR-HPOA transport through OS-packed columns
Figure 1A presents a set of overlain chromatograms (254 nm absorbance) collected during an experiment in which 60 consecutive injections of the HPOA solution were made onto an OS-packed column. Details of these experiments are provided in SR Organic Matter HPOA, Geosorbent, and LC Adsorption Experiments sections. Also shown in Fig. 1A is a chromatogram for an injection of conservative tracer acetone. As can be seen in Fig. 1A, through-column transport modified the chromatographic DOM distribution relative to that for acetone in two noteworthy ways. First, transport broadened the distribution of DOM constituent arrival times, which is predicted to be due to a combination of dispersion/mixing in the column, variation in adsorption and desorption rates among DOM constituents, and heterogeneity across OS surface regions. Second, the peak for eluting DOM was retarded relative to that for the tracer. Both these observations may be explained by a recent work by McInnis et al. (2014) who, when applying a continuous-time random-walk modeling approach to describe DOM transport through sand-packed columns, determined that DOM components of different MWs have a distribution of retardation rates. These authors found that the retardation factors increased with MW for all but the highest MW fractions. Figure 1A data also agree with the previous work by Abdul et al. (1990) who observed that the transport of DOM was delayed relative to the tracer chloride ion in laboratory soil columns. It is noted that the relation between tracer and DOM transport can be an important factor in determining different transport processes. For example, Fig. 1A leads to the conclusion that size exclusion processes are not important in our columns. However, as has been pointed out by Dunnivant et al. (1992), transport dominated by the adsorption and desorption processes results in the breakthrough of DOM particles later than conservative tracer.
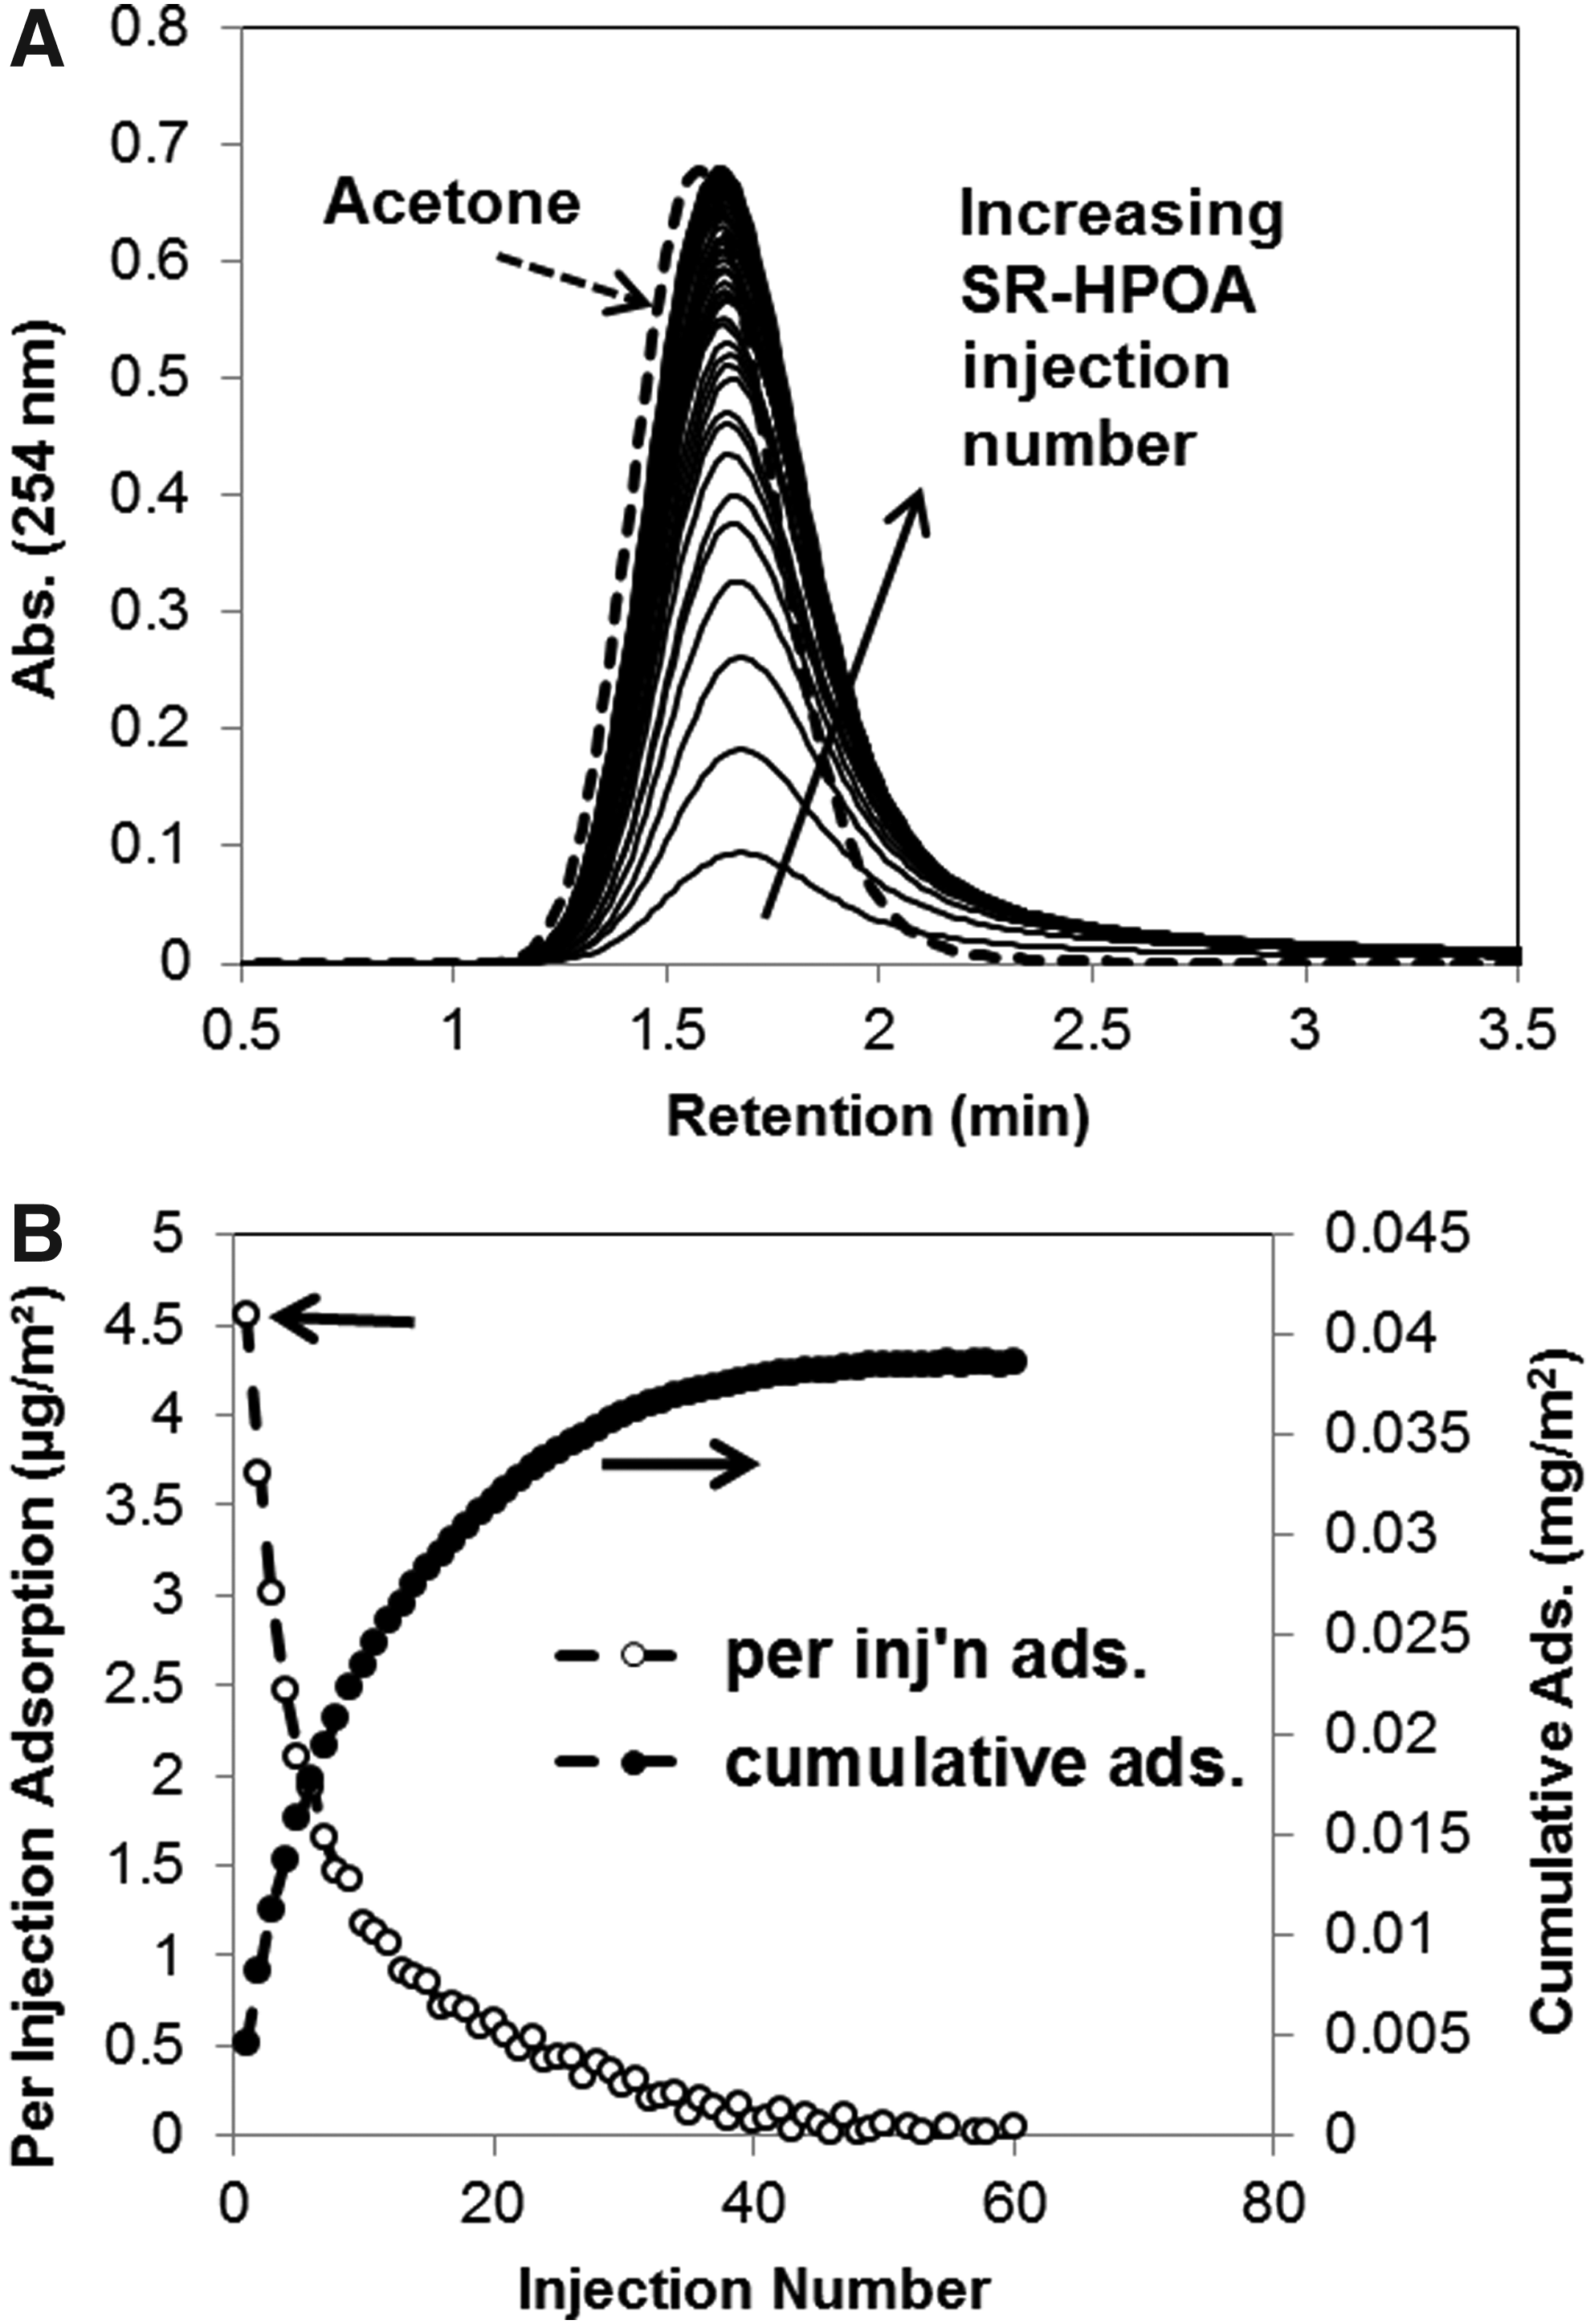
It is also seen in Fig. 1A that the heights and total areas of the broad chromatographic curves for eluting (nonadsorbed) HPOA systematically increased across the injection series. As has been described previously by Kreller et al. (2012a, 2012b, 2013), the recovery of DOM in a given injection of an LC adsorption experiment can be related to the proportion of injected DOM that bound on particle surfaces. It is noted that binding of DOM constituents in these experiments appeared to be irreversible on the timescale of these experiments. Figure 1B presents two different but related estimates of (surface area normalized) quantities of DOM adsorbed on the OS surfaces. The amounts of DOM adsorbed in each injection (open circles) were calculated using Equation (2), and the amounts cumulatively adsorbed across the injection series (closed circles) were calculated using Equation (3). The dominant factor that caused the amount of DOM adsorbing to decrease successive injections was consumption of adsorption-reactive surface sites. However, the quantity of SR-HPOA adsorbing in successive injections may have also decreased somewhat due to adsorption thermodynamics and kinetics that became increasingly unfavorable as surface coverage increased (Jones and O'Melia, 2000).
Adsorptive fractionation as a function of DOM MW
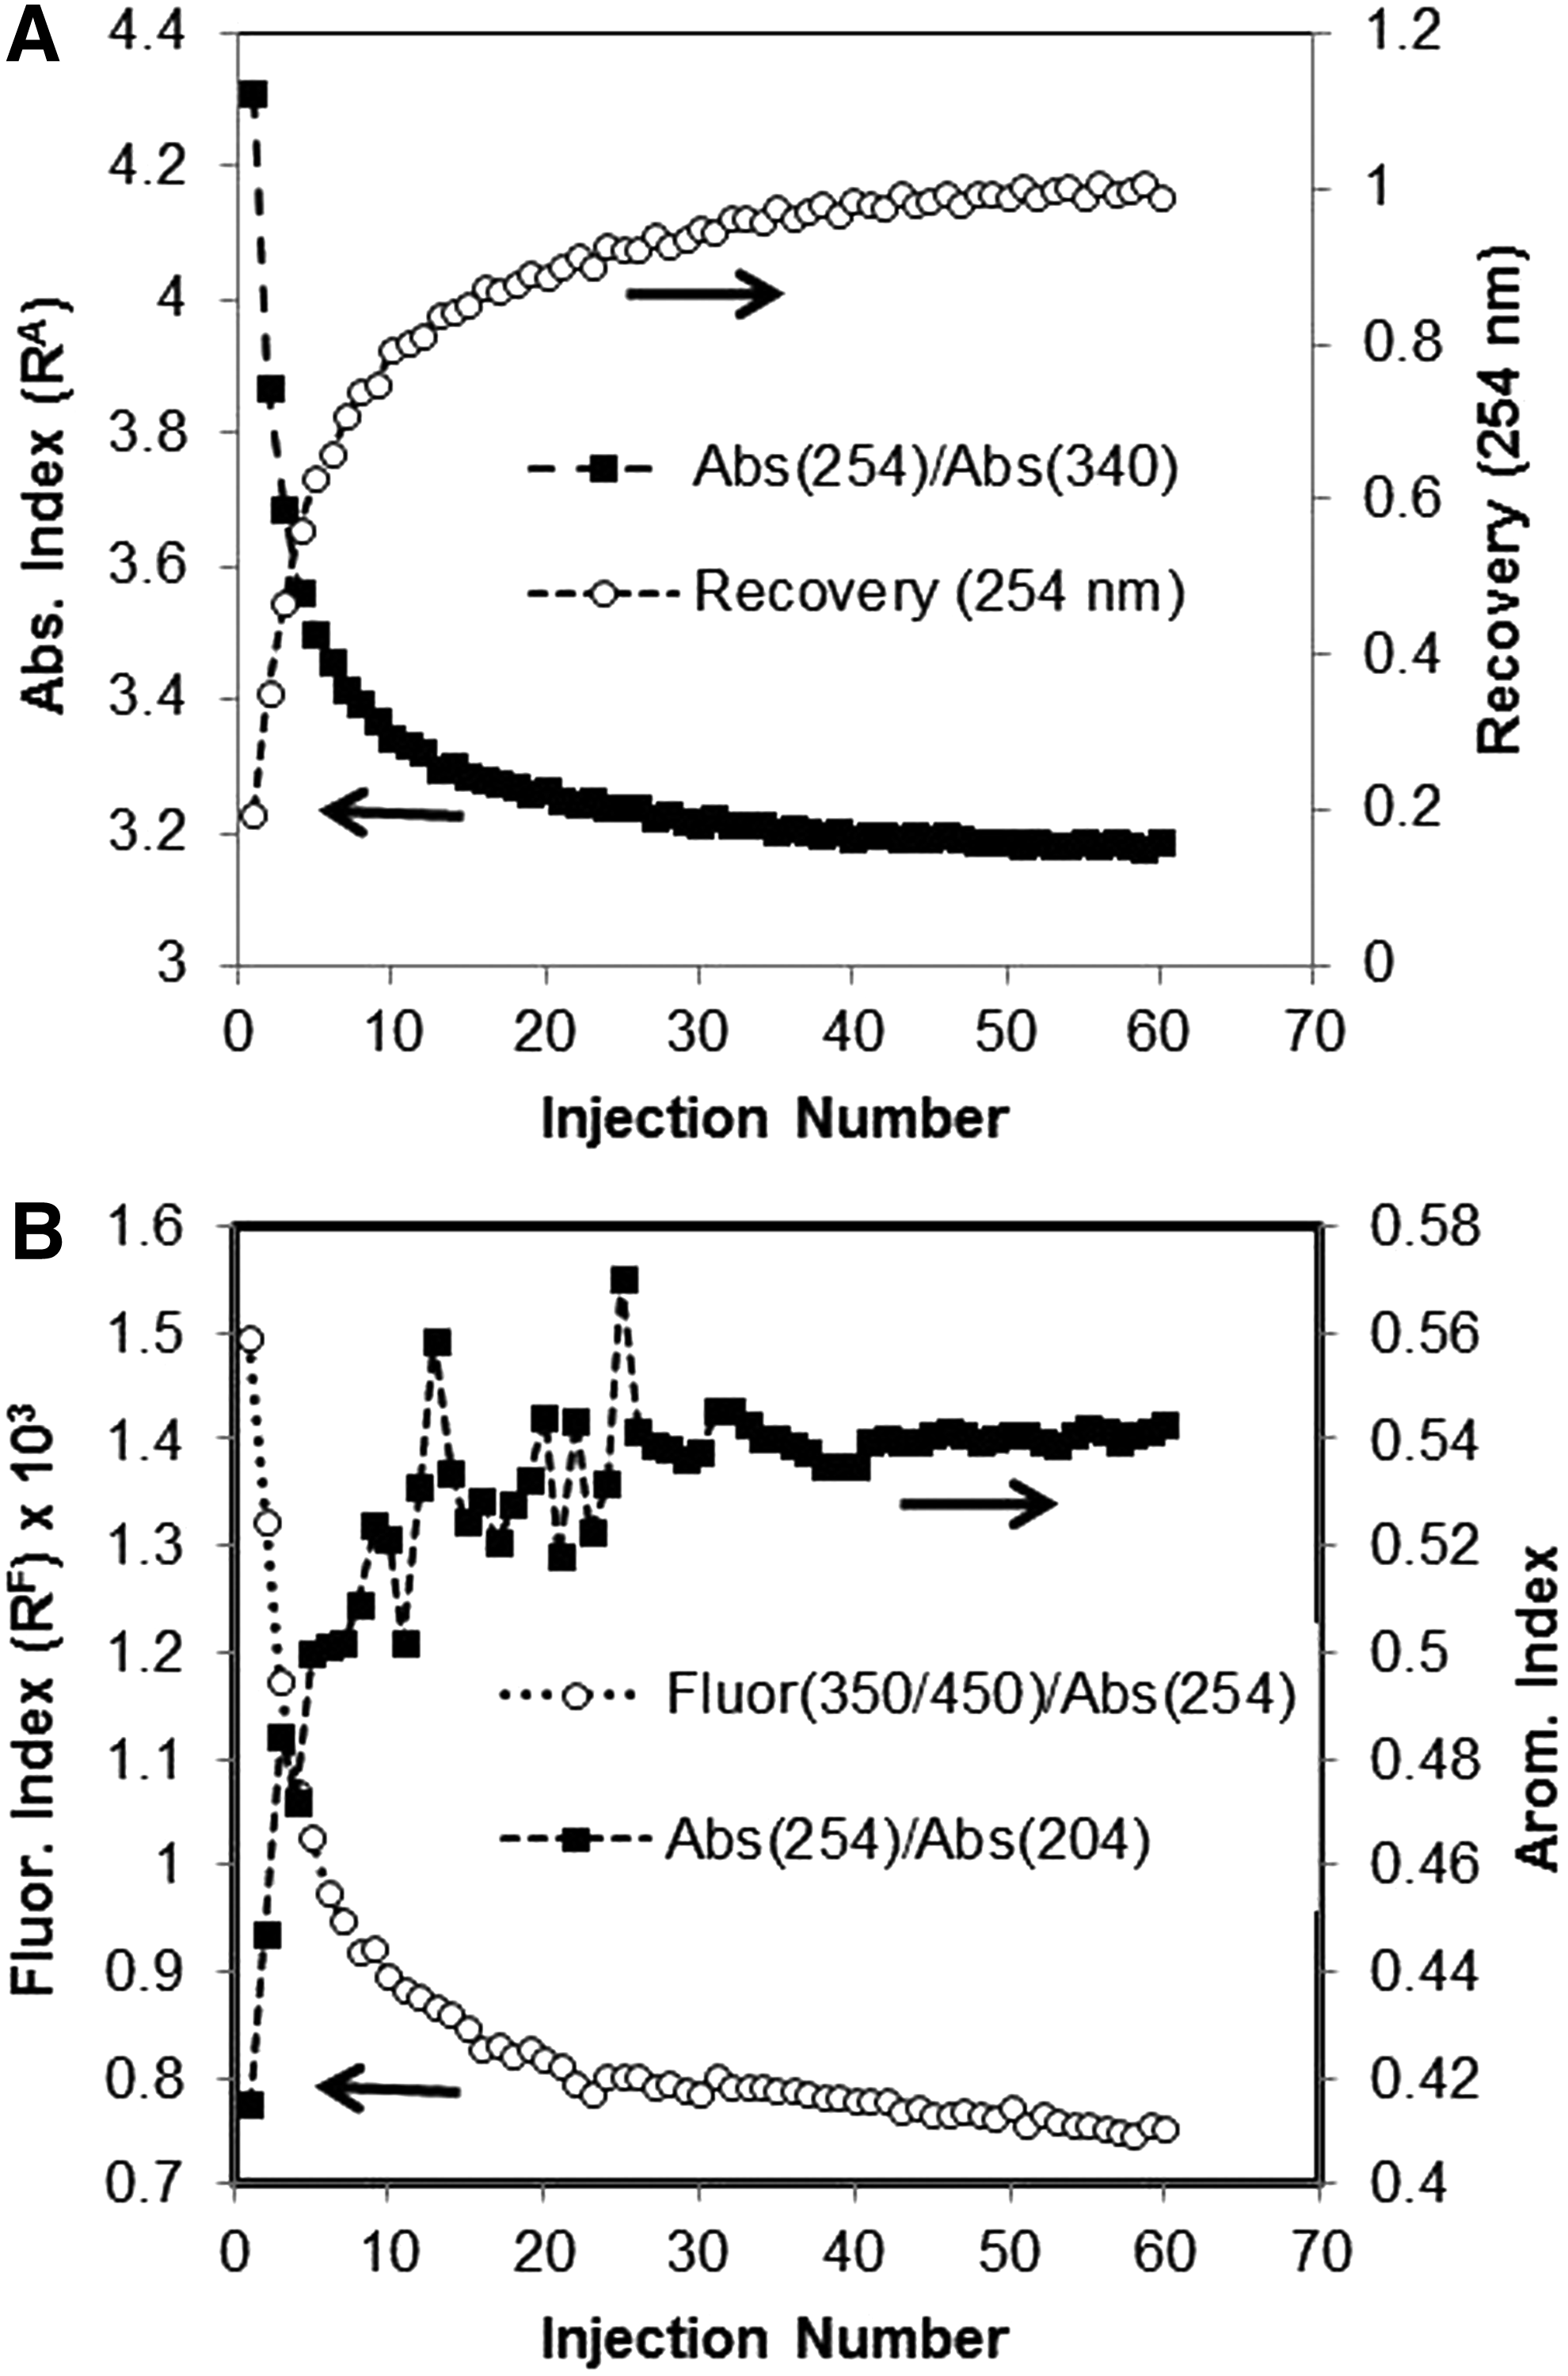
Figure 2A presents values of the absorbance index (Ri,abs), which were calculated [Eq. (4)] for eluting DOM in each injection of the HPOA/OS experiment. Also presented in the figure (for reference purposes) are the per-injection recovery data [Eq. (1)] for the experiment. In the earliest injections of the experiment, when the recovery was lowest (i.e., when the greatest amount of HPOA was being adsorbed), Ri,abs deviated by its largest amount relative to its value for unfractionated HPOA. In a previous work (data not shown), we have observed that DOM eluting from the column in the final injections of an experiment in which apparent saturation was reached has essentially the same properties as the bulk (unfractionated) DOM, which was injected. Figure 2B presents values of the fluorescence (Ri,fluor) and aromaticity (Ri,arom) indices, which were calculated [Eqs. (5) and (6)] for DOM in the same injections. As can be seen Fig. 2B, the fluorescence and aromaticity spectroscopic indices similarly deviated by their greatest amounts from their values for bulk (i.e., unfractionated) material in the first injection of the SR-HPOA adsorption experiment. Using the rationales outlined in the Characterization of Eluting DOM with Spectroscopic Indices section, we interpret these trends in spectroscopic indices as indicating the preferential adsorption on OS surfaces of fractions of HPOA constituents that were relatively (1) high in MW and molar absorptivity and (2) low in their tendency to emit fluorescence.
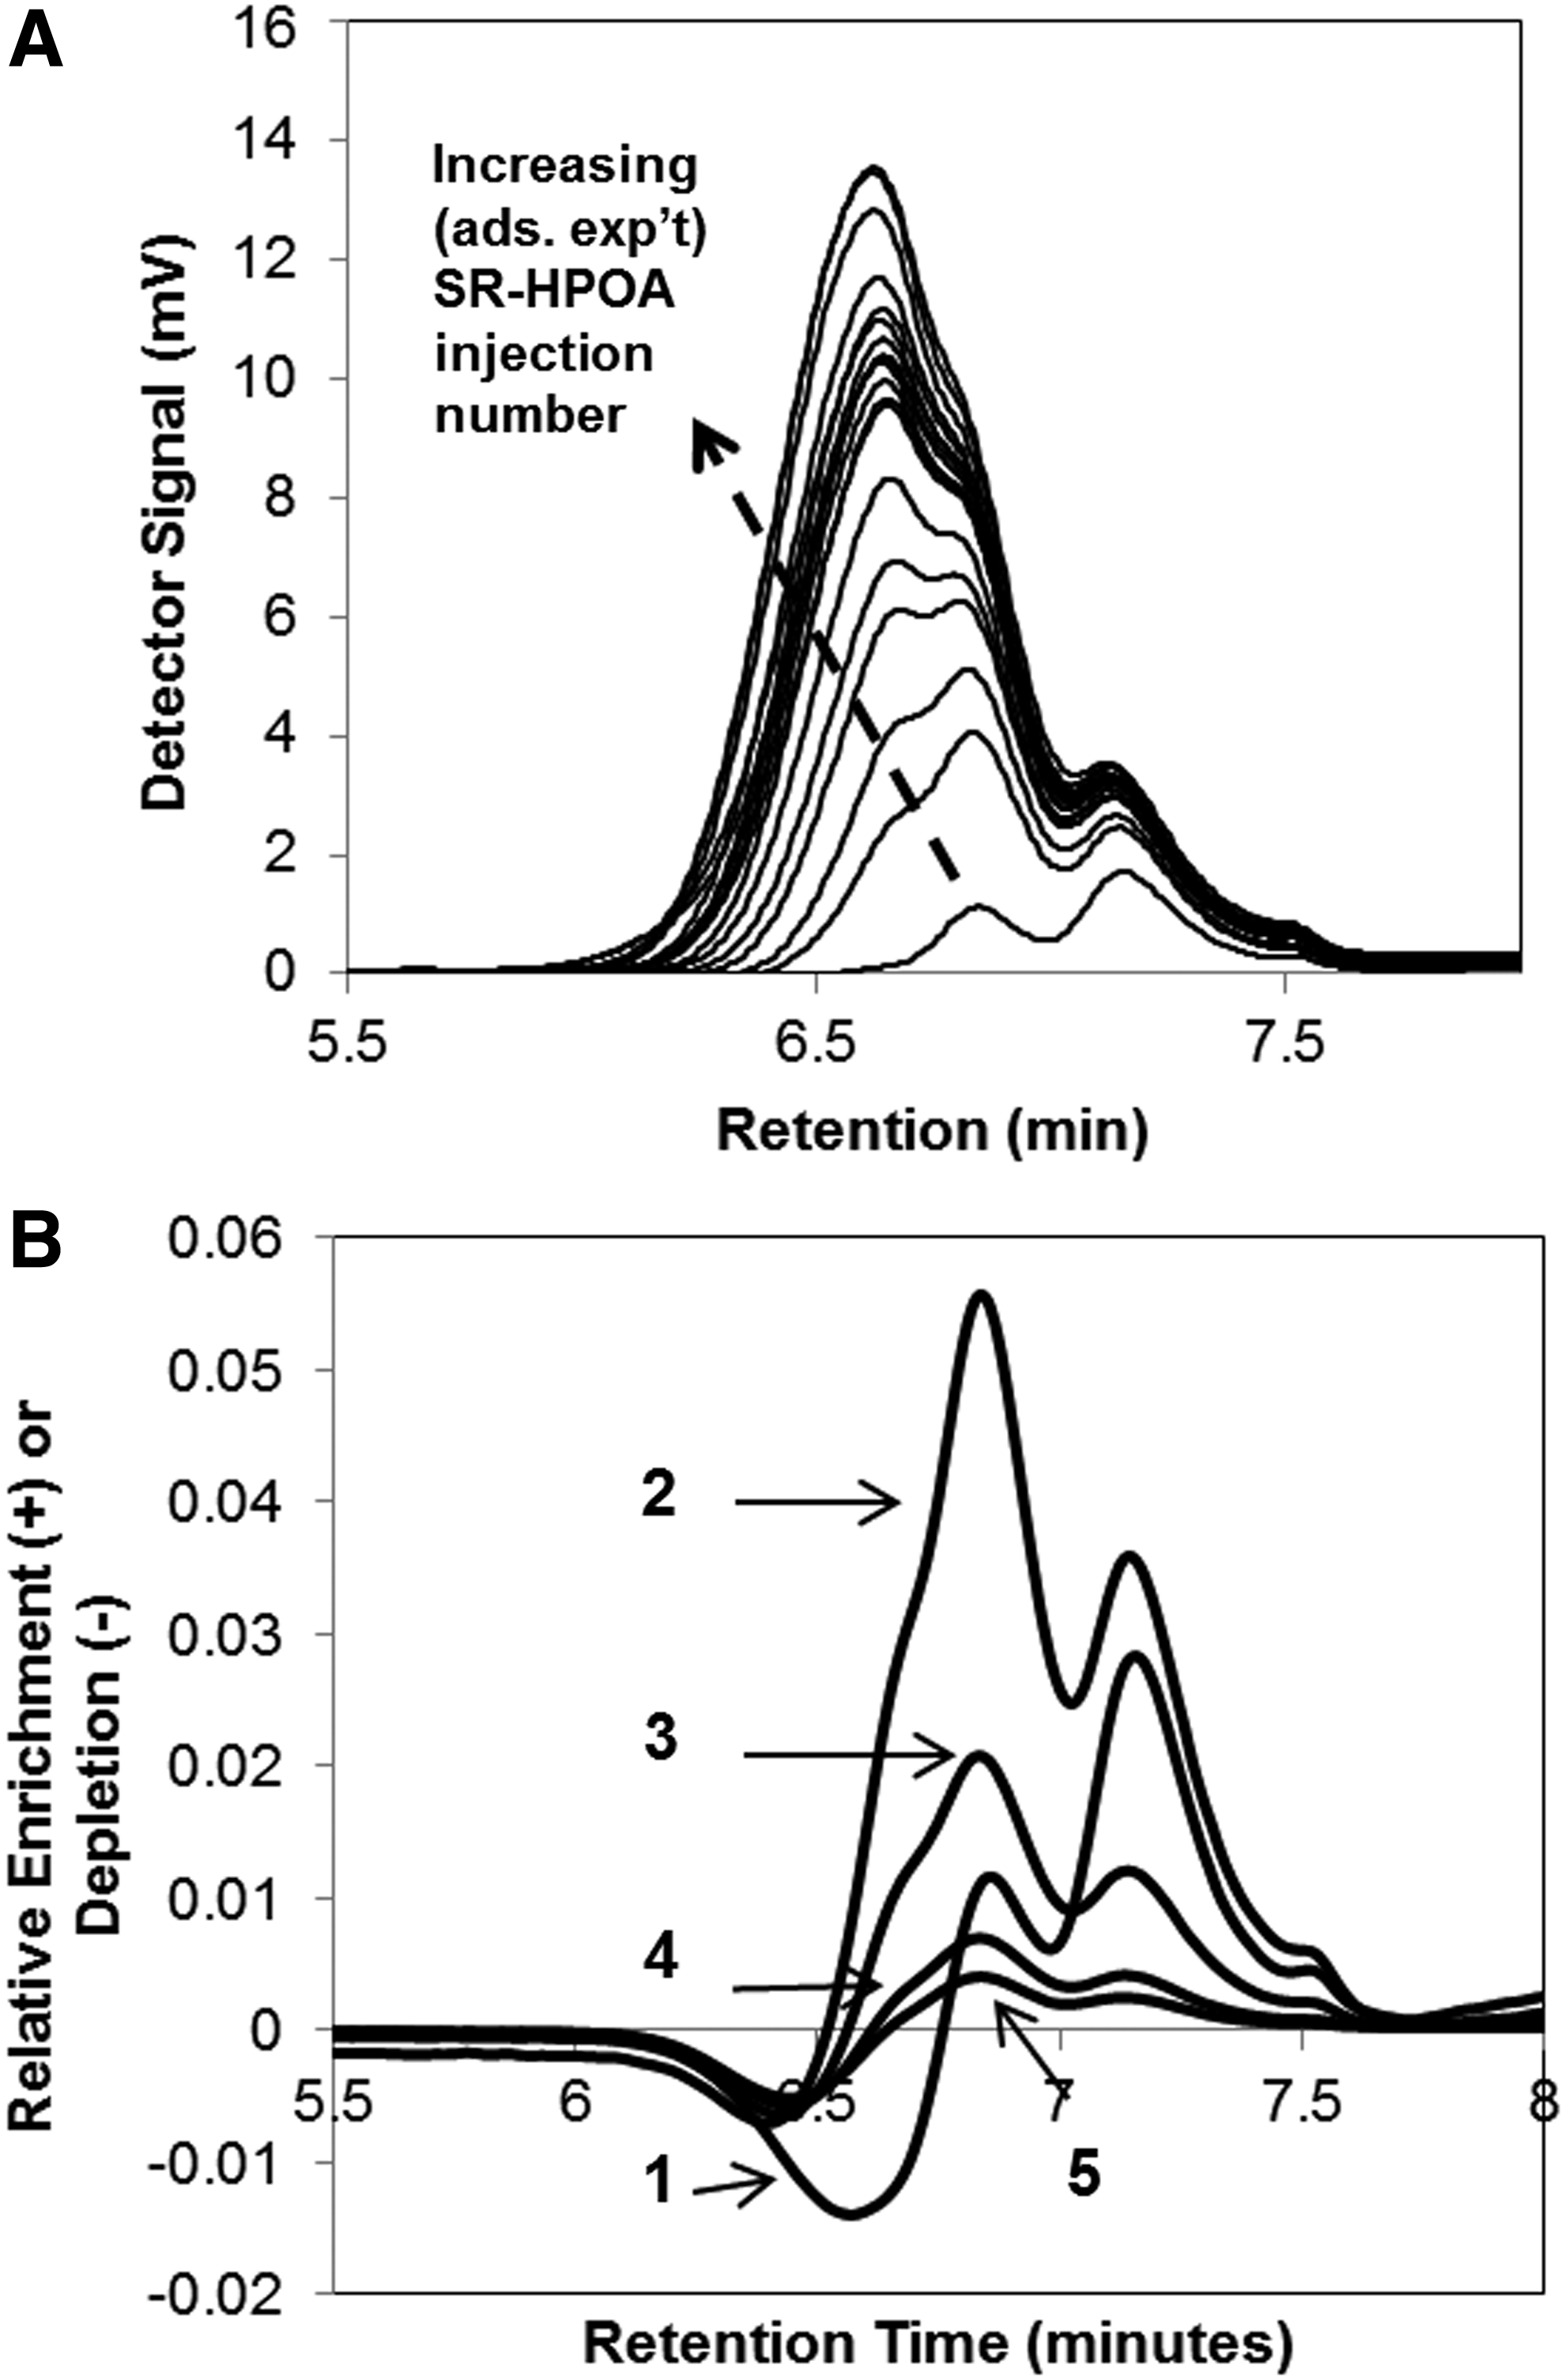
Samples of fractionated DOM were prepared by collecting nonretained portions of SR-HPOA, which eluted during each LC experimental injection. These samples were subsequently analyzed by SEC. Figure 3A presents a series of SEC chromatograms for the organic matter contained in column effluent fractions collected during an HPOA/OS adsorption experiment. Consistent with the trends shown previously in Fig. 1A, SEC chromatograms systematically increased in peak height and area with increasing injection number. The SEC peak maximum also shifted toward lower retention times across the series of samples, which indicated that the breakthrough of the relatively high MW HPOA fractions was retarded relative to lower MW fractions in the OS column.
The combined spectroscopic and SEC data presented in Figs. 2 and 3 indicate that SR-HPOA exhibits a pattern of adsorption and adsorptive fractionation that is fundamentally similar to that previously seen for a large range of aquatic humic substances, including previous SR humic and fulvic acid reference materials. This frequently observed behavior includes preferential uptake of DOM mixture constituents that are relatively high in MW, UV absorptivity, and aromaticity, but relatively low in fluorescence (e.g., Namjesnik-Dejanovic et al., 2000; Chorover and Amistadi, 2001; Zhou et al., 2001; Hur and Schlautman, 2003; Kreller et al., 2012a, 2013; Seders-Dietrich et al., 2013).
To further explore the SEC data, a set of “difference” SEC chromatograms was generated. For the difference SEC curves, the chromatogram for the final (i.e, 60th) injection of the adsorption experiment was used as the reference (i.e., initial) chromatogram. The approach we used was to first normalize all sample SEC chromatograms to the same total area and then systematically subtract SEC chromatograms for the 60th injection from each of the samples across the retention time range. The resulting normalized difference curves for the first five injections of the experiment are presented in Fig. 3B, where positive and negative values correspond to relative enrichment and depletion of constituents, as a function of SEC retention time, relative to sample 60.
As seen in Fig. 3B, a relatively wide range of the HPOA samples' MW distribution was absorbed (i.e., depleted) in the first HPOA injection. The range of constituents that adsorbed extended from the earliest eluting (i.e., highest MW) tail of the distribution (∼6.1 s) to molecules within the relatively abundant intermediate MW fraction (∼6.7 s). It is presumed that this wide range of MW DOM constituents were able to adsorb in this early injection based on their possession of relatively low diffusion constants and the availability of a large number of adsorption sites. The difference SEC chromatogram for injection No. 2 shows, however, that the eluting DOM was enriched by a substantial number of intermediate MW constituents. This suggests that a number of the intermediate MW molecules that had bound during injection No. 1 were returned to the solution during injection No. 2, as brought about by their displacement by higher MW DOM constituents that adsorbed in injection No. 2. These observations are consistent with those of Zhou et al. (2001). These authors observed, in a combined batch adsorption/HPSEC study of the interaction of a fulvic acid (XAD-8 extract) with goethite (α-FeOOH), that low MW DOM constituents that adsorbed at early times were displaced at later times by higher MW DOM constituents. The present observations are also similar to those made by Kreller et al. (2012a) during a study of the interaction of a SRFA reference material with corundum (α-Al2O3) that employed techniques similar to those used here (i.e., a combination of LC adsorption and SEC methods).
Probing SR-isolate adsorption through studies of desorption and competitive displacement by inorganic ions
In the final stages of these experiments, injections of either KOH or KH2PO4 were made onto SR-HPOA-saturated OS surfaces to promote the release of bound HPOA material back into the solution. Materials released from the surface during KOH or KH2PO4 injections and returned to the mobile phase were monitored in the same detection channels and characterized using the same optical indices as in adsorption experiments.
Shown in Fig. 4A–C are values of the absorbance, fluorescence, and aromaticity spectroscopic indices that characterized the organic matter released from organically saturated OS surfaces by injections of KOH and KH2PO4 onto organically saturated OS surfaces. For reference, values of each of these indices are also shown for the organic matter in the final injection of the preceding adsorption experiment. We presume that eluting organic matter in the final injection of the adsorption experiment deviated only minimally in composition relative to the bulk (i.e., injected) organic mixture.

Using three spectroscopic indices to compare bulk (unfractionated) SR-HPOA to materials released from organically saturated OS surfaces by injections of KOH or KH2PO4.
The absorbance index for the organic matter displaced by KOH and KH2PO4 was in both cases lower than that for the unfractionated material, although the difference was greater in the case of desorption by KOH. The fluorescence index was also substantially lower for the displaced materials than the bulk material. By reference to the previous work by others (DeHaan and DeBoer, 1987; Peuravuori and Pihlaja, 1997), it is noted that these observations suggest that the average molecular size of the desorbed/displaced materials displaced by both KOH and KH2PO4 was higher than the average molecular size of constituents of the bulk distribution. In addition, based on the elevated value of the aromaticity index for the displaced materials, the data also indicate that displaced materials were also higher in aromatic content relative to the average HPOA constituents.
Column effluent samples were also collected during the KOH or KH2PO4 injections for SEC analysis. Figure 5 presents comparative SEC chromatograms for these samples. It was seen that chromatograms for the organic materials released from the saturated OS surface by KOH and KH2PO4 differed from that of the original “whole” organic mixture HPOA, which had been used to saturate the surfaces. The desorbed/displaced materials showed substantially earlier peak retention times than the unfractionated sample and hence were indeed higher in average size than those of the bulk/unfractionated material, as had been inferred from the optical index data. It is noted that data generated during the adsorption and desorption/displacement studies fully confirm the observations made during adsorption experiments; both types of experiments indicate the surface accumulation, through preferential adsorption, of HPOA constituents that had relatively high molecular sizes and had elevated contents of aromatic carbon.

SEC chromatograms (normalized to unit area) of materials released from SR-HPOA saturated OS surfaces by injections of KOH and KH2PO4 compared to the SEC chromatogram of the HPOA influent used to saturate the surfaces.
Chromatographic transport of DOM as a function of MW
As mentioned previously, the LC approach to investigating DOM transport may be of interest to some experimentalists and developers of theoretical models based on the unique forms of data the technique can provide. These forms of data may provide insight into phenomena occurring on timescales not inherently accessible in other experimental techniques. We present Fig. 6 as an example of data of this nature. Figure 6 presents absorbance index [Ri,abs, Eq. (4)] data as a function of chromatographic retention time for a subset of injections (Nos. 1, 3, 5, 7, and 13) in a SR-HPOA/OS adsorption experiment. Also provided in Fig. 6 (thin solid line) is a 254 nm chromatogram for HPOA eluting during injection No. 5. The Ri,abs versus retention time data for each injection were characterized by an initial increase at early elution times that corresponded with the leading edge of the HPOA chromatographic curve. Since it has been determined that, for a wide range of DOM samples, an absorbance index of this nature decreases with increasing DOM MW, the temporarily increasing absorbance index implies that the DOM eluting from the column at early times progressively decreased in MW with increasing retention time. Observation of this early increase in the index may be explained by the rapid transport of nonadsorbing low MW HPOA constituents. This hypothesis agrees with a previous work by Zhou et al. (2001) who observed that the very lowest MW fraction of a fulvic acid tended to be nonadsorbing on goethite. It also agrees with the reports by Kreller et al. (2012a) that the very lowest MW fraction of SRFA was not adsorbed in any injections of a LC-based adsorption study of the interactions of SRFA and Al2O3. This observation is also in agreement with the work by McCarthy et al. (1993, 1996) who, in a field-scale study of a sandy aquifer, observed greater mobility for smaller (3 kDa) and more hydrophilic DOM constituents relative to that of more hydrophobic (higher MW) DOM constituents. After the Ri,abs versus retention time curves reached their maxima, the absorbance index gradually decreased. We also consider our new evidence in the light of the recent work by Seders-Dietrich et al. (2013) who determined that retardation factors for DOM fractions of various MW increased with MW for all but the very highest MW fraction. These authors reported that the differences in retardation factors for different MW fractions decreased as pH increased. However, we note that the experiments reported here were performed at an acid pH of 5.0, which corresponds to conditions under which the various DOM fractions are expected to exhibit relatively large differences in retardation factors. Future work with the LC technique will include repeating the absorbance index versus retention time analyses within specific adsorbate-adsorbent systems under ranging conditions of mobile phase pH and ionic strength.

Absorbance index [calc. w/Eq. (4)] as a function of chromatographic retention time for selected injections of LC-based SR-HPOA/OS adsorption experiment. Also shown in the figure (thin solid line) is a chromatogram for HPOA, which eluted during injection No. 5.
Conclusions
When the SR-HPOA isolate materials interacted with OS surfaces, it was observed that organic mixture constituents that were high in molecular size, UV absorptivity, and aromatic carbon content were preferentially adsorbed. Results of our adsorption and desorption/displacement studies were all in agreement in pointing to these conclusions. These data are in agreement with the existing literature on the interactions in this nature of adsorbate–sorbent system. However, since the current studies have been performed with an alternative experimental technique, these results will take a unique place in the efforts to elucidate the interactions of the new HPOA material with environmentally important surfaces. We have also illustrated that the LC-based method can yield forms of data that enable unique tests of hypotheses related to the transport of DOM as a function of MW.
Footnotes
Acknowledgments
The team (led by P. Maurice of Notre Dame University and E.M. Perdue of Ball State University) that led the collection and processing of the SR-DOM is thanked for their generous donation of the samples of freeze-dried SR-HPOA. The P. Maurice laboratory is also thanked for their donation of an OS sample. The authors appreciate the expert feedback of two anonymous reviewers, whose input stimulated substantial improvements to the article. The authors also express appreciation for P. Maurice with whom we had numerous productive discussions and who offered a variety of forms of useful input during all stages of the work and article preparation.
Author Disclosure Statement
No competing financial interests exist.