
Abstract
Abstract
A new method to treat hydrazine and monomethylhydrazine (MMH) using α-ketoglutaric acid (AKGA) was proposed. From the reaction of AKGA with hydrazine or MMH, two stable products are formed, 1,4,5,6-tetrahydro-6-oxo-3-pyridazinecarboxylic acid (PCA) and 1-methyl-1,4,5,6-tetrahydro-6-oxo-3-pyridazinecarboxylic acid (mPCA), respectively. With a focus toward use at an industrial facility, tests were undertaken to determine whether waste streams produced from this reaction can be metered into a municipal wastewater facility for final disposal. PCA and mPCA were analyzed for acute toxicity using crustaceans (Ceriodaphnia dubia) and fish (Pimephales promelas) and their effect on the wastewater treatment efficiency and viability using activated sludge (AS) microbes, and their biodegradability by AS organisms. Acute toxicity on crustaceans and fish was investigated according to the methods for acute toxicity by USEPA Method EPA-821-R-02-012. The effect of mPCA and PCA in the treatment efficiency and viability were estimated from respiration inhibition tests (USEPA, 2012) and heterotrophic plate counts. Last, the biodegradability of PCA and mPCA was assessed using the Closed Bottle Method. The results of this study showed that mPCA is significantly more toxic to C. dubia and P. promelas than PCA at the high concentrations ranges used in this study (0.5–1.5 g/L). On the other hand, PCA and mPCA did not show a significant inhibition of carbonaceous respiration of AS microbes at concentrations ranging from 0.5 to 1.5 g/L, although both exhibited some inhibitory effects on nitrification. Under the conditions of this study, PCA was biodegradable by AS while mPCA was not.
Introduction
S
Hydrazine and monomethylhydrazine are considered a hazard to human health. The National Institute of Safety and Health (NIOSH) consider MMH and HZ to be potential occupational carcinogens. The Occupational Safety and Health Administration (OSHA) issued the permissible exposure limit (PEL) as 1 ppm (1.3 mg/m3) in air for HZ and 0.2 ppm (0.35 mg/m3) in air for MMH. The PEL concentration indicates the concentration of the substance that should not be exceeded. The PEL is given as an 8-h total weight average, which represents the average exposure over an 8-h period. Some short-term health effects of getting in contact with MMH include diarrhea, vomiting, and respiratory system irritation; and getting in contact with HZ can cause eye, nose, throat irritation, dizziness, nausea, dermatitis, and skin and eye burns. Long-term effects of HZ and MMH are not available on humans, but in animals the observed chronic effects of HZ include effects on the respiratory system, liver, and thyroid; MMH effects on animals include impairment of the kidneys and liver function, effect on the blood and spleen, and convulsions (HSDB, 1993).
Because MMH and HZ is extensively used in the aerospace and manufacturing industry, different methods to treat MMH and HZ wastes have been studied. Greene et al. (2009) reviewed some of these methods that included adsorption using an inert media, then containerization (which still has the potential to air oxidize and generate sufficient heat to ignite with HZ, so it still requires incineration), catalytic decomposition (only appropriate for HZ and fire can occur if HZ is not appropriately diluted), and dilution and chlorination with hypochlorite (mostly used for treatment of hydrazine spills, but it produces carcinogens such as N-nitroso, alkylochlorides, and others when it is used with MMH). Currently, Kennedy Space Center (KSC) produces mainly HZ and MMH and small quantities of UDMH waste. The combined volume of waste for these diluted hydrazines at KSC is 15,000 gallons per year (Oropeza, 2011). KSC presently neutralizes the hydrazine wastes using citric acid. Adding citric acid to the hydrazine wastewater causes an entrapment (chelation) of the hydrazine molecule to prevent off-gassing of toxic hydrazine vapors; the resultant solution is treated as a hazardous product and is disposed of by incineration. The reaction with citric acid is reversible and is dependent on the pH of the solution (Schmidt, 2001; Oropeza, 2011).
A novel method of remediating hydrazine-contaminated equipment and surfaces was patented by researchers at New Mexico Highlands University (NMHU) (Helvenston, 2006). The proposed method for HZ and MMH waste treatment consists of using α-ketoglutaric acid (AKGA), which reacts with hydrazine to form the stable pyridazine product 1,4,5,6-tetrahydro-6-oxo-3-pyridazinecarboxylic acid (PCA) and water. When this AKGA compound reacts with MMH it forms another stable pyridazine product 1-methyl-1,4,5,6-tetrahydro-6-oxo-3-pyridazinecarboxylic acid (mPCA) and water.
These reactions were extensively researched and validated by other authors (Evans and Wiselogle, 1945; Kline and Cox, 1961; Oropeza, 2011). Equations (1) and (2) show the reaction of AKGA with HZ and MMH to form PCA and mPCA respectively.


For AKGA to be an appropriate substitute for hazardous waste incineration for hydrazine waste treatment, the by-products, PCA and mPCA, should be safe for disposal to the comparatively lower-cost wastewater treatment plant method. Current literature fails to address the toxicity and biodegradability of mPCA and provides limited information on PCA. According to LaRue and Child (1979), a species of Pseudomonas isolated from a soil sample can use PCA as a source of N and C for growth, indicating that this specific species has the ability to degrade PCA by cleaving its N-N bond. Bacterial growth was maintained in a medium containing a concentration of 5.0 g/L of PCA indicating that PCA at this concentration is nontoxic to this organism.
In 2010, initial toxicity screening tests on AKGA and HZ or MMH mixtures were conducted by Hydrosphere and subsequently reported by Noreen Mayberry-Kann at NASA's Johnson Space Center (NASA/JSC). Bioassay tests using the freshwater species Ceriodaphnia dubia (invertebrate) and Cyprinella leedsi (vertebrate), and the saltwater species Mysidopsis bahia (invertebrate) and Menidia beryllina (vertebrate) were used to test for acute toxicity with three simulated waste streams with the following characteristics: pH was adjusted in all tests to 8.0 using 1 N sodium hydroxide (1) 1 M AKGA diluted to 0.002 with water, (2) 1 M AKGA+1 M HZ diluted to 0.002 with water, and (3) 1 M AKGA+1 M MMH diluted to 0.002 with water.
The toxicity of these solutions was found to be “mild” to “not acute” for all the species but C. dubia. Solution (3) caused 100% mortality on this organism when it was exposed to the 0.002 M solution of MMH and AKGA. The NASA/JSC toxicology group recommended that all the solutions should be diluted to 0.001 M or 50% of the 0.002 M solution for effluent disposal (Oropeza, 2011).
This study was undertaken to further determine whether PCA and mPCA have negative effects on the biomass (mixed liquor) from a sewage treatment plant and to evaluate its effect on freshwater species of fish and crustaceans on the assumption that the outflow water may still contain some remaining concentrations of PCA and mPCA. Last, testing was performed to estimate the biodegradability of these chemicals using a sample of activated sludge (AS) biomass.
Experimental Protocols
Acute toxicity on fish and crustaceans
Four separated 96 h static tests with renewal at 48-h were conducted. In static renewal tests, the test organisms are exposed to a fresh solution of the test substance every 48 h. The test organisms selected for this study are among those recommended by USEPA (2002) for acute toxicity testing. The freshwater species C. dubia and Pimephales promelas (Fathead minnows) were used as the test species in these toxicity tests. Each organism was tested for acute toxicity for both PCA and mPCA following the methods for acute toxicity by USEPA method EPA-821-R-02-012 (USEPA, 2002). Test organisms were obtained from Marinco Bioassay Laboratory (MBL) located in Sarasota, Florida and delivered the same day as test initiation. PCA and mPCA were evaluated for acute toxicity using 0.5, 0.75, 1.0, 1.25, and 1.5 g/L PCA and mPCA in addition to a blank control (mineral water without the addition of PCA or mPCA). Four replicates per concentration were used in all the tests; 5 and 10 organisms were used per replicate on the C. dubia and P. promelas tests respectively. The number of surviving organisms was recorded daily and the percentage survival was expressed as the number of living organisms after 96-h exposure for each concentration of the test chemicals over the initial number of organisms used.
Before performing the acute toxicity tests using PCA and mPCA, at least six standard reference tests (SRT) per test organism using sodium chloride as the reference substance were performed. These SRT used the same test organisms and methods from the PCA/mPCA test to evaluate the precision of the technique used in these analyses. Another parameter to be determined is LC50, which is the lethal concentration that would kill 50% of the population of the organisms, which was calculated following the recommended statistical methods referenced in the method used in this research (USEPA, 2002).
Treatment efficiency and viability
The effect of mPCA and PCA on treatment efficiency and bacterial viability were estimated from respiration inhibition tests on AS (USEPA, 2012) and heterotrophic plate counts (APHA, 2005).
Respiration inhibition tests
All respiration inhibition tests were performed at a constant lab temperature of 21°C±1°C. A freshly collected mixed liquor sample from a wastewater treatment facility located in Cape Canaveral Air Force Station (Cape Canaveral, FL) was used as the inoculum on each test. The sample was collected in plastic containers and transported in coolers from the wastewater treatment facility to the University of Central Florida. After arrival at the lab, the mixed liquor sample was homogenized in a blender for 20 s. Then, it was allowed to settle for about 20 min and a portion of the supernatant was removed to increase the concentration of the suspended solids. Later, a 20 mL sample was taken to analyze its mixed liquor suspended solids (MLSS) concentration. Knowing the concentration of the concentrated MLSS inoculum, the volume required to prepare 1.2–1.6 g/L of MLSS on a 500 mL solution was calculated. A fresh stock solution of synthetic wastewater (SWW) was prepared the day of the test. This SWW stock solution was composed of (in g/L) peptone (16), meat extract (11), 3CO(NH2)2 (3), NaCl (0.7), CaCl2·2H2O (0.4), MgSO4·7H2O (0.2), and K2HPO4 (2.8) using deionized water (DI). Each sample contained a solution composed of 16 mL of SSW+PCA/mPCA (no in the blank controls)+DI. The test was initiated after a volume of the concentrated inoculum was added to each sample making a final sample solution volume of 500 mL. The final concentration of the MLSS was 1.21 g/L in the PCA test and 1.60 and 1.62 g/L in the mPCA-1 and mPCA-2 tests respectively.
Sets of three samples were initiated at the same time and each set was prepared at 15 min intervals from each other. The dissolved oxygen (DO) concentration of each sample was measured using a HQ40d Portable Dissolved Oxygen meter (Hach Company, Loveland, CO). First, the sample was aerated for 30 or 180 min, then aeration ceased. Once the air was cut off the DO concentration was recorded for 10 min at 1 min intervals. The Total between Oxygen Uptake Rate (TSOUR) in the blank controls (containing SWW+concentrated inoculum+DI) and in the test samples (PCA/mPCA+16 mL of SWW+concentrated inoculum+DI) was determined using only the dissolved oxygen values found in the linear part of the graph of the oxygen concentration versus time. The percentage of TSOUR inhibition (IT) from the samples containing PCA/mPCA compared to the control was determined using Equation (3).
where RT is the average TSOUR from the test samples containing PCA or mPCA and RTB is the average TSOUR from the initial and final (time zero and end time, i.e., 30 or 180 min) blank control samples. Controls samples were prepared at the beginning of the test and after all the other samples were initiated. From the IT values obtained from different concentrations of PCA and mPCA and using the Spearman Karber Trimmed method (Hamilton et al., 1977), the TSOUR inhibition concentration (IC50) was determined.
In addition, a group of samples containing a nitrification inhibitor (N-allylthiourea, ATU) were prepared concurrent to the TSOUR test using the same concentrations of PCA or mPCA used to measure the TSOUR to determine whether these chemicals had an effect on nitrifiers. Sample preparation was the same as in the test sample vessels, but included 11.6 mg/L ATU. They consisted of initial and final blank controls (ATU+SWW+biomass+DI) and the sample tests (ATU+SWW+PCA or mPCA+biomass+DI). The percentage heterotrophic inhibition (IH) was determined using Equation (4).
where RH represents the Carbonaceous Specific Oxygen Uptake Rate (CSOUR) determined from the test samples containing ATU, and RHB represents the average CSOUR from the blank control samples containing ATU.
The percentage nitrification respiration inhibition (IN) was calculated using Equation (5).
where RT represents the TSOUR from test samples without ATU and RTB the total SOUR from the blank control samples without ATU.
The relationship between TSOUR, CSOUR, and the Nitrogenous Specific Oxygen Uptake Rate (NSOUR) is given by Equation (6).
Viability
After exposing the biomass for 4 h to mPCA and PCA, 0.1 mL samples from the vessels containing 750 mg/L PCA or mPCA from the respiration inhibition tests were diluted by a factor of 10−4 using a 0.1% peptone solution (Peptone+DI) and then 0.1 mL was spread on Petri dishes containing R2A agar to analyze whether mPCA and PCA might have an effect on the viability of heterotrophic bacteria compared to a control. This test was performed according to the Standard Methods for the Examination of Water and Wastewater Method 9215 (APHA, 2005). After spreading the samples, the samples were incubated for 7 days at 28°C. On day 7, the colonies from each Petri dish were counted to determine whether exposure to the test chemicals had an effect on the number of colony-forming units (CFUs) compared to a control sample.
Microbe degradation of PCA and mPCA
The biotic degradability of PCA and mPCA was estimated based on the method described in EPA OPPTS 835.3110 Ready Biodegradability-Closed Bottle Test (USEPA, 1998). This test consists of a test substance diluted in a mineral solution, which is then inoculated using wastewater microbes and incubated under aerobic conditions in the dark at 20°C for 28 days. To prevent limitations on the microbial activity due to low levels of oxygen in the sample, the DO concentration has to be greater than 0.5 mg/L at the end of the test. To achieve this objective in this study, the concentrations of the test substances to be used in the tests were determined using their theoretical oxygen demand (ThOD). Since the chemical formula for mPCA (C6H8N2O3) and PCA (C5H6N2O3) were known, their ThODs were calculated using Equation (7).
where ThOD NO 3 is the ThOD of the substance including both carbonaceous and nitrogenous oxygen demand. The ThOD NO 3 for mPCA and PCA were determined as 1.84 and 1.69 mg O2 per mg of test substance, respectively.
Assuming that nitrification does not occur (i.e., the carbonaceous oxygen demand) the ThOD was determined from Equation (8).
The ThOD NH 3 for mPCA and PCA were calculated as 1.025 and 0.788 mg O2 per mg of test substance, respectively.
The biochemical oxygen demand (BOD) for a given day in the test was calculated using Equation (9).
where, n represents the number of days after test initiation; DOs0 is the average dissolved oxygen at test initiation in the bottles containing the test substance; DOsn is the dissolved oxygen after n days in the test substance; DOc0 is the average dissolved oxygen at test initiation for the inoculated control bottles; and DOcn represents the dissolved oxygen after n days for the inoculated control bottles.
Knowing the BOD and the ThOD, the percent degradation was calculated in the following way:
Two biodegradation tests were performed on PCA and mPCA using freshly collected mixed liquor samples from the same previously mentioned wastewater treatment facility located in Cape Canaveral Air Force Station as the inoculum. The mixed liquor sample was allowed to settle for 1 h. Then, a portion of the supernatant was decanted and kept under aerobic conditions for a maximum time of 2 h until it was needed as inoculum. All samples were diluted using mineral dilution water (MDW) prepared using Hach BOD Nutrient Buffer pillows, product # 2436466 (Hach Company) and kept in the dark for up to 28 days at 20°C. A known readily biodegradable substance, potassium hydrogen phthalate (KHP), was used to evaluate the lab technique used in both tests. Test 1 consisted of different sets of BOD bottles containing (i) AS+MDW as the inoculated blank control, (ii) two sets, one of 2 mg/L and another of 5 mg/L PCA or mPCA+AS+MDW to evaluate biodegradation of the test substances, (iii) 5 mg/L PCA or mPCA+3.4 mg/L KHP+AS+MDW to determine whether PCA and mPCA were inhibitory to the diluted AS sample, and (iv) 3.4 mg/L KHP+AS+MDW to verify the lab technique. Biodegradation test 2 was similar to test 1 but only 2 mg/L of PCA or mPCA was evaluated using 0.6 mL of inoculum (i.e., dilute AS mixed liquor supernatant) per BOD bottle instead of 2.0 mL of inoculum, which was used in test 1. Using less inoculum reduced the amount of readily biodegradable material that could be contained in the inoculum. In addition, 0.16 g of a nitrification inhibitor, 2-chloro-6-(trichloromethyl) pyridine (Formula 2533; Hach Co., Loveland, CO), was added to each 300 mL BOD bottle from sets with the same characteristics as mentioned previously to prevent oxygen consumption from nitrification to occur. This nitrification inhibitor was used instead of ATU as it was readily available for the tests, and it is commonly used in BOD analyzes.
The dissolved oxygen concentration was measured at 0, 7, 14, 21, and 28 days in test 1 and 0, 7, 14, 21, and 27 days in test 2 after test initiation (DO measurements were taken on day 27 instead of day 28 in test 2 because the lab was not accessible on day 28). The BOD was calculated and the percentage degradation was estimated as the ratio of the BOD to the ThOD of the organic substance at each time interval.
Results
Aquatic toxicity
From the acute toxicity tests performed using mPCA on C. dubia; the lethal concentration that would kill 50% of the population (LC50) was estimated at 0.77±0.6 g/L (with a 95% confidence level, 95% CL) using the Trimmed Spearman-Karber method (Hamilton et al., 1977). The no observable effect concentration (NOEC) was estimated at 0.5 g/L by hypothesis testing following the Dunnett procedure (Dunnett, 1955). On the other hand, the mortality of the minnows was not high enough to determine the LC50, but it was noticed that starting at 0.5 g/L, mPCA had an effect on the behavior of the fish. Abnormal behavior observed included loss of equilibrium and curved spine. The NOEC on the minnows was estimated at 0.75 g/L using the Dunnett procedure.
The toxicity tests using PCA did not exhibit a significant effect on fish and crustaceans. There was no mortality at any of the concentrations used on the minnows and 20% mortality was observed on the C. dubia at 1.25 and 1.50 g/L. The NOEC for both species was estimated at 1.50 g/L since it was the largest concentration tested. The Steel's Many-one Rank Test (Steel, 1959) was used to estimate the NOEC in the C. dubia. Even though there was 20% mortality at the two highest concentrations, from hypothesis testing it was found that the mortality at these concentrations was not significantly different from the control. Table 1 summarizes the results from the acute toxicity tests performed in this study.
Four replicates were used per concentration and in the control sample.
mPCA, 1-methyl-1,4,5,6-tetrahydro-6-oxo-3-pyridazinecarboxylic acid; PCA, 1,4,5,6-tetrahydro-6-oxo-3-pyridazinecarboxylic acid.
95% CL, 95% confidence level; NOEC, no observable effect concentration.
These results show that PCA has LC50 toxicity greater than 1.5 g/L for both species and mPCA has LC50 toxicity of 0.77 g/L and greater than 1.5 g/L for C. dubia and P. promelas, respectively. For comparison, hydrazine has a toxicity of 3.85 mg/L LC50 as determined in a 90-h, hard water test or 0.61 mg/L LC50 using soft water instead (Slonim, 1977). Hydrazine is more toxic to similar freshwater species tested than PCA, the product of the reaction of HZ with AKGA. MMH is over 200 times more toxic to a similar freshwater species than mPCA, the product of the reaction of MMH with AKGA.
Microbe treatment efficiency and viability
For each batch of AS used in the respiration inhibition tests performed in this study, the total respiration sensitivity of the AS was checked by using a reference substance (3,4-dichlorophenol, i.e., 3,4-DCP). By following the method described before, the IC50 from the experiments were estimated and they were within the recommended range for total respiration (Table 2) from the ISO 8192 (ISO, 2007) and OECD 209 (OECD, 2010) methods (IC50 for 3,4-DCP between 2 and 25 mg/L). The IC50 in test mPCA-2 was slightly below the USEPA recommended range of 5–30 mg/L for 3,4-DCP (USEPA, 2012). Two tests were performed using mPCA compared to one for PCA because there was some variation within the respiration rates obtained from the different replicates in the set of reactors containing 1,500 mg/L mPCA from the mPCA-1 test. The PCA and mPCA-1 tests examined the chemicals at 15, 150, and 1,500 mg/L, and the mPCA-2 test studied mPCA at 375, 750, and 1,500 mg/L with the addition of a PCA sample at 750 mg/L.
The percentage inhibition values labeled C1 and C2 were determined based on the initial or final controls instead of the average between them. In the PCA test, two different aeration sources were used causing temperature differences between the samples. Thus, the percentage inhibition was determined using the control that was aerated with the same aeration source instead of the average between them. C1, percent inhibition determined based on the initial control; C2, percent inhibition determined based on the final control. All the other percentage inhibition values were determined based on the average between the initial and final controls. From the respiration inhibition tests, the IC50 for mPCA and PCA on AS microbes was estimated to be greater than the maximum concentration evaluated (1.5 g/L).
AS, activated sludge; NM, no measurement.
Table 2 presents the percentage total respiration inhibition of PCA and mPCA on the AS samples used in this study relative to their blank controls, the sensitivity of the AS samples used in each experiment using the reference substance 3,4-DCP at different concentrations, and the IC50 for PCA, and mPCA. The respiration rate of the AS was measured at 30 and 180 min after test initiation. Neither PCA nor mPCA resulted in 50% inhibition within the concentration range studied.
Figures 1–3 summarize the observed TSOURs, CSOURs, and NSOURs. From these figures, the TSOURs of the samples containing PCA appeared to be lower than the TSOUR of its control. There was not enough data to conduct robust statistical conformation of this, but by using the variability of the replicates (some parameters were run in triplicate) it was possible to determine whether the values±one standard deviation of the control and experimental TSOURs overlapped. In this context the only TSOUR (from the samples with replicates) that was lower or greater than the corresponding control was observed in the 1,500 mg/L PCA sample at 30-min. The control was 7.91±0.54 mg O2/g-h and the 1,500 mg/L PCA TSOUR was 6.93±0.21 mg O2/g-h. The standard deviations did not overlap, which suggests that the decrease in TSOUR was due to the presence of PCA, and not just due to the variability of the SOUR test. This analysis was also conducted for the CSOUR values and again only the 1,500 mg/L PCA tests (this time in both 30 and 180 min) showed the possibility of not overlapping. Unfortunately no replicates were run for the 1,500 mg/L PCA CSOURs so it is only by looking at the variability for the overall test (i.e., the samples where replicates were run), and the very low variability of the CSOUR control tests (4.67±0.10 and 4.30±0.06 for the 30 and 180-min tests respectively) that we can conclude that there probably was a real difference in the CSOUR at 1,500 mg/L PCA. However, in this case the CSOUR was higher than the control values, not lower.
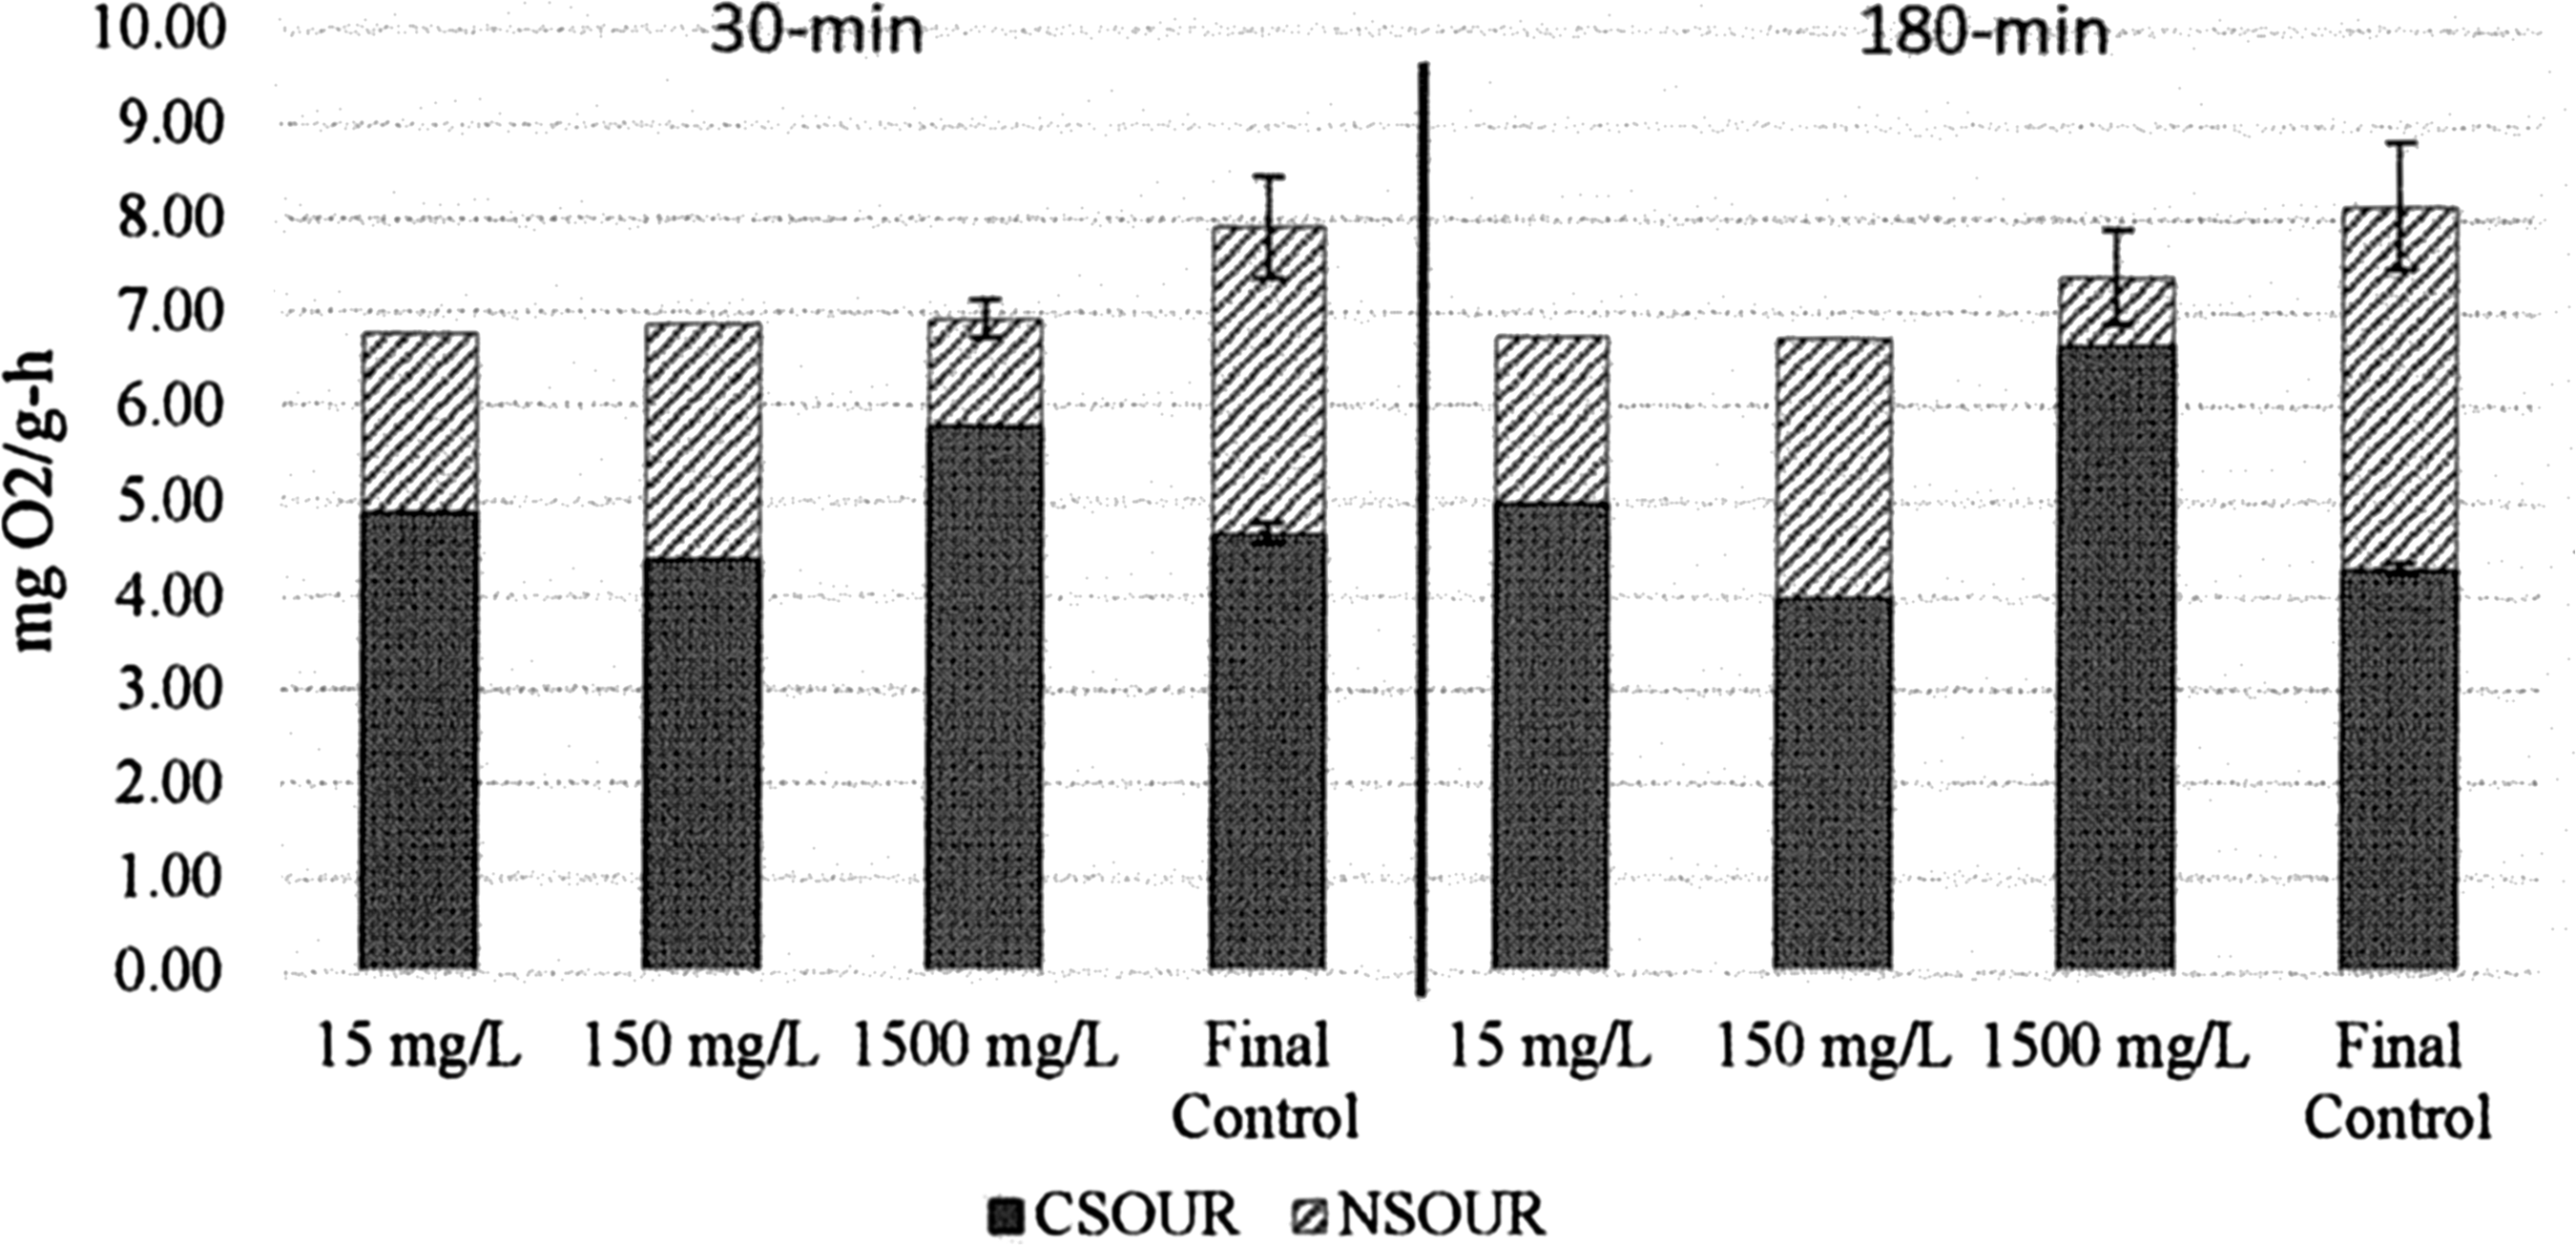
1,4,5,6-Tetrahydro-6-oxo-3-pyridazinecarboxylic acid (PCA) test. Specific Oxygen Uptake Rate (SOUR) after 30 and 180 min of exposure to different PCA concentrations. The high of the bars represents the Total Specific Oxygen Uptake Rate (TSOUR) for each sample. The error line above the bars represents the standard deviation of the TSOUR when available. The error line above the Carbonaceous Specific Oxygen Uptake Rate (CSOUR) area represents the standard deviation of the CSOUR sample when available. Nitrogenous Specific Oxygen Uptake Rate (NSOUR) as mentioned before was estimated by subtracting CSOUR from its TSOUR.

1-Methyl-1,4,5,6-tetrahydro-6-oxo-3-pyridazinecarboxylic acid (mPCA)-1 test. SOUR after 30 and 180 min of exposure to different mPCA concentrations. The high of the bars represents the TSOUR for each sample. The error line above the bars represents the standard deviation of the TSOUR when available. The error line above the CSOUR area represents the standard deviation of the CSOUR sample when available. NSOUR as mentioned before was estimated by subtracting CSOUR from its TSOUR.
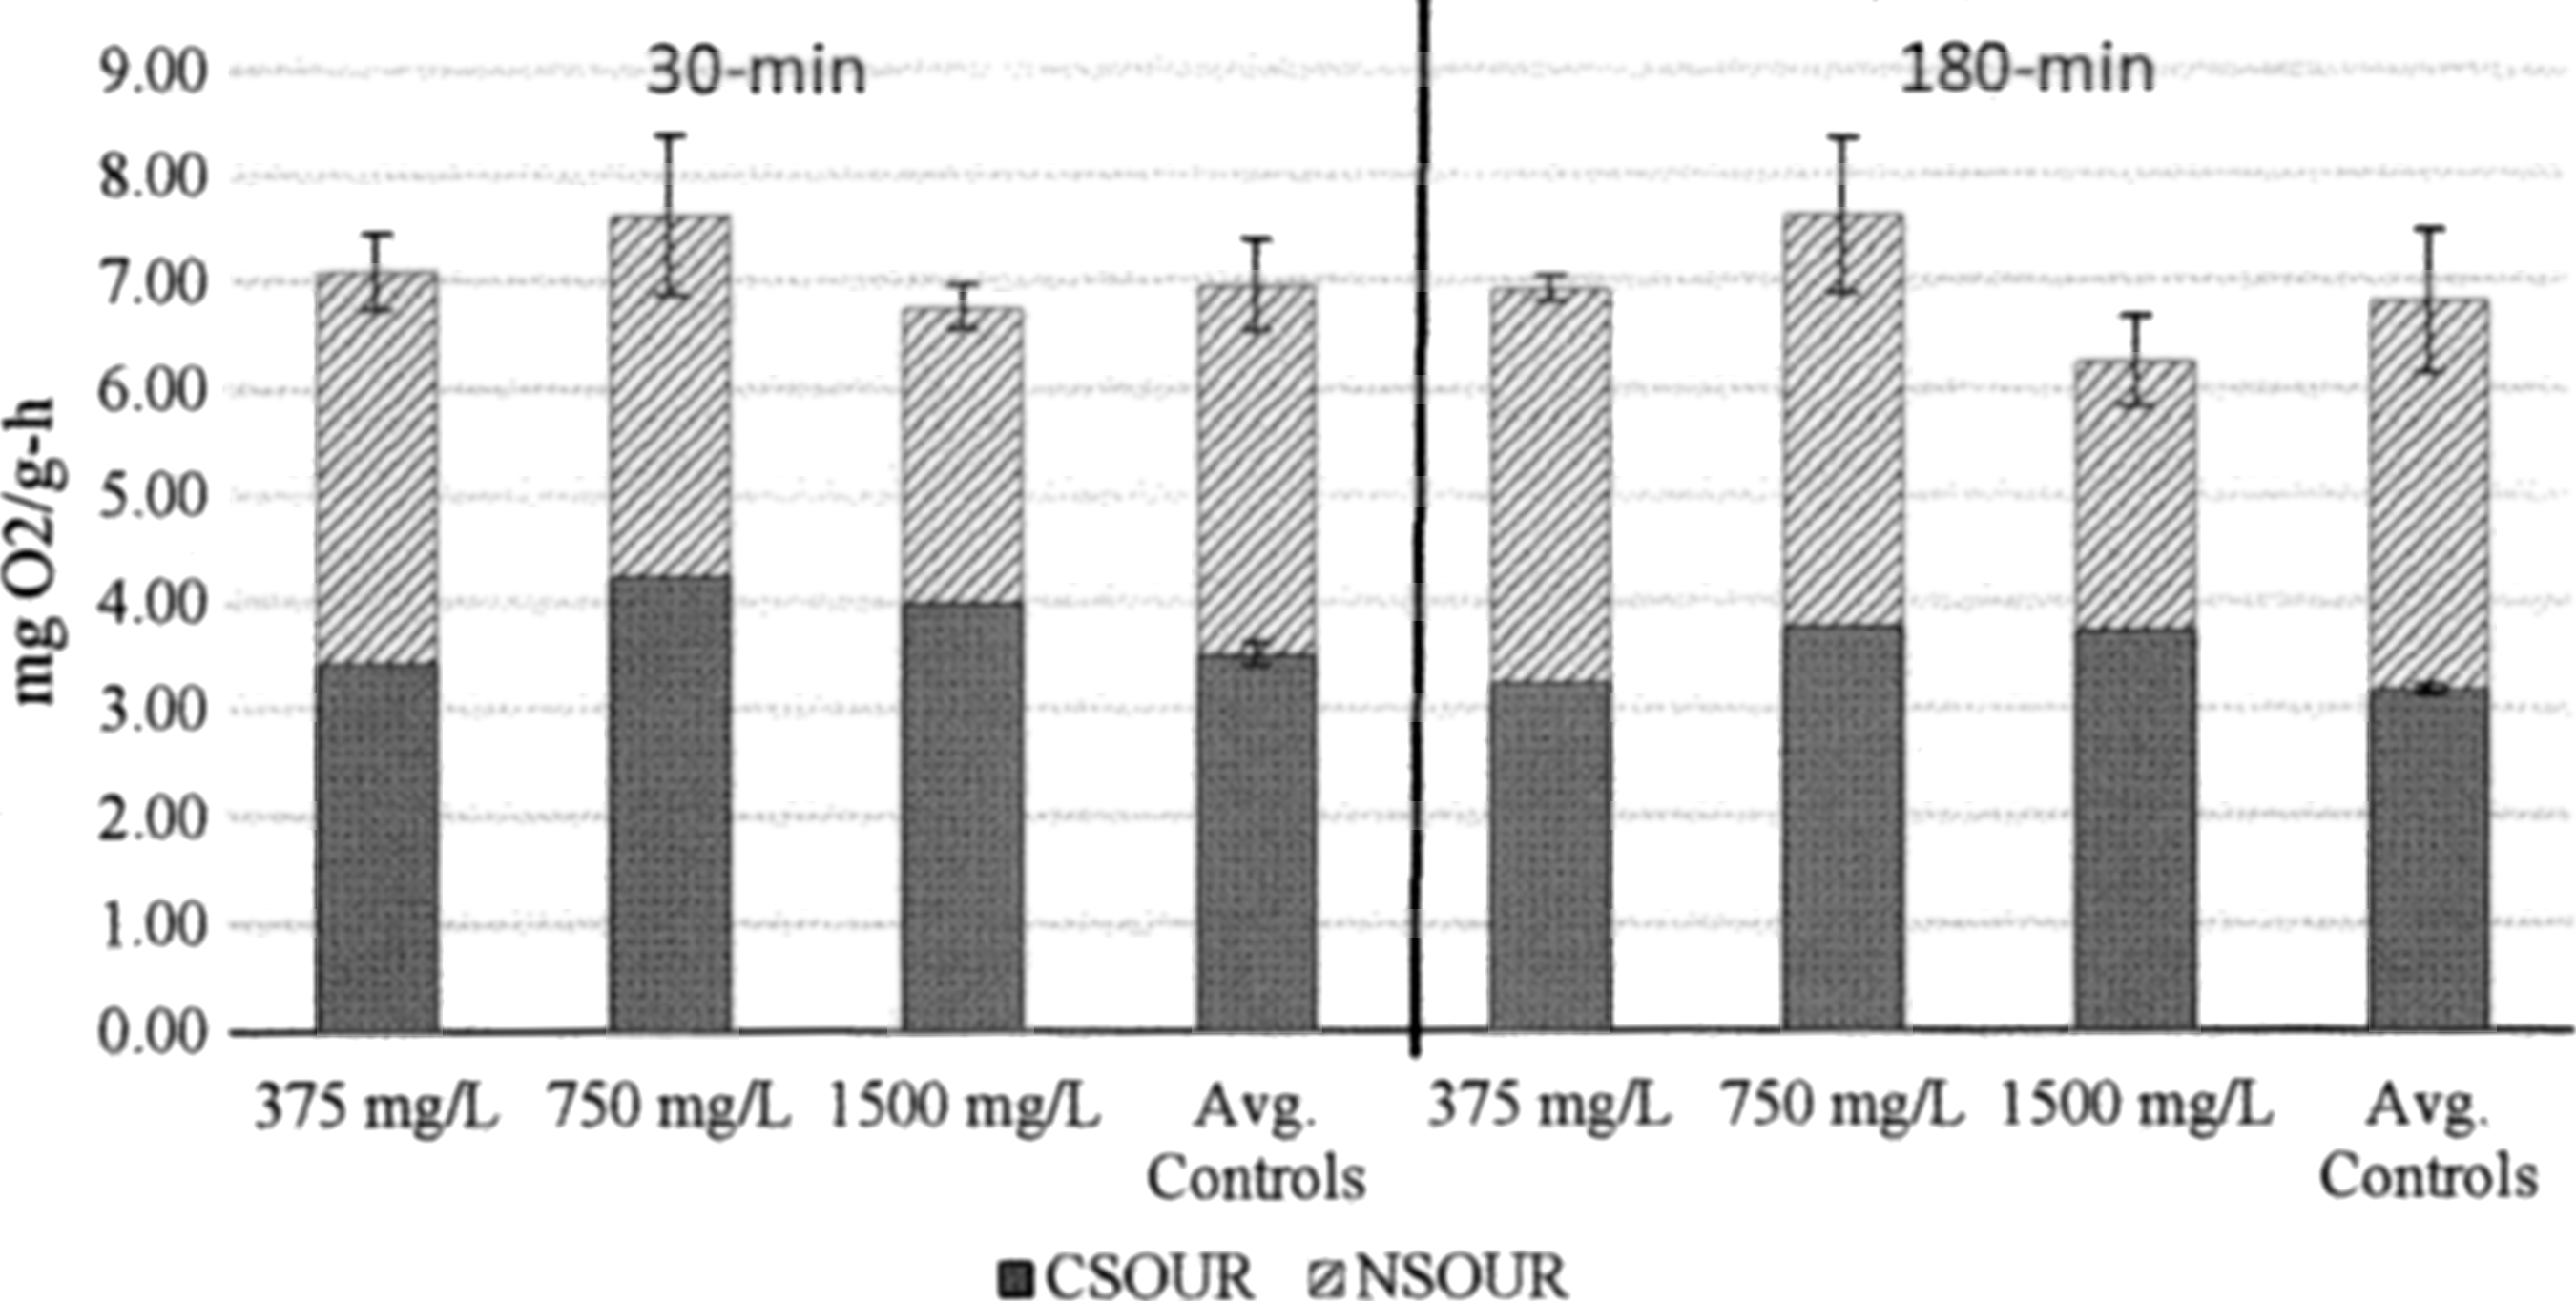
mPCA-2 test. SOUR after 30 and 180 min of exposure to different mPCA concentrations. The high of the bars represents the TSOUR for each sample. The error line above the bars represents the standard deviation of the TSOUR when available. The error line above the CSOUR area represents the standard deviation of the CSOUR sample when available. NSOUR as mentioned before was estimated by subtracting CSOUR from its TSOUR.
Therefore, there are two major observations: (1) the 1,500 mg/L PCA TSOUR was lower than the control TSOUR at 30 min, but not at 180 min. It is notable that this was also true at 15 and 150 mg/L PCA (although no replicates were run at those concentrations). The real question is why the TSOUR control values were so high at both 30 and 180 min. This may have been due to temperature differences between the samples, but unfortunately no temperature data were obtained for all the replicates in the control (the few temperature measurements in the control for TSOUR were higher than in the samples containing PCA). The second observation was (2) the 1,500 mg/L PCA CSOUR was higher than the CSOUR in the controls at both 30 and 180 min. This may have been because the CSOUR at 1,500 mg/L PCA and 30 min was run at a temperature of 22.9°C compared to 20.8°C for the control. Or this may have been because PCA interacted with ATU in some way to prevent the inhibition of nitrifiers. A third possibility is that PCA biodegraded enough to exert an additional carbonaceous oxygen demand. If this third hypothesis is true then the low calculated NSOURs may have been due to inhibition of nitrification due to PCA (65% and 88% inhibition at 30 and 180 min, respectively).
For mPCA the 1,500 mg/L TSOURs were always the lowest average TSOUR values observed. However, in all cases the standard deviation overlapped between the 1,500 mg/L TSOURs and the controls. However, CSOURs were not lower. Thus, the calculated NSOURs at 1,500 mg/L mPCA were much lower than the controls or the 15 and 150 mg/L mPCA samples (mPCA-1 test, 29% and 50% NSOUR inhibition after 30 and 180 min; mPCA-2 test, 20% and 31% NSOUR inhibition after 30 and 180 min, respectively).
Taking into account the 750 mg/L TSOURs for both PCA and mPCA in the mPCA-2 experiments it can be concluded that there was no inhibition of TSOURs at 750 mg/L or less for either compound. For mPCA there was no apparent inhibition of either heterotrophs or nitrifiers below 750 mg/L. With PCA the elevated control TSOURs in the PCA experiments makes it less certain that there was not some nitrification inhibition. However, the TSOUR observed at 750 mg/L PCA suggests that the difference between the 15 and 150 mg/L PCA TSOURs and the control was due to experimental error (e.g., temperature differences or etc.).
It is important to acknowledge that the NSOUR values have high cumulative errors since they are based on both the observed TSOUR and CSOUR, and they may be artifacts due to the variability of the measurements they are calculated from. It is notable, however, that the NSOUR values were low for all of the 1,500 mg/L PCA and mPCA samples tested, both for 30 and 180 min. So it may be that at high concentrations PCA and mPCA are inhibitory for nitrifiers, though this conclusion is tenuous at best. In contrast, no sign of carbonaceous/heterotrophic inhibition was observed for either PCA or mPCA at any of the concentrations tested.
Viability
The viability of heterotrophic organisms was estimated using standard heterotrophic plate counts to quantify culturability. Viable, nonculturable, organisms were assumed to be negligible or at least proportional to changes in the plate counts. The number of colonies observed for the samples of AS organisms exposed for 4 h to 750 mg/L of PCA (2.5×10⁷±6.6×10⁵ CFU/mL) and 750 mg/L of mPCA (2.6×10⁷±1.3×10⁶ CFU/mL) were similar to the number of colonies in the control (2.5×10⁷±6.2×10⁵ CFU/mL). Each sample was performed in duplicate and the colony count was calculated from the average of the duplicates.
Biodegradation
To assess the biodegradation of PCA and mPCA by AS organisms, two closed bottle biodegradation tests were performed. From the test guideline (USEPA, 1998), (i) the reference substance has to be degraded greater than 60% with respect to its ThOD within the initial 14 days after test initiation, (ii) the difference between the replicates after 28 days should be less than 20%, (iii) the residual concentration of oxygen in the BOD test bottles should not be lower than 0.5 mg/L at any time and (iv) oxygen demand in the inoculated control at the end of the test (28 days) should not exceed 1.5 mg/L DO. The criteria from the guideline were met when using a nitrification inhibitor (test 2). Without the nitrification inhibitor, the oxygen demand in the inoculated control was larger than 1.5 mg/L. This might be due to the nitrification of ammonia present in the inoculum used in this test.
Figure 4 shows the dissolved oxygen concentration of PCA, mPCA, and KHP in test 1. In this test, the oxygen depletion after 28 days of incubation in the samples containing mPCA was similar compared to the depletion observed in the inoculated control. The similarity indicates that the microbes were not able to use mPCA as an alternative source of energy or grow within the experimental incubation period. Adding PCA did increase the oxygen depletion in the BOD bottles. In the samples containing 2 and 5 mg/L of PCA, 2.46 and 5.43 mg/L of O2 was consumed, respectively. Comparing these values to their calculated ThOD, the percentage degradation for PCA at 2 and 5 mg/L was estimated as 67% and 59%, respectively (total ThOD of 1 mg/L mPCA=1.84 mg O2; total ThOD of 1 mg/L PCA=1.69 mg O2; total ThOD of 1 mg/L KHP=1.18 mg O2).
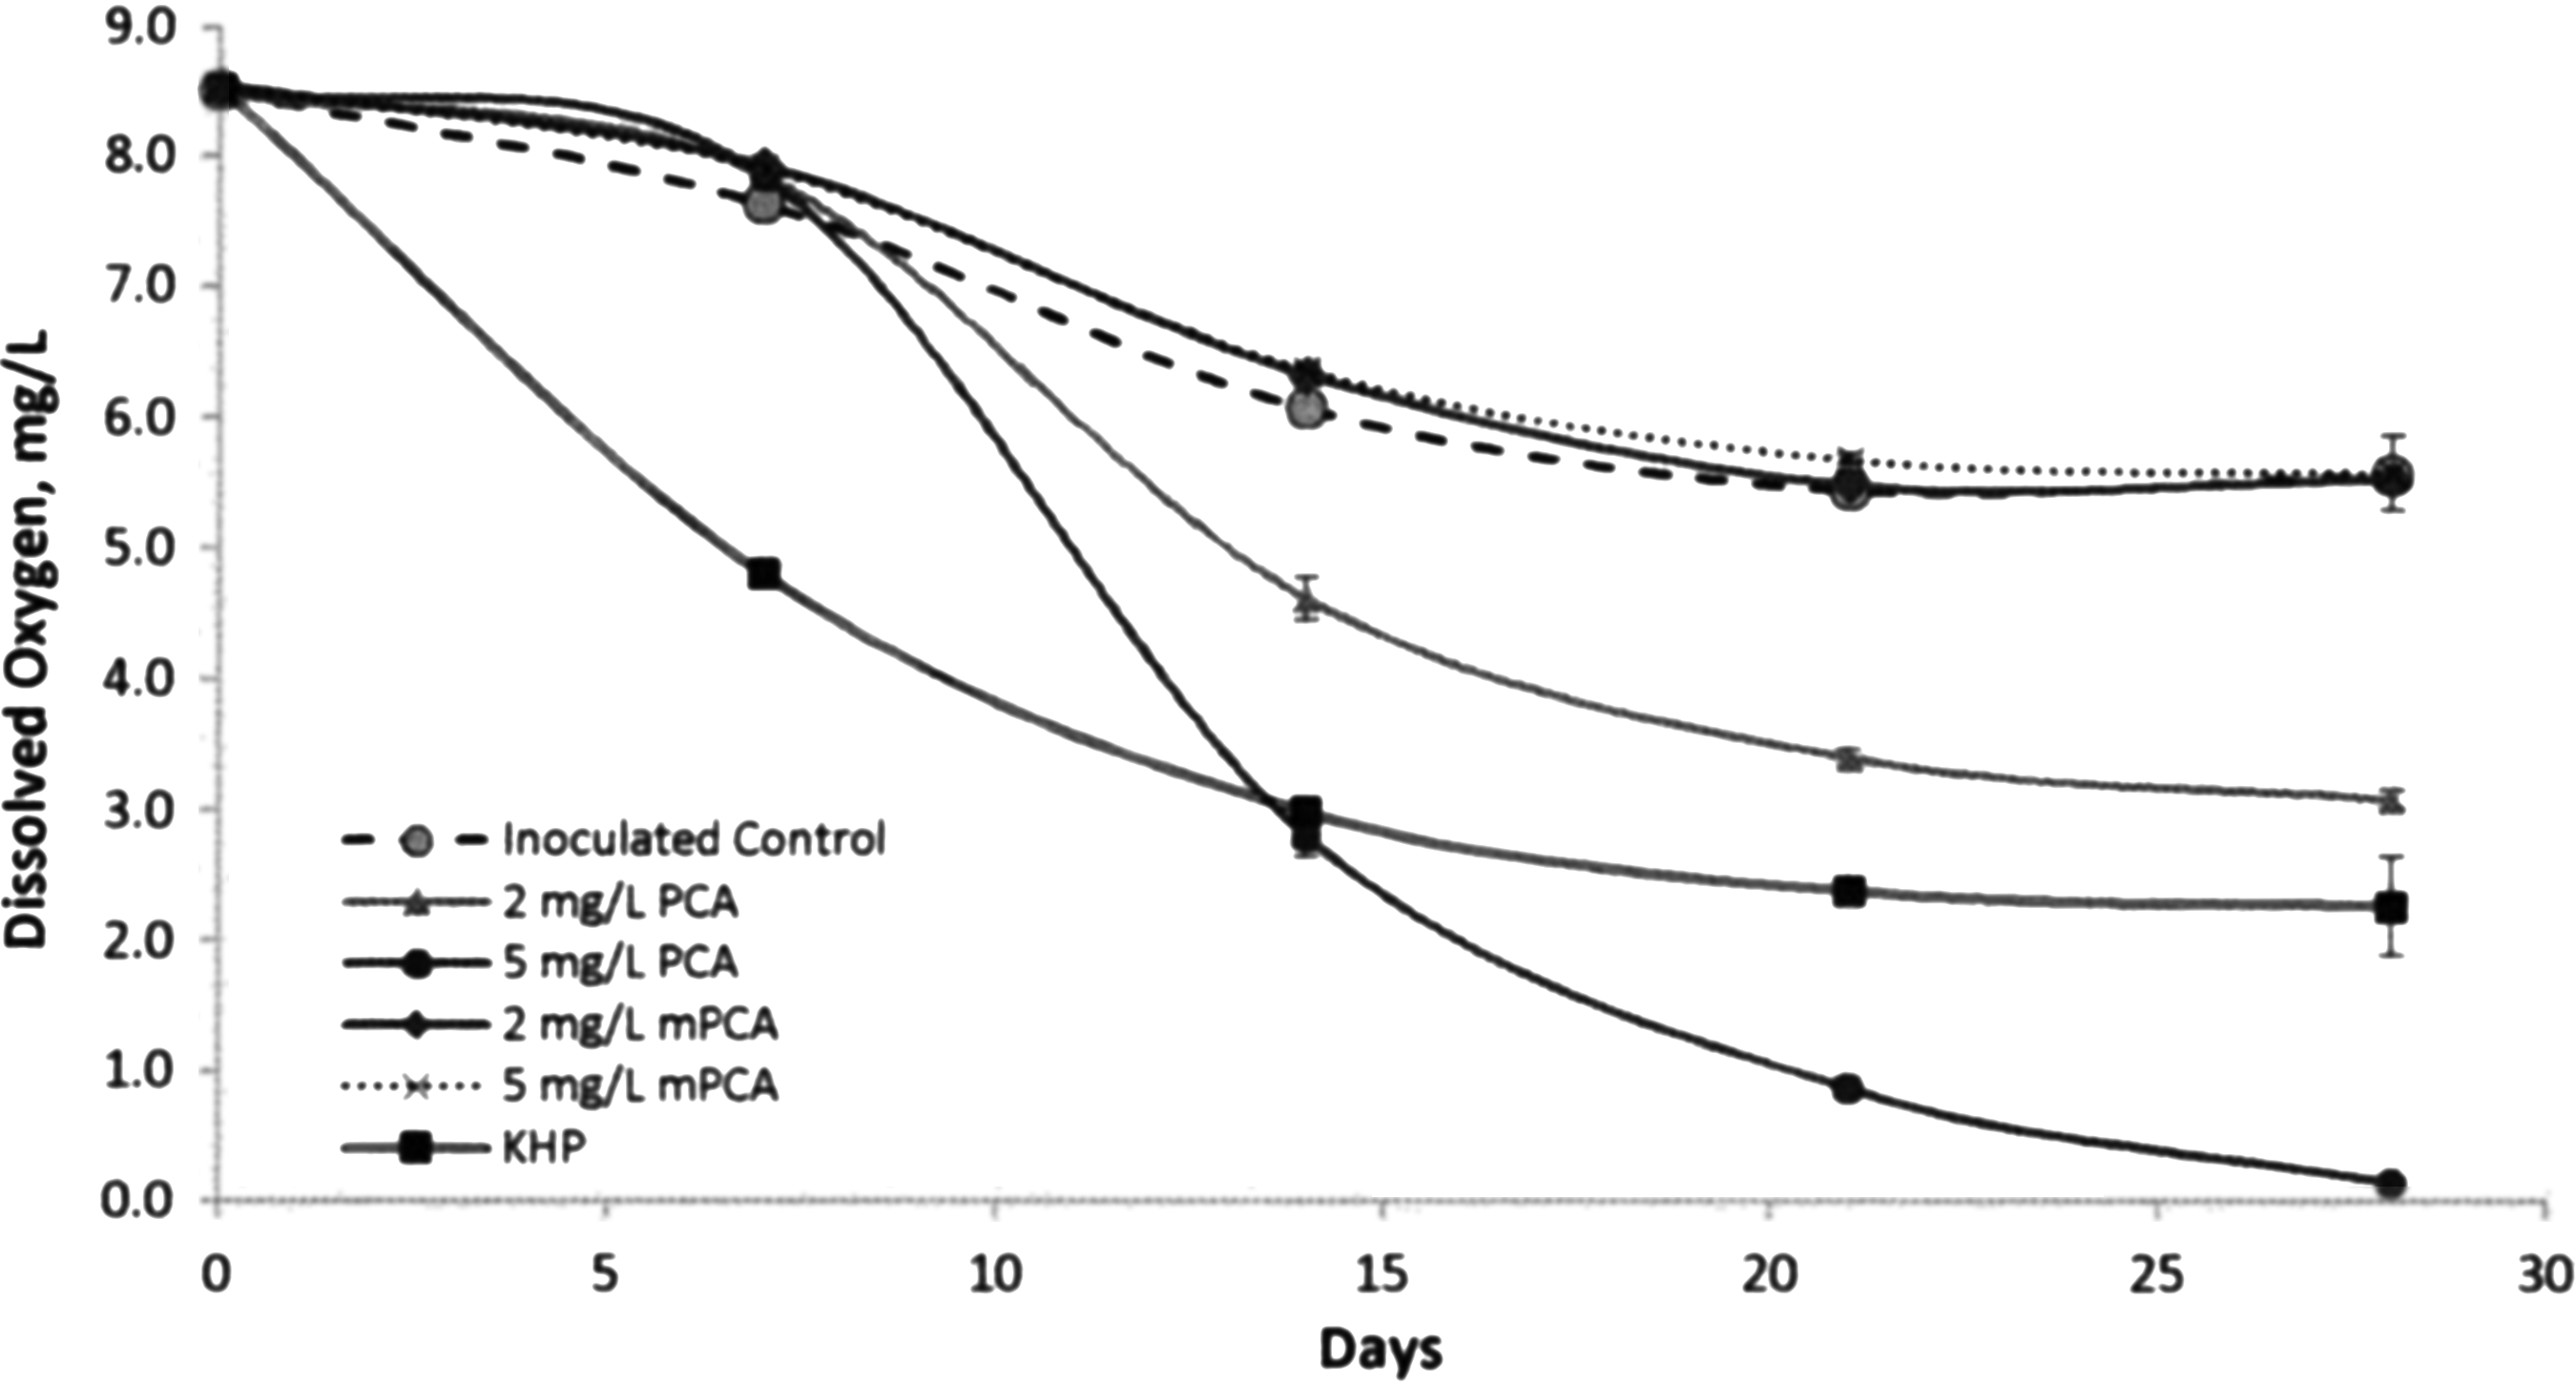
Biodegradation test 1, dissolved oxygen consumed on time with the standard error for the samples.
The results from degradation test 2 are summarized in Figures 5 and 6. The biodegradation test 2 used a smaller volume of the inoculum and included sets of bottles containing the test chemicals with the addition of a nitrification inhibitor to determine only the carbonaceous oxygen demand.
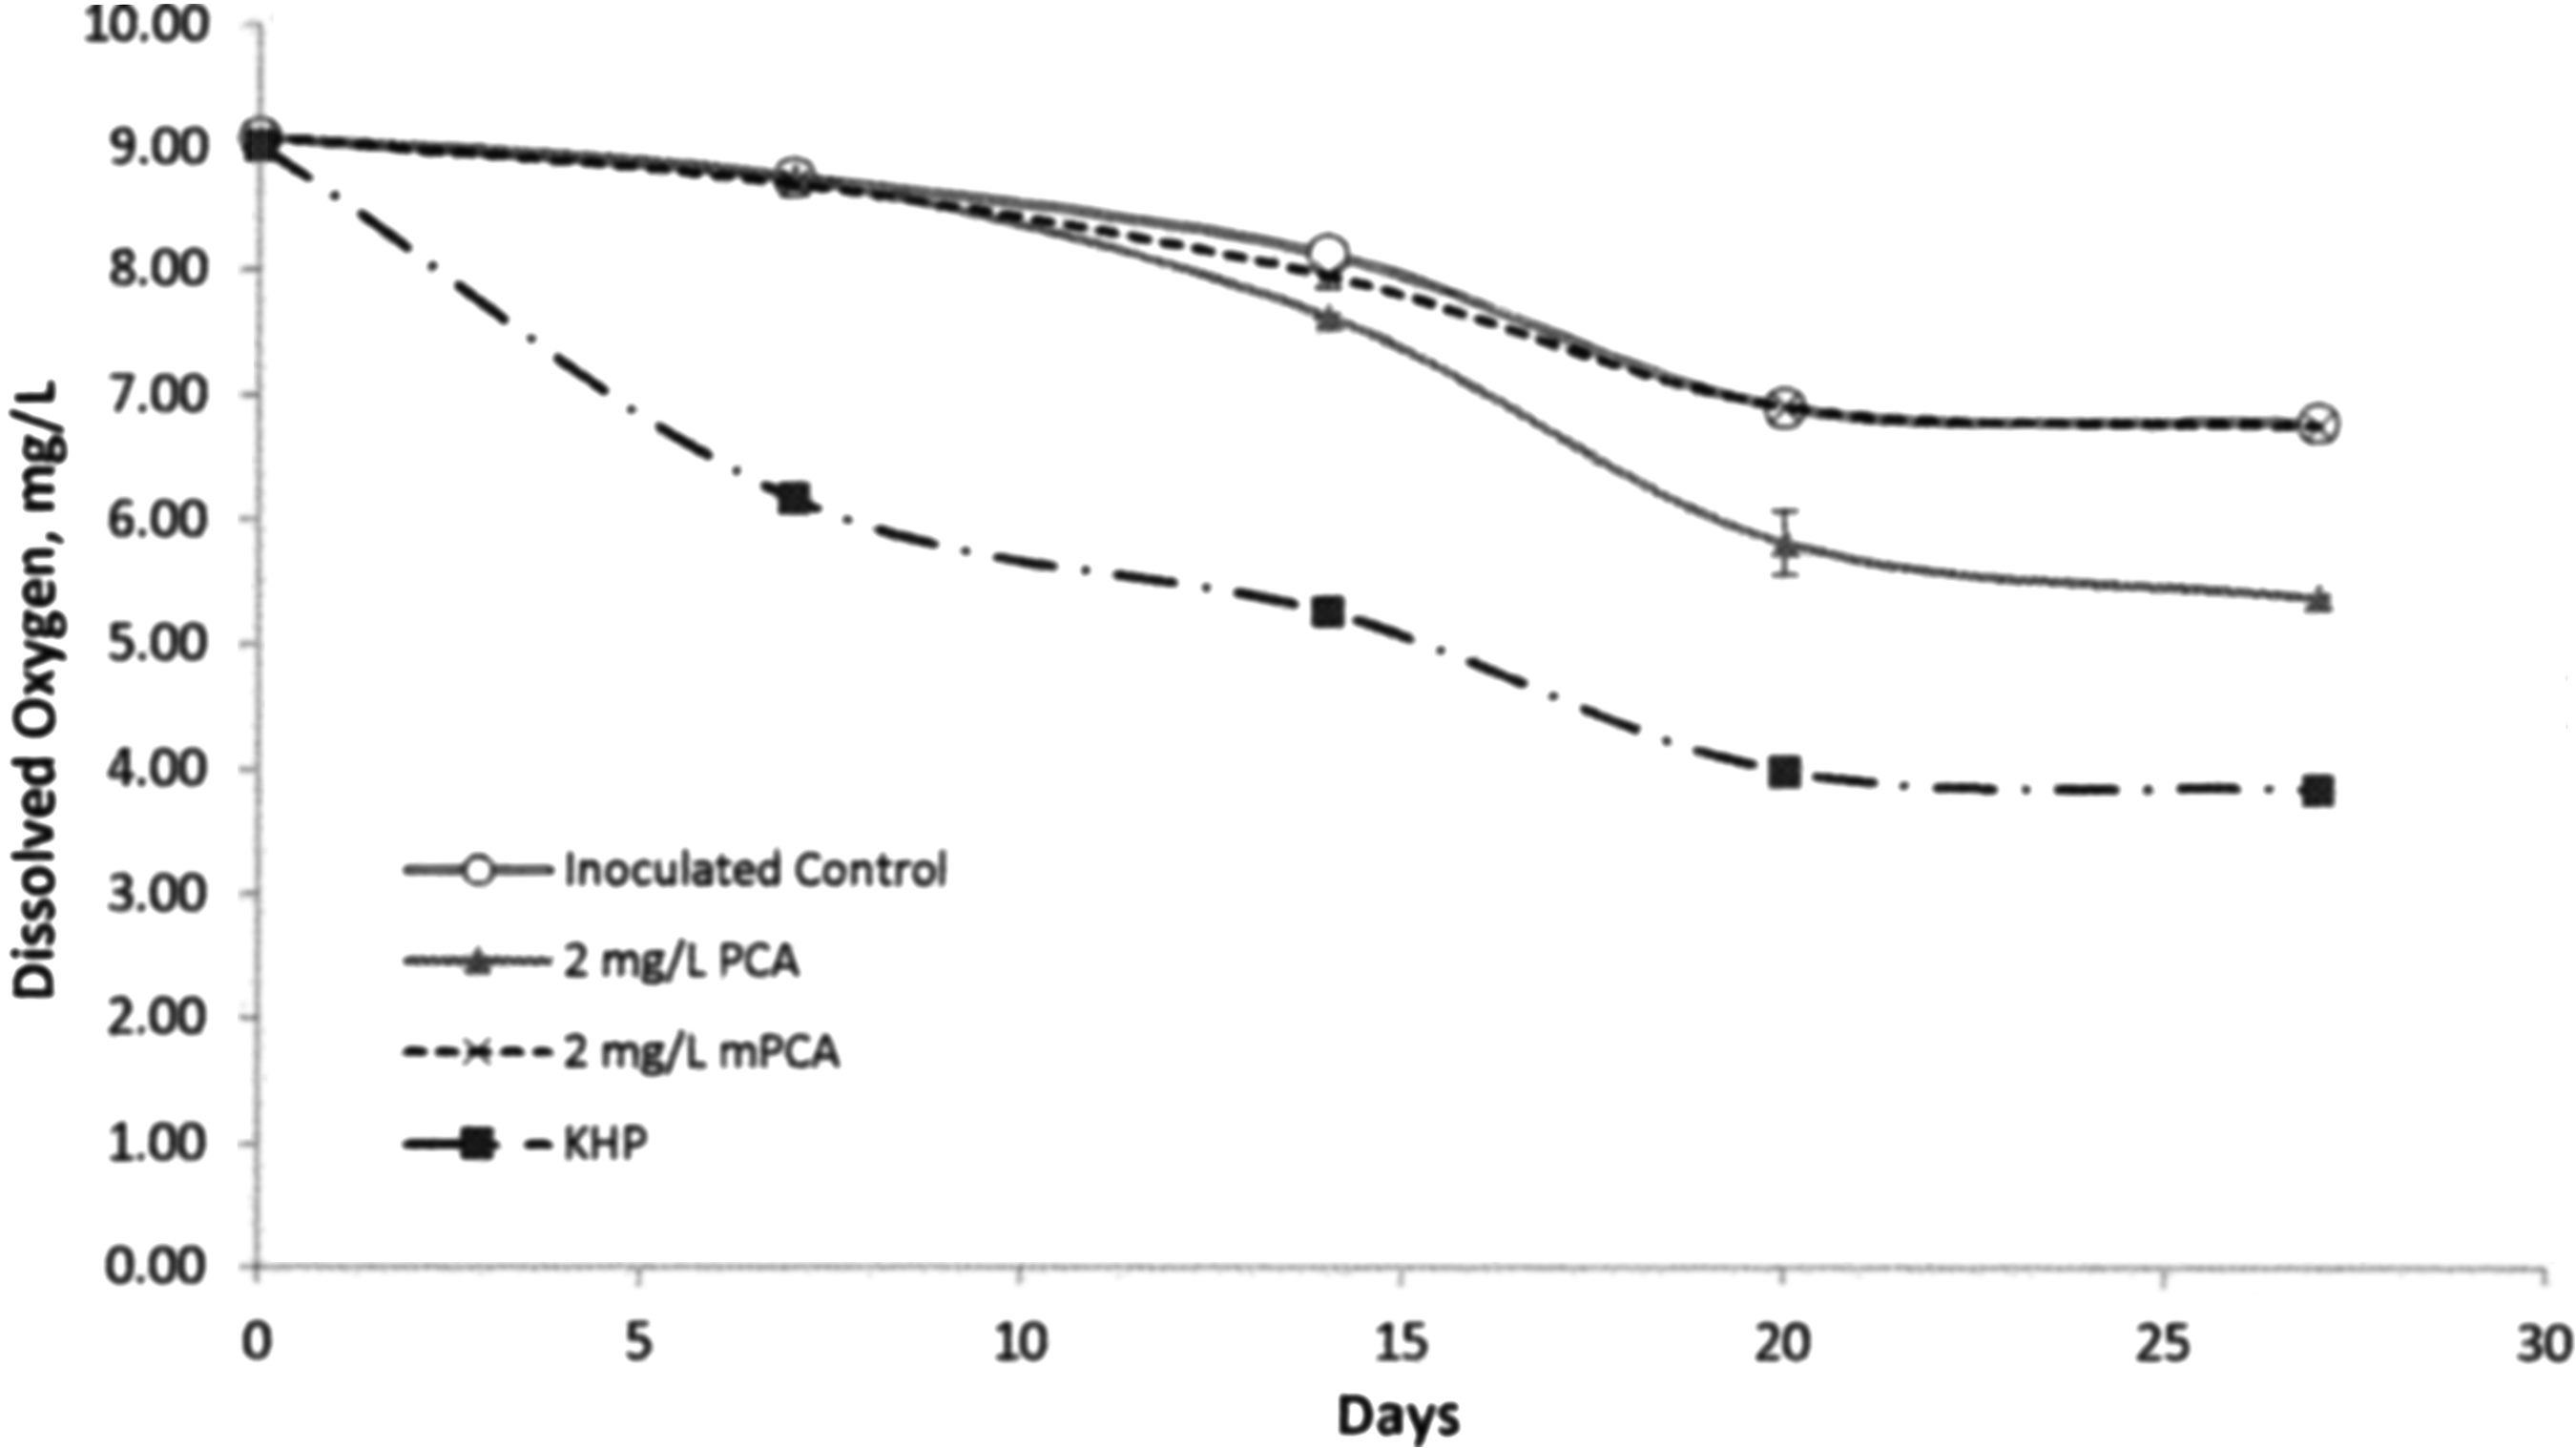
Biodegradation test 2, dissolved oxygen consumed on time with the standard error for the samples.

Biodegradation test 2, dissolved oxygen consumed on time with the standard error for the samples. NI, sample containing a nitrification inhibitor (N-allylthiourea, ATU).
Test 2 showed similar biodegradation trends on mPCA and PCA as observed in the biodegradation test 1. In both tests, PCA seemed to be biodegraded while mPCA did not appear to be biodegraded by the type of AS sample used in the experiments. This test was divided in the groups containing the nitrification inhibitor (Fig. 6) and the groups without it (Fig. 5). The groups of BOD bottles containing PCA with and without the nitrification inhibitor exhibited 41% and 102%, degradation, respectively. The large difference in the percentage degradation of PCA from the groups is due to the fact that the first was determined using the total ThOD value and the second percentage degradation was calculated using the carbonaceous ThOD (carbonaceous ThOD of 1 mg/L mPCA: 1.025 mg O2; carbonaceous ThOD of 1 mg/L PCA: 0.79 mg O2). If the same ThOD is used to determine the percent degradation of the compounds, similar oxygen consumptions and percentage degradations are observed 102% (1.6 mg/L) and 89% (1.4 mg/L) in the PCA samples with and without the NI, respectively. Total ThOD accounts for the oxygen required for the nitrification of the ammonia produced from the degradation of the chemicals. Carbonaceous ThOD does not account for the nitrification of the ammonia produced from the degradation of the compounds;
On the other hand, the addition of mPCA did not affect the amount of oxygen depleted with respect to the inoculated controls.
Discussion
Acute toxicity
The highest concentration of PCA and mPCA used in this research was 1.5 g/L. C. dubia (invertebrate), was more sensitive to mPCA than P. promelas (vertebrate) with a LC50 of 0.77±0.06 g/L. Although the LC50 of P. promelas exceeds 1.5 g/L, effects in the behavior and the physical appearance of the fish was observed at concentrations as low as 0.5 g/L. On the other hand, mortality/immobilization caused by exposing C. dubia to PCA (for 96 h) was low compared with mPCA with 100% survival at 1.0 g/L and below, and 80% survival at 1.25 and 1.5 g/L. No effect on the mortality and the behavior of the fish was observed with PCA.
Treatment efficiency and viability
The differences in temperature caused by using two different air sources for the aeration in the PCA test and the tendency of the stirring plates used in this experiment to increase their temperature over time, made firm conclusions difficult. In addition replicate measurements showed that the variability of the values obtained could be significant. The overall effect of PCA and mPCA on total respiration rates was small and only observed at 1,500 mg/L if at all. Further this effect was apparently caused by the inhibition of nitrification rather than by heterotrophic inhibition.
The results of this research show that mPCA is significantly more toxic than PCA. However, neither mPCA nor PCA was inhibitory to heterotrophic AS organisms although it is possible that both PCA and mPCA could inhibit nitrification at a concentration of 1,500 mg/L. No effect on nitrification or heterotrophs was observed for mPCA at 0.75 g/L. PCA was not evaluated at 0.75 g/L for nitrification inhibition.
The observations from the heterotrophic plate counts showed that 750 mg/L PCA and mPCA did not affect the viability of culturable heterotrophic organisms after exposing them for 4 h to the chemicals.
Biodegradation
The samples of AS organisms used were capable of biodegrading between 41% and 67% of PCA (with respect to its total ThOD) after 28 days of incubation using a concentration of 2.0 mg/L PCA. On the other hand, it seemed that the sample of AS used in this experiment was not able to use mPCA as an alternative source of energy or growth within the experiment incubation period. This does not definitively prove that mPCA cannot be biodegraded under other conditions (e.g., after an acclimation period of more than 28 days, or at higher mixed liquor volatile suspended solids [MLVSS]) but any such ability to degrade mPCA is entirely speculative. Under the conditions of our experiments it was not biodegradable. There is also the possibility that PCA may have acted as an uncoupler but that is speculative and it is not mentioned in the literature we are aware of.
It can be concluded that under the conditions of this test PCA was biodegradable while mPCA was not. This may imply that significant amounts of mPCA might not be removed in the AS plant but the biomass in this test was much more dilute than the MLVSS concentration in the plant, which could be the source of the difference.
Additional analyses are required to identify whether mPCA can be biodegraded under different types of test conditions such as in an anaerobic environment and/or with a more concentrated biomass. In addition, it needs to be determined whether PCA can be completely biodegraded if the concentration of biomass is higher (and thus more representative of actual AS MLVSS concentrations). It is well known that some compounds may not be degradable, or may be inhibitory, in a BOD test while still being biodegradable in an actual reactor with high MLVSS concentrations (Van Ginkel et al., 1995; Vázquez-Rodríguez et al., 2011).
The results obtained under the conditions of the tests performed in this research suggest that industrial use for treatment of MMH and HZ with AKGA is promising. The two stable by-products formed from the reaction of AKGA with MMH and HZ (mPCA and PCA, respectively) have relatively low toxicity and are safer to handle than the by-products of other methods used in the remediation of MMH and HZ wastes such as the use of hypochlorite, which produces carcinogenic compounds when used with MMH, and citric acid neutralization, which is reversible and pH dependent and also requires incineration (Greene et al., 2009; Oropeza, 2011). This study provides the foundation from which further studies of PCA and mPCA waste disposal and treatment could be based on.
Conclusions
1. Ecotoxicity: mPCA showed higher toxicity than PCA. mPCA had an LC50 of 0.77±0.6 g/L and a NOEC of 0.50 g/L for C. dubia; the NOEC for P. promelas was 0.75 g/L with observed effects on the behavior of the fish starting at 0.5 g/L. In contrast there was not a significant effect for either C. dubia or P. promelas for PCA even at the highest concentration used in this study (1.5 g/L).
2. Respiration inhibition: Neither mPCA nor PCA caused more than 20% inhibition of the total respiration rates at the highest concentration evaluated (1.5 g/L). Both compounds averaged ∼10% inhibition at 1.5 g/L (Table 2). However, both showed significant (>30%) inhibition of nitrogenous oxygen demand at 1.5 g/L.
3. Biodegradation: mPCA was not biodegradable by AS bacteria while PCA showed almost complete biodegradation based on carbonaceous oxygen consumption. However, biodegradation might be faster and more complete in an actual AS reactor since the test used had very dilute bacterial concentrations.
4. In summary, mPCA was toxic and harder to biodegrade than PCA, but both compounds showed some inhibitory effects on nitrification. Neither compound significantly inhibited carbonaceous biodegradation of organic compounds. The inhibition of nitrification and mPCA toxicity were observed at very high concentrations (0.75–1.5 g/L) suggesting that either compound might be treatable by AS systems if sufficiently diluted. Further biodegradation tests at higher biomass concentrations representative of AS systems need to be conducted for PCA and mPCA.
Footnotes
Acknowledgments
This work was supported by the National Aeronautics and Space Administration (NASA), as well as the URS engineering company under contract number NNK08OC01C, Project E1274976 with NASA/URS.
Author Disclosure Statement
No competing financial interests exist.