
Abstract
Abstract
Removal of PO4-P, NH3-N, cBOD5, chemical oxygen demand (COD), Escherichia coli, and total coliforms in a pilot-scale hybrid constructed wetland (CW) wastewater treatment system was evaluated. Wastewater was sequentially passed through a mixing cell, an aerobic treatment cell, a P treatment cell that contained basic oxygen furnace slag (BOFS), and an anaerobic treatment cell. The system operated for 8 months at an average flow rate of 68 L/day. Mean influent concentrations of PO4-P, NH3-N, cBOD5, and COD were 7, 25, 27, and 60 mg/L, respectively, and mean influent levels of E. coli and total coliforms were 104 and 105 CFU 100 mL−1. Effluent from the system had 95–99% lower concentrations of PO4-P, NH3-N, cBOD5, E. coli, and total coliforms, and a 72% lower concentration of COD, compared to influent values. Backscatter scanning electron imaging coupled with energy dispersive X-ray (EDX) spectra and elemental maps, along with Fourier transform infrared (FTIR) spectra, showed that P was present on the outer layer of the spent BOFS material. Occurrence of calcium-carbonate and phosphate minerals also was indicated through FTIR analysis. X-ray absorption near edge structure (XANES) spectra of samples from the treatment system was consistent with the presence of phosphate adsorbed on calcite, hydroxyapatite, and α-tricalcium phosphate. High pH (11.66±0.70) of pore water in the BOFS cell resulted in inactivation of pathogens. The wastewater pH was subsequently neutralized by sparging CO2(g) before being introduced to the final anaerobic cell.
Introduction
R
A number of studies have focused on the role of substrate materials used in CWs to improve P treatment capacity (Drizo et al., 2002; Jenssen et al., 2005; Barca et al., 2013, 2014). Industrial by-products including blast furnace (BF) slag (Korkusuz et al., 2005; Gustafsson et al., 2008; Vohla et al., 2011), electric arc furnace (EAF) slag (Chazarenc et al., 2007; Okochi and McMartin, 2011), basic oxygen furnace slag (BOFS) (Barca et al., 2013, 2014), and lightweight aggregates (Jenssen et al., 2005) are promising substrates.
BOFS is generated during steelmaking (Mikhail et al., 1994; Shi, 2004). The major phases (>10 wt.%) of BOFS are di-calcium silicate (Ca2SiO4), tri-calcium silicate (Ca3SiO5), ferrous oxide (FeO), and Ca-Mg-Mn-Zn-ferrite ((Ca,Mg,Mn,Zn)Fe2O4) (Mikhail et al., 1994). The main chemical components, which comprise approximately 70–85 wt.% of BOFS, reported as oxides are CaO, Fe2O3, and SiO2; whereas MgO, MnO, Al2O3, P2O5, TiO2, K2O, Na2O, and Cr2O3 comprise the remainder (Mahieux et al., 2009; Xue et al., 2009; Yildirim and Prezzi, 2011; Belhadj et al., 2012).
Laboratory and field applications using BOFS as a reactive media have demonstrated very high levels of removal (often >99%) of P and pathogens (e.g., Escherichia coli) in wastewater (Baker et al., 1998; Blowes et al., 2000; Smyth et al., 2002; Stimson et al., 2010, Barca et al., 2014). This article describes a pilot-scale CW system that included a BOFS component designed to remove P, pathogens, and other wastewater contaminants, and a CO2(g) injection system used for neutralization of high pH effluent. Detailed mineralogical studies of solid-phase samples of the unreacted and spent BOFS, including synchrotron-based X-ray spectroscopic techniques, were conducted to determine the mechanisms of P removal. The generation of high pH effluent and metal leaching from BOFS are two potential concerns that need to be resolved before widespread application of BOFS for wastewater treatment. This study also addressed issues related to mechanisms controlling changes in pH and metal removal during operation of the system.
Materials and Methods
System configuration
A pilot-scale indoor wastewater treatment system (Fig. 1), with a capacity of 50–100 L/day, was constructed at the Center for Alternative Wastewater Treatment (CAWT), Fleming College, Lindsay, Ontario, in the spring of 2009. The system consisted of a series of five cells (Cells 1-5, Fig. 1) connected with a piping network. Sample collection ports (plastic valves) were located between cells.
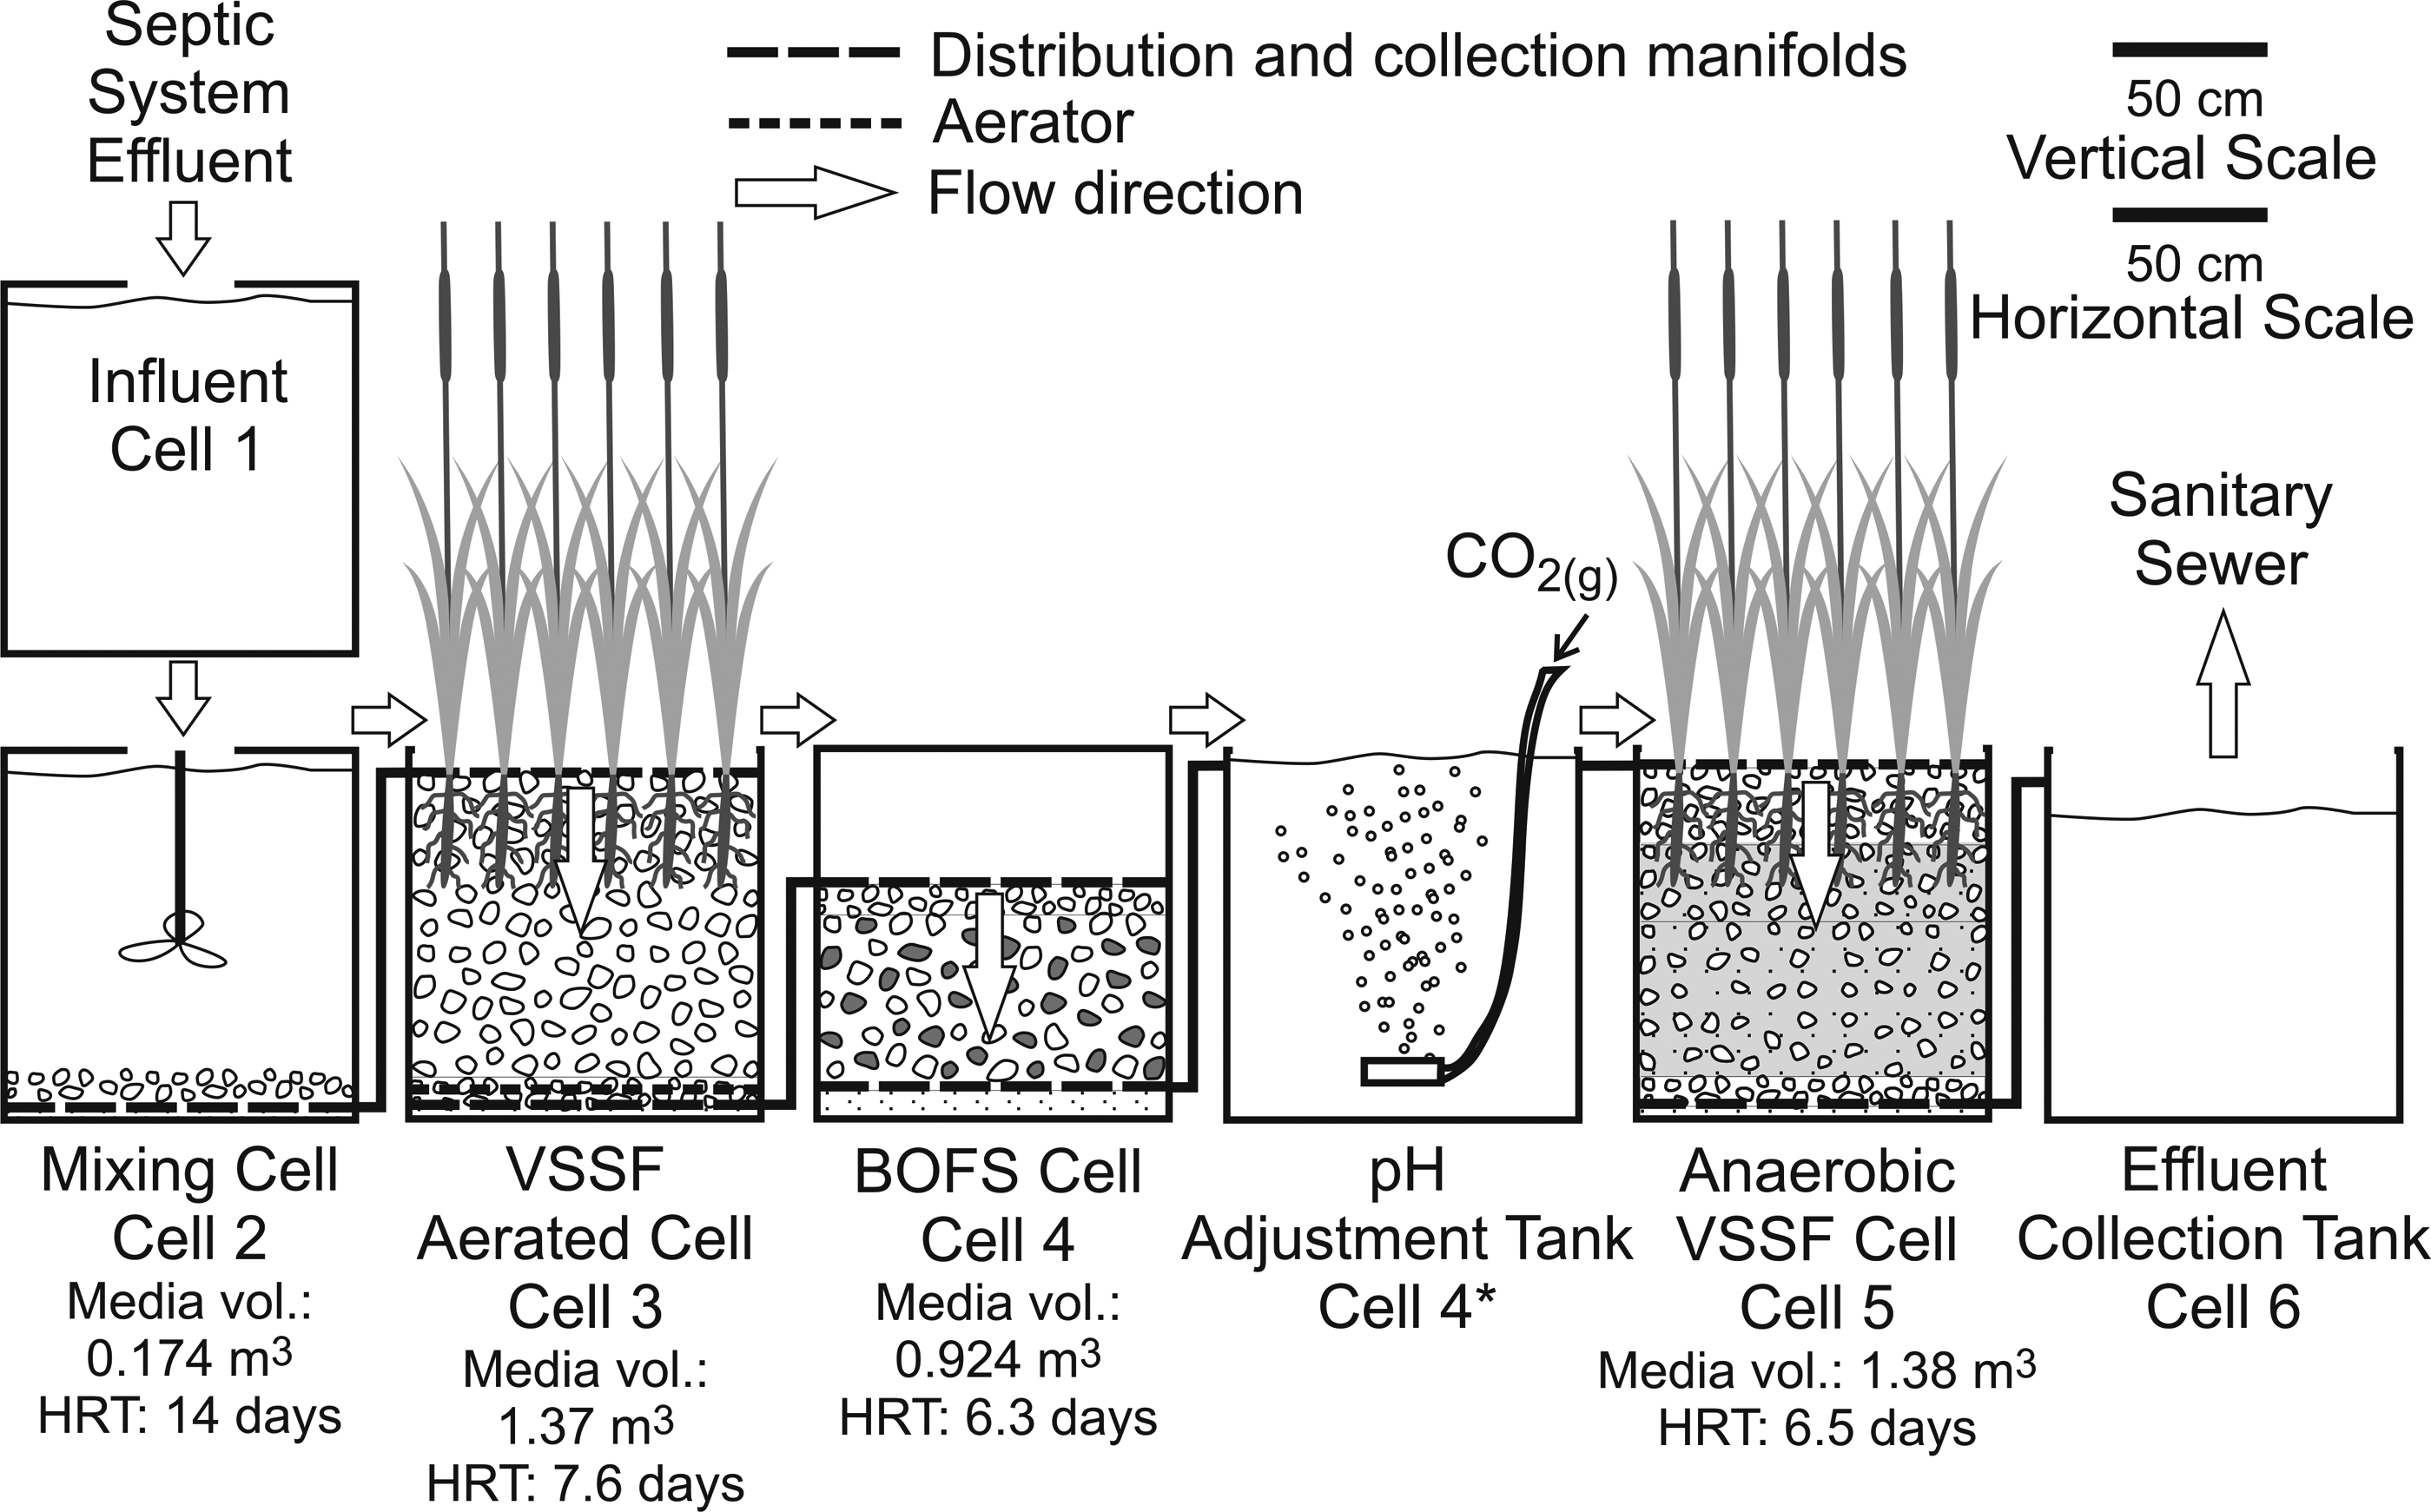
Schematic diagram of the cells in the pilot-scale treatment system. Wastewater continuously flows through the system by combination of gravity feed and pumping, VSSF, vertical subsurface flow.
Cell 1 was a 1.0 m3 feed tank that received wastewater collected from the septic tank at the college. The remaining four cells (Cells 2-5) were 120 cm long, 100 cm wide, and 116 cm deep. Distribution and collection manifolds, comprised of three parallel perforated polyvinyl chloride (PVC) pipes, were installed within each cell to evenly distribute the influent and to capture the effluent from all portions of the cell. Although Cells 2-5 were the same size, the packing of media within each cell varied, resulting in variations in hydraulic retention times (HRT). The effluent from Cell 5 was stored and tested before discharging to the City of Lake Kawartha sanitary sewer system.
Wastewater from Cell 1 was periodically pumped to Cell 2, which contained a 5 cm basal sand layer sequentially overlain by a collection manifold and a 10 cm washed gravel layer (Supplementary Fig. S1). This cell also contained a heavy-duty mixer to provide wastewater with a uniform composition to the subsequent cell. The mean HRT of Cell 2 was about 14 days. The long mixing period was due to the large capacity of the cell, which exceeded the flow rate through the system.
Cell 3 was a top-dosed, downward flow, aerated, vegetated wetland cell, which was operated under partially saturated conditions. This cell contained a 5 cm basal sand layer sequentially overlain by a collection manifold, a 10 cm washed gravel layer containing an aerator, a 98 cm washed limestone gravel layer, and a distribution manifold (Supplementary Fig. S2). The surface was vegetated with transplanted cattails, Typha spp. The mean HRT was 7.6 days.
Cell 4 was a top-dosed, downward flow, sealed, and unvegetated BOFS cell, which was operated under fully saturated conditions. This cell included a 10 cm basal sand layer, overlain sequentially by a collection manifold, a 57 cm layer of a BOFS-gravel mixture (volume ratio, 50:50), a 10 cm layer of washed limestone gravel, and a distribution manifold (Supplementary Fig. S3). The cell was designed to be sealed and airtight. The BOFS was screened and washed before use in the cell. The mean HRT was 6.3 days with an average influent wastewater flow rate of 68 L/day.
Cell 4* was an open-topped horizontal-flow cell, which received the effluent from Cell 4. Carbon dioxide gas was bubbled from the bottom of the vessel using gas spargers (12 cm length). This CO2 addition cell was introduced between Cell 4 and Cell 5 after 15 weeks of operation.
Cell 5 was a top-dosed, downward flow, unaerated, vegetated wetland cell, which was anaerobic at the base and vegetated at the surface and operated under fully saturated conditions. A 5 cm basal sand layer was overlain by a collection manifold, a 10 cm washed gravel layer, followed by a 50 cm layer of substrate (a mixture of 7 parts pulp and paper biosolids to provide a source of organic carbon, 5 parts gravel, and 2 parts sand), a 25 cm layer of substrate (a mixture of 7 parts pulp and paper biosolids, 12 parts gravel, and 2 parts sand), overlain by a 25 cm unwashed gravel layer, and a distribution manifold (Supplementary Fig. S4). The surface was vegetated with transplanted cattails, Typha spp. The mean HRT was 6.5 days.
Reactive material characterization
Collection of reactive material samples
BOFS used in the experiment was obtained from the U.S. Steel Stelco Hilton Works facility (Hamilton, ON, Canada). A sample of this material, as delivered, was collected before the initiation of the experiment. At the conclusion of the experiment, samples of the reacted material were collected from the BOFS cell (Cell 4). Material was excavated in 10–15 cm intervals in five vertical profiles to provide samples for mineralogical characterization and geochemical analysis (Supplementary Fig. S5).
Determination of physical properties
The particle density of the BOFS was determined using a pycnometer (Air Comparison Beckman Model 930). Surface area was determined with a surface area analyzer (Micromeritics Gemini® VII 2390 Series).
Determination of bulk characteristics
The composition of the initial BOFS was determined by X-ray fluorescence (XRF, MiniPal4, PANanalytical). X-ray diffraction (XRD) analyses of the initial BOFS material and coatings from the reacted material were obtained using a Rigaku D/MAX 2500 rotating anode powder diffractometer with monochromatic CuKα radiation at 50 kV and 260 mA. Measurements were conducted with 2θ angular range from 5 to 70°, where the step size and scan speed were 0.02° and 1°/min. Additional XRD analyses were made using a Bruker diffractometer, spot focus sealed CuKα radiation at 40 kV and 40 mA (2θ range: 10–90, step size: 0.04°, and scan speed: 1.2°/min). Phase identifications were made using patterns from the International Center for Diffraction Data (ICDD) and the Inorganic Crystal Structure Database (ICSD) and through the JADE and EVA software.
Microscopic examination
Selected samples were examined by optical microscopy to determine the distribution and texture of minerals within the initial BOFS and the reacted materials. Samples of the coating of the reacted BOFS and polished cut sections, prepared from the reacted BOFS grains, were examined using scanning electron microscope (Leo 1530 field emission scanning electron microscopy (FE-SEM)) coupled with EDX spectroscopic analysis using a backscattered electron detector.
Spectroscopic characterization
Extensive spectroscopic studies, including EDX spectroscopy, Fourier transform infrared spectroscopy (FTIR), X-ray photoelectron spectroscopy (XPS), and X-ray absorption near-edge structure (XANES) spectroscopy, were conducted to determine the nature of the initial BOFS material and to identify reaction products on the reacted BOFS obtained from the treatment system following completion of the experiment. A hierarchical strategy was developed for the application of these techniques. EDX analyses provide information regarding the presence of individual elements in weight percent. FTIR analyses provide information regarding the presence of specific functional groups within the samples. XPS analyses provide information regarding the surface characteristics of the samples and XANES spectroscopic analyses provide detailed information regarding the oxidation state and chemical bonding within the target phases.
The outer layers of the spent BOFS were analyzed by FTIR using a Tensor 27 spectrometer (Bruker Instruments, Inc.). FTIR analyses on mounted polished sections of selected samples were performed with a second spectrometer (IFS 55, Bruker) using a diamond compression cell in combination with a microscope equipped with micro-ATR (attenuated total reflectance). XPS analyses were performed using a Kratos Axis Ultra spectrometer with a monochromatic Al K (alpha) source (15 mA, 14 kV). XANES experiments were conducted at the Canadian Light Source, Saskatoon, Canada. XANES spectra were acquired in Total Electron Yield (TEY) and Fluorescent Yield (FY) modes. Experimental and standard data were collected using a monochromator with Si (111) crystals and a flux of >1011 photons s−1. The XANES spectra of the unknown samples (spent BOFS) were compared with reference materials through linear combination (LC) fitting using data processing software, Athena, version 0.8.56 (Ravel and Newville, 2005). Details of sample preparation and instrument operating parameters (Supplementary Table S1) are described in the Supplementary Data.
Preparation of reference materials
A series of reference material samples was prepared and analyzed to support the spectroscopic studies. Reference materials including iron (III) phosphate (FeP), β-tricalcium phosphate (β-TCP), α-tricalcium phosphate (α-TCP), hydroxyapatite (HAP), calcium phosphate dibasic (CPD), and calcium phosphate dibasic dihydrate (CPDD) were obtained from Sigma Aldrich, Canada (Supplementary Table S2). A second hydroxyapatite standard was synthesized following the liquid mix technique (wet method; HAP-WM) of Pena and Vallet-Regi (2003). Additional reference materials, including phosphate sorbed on calcite 0.004% (PSC 0.004%), phosphate sorbed on calcite 1% (PSC 1%), and phosphate sorbed on calcite 8% (PSC 8%), were synthesized in the laboratory (Supplementary Data). In addition, spectra were obtained for an AlPO4 reference material (Y. Hu, personal communication).
Water sample collection and analysis
The treatment system was monitored for 8 months at ambient indoor temperatures (∼23°C) from July 2009 to February 2010. Samples of influent and effluent from each cell were collected weekly. Sampling valves were purged before sample collection. The pH and Eh were measured on unfiltered samples immediately after collection using combination electrodes (Thermo Scientific Orion ROSS pH electrode and Thermo Scientific Orion Eh electrode). Samples were filtered through 0.45 μm membranes into polyethylene bottles for analysis of anions (not acidified), cations, and trace metals (acidified to pH 2 with 16 N HNO3), PO4-P, and NH3-N (acidified to pH 2 with 18 N H2SO4). Alkalinity was measured on filtered samples using a Hach™ digital titrator. Samples for pathogen analysis were aseptically collected in sterile plastic containers. Quality control was evaluated through the use of replicate samples and laboratory and field blanks.
Ortho-phosphate (PO4-P) analyses were conducted using the ascorbic acid method (HACH Method 8048 based on SM 4500 P E; APHA, 1998). Major cations were analyzed by inductively coupled plasma optical emission spectroscopy (ICP-OES; Thermo Instruments iCAP 6500 Duo); trace element concentrations by inductively coupled plasma mass spectrometry (ICP-MS; Thermo Instruments XSeries 2); and anions by ion chromatography (Dionex Ion Chromatograph model DX120, anion AS50 analytical column). The carbonaceous biochemical oxygen demand (cBOD5) was measured following standard method “SM 5210 B” (APHA, 1998). Chemical oxygen demand (COD) was determined using standard method “SM 8000” (APHA, 1998). Dissolved oxygen was measured using a YSI 5100 Dissolved Oxygen Meter. NH3-N analysis was performed following the Salicylate (colorimetric) Method (HACH Method 10031). Coliform and E. coli most probable number counts were determined using a 96-well titer plate method (Coliplate™). All analyses were conducted at the CAWT Laboratory, Fleming College and the Environmental Geochemistry Laboratory, University of Waterloo. A subset of samples was analyzed for cations and trace metals at SGS Lakefield Research Limited for QA/QC purposes.
Geochemical modeling
Saturation indices for calcium phosphate phases including hydroxyapatite and other mineral phases relevant to the treatment system were calculated using the geochemical modeling code PHREEQC Interactive (Parkhurst and Appelo, 1999). The WATEQ4F database was used for these calculations and solubility product values for brushite, monetite, octacalciumphosphate, β-tricalciumphosphate, and variscite were added to this database using published data (Stumm and Morgan, 1981; Baker et al., 1998). The maximum ionic strength observed in the treatment system water samples was 2.37×10⁻². All activity corrections were conducted using the extended Debye-Hückel equation.
Statistical analysis
One-way analysis of variance (ANOVA) was used to determine whether there were any significant differences between the concentrations at various cell effluents. The level of significance (α) was 0.05 using the Holm–Sidak method. The Holm–Sidak method is recommended over the Tukey and Bonferroni tests for pairwise multiple comparisons (Glantz, 2012).
Results and Discussion
Characteristics of BOFS
BOFS material was screened and washed before use to remove the finest fractions and thereby increase the permeability of the material. Because the fine fraction was removed, the highest proportion of the mass-weighted surface area (surface area of each size fraction multiplied by the corresponding mass, Table 1) was associated with the coarsest fraction of the material. The particle density of the BOFS was 3.49 g/cm3. The XRF analyses indicated the BOFS contained 39 wt.% CaO, 24 wt.% Fe2O3, 12 wt.% SiO2, 11 wt.% MgO, 3.8 wt.% MnO, and 3.4 wt.% Al2O3. The XRD analysis of the BOFS indicated the presence of periclase (MgO), wuestite (FeO), srebrodolskite (Ca2Fe2O5), larnite (Ca(SiO4)), hatrurite (Ca3(SiO4)O), brownmillerite (CaAl0.5Fe0.5O2.5), and possibly aragonite (CaCO3), anhydrite (CaSO4), portlandite (Ca(OH)2), lime (CaO), and calcite (CaCO3).
BOFS, basic oxygen furnace slag.
Influent chemistry
There were distinct differences in influent chemistry observed during the study period, reflecting changes in the student population at the college. A low student population at the college and the vigorous mixing during the first 157 days of the experiment resulted in influent concentrations of alkalinity, PO4-P, NH3-N, cBOD5, and COD that were much lower than during the following 91 days. Termination of mixing in Cell 2 during the last 91 days resulted in greater fluctuations in the influent water composition during this period. Based on the differences in the influent concentrations, the results are divided into two phases (Phase 1 includes the first 157 days and Phase 2 includes the final 91 days).
pH and alkalinity
Trends in pH were similar over both phases of the experiment. The pH of effluent from Cell 1 (treatment system influent) was 7.44±0.53 (mean: 7.49, σ: 0.24). There was a significant difference between the influent and effluent pH in all cells, except for Cell 2 (α=0.05, k=5, p<0.05, and p<Pcrit). The pH increase in Cell 3 (8.12±0.54; mean: 8.32, σ: 0.26) is attributed to the dissolution of carbonate minerals present in the gravel and equilibrium with respect to atmospheric CO2, introduced to the cell by aeration. The pH abruptly increased in Cell 4, and it gradually declined from 12.36 to 10.96 (mean: 11.64, σ: 0.36) over the duration of the experiment. This increase in pH is due to dissolution of lime and other Ca- and Mg-bearing phases in the BOFS. A sudden drop in pH from 11.20±0.98 to 7.36±0.56 (mean: 8.37, σ: 1.97) was observed in the Cell 5 effluent following the addition of CO2 in the pH-adjustment cell between Cell 4 and Cell 5 after 15 weeks of operation (Fig. 2).

Box plots of pH, alkalinity, PO4-P, Eh, NH3-N, NO3-N, DO, cBOD5, COD, Escherichia coli, total coliform, TDS, Al, V, and Cu concentrations versus distance (Cells 1-5) along treatment flow path. Horizontal solid lines and broken lines on the boxes represent median and mean concentrations. Top and bottom most dots represent 95 percentile observation above upper fence and 5 percentile observation below lower fence. COD, chemical oxygen demand.
Mean alkalinity values in Cells 1, 2, and 3 effluent were 298, 249, and 233 mg/L as CaCO3 during Phase 1; and were 575, 523, and 198 mg/L as CaCO3 during Phase 2 (Fig. 2). The alkalinity values in the Cell 4 effluent were initially very high (total alkalinity>1500 mg/L as CaCO3), corresponding to the elevated pH values (>12), and then gradually decreased to below 200 mg/L as CaCO3, after lime and other Ca-bearing phases were depleted. The mean alkalinity values in the Cell 5 effluent decreased from 433 to 239 mg/L as CaCO3 after the initiation of CO2 sparging. This decline was accompanied by the accumulation of particulate CaCO3 in the sparging cell (Fig. 2).
TDS effluent concentrations gradually decreased from Cell 1 to Cell 3 effluents. However, TDS increased abruptly in Cell 4 effluent due to the dissolution of Ca-bearing phases and then decreased again in Cell 5 effluent (Fig. 2).
Major ion chemistry
Trends in major ion concentrations were similar throughout both phases of the experiment. The mean Ca concentration was 108 mg/L in the system influent and decreased slightly in Cell 2 effluent (104 mg/L) and Cell 3 effluent (98 mg/L) of the treatment system. At the beginning of the experiment, the Ca concentrations increased sharply (∼294 mg/L) in the Cell 4 effluent, probably due to the dissolution of CaO and Ca(OH)2 in the BOFS. Over time, the concentration gradually decreased to 123 mg/L as the cell was continuously flushed. Calcium concentrations significantly decreased in Cell 4* effluent as Ca reacted with CO2 resulting in the formation of CaCO3. Higher Ca concentrations in the Cell 5 effluent compared to the Cell 4* effluent suggest that Ca was derived from the pulp and paper mill biosolids (a substrate used in Cell 5), which contain leachable amounts of Ca (Vance, 2000). The Na concentrations were steady near 110 mg/L in all of the cells, although the influent concentrations gradually increased throughout the experiment. Mean Mg concentrations in Cells 1, 2, and 3 effluents were 12 mg/L, and then these declined to <1 mg/L in Cells 4 and 5 effluents, probably due to the incorporation of Mg in CaCO3 precipitates.
Mean SO42− concentrations in the effluent of Cells 1, 2, and 3 were 45 mg/L. The concentrations declined to 33 mg/L in Cell 4 effluent and 40 mg/L in Cell 5 effluent. Dissolved S2− concentrations in Cells 1, 2, 3, and 4 effluents were below or near the detection limit (0.005 mg/L), and then these increased to a mean value of 0.31 mg/L in Cell 5 effluent. This increase corresponds to a decrease of 16–66% in the mean SO4 concentration in Cell 5 relative to the mean values for Cells 1, 2, and 3, indicating the development of sulfate-reducing conditions in Cell 5.
Phosphorus
Dissolved phosphorus
Mean dissolved PO4-P concentrations in Cells 1, 2, 3, 4, and 5 effluents were 6.97, 4.69, 3.01, 0.02, and 0.35 mg/L (Fig. 2). Overall, dissolved PO4-P concentrations declined by 92% (Supplementary Table S3) within the treatment system, representing a significant difference between the influent and final effluent concentrations (α=0.05, k=5, p<0.05, and p<Pcrit). Within the system, dissolved PO4-P concentrations declined by 15–49% in Cell 2 during Phase 1, and between−12% to 20% during Phase 2, with few exceptions (Fig. 2 and Supplementary Table S3). A large decrease in the concentration of dissolved PO4-P was observed in this cell, which was accompanied by an increase in the Eh and DO concentration (Fig. 2). Precipitates were observed at the bottom of the cell. In Cell 3, dissolved PO4-P removal was 15–55% (average 33%, Supplementary Table S3), similar to values (40–60%) observed in other constructed wetland systems (e.g., Knight et al., 2000; Nairn and Mitsch, 2000; Vymazal, 2004).
Extensive removal of dissolved PO4-P was observed in Cell 4 with a 98.6–99.8% decline relative to the Cell 3 concentrations throughout both phases of the experiment (Supplementary Table S3). The total PO4-P mass in, mass out and mass retained in Cell 4 were 47.7, 0.30, and 47.4 g, respectively. Thus, 99% of the total PO4-P mass entering Cell 4 was retained (Fig. 3). There was no significant effect of flow rate on PO4-P mass retention observed in Cell 4.
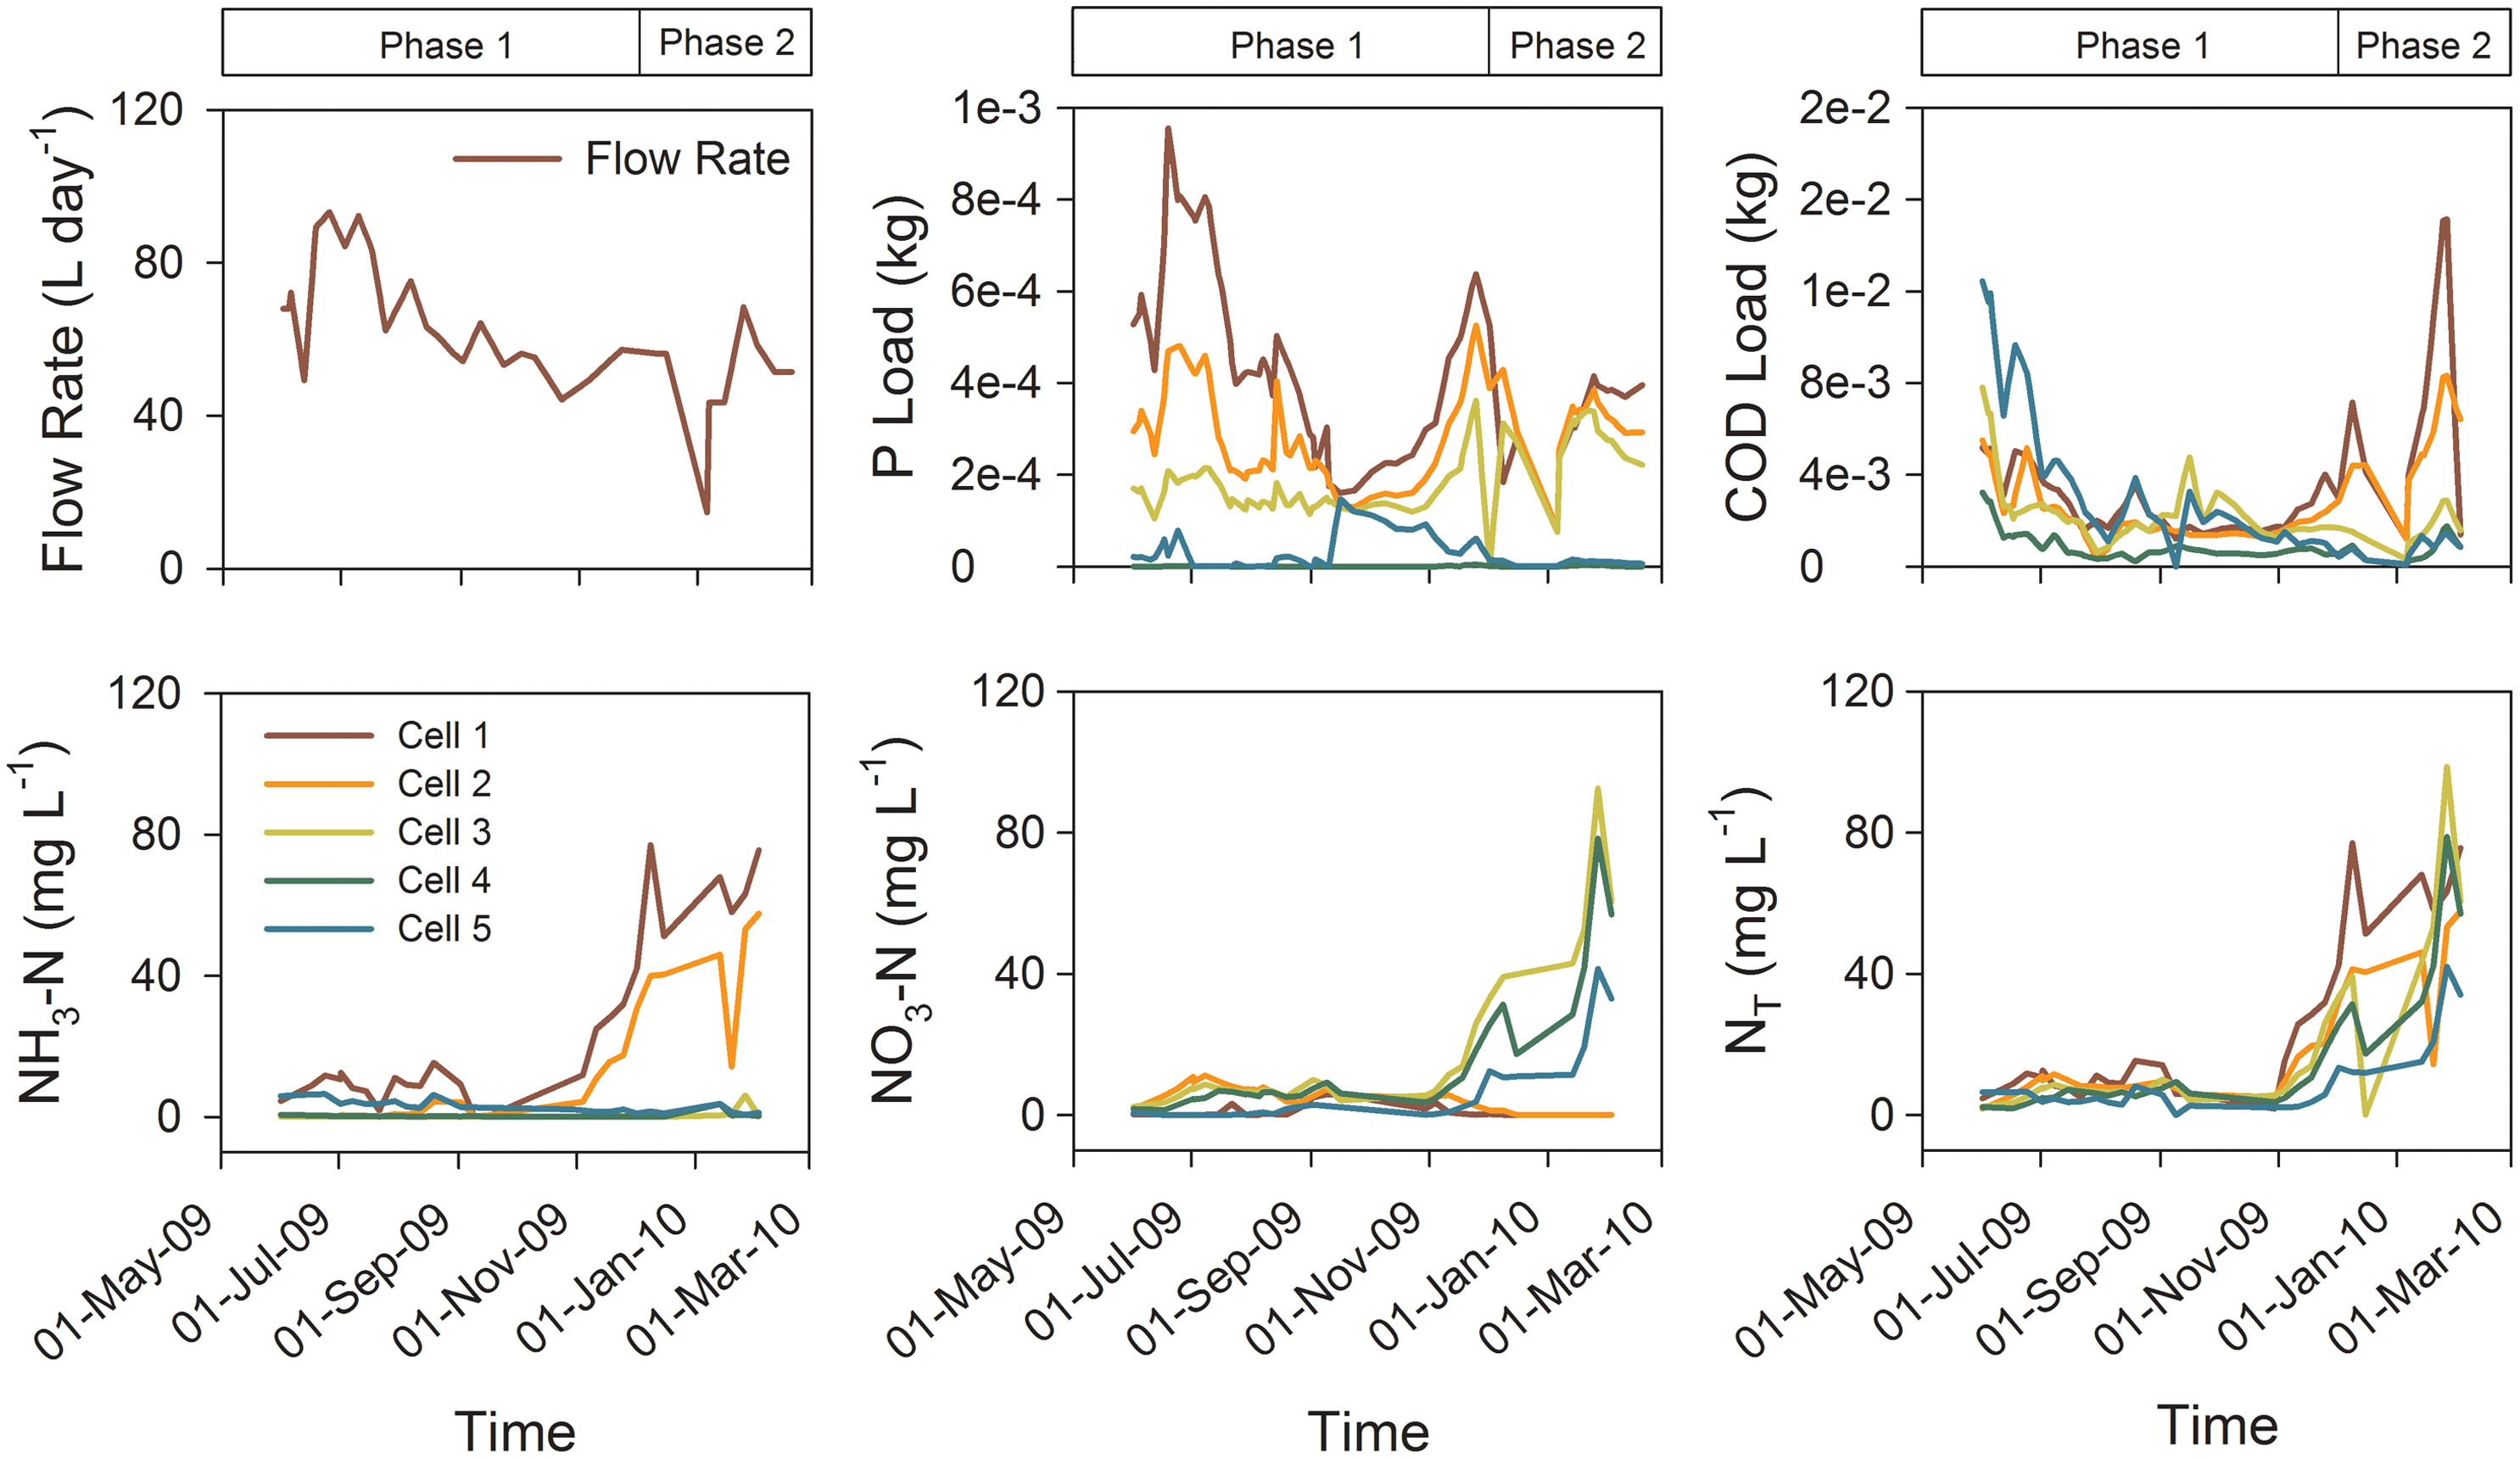
Flow rate in the treatment system, P and COD loads, NH3-N, NO3-N, and total nitrogen (NT) concentrations along the flow path.
Inorganic PO4 is readily adsorbed on hydrous oxides of Fe and Al under moderately acidic conditions, and can combine with Ca to form Ca-PO4 solids in alkaline environments (Qualls and Richardson, 1995). However, Antelo et al. (2010) suggested that a nonprotonated complex predominates at intermediate and high pH values. The BOFS, used in the reactive mixture of Cell 4, contains significant amounts of Ca oxides, thus favoring greater removal of PO4 through precipitation of PO4-bearing phases, including hydroxyapatite (HAP) (Baker et al., 1998; Bowden et al., 2009). The high percentage of CaO present in the BOFS resulted in the development of high pH conditions (pH>9). Under these conditions, HPO42− and PO43− are the dominant phosphate species. These species are attracted to positively charged surfaces (Stumm and Morgan, 1981). BOFS contains several metal oxides with elevated pH of point of zero charge (pHPZC) values, including MgO (pHPZC=10–12: Kosmulski, 2009; pHPZC=12.4: Parks, 1965; pHPZC=12.24: Sverjensky, 1994), CaCO3 (pHPZC>8.5: Kosmulski, 2009), Al2O3 (pHPZC=9.1: Parks, 1965; pHPZC=9.37: Sverjensky, 1994), and Fe2O3 (with pHPZC of 8.5; Davis and Kent, 1990), therefore, modest PO4 adsorption on these phases is likely.
Xue et al. (2009) suggested that ligand exchange is the dominating adsorption mechanism of phosphate onto the BOFS. Adsorption of phosphate onto Fe- and Al oxides (both present in BOFS), by forming the bidentate complexes and the monodentate complexes, are observed in the previous studies (Shin et al., 2004; Antelo et al., 2005; Guan et al., 2005). Significant quantities of CaO (39%), Fe2O3 (24.3%), MgO (11.2%), and Al2O3 (3.4%) were present in the BOFS materials used in this study suggesting that adsorption may be a possible PO4 removal mechanism. There was no substantial decrease in the extent of PO4 removal during the study.
Higher PO4-P concentrations were observed in Cell 5 effluent compared with the Cell 4 effluent, which indicates that a small amount of PO4-P was released within Cell 5. The Cell 5 media included pulp and paper mill biosolids, which may contain a significant amount of PO4 (Vance, 2000). As a result, the elevated PO4-P concentration observed in Cell 5 effluent may have been derived from the degradation of the biosolids. In spite of the increase in PO4-P concentrations observed in the effluent of Cell 5, the concentration of PO4-P in the total system effluent was much lower (∼70%) than in the untreated wastewater (Fig. 2).
Characterization of phosphorus-bearing BOFS solids from Cell 4
Field emission-scanning electron microscopy
FE-SEM images and EDX spectra were collected from samples of the fresh and spent BOFS material. A very low P mass, ∼0.4 wt%, was observed in the fresh BOFS samples, and up to 8.55 wt% P mass was observed in the spent BOFS samples. The mass of P was greatest in samples obtained within close proximity to the effluent end of the distribution manifold and gradually decreased with depth at all locations (Supplementary Fig. S5). Elemental maps and EDX spectra obtained from polished sections of samples collected near the effluent end of Cell 4 (e.g., sample S-20; Supplementary Fig. S5) indicate accumulation of P on the grain boundaries (Fig. 4).

High magnification BSE image, X-ray intensity element maps, and energy dispersion X-ray (EDX) spectra for a phosphorus-rich area (area 1) and an area with no phosphorus accumulation (area 2). FTIR ATR, fourier transform infrared attentuated total reflectance. FTIR ATR, fourier transform infrared attentuated total reflectance.
Fourier transform infrared spectroscopy
Features of the FTIR and FTIR-ATR spectra of the samples were consistent with major vibrational bands of phosphate and carbonate phases (Fig. 5). For example, the spectra showed a sharp carbonate v4 band at 712 and 713 cm−1, well defined and broad carbonate v3 band at 1424–1428 cm−1, sharp carbonate v2 band at 873–875 cm−1, and carbonate overtones or combination of the carbonate bands at 1796–1799 cm−1 (v1+v4) and 2513–2514 cm−1 (v1+v3 or 2v2+v4). Weak carbonate overtones or combinations of the carbonate bands at 2872–2876 cm−1 and 2980–2984 cm−1 (2v3) were also observed. The locations of the carbonate v4 and v2 bands along with other carbonate bands indicated that calcite was the main carbonate mineral accumulated on the spent reactive materials (Vagenas et al., 2003; Vongsavat et al., 2006; Ni and Ratner, 2008; Kurap et al., 2010).

FTIR-ATR spectrum from the phosphorus-rich zone on particle surface indicated by a white square in Figure 4.
Phosphate v3, v4, and v2 bands were obtained in most of the samples collected from Cell 4 (Fig. 5 and Supplementary Fig. S6). However, comparatively sharp peaks were observed in the spectrum of sample S-20 at 1045 cm−1 (phosphate v3) and a doublet at 604 and 572 cm−1 (phosphate v4). A very weak shoulder at 963 cm−1 (phosphate v1) and weak peaks at 446 and 454 cm−1 (phosphate v2) were also observed in the spectrum of sample S-20. Similar peaks were observed in sample S-21 (at 1048, 959, 604, 571, 456, and 468 cm−1), however, phosphate v3, v4, and v2 peaks were not as prominent as observed in the spectrum for sample S-20. The phosphate vibrational frequencies observed in samples S-20 and S-21 were similar to those of the reference materials (HAP, HAP-WM, and β-TCP), which are also consistent with previous studies (Rehman and Bonfield, 1997; Pena and Vallet-Regi, 2003; Ribeiro et al., 2006; Singh and Purohit, 2011; Matković et al., 2012). These vibrational bands are consistent with the presence of hydroxyapatite or β-TCP in samples S-20 and S-21.
XANES spectroscopy
XANES spectra, collected for samples from Cell 4 and for the reference materials, displayed a number of pre- and post-edge features (Fig. 6i). The K-edge of reference materials ranged between 2151.5 and 2151.7 eV except for FeP (2152.2 eV). Iron (III) phosphate showed a unique pre-edge feature at 2148.5 eV (−3.7 eV with respect to the K-edge), which is consistent (between−2 and−5 eV) with previous studies (Hesterberg et al., 1999; Beauchemin et al., 2003; Sato et al., 2005; Shober et al., 2006; Khare et al., 2007; Ajiboye et al., 2008; Eveborn et al., 2009). A prominent shoulder at ∼2154.7 eV and pronounced spectral features at ∼2162.5 eV and ∼2169.0 eV were observed in all Ca-PO4 reference materials (Fig. 6i, c, d, e). The relative positions of these features with respect to the P K-edge were similar to the features observed at ∼2170.0 eV and ∼2175.0 eV (Peak et al., 2002) and ∼2159.0 eV and 2166.0 eV (Sato et al., 2005), and they were identified as a signature of Ca-PO4 species and the O-oscillation.

The P K-edge positions of the spent BOFS samples ranged between 2151.4 and 2151.6 eV, which was similar to the range obtained for the reference materials. Although, the XANES spectra of the spent BOFS samples displayed a number of post-edge features similar to the reference materials, no pre-edge spectral features were observed in these samples (Fig. 6i). The locations of the post-edge features of the samples and the reference materials appeared in the similar energy range, but the sharpness of the features substantially varied from one spectrum to another. The spectrum from sample S-20 more closely resembled the crystalline Ca-PO4 reference materials than the spectrum from sample S-21, which contained a lower P mass than S-20. Phosphate sorbed on calcite standards (PSC 1% and PSC 8%) were also included as the reference materials. The S-20 spectrum exhibited post-edge features that were similar to the PSC standards (Fig. 6i). These spectral similarities suggest that P contained in sample S-20 may be present as PSC. The unnormalized P-XANES spectrum of the unused BOFS was low in intensity compared with the spectrum of the surface sample of the spent BOFS (S20, outer layer) and to the spectrum of PSC 1% (Supplementary Fig. S7).
LC fitting was conducted to determine the similarity between the spectra for the spent BOFS samples and the spectra for the reference materials. The XANES spectrum of FeP was excluded from the LC fitting analysis because of its unique pre-edge feature at 2148 eV (a, Fig. 6i). A combination of PSC 1%, HAP, and α-TCP provided the best fit (χ2 value of 0.178) for sample S20, and a combination of PSC 1%, HAP, and AlPO4 provided the best fit (χ2 value of 0.138) for sample S21. However, the contribution from AlPO4 was not significant (∼ 2%) (Fig. 7a and Table 2).
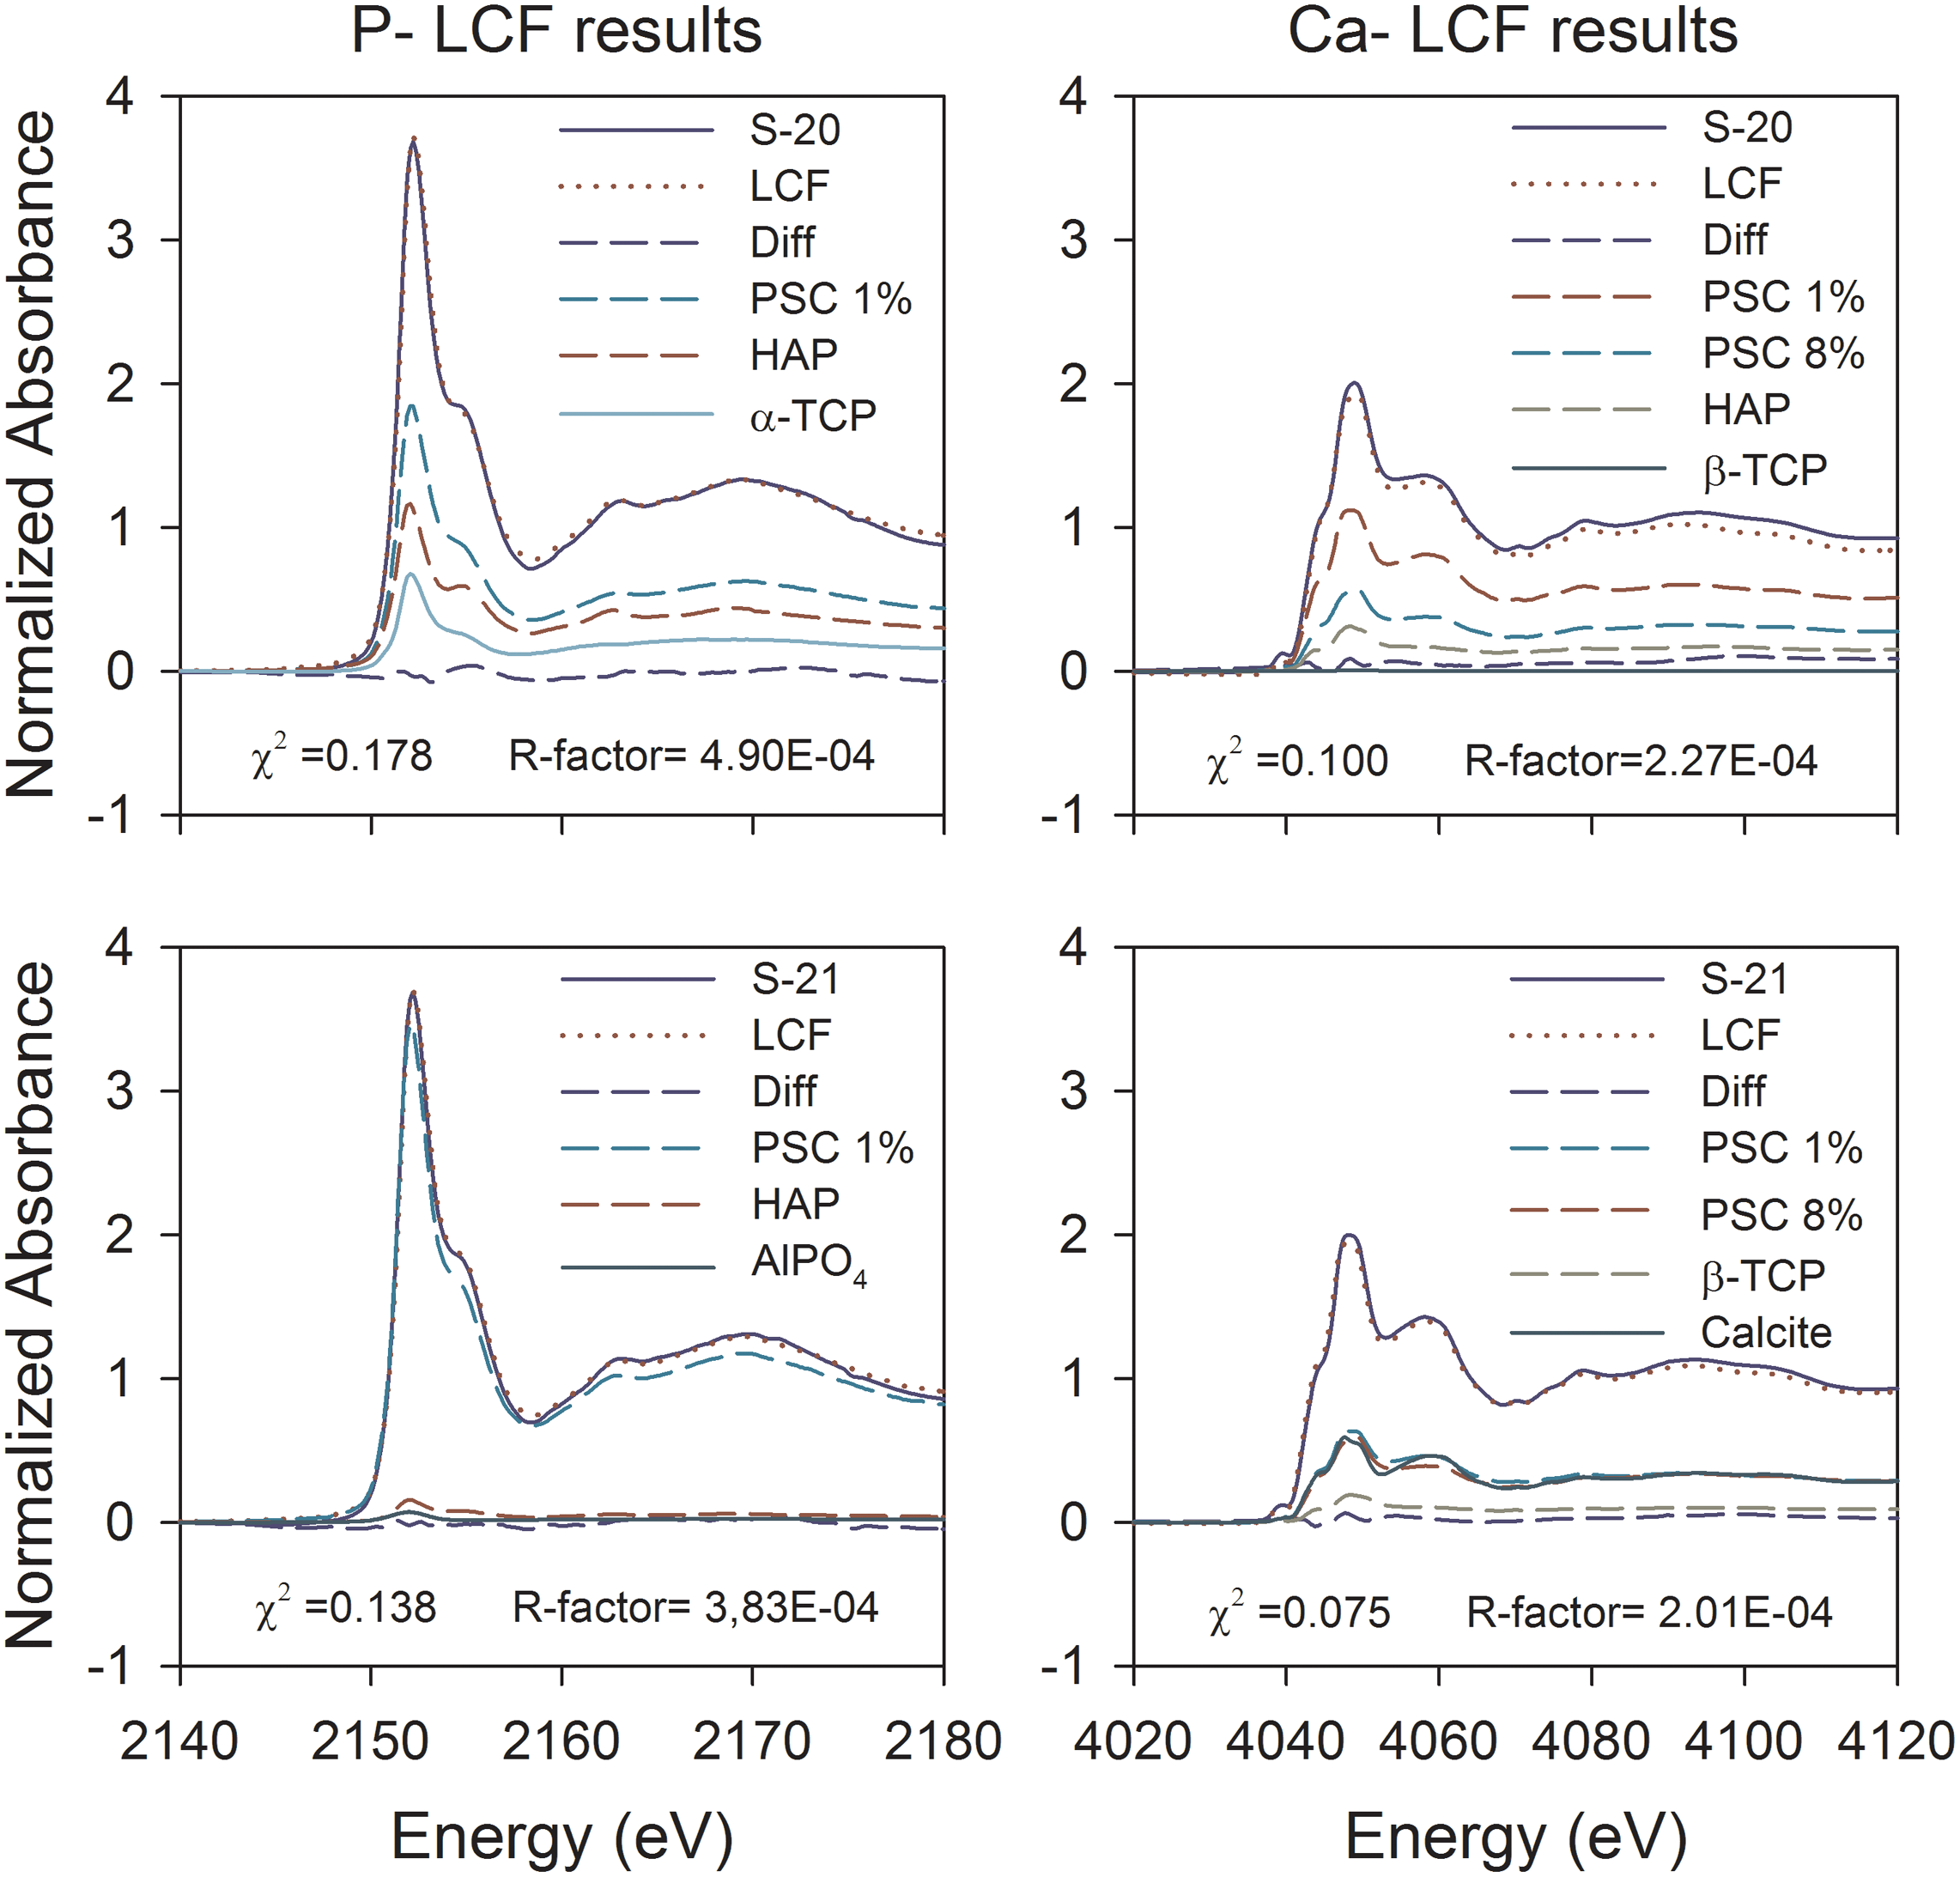
Linear combination fit results showing contributing P- and Ca-reference materials in spent BOFS samples S-20 and S-21. BOFS, basic oxygen furnace slag.
CPDD, calcium phosphate dibasic dihydrate; HAP, hydroxyapatite; PSC, phosphate sorbed on calcite; TCP, tricalcium phosphate; XANES, X-ray absorption near edge structure.
A small pre-edge feature was observed in the Ca-XANES spectra for all samples and reference materials at 4039.5±0.3 eV (Fig. 6ii, a). Calcium K-edges were observed within the range of 4046.8±0.2 eV for all samples and the reference materials, which was consistent with other studies (Peak et al., 2002; Eichert et al., 2005). In the Ca spectra for the spent BOFS samples, a pre-edge shoulder at 4043.0 eV (Fig. 6ii, b), a post-edge shoulder at 4059.0 eV (Fig. 6ii, d), and two sharp post-edge features at 4070.4 and 4079.0 eV (Fig. 6ii, e, f) were observed. The PSC 0.004%, PSC 1%, and PSC 8% Ca spectra displayed a wide post-edge shoulder at 4059.0 eV, which is similar to the spectra obtained for the calcite reference material used in this study and in previous studies (Millo et al., 2012). A second distinctive post-edge feature was observed at 4094.0 eV in the spent BOFS samples, which is consistent with the PSC and calcite reference materials (Fig. 6ii, g). An additional post-edge feature in the spectra for other reference materials was observed at 4091.0±4.2. The LC fitting analysis showed that a mixture of PSC 1%, PSC 8%, HAP, and β-TCP provided the best fit for sample S-20 (χ2 value of 0.1), and a mixture of PSC 8%, PSC 1%, and calcite, provided the best fit for sample S-21 (χ2 value of 0.075) (Fig. 7b and Table 2).
Ammonia and nitrate
There was a sharp difference in influent NH3-N concentrations between Phase 1 (7.7±7.6 mg/L) and Phase 2 (51.0±26.1 mg/L) of the experiment (Fig. 3). The removal of NH3-N in Cells 2, 3, and 4 was 97%, with the greatest decrease in NH3-N concentrations observed in Cell 3, an aerated wetland cell. Slight increases in NH3-N concentrations were observed in Cell 4 effluent compared with Cell 3. Further increases in NH3-N concentrations were observed in Cell 5, an anaerobic cell, which contained pulp and paper biosolids.
The mean influent NO3-N was low (0.99 mg/L). The NO3-N concentration increased slightly in the effluent from Cell 2. Greater increases were observed in the effluent from Cells 3 and 4 before declining in Cell 5 (Fig. 3) effluent. The mean NO3-N concentrations in the effluents from Cells 3 and 4 (α=0.05, k=5, p<0.05, and p<Pcrit) were significantly greater than the system influent. The mean NO3-N concentration in the final effluent from Cell 5 (5.6 mg/L) was not significantly different from the influent concentration. These trends are attributed to microbially mediated oxidation of NH3-N to NO3-N under the aerobic conditions prevalent in Cells 2 and 3, which was enhanced by the mixing and aeration systems. Subsequent removal of NO3-N and increases in the concentration of NH3-N in Cell 4 is attributed to abiotic NO3-N reduction in the presence of the BOFS. The further decline in NO3-N observed in Cell 5 is attributed to microbially mediated denitrification in the presence of the biosolids, leading to a removal of 70% total N (NH3-N+NO3-N) (Fig. 3).
cBOD5 and COD
Concentrations of cBOD5 in both phases decreased gradually in Cells 2, 3, and 4 effluents (Fig. 2). However, concentrations increased slightly in Cell 5 effluent compared to Cell 4. The removal of cBOD5 in the treatment cells indicates that both aeration cells (Cells 2 and 3) and highly alkaline conditions in the BOFS cell (Cell 4) played an important role in degrading labile organic carbon. The slightly elevated cBOD5 in Cell 5 effluent probably was derived from the breakdown of the biosolids included in the substrate. The COD concentration did not significantly change in Cells 2 and 3, but much lower concentrations were observed in effluent from Cell 4 (Fig. 2). Increased COD concentrations were observed in Cell 5 effluent. Aeration and filtration processes contributed to this decline through oxidation and particulate removal in Cell 2 and Cell 3. In Cell 4, however, the removal of biodegradable organic substances under high pH conditions probably accounts for the lower concentration of COD. The concentration of COD increased again in Cell 5 due to the presence of biosolids in this cell.
Geochemical modeling
Sufficient data were collected for geochemical modeling on four occasions (Supplementary Fig. S8). Saturation index calculations were conducted to determine the tendency for precipitation or dissolution of PO4 and CO3-bearing phases. The influent water was supersaturated with respect to hydroxyapatite, octacalciumphosphate, β-tricalciumphosphate, MnHPO4, calcite, aragonite, gibbsite, goethite, ferrihydrite, and an inferred hydroxyapatite phase (Baker et al., 1998).
The influent water approached saturation with respect to brushite, monetite, vivianite, variscite, and strengite on some sampling occasions. The effluent water of Cells 4 and 5 either approached or attained saturation with respect to these P-bearing phases. Cell 4 effluent was comparatively more saturated with respect to calcite and aragonite than the influent, and in some sampling occasions Cell 5 effluent was undersaturated with respect to these phases. Cells 4 and 5 effluents were undersaturated with respect to gibbsite and ferrihydrite except in some sampling occasions. These calculations indicate that conditions favorable for the formation of calcium carbonate and calcium phosphate phases were prevalent in Cell 4 of the treatment system.
Saturation index values indicate whether the precipitation or dissolution of a target phase is thermodynamically favorable, but these calculations do not confirm the existence of the phase. These results are consistent with the occurrence of calcite and the calcium phosphate phases HAP, β-TCP, and PSC 1% observed in the FTIR and XANES spectra of spent BOFS material obtained from Cell 4.
Trace metals
Concentrations of dissolved trace metals, including Zn, Fe, Mn, Cr, Ni, and Pb, in the treatment system effluent remained low throughout the duration of the experiment. Mean Al concentrations in the effluent from Cells 1, 2, and 3 were <7.5 μg/L, then increased in Cells 4 and 5 to 683 and 401 μg/L (Fig. 2). The sharp increase in Al concentration coincided with the increase in pH in Cell 4 effluent, and it is consistent with the increase in Al solubility observed at high pH values. Following the addition of the pH adjustment cell, the mean Al concentrations in the Cell 5 effluent decreased from 1290 to 20 μg/L, which is consistent with the lower solubility of Al at neutral pH (Stumm and Morgan, 1981). The mean V concentrations in the effluent from Cells 1, 2, and 3 were <1.5 μg/L and then increased to 27 μg/L in Cell 4 effluent before decreasing to 12 μg/L in Cell 5 effluent (Fig. 2). The mean influent Cu concentration was 8.2 μg/L. Although Cu concentrations increased in Cells 1 and 2 effluents, the mean effluent concentration of the system, 9.3 μg/L, was similar to the influent value.
Inactivation of bacterial indicators (E. coli and total coliforms)
Mean influent concentrations of E. coli and total coliforms were 104.34 and 104.95 CFU 100 mL−1, which sharply decreased (>99%) while passing through Cell 3 by aeration and the bacterial indicators were completely (∼100%) attenuated in Cell 4 (Fig. 2). The sharp decline in E. coli and fecal coliform in Cell 4 is attributed to the abrupt increase in pH (up to pH 12) observed in this cell. Elevated pH is not the only factor that can cause die off of fecal coliform (Fernandez et al., 1992).
The presence of high concentrations of heavy metals can cause inactivation of pathogens through damage or destruction of the cell membrane, formation of oxidative stress environment within the cell structure, interference with vital function of the cell, damage to DNA and protein through reduction, and displacement of essential metals from their natural binding sites (Varkey et al., 2013). It is unlikely, however, that E. coli were affected by dissolved metals present in the treatment system pore water. Agarwal et al. (2005) reported that E. coli can grow at concentrations of dissolved metals (Cr, Fe, Zn, Mn, and Cd) of up to 250 ppm; concentrations much greater than observed in this system. Thus, no additional disinfection was required downstream of Cell 4.
Hydraulic performance
Mean flow rate was 68 L/day, and it varied depending on the supply of waste water. Previous studies of BOFS treatment systems indicated declines in hydraulic performance due to clogging by mineral precipitation (Hussain et al., 2014). Cell 4 was uncovered and excavated after completion of the experiment to assess the extent and nature of secondary mineral formation. Green algae were noted on the top part of the cell; white precipitates on the distribution manifold and coatings of yellowish brown precipitates on reactive materials were observed. Cemented media was encountered along the outlet side of the cell. These precipitates reacted vigorously with HCl. The FE-SEM images and EDX data indicated a composition consistent with carbonate phases rich in Ca and P (Supplementary Fig. S9). It is likely that the effluent from Cell 3 (influent for Cell 4) contained an elevated HCO3− concentration, which reacted with Ca derived from the BOFS to form CaCO3. Although approximately 15% (by volume) of the media was cemented by carbonate precipitates, the media remained permeable. Thus, a similar system configuration can be anticipated to operate without a significant decline in hydraulic performance. However, provisions for removing precipitates from the piping network could be incorporated in future designs.
Longevity of BOFS
Based on the influent and effluent concentration of P and the total mass of the BOFS (obtained from the density, porosity, and volume of the BOFS used in the cell) the mass of P retained in Cell 4 was approximately 85 mg/kg-1. The BOFS cell was a sealed unit with no sampling ports other than the influent and effluent. Thus, it was not possible to determine the maximum distance of the C/C0=0.5 advance inside the BOFS cell. The extent of dissolved PO4-P removal did not decline during the experiment. However, in another experiment, Hussain et al. (2014) observed that a similar BOFS mixture retained 73 mg/kg P in 3 months period at an input concentration of 0.25–0.5 mg/L. Bowden et al. (2009) reported a very high P removal capacity for BOFS (8390 mg/kg at an input P concentration of 100–300 mg/L). These observations suggest the potential for the BOFS media to remove P over a very long period.
Conclusions
Results of this study suggest that an integrated treatment system with addition of BOFS can be used for removal of multiple contaminants from wastewater including P, cBOD5, COD, NH3, total coliform, and E. coli. Removals were often >99% with respect to the system influent. Mineralogical studies indicate that P was removed through adsorption on calcite and precipitation of β-TCP and HAP. The incorporation of BOFS in the treatment system led to the development of elevated pH conditions and increased concentrations of V and Al. The pH of the system was neutralized by sparging with CO2(g). This change in pH led to removal of Al. No significant change in hydraulic performance of the treatment system was observed. In addition to P removal, disinfection of the wastewater was observed, likely due to the elevated pH conditions generated by dissolution of BOFS components.
Footnotes
Acknowledgments
This research was supported by the Natural Sciences and Engineering Research Council (NSERC) of Canada, the Ontario Ministry of Research and Innovation Research Excellence Fund, the Lake Simcoe Region Conservation Authority, the Lake Simcoe Clean-up Fund of Environment Canada and the Ontario Ministry of the Environment. The XANES experiments were performed at the Canadian Light Source, which is supported by NSERC, NRC, CIHR, and the University of Saskatchewan on the 06B1-1 (SXRMB) beamline as part of proposal # 16-4419 and 18-5318. We thank Y. Hu for assistance with synchrotron spectroscopy. We also thank B. Gibson, K.T. Leung, N. Heinig, J. Fisher, H. Siu, M. Biesinger, J. Bain, L. Groza, J. Hu, Stephanie Collins, Heather Broadbent, and Jing Ma for their assistance.
Author Disclosure Statement
No competing financial interests exist.
References
Supplementary Material
Please find the following supplemental material available below.
For Open Access articles published under a Creative Commons License, all supplemental material carries the same license as the article it is associated with.
For non-Open Access articles published, all supplemental material carries a non-exclusive license, and permission requests for re-use of supplemental material or any part of supplemental material shall be sent directly to the copyright owner as specified in the copyright notice associated with the article.