
Abstract
Abstract
The overall aim was to identify the microorganisms responsible for carbon uptake from ethylbenzene in soil microcosms using culture-independent methods. Ethylbenzene degradation was observed in only 1 (nitrate-amended agricultural soil) of the 31 different experimental setups tested. To determine which microorganisms were responsible for 13C uptake, stable isotope probing was combined with high-throughput sequencing Illumina amplicon sequencing. For this, total genomic DNA and heavy fraction samples from the live control microcosms (amended with 12C6 ethylbenzene) and sample microcosms (amended with 13C6 ethylbenzene) were subjected to Illumina amplicon sequencing. Several phylotypes were relatively more abundant in the heavy fractions from the 13C6-labeled ethylbenzene-amended soil microcosms compared to the heavy fractions from the live controls. This included unclassified phylotypes within the families Xanthomonadaceae and Rhodocyclaceae. In addition, the total microbial community was characterized in six ethylbenzene degrading microcosms and was dominated by the genus Rhodanobacter (relative abundance 11.7–15.6%), although this phylotype did not illustrate 13C uptake. Azoarcus, a known ethylbenzene degrader, was dominant in only two of the six microcosms. The work indicates that microorganisms not previously linked to ethylbenzene degradation have significant roles in the carbon uptake from this contaminant.
Introduction
H
Among the BTEX chemicals, toluene is the most studied and perhaps the most readily amenable to anaerobic biodegradation (Weelink et al., 2010). Several microorganisms have been isolated that are able to metabolize or mineralize toluene under nitrate-reducing (Dolfing et al., 1990; Schocher et al., 1991), iron-reducing (Lovley and Lonergan, 1990), and sulfate-reducing (Beller et al., 1996) conditions (the majority belong to the phylum Proteobacteria and a few to Firmicutes). Isolates have also been shown to degrade m- or o-xylene under nitrate-reducing (Dolfing et al., 1990), sulfate-reducing (Morasch et al., 2004), and iron-reducing (Kunapuli et al., 2010) conditions. In contrast, there have been reports of only three nitrate-reducing benzene-degrading isolates (Chakraborty et al., 2005; Kasai et al., 2006). After benzene, ethylbenzene is perhaps the next most difficult to degrade among the BTEX compounds. To date, anaerobic ethylbenzene degradation has been shown to be carried out by several nitrate-reducing or sulfate-reducing bacteria (Weelink et al., 2010). These include two Azoarcus sp. strains (Aromatoleum aromaticum EbN1 and EB1) (Rabus and Widdel, 1995; Ball et al., 1996; Wohlbrand et al., 2007), Dechloromonas aromatica RCB (Coates et al., 2001; Chakraborty et al., 2005), Georgfuchsia toluolica (Weelink et al., 2009), and Desulfobacteraceae strain EbS7 (Kniemeyer et al., 2003). Interestingly, all except strain EbS7 (Deltaproteobacteria) belong to the family Rhodocyclaceae (Betaproteobacteria). More information concerning the diversity of microorganisms involved in ethylbenzene degradation would contribute to our understanding of the biodegradation potential of this chemical at contaminated sites.
The current limited information on ethylbenzene degraders can, in part, be attributed to the limitations associated with traditional microbiological methods (only a minor percent of existing bacteria can be cultured in the laboratory). Culture-independent methods, such as stable isotope probing (SIP), can often circumvent these limitations. For example, SIP studies have identified novel microorganisms involved in geochemical cycles (Radajewski et al., 2000; Whitby et al., 2005) and in biodegradation of environmental pollutants (DeRito et al., 2005; Singleton et al., 2005; Luo et al., 2009; Sun and Cupples, 2012; Sun et al., 2012, 2014a) that were not previously identified using culture-based techniques. SIP involves the addition of a labeled substrate (e.g., 13C-labeled toluene) to a mixed community, ultracentrifugation of the extracted DNA, and the analysis of the heavy fractions of the SIP gradient to identify the phylotypes responsible for label uptake. Previously, we have used terminal restriction fragment length polymorphism (TRFLP) and clone libraries (with traditional Sanger sequencing) to identify the organisms enriched in the labeled treatments during SIP experiments (Luo et al., 2009; Sun et al., 2010b, 2012, 2014a, 2014b; Xie et al., 2010, 2011; Sun and Cupples, 2012). However, extensive 16S rRNA gene clone libraries are needed to identify the enriched TRFLP fragments. In fact, researchers have previously reported that they were unable to identify 25% (2 of 8) of TRFLP fragments thought to be responsible for label uptake (Andeer et al., 2013). Replacing TRFLP and clone libraries with next generation sequencing has the potential to provide a greater depth of information on the occurrence of specific phylotypes in SIP gradients. For example, in 2011, researchers have used pyrosequencing on total DNA extracts in an SIP study to investigate the microorganisms involved in toluene degradation at a tar oil-contaminated aquifer (Pilloni et al., 2011).
In the current study, the overall aim was to identify microorganisms that are able to uptake 13C from ethylbenzene (or ethylbenzene degradation products) in soil-based microcosms, using culture-independent methods (SIP and high-throughput sequencing). For this, the relative abundance of phylotypes present in the heavy fractions of two labeled and two unlabeled ethylbenzene-amended microcosms from one soil were compared. The phylotypes with a high relative abundance in the heavy fractions of the labeled ethylbenzene-amended microcosm (compared to similar fractions in the unlabeled amended microcosms) were deemed responsible for incorporating the labeled carbon from ethylbenzene (or ethylbenzene degradation products). An underlying hypothesis of this work was that these techniques would produce a more diverse group of ethylbenzene degraders than those previously reported.
Materials and Methods
Chemicals
Unlabeled and labeled ethylbenzene (phenyl-13C6, 99%) were purchased from Sigma-Aldrich (St. Louis, MO). Other reagents were purchased from one or more of the following vendors: Fisher Bioreagent (Thermo Fisher Scientific, Fair Lawn, NJ), Invitrogen (Life Technologies, Grand Island, NY), and Sigma-Aldrich, unless stated otherwise.
Development of ethylbenzene-degrading microcosms
A wide variety of inocula and electron acceptor conditions were tested for ethylbenzene degradation using microcosms prepared under strict anaerobic conditions in an anaerobic chamber (Coy Laboratory Products, Grass Lake, MI). The inocula sources consisted of 12 different agricultural soil samples (collected from Michigan), activated sludge samples (from two wastewater treatment plants), and digested manure samples (from an anaerobic digester at the Michigan State University). These sources were selected because previous research indicated their BTEX degradation potential (Sun et al., 2010b, 2014b; Xie et al., 2010, 2011). The inocula sources were tested under nitrate-amended, sulfate-amended, iron-amended, and/or methanogenic conditions in the presence of an anaerobic minimal basal media (Yang and McCarty, 1998). For this, triplicate microcosms were prepared with 6 to 10 g (wet weight) of the inocula source, 30 mL of the anaerobic basal media, and 20 mg/L of unlabeled ethylbenzene in a 160-mL serum bottle. Electron acceptors were amended (1 g/L of SO42− or NO3− or Fe3+) as required. Microcosms were sealed using rubber stoppers and aluminum seals in the anaerobic chamber. All incubations were monitored for ethylbenzene removal for up to 8 weeks (data not shown). Among the 31 different incubations, only the triplicate microcosms prepared with an agricultural soil inocula amended with nitrate showed ethylbenzene degradation. This soil was used to inoculate the microcosms for the SIP study (prepared as above). For the SIP study, triplicate killed controls were amended with unlabeled ethylbenzene (20 mg/L). In addition, four microcosms were prepared with 20 mg/L of unlabeled ethylbenzene (hereafter, called Unlabel EB 1, Unlabel EB 2, SIP Unlabel EB 1, and SIP Unlabel EB 2) and two live sample microcosms were prepared with 20 mg/L of labeled ethylbenzene (phenyl-13C6, 99%) (hereafter, called SIP Label EB 1 and SIP Label EB 2). From these, DNA extracted from SIP Unlabel EB 1, SIP Unlabel EB 2, SIP Label EB 1, and SIP Label EB 2 was used for SIP analysis (ultracentrifugation and fractionation) and total microbial community analysis, whereas DNA extracted from Unlabel EB 1 and Unlabel EB 2 was only used for microbial community analysis. This allowed the comparison of the microbial community across six microcosms. All microcosms were incubated at room temperature (∼20°C), without shaking. A summary of the microcosms used in these experiments is provided in Supplementary Table S1.
Analytical techniques
Ethylbenzene biodegradation was monitored over time by measuring headspace ethylbenzene concentrations in the microcosms. Sampling days for the SIP microcosms were determined based on the results of the initial screening microcosms. For this, 200 μL of headspace samples was injected into a gas chromatograph (PerkinElmer, Waltham, MA) attached to a flame ionization detector and an AT-624 capillary column (30 m, 0.53 mm ID, 3.0 μm; J&W Scientific, Folsom, CA) with helium as carrier gas. The oven temperature was set to 150°C while the injector port and detector temperature were set to 200°C with an ethylbenzene elution time of 2.3 min. Nitrite and nitrate measurements were made only on day 1 and 22 using ion chromatography (Dionex series 2000i/SP, 4×250 mm; Dionex IonPac® AS4A-SC Sunnyvale, CA).
DNA extraction and isopycnic centrifugation
Total genomic DNA was extracted from the six microcosms (two labeled and four unlabeled ethylbenzene amended) using the Power Soil DNA extraction kit following the manufacturer's instruction (MO BIO Laboratories, Inc., Carlsbad, CA) on the degradation of ethylbenzene. The extracted DNA from SIP Unlabel EB 1, SIP Unlabel EB 2, SIP Label EB 1, and SIP Label EB 2 was ultracentrifuged in cesium chloride gradients separately to obtain density-resolved gradients and fractions. Approximately 10 μg of total genomic DNA was mixed with a Tris-EDTA (pH 8.0) buffer and CsCl solution (no glycogen was added to the gradient). This mixture was added to 5.1-mL Quick-Seal polyallomer tubes (1.3×5.1 cm; Beckman Coulter, Pasadena, CA), and the buoyant density (BD) of this mixture was adjusted to ∼1.72 g/mL using a model AR200 digital refractometer (Leica Microsystems, Inc., Buffalo Grove, IL) and then sealed using tube toppers (Cordless Quick-Seal Tube Topper; Beckman Coulter). The tubes were then centrifuged at 178,000 g for 46 h at 20°C in a Wx Sorvall Ultra 80 ultracentrifuge fitted with a Stepsaver 70 V6 Vertical Titanium Rotor (Thermo Scientific, Waltham, MA).
The samples were separated into 20 fractions (each 250 μL) by displacing the samples with molecular grade water. A syringe pump attached to a needle (BD, 23G and 1 inch) was used to displace samples from the top of the tube, as fractions were collected from the bottom by gravity, from heavy to light fractions. The BD of each fraction was calculated from the refractive index obtained using a refractometer. The DNA from each fraction was recovered using a glycogen and ethanol precipitation. Precipitated DNA was then resuspended in 30 μL polymerase chain reaction (PCR) grade water and stored at −20°C for further analysis. The DNA concentration was quantified in these fractions using replicate measurements with the Qubit assay.
High-throughput amplicon sequencing (Illumina MiSeq™)
Samples were subjected to amplicon sequencing, following the protocol described elsewhere (Caporaso et al., 2011, 2012) (Research Technology Support Facility or RTSF at the Michigan State University). The fractions were analyzed to determine which microorganisms were enriched in the heavy fractions and were therefore responsible for carbon uptake from ethylbenzene (or ethylbenzene degradation products). In addition, the total DNA samples were analyzed with high-throughput sequencing to characterize the total microbial community present. The analysis included four heavy fractions from SIP Unlabel EB 1, SIP Unlabel EB 2, SIP Label EB 1, and SIP Label EB 2. To enable a comparison between fractions, the BD of the selected fractions from the labeled and unlabeled amended microcosms were similar (maximum difference±0.01 g/mL) (Supplementary Table S2 and Supplementary Fig. S1). These fractions were selected because their BD values were similar to those previously reported by our group for SIP label enrichment (Luo et al., 2009; Sun et al., 2010b, 2014b; Xie et al., 2010, 2011; Sun and Cupples, 2012). Illumina-specific fusion primers were used to amplify the V4 region of the 16S rRNA (Caporaso et al., 2011) and to add unique barcodes to samples in each well to enable pooling and sequencing. After the amplicons were checked on 1% agarose gel, equimolar amounts of the sample were pooled to normalize results, purified, and then sequenced on the Illumina MiSeq™ Personal Sequencing System.
The data obtained from amplicon sequencing in the fastq file format was analyzed using Mothur (version 1.32.1) developed by Schloss (2009) and the MiSeq standard operating procedure (SOP) developed by the same laboratory (Kozich et al., 2013). Briefly, barcodes were removed from the sequence data and contigs were made using the forward and reverse reads. Samples from 1 labeled and 1 unlabeled replica each containing 4 fractions and 1 total genomic DNA sample (thus, a total of 10 samples) were analyzed together. The paired-end reads were used to make contigs, were analyzed for errors, and then classified. Sequences that did not assemble well were removed from further analysis. Reads were checked for ambiguous bases and homopolymer length greater than 8 (following the Mothur SOP) to remove sequencing errors. These sequences were then aligned with the SILVA bacteria database (Pruesse et al., 2007) for the V4 region. Chimeras and mitochondrial and chloroplast lineage sequences were removed, and then, the sequences were classified into operational taxonomic units (OTUs). The OTUs were then grouped into taxonomical levels with corresponding confidence levels. Rarefaction curves were generated using Mothur.
Approximately 90,000 final sequences were obtained per sample. The number of sequences obtained per run and the final number of sequences used for the OTU and phylotypes classification are listed in Supplementary Table S3. Sequences that did not assemble well (>275 bp) were dropped from further analysis. Furthermore, an average of ∼3.3% of the remaining sequences were also removed as they were either marked as chimeric by the Uchime algorithm (Edgar et al., 2011) or as belonging to mitochondrial or chloroplast lineage by the Bayesian classifier. The remaining sequences were used for analysis. These sequences were classified into OTUs and taxons by splitting them into bins and clustering them at the order level within each bin at 97% similarity cutoff level.
Cloning and Sanger sequencing
A 16S rRNA gene clone library was constructed by amplifying, cloning, and sequencing the total genomic DNA from SIP Label EB 1. The 16S rRNA gene was amplified using the universal primers: 27F (5′-AGAGTTTGATCMTGGCTCAG) and 1492R (5′-GGTTACCTTGTTACGACTT) (Operon Biotechnologies, Huntsville, AL) using the following cycle program: initial denaturation step (94°C for 5 min), 30 cycles of amplification (94°C for 30 s, 55°C for 30 s, and 72°C for 1.5 min), and final extension step (72°C for 5 min). The amplicons were run on a 1% agarose gel and were then cut and purified using a gel purification kit (Qiagen, Venlo, The Netherlands). The purified amplicons were then cloned using the TOPO TA kit as per the manufacturer's instruction. The cloned Escherichia coli cells were then plated on agar plates with 50 μg/mL ampicillin and grown overnight. The colonies were screened for inserts using blue-white screening and PCR (M13F 5′-TGTAAAACGACGGCCAGT-3′ and M13R 5′-AACAGCTATGACCATG-3′). The positive cells were submitted to RTSF for Sanger sequencing. The sequences obtained were then classified using the Ribosomal Database Project (RDP) “Classifier” (Wang et al., 2007).
The Illumina data have been placed in the NCBI Sequence Read Archive database under BioProject ID PRJNA257333. The clone library data have also been submitted to an NCBI database (GenBank KM362736-KM362822).
Results
Ethylbenzene biodegradation
Ethylbenzene degradation was observed in only 1 of the 31 different incubations over an 8-week period. The lack of ethylbenzene degradation may be a result of the rare occurrence of ethylbenzene-degrading microorganisms (however, no molecular analysis of those samples not illustrating ethylbenzene degradation was performed). In the microcosms amended with agricultural soil and nitrate, >90% of the added ethylbenzene was degraded in 29 days in the sample microcosms, with no significant degradation in the killed abiotic controls (data not shown). There was an initial decrease of ∼5 mg/L in all the microcosms (live and killed) between day 1 and 7. This was possibly due to sorption as no further decrease was noted in the killed control microcosms. Similar degradation rates were observed in the SIP microcosms prepared with this inoculum (Fig. 1). However, replicate microcosms exhibited slightly different rates of ethylbenzene degradation.
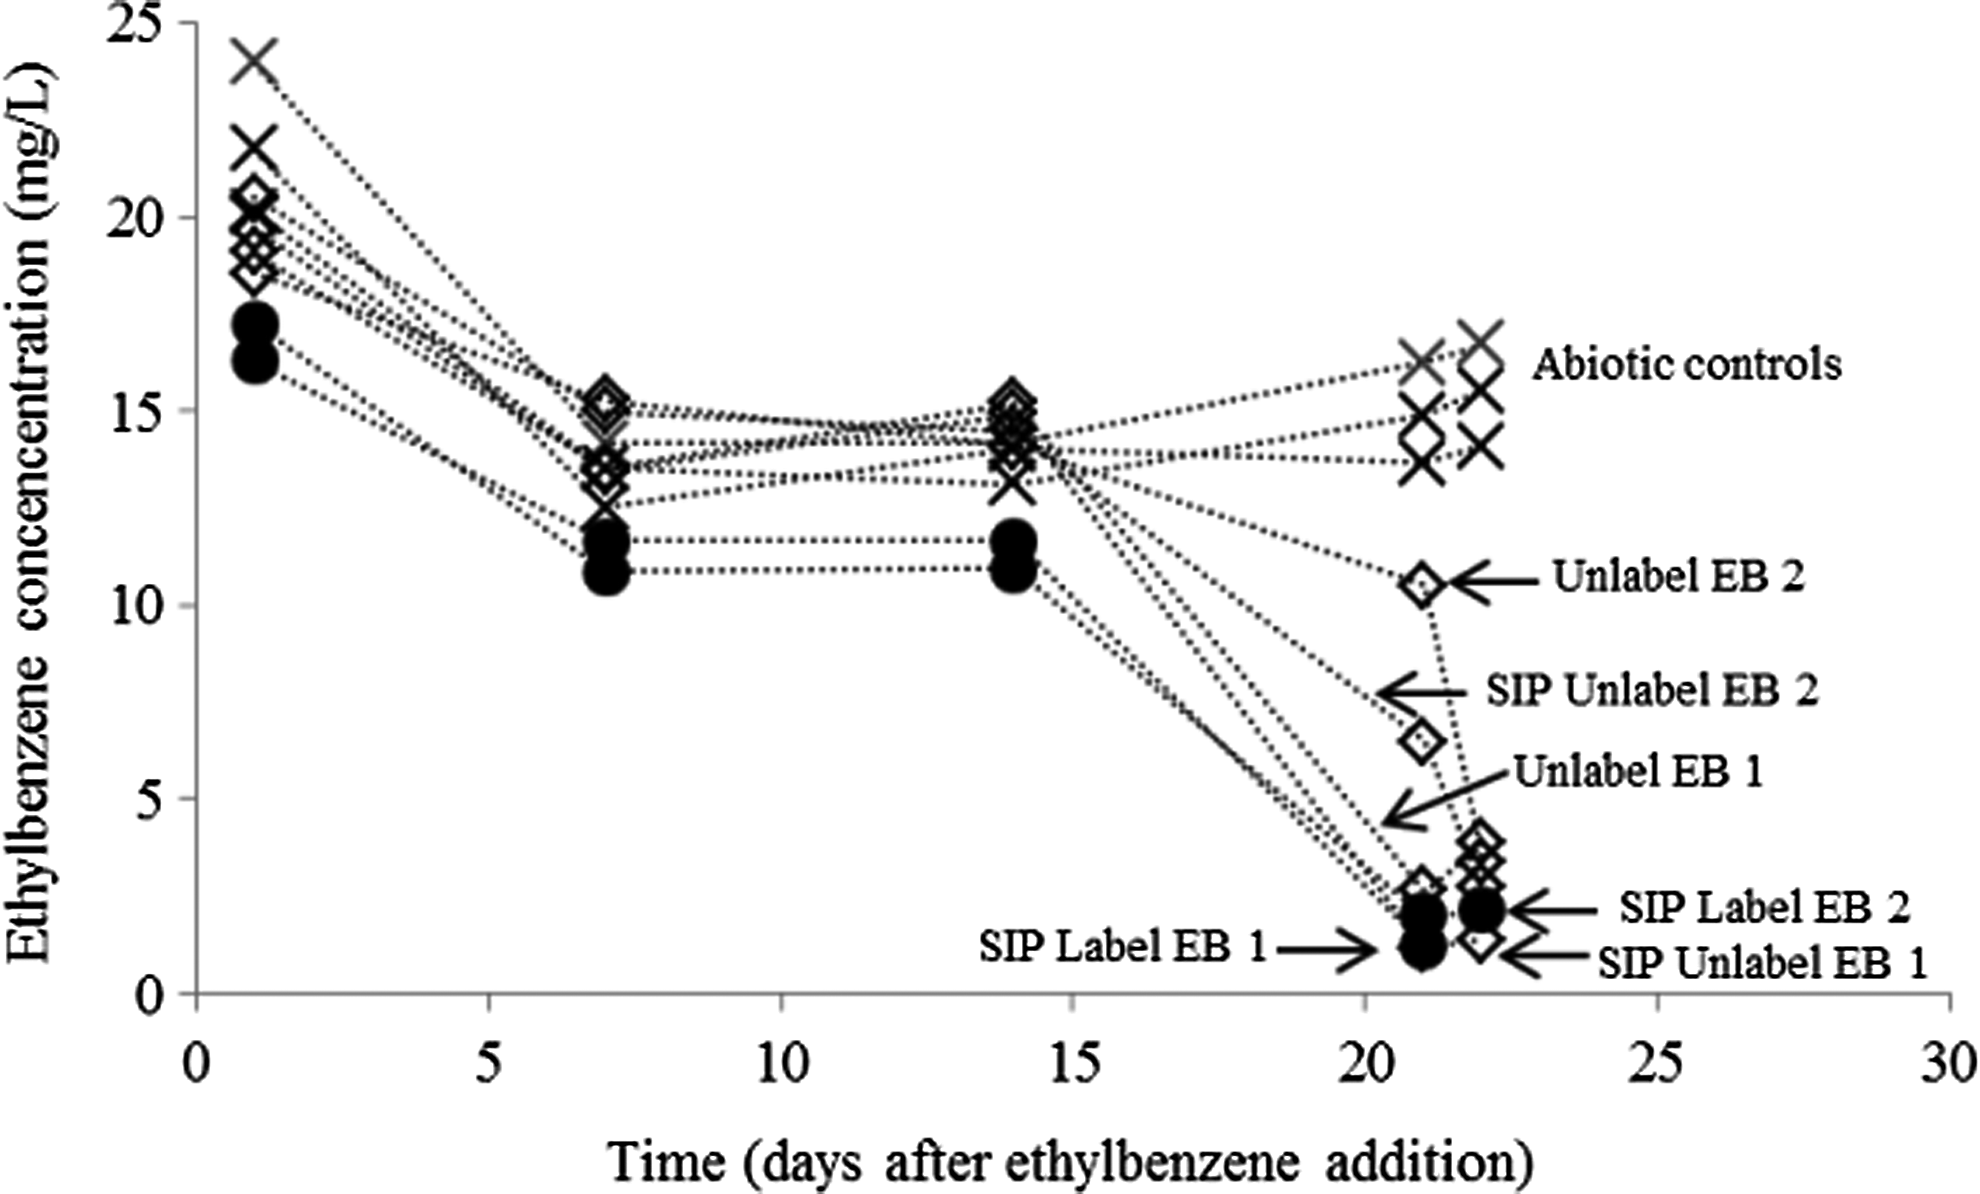
Concentration of ethylbenzene in microcosms over time (×, abiotic controls, open diamonds, amended with 12C6 ethylbenzene, closed circles, amended with 13C6 ethylbenzene).
No significant reductions in ethylbenzene concentrations were observed in the abiotic killed controls (after the initial sorption decrease in all microcosms). An initial lag in degradation was observed in all microcosms, and following this, most degradation occurred in 7 to 10 days. There was also an 80% decrease in the nitrate concentration between day 1 and 22 in the labeled and unlabeled samples, with no significant decrease in the abiotic controls (data not shown). The cause of the lag time is unknown; however, it could be attributable to a shift in redox conditions (e.g., change to sulfate-reducing conditions) or the time taken for the ethylbenzene-degrading community to reach a high enough population to enable ethylbenzene degradation.
Microbial community in ethylbenzene-degrading microcosms
Rarefaction curves indicated an adequate level of sequence coverage for the total community analysis of the six microcosms (Supplementary Fig. S2). As expected, no differences were noted between the coverage in the labeled compared to the unlabeled ethylbenzene-amended microcosms. The OTU classification data of the total DNA samples into phylotypes were used to determine the community composition in each of the six microcosms. Figure 2 shows the phyla level classification of the sequences in the total genomic DNA samples from the six microcosms. A small percentage (4.3–8%) of the sequences were unclassified Bacteria. Proteobacteria was the most abundant phyla in all six microcosms (relative abundance of 58.7–79.1%). The remaining dominant phyla included Firmicutes (6.3–13.17%), Actinobacteria (2.9–8.4%), Acidobacteria (2.0–13.3%), and Bacteroidetes (0.8–4.6%). Microorganisms from both phyla Gemmatimonadetes and Verrucomicrobia were present in all six microcosms at levels between 0.9% and 1.9%. Microorganisms in the phyla TM7, Planctomycetes, Chloroflexi, Deinococcus-Thermus, Armatimonadetes, Chlamydiae, and Nitrospira were present on all six microcosms, but only at lower levels (0.007–0.3%), whereas microorganisms classifying within BRC1, OD1, WS3, Chlorobi, and Lentisphaerae were present in some microcosms, but not in others (when present, <0.006%).
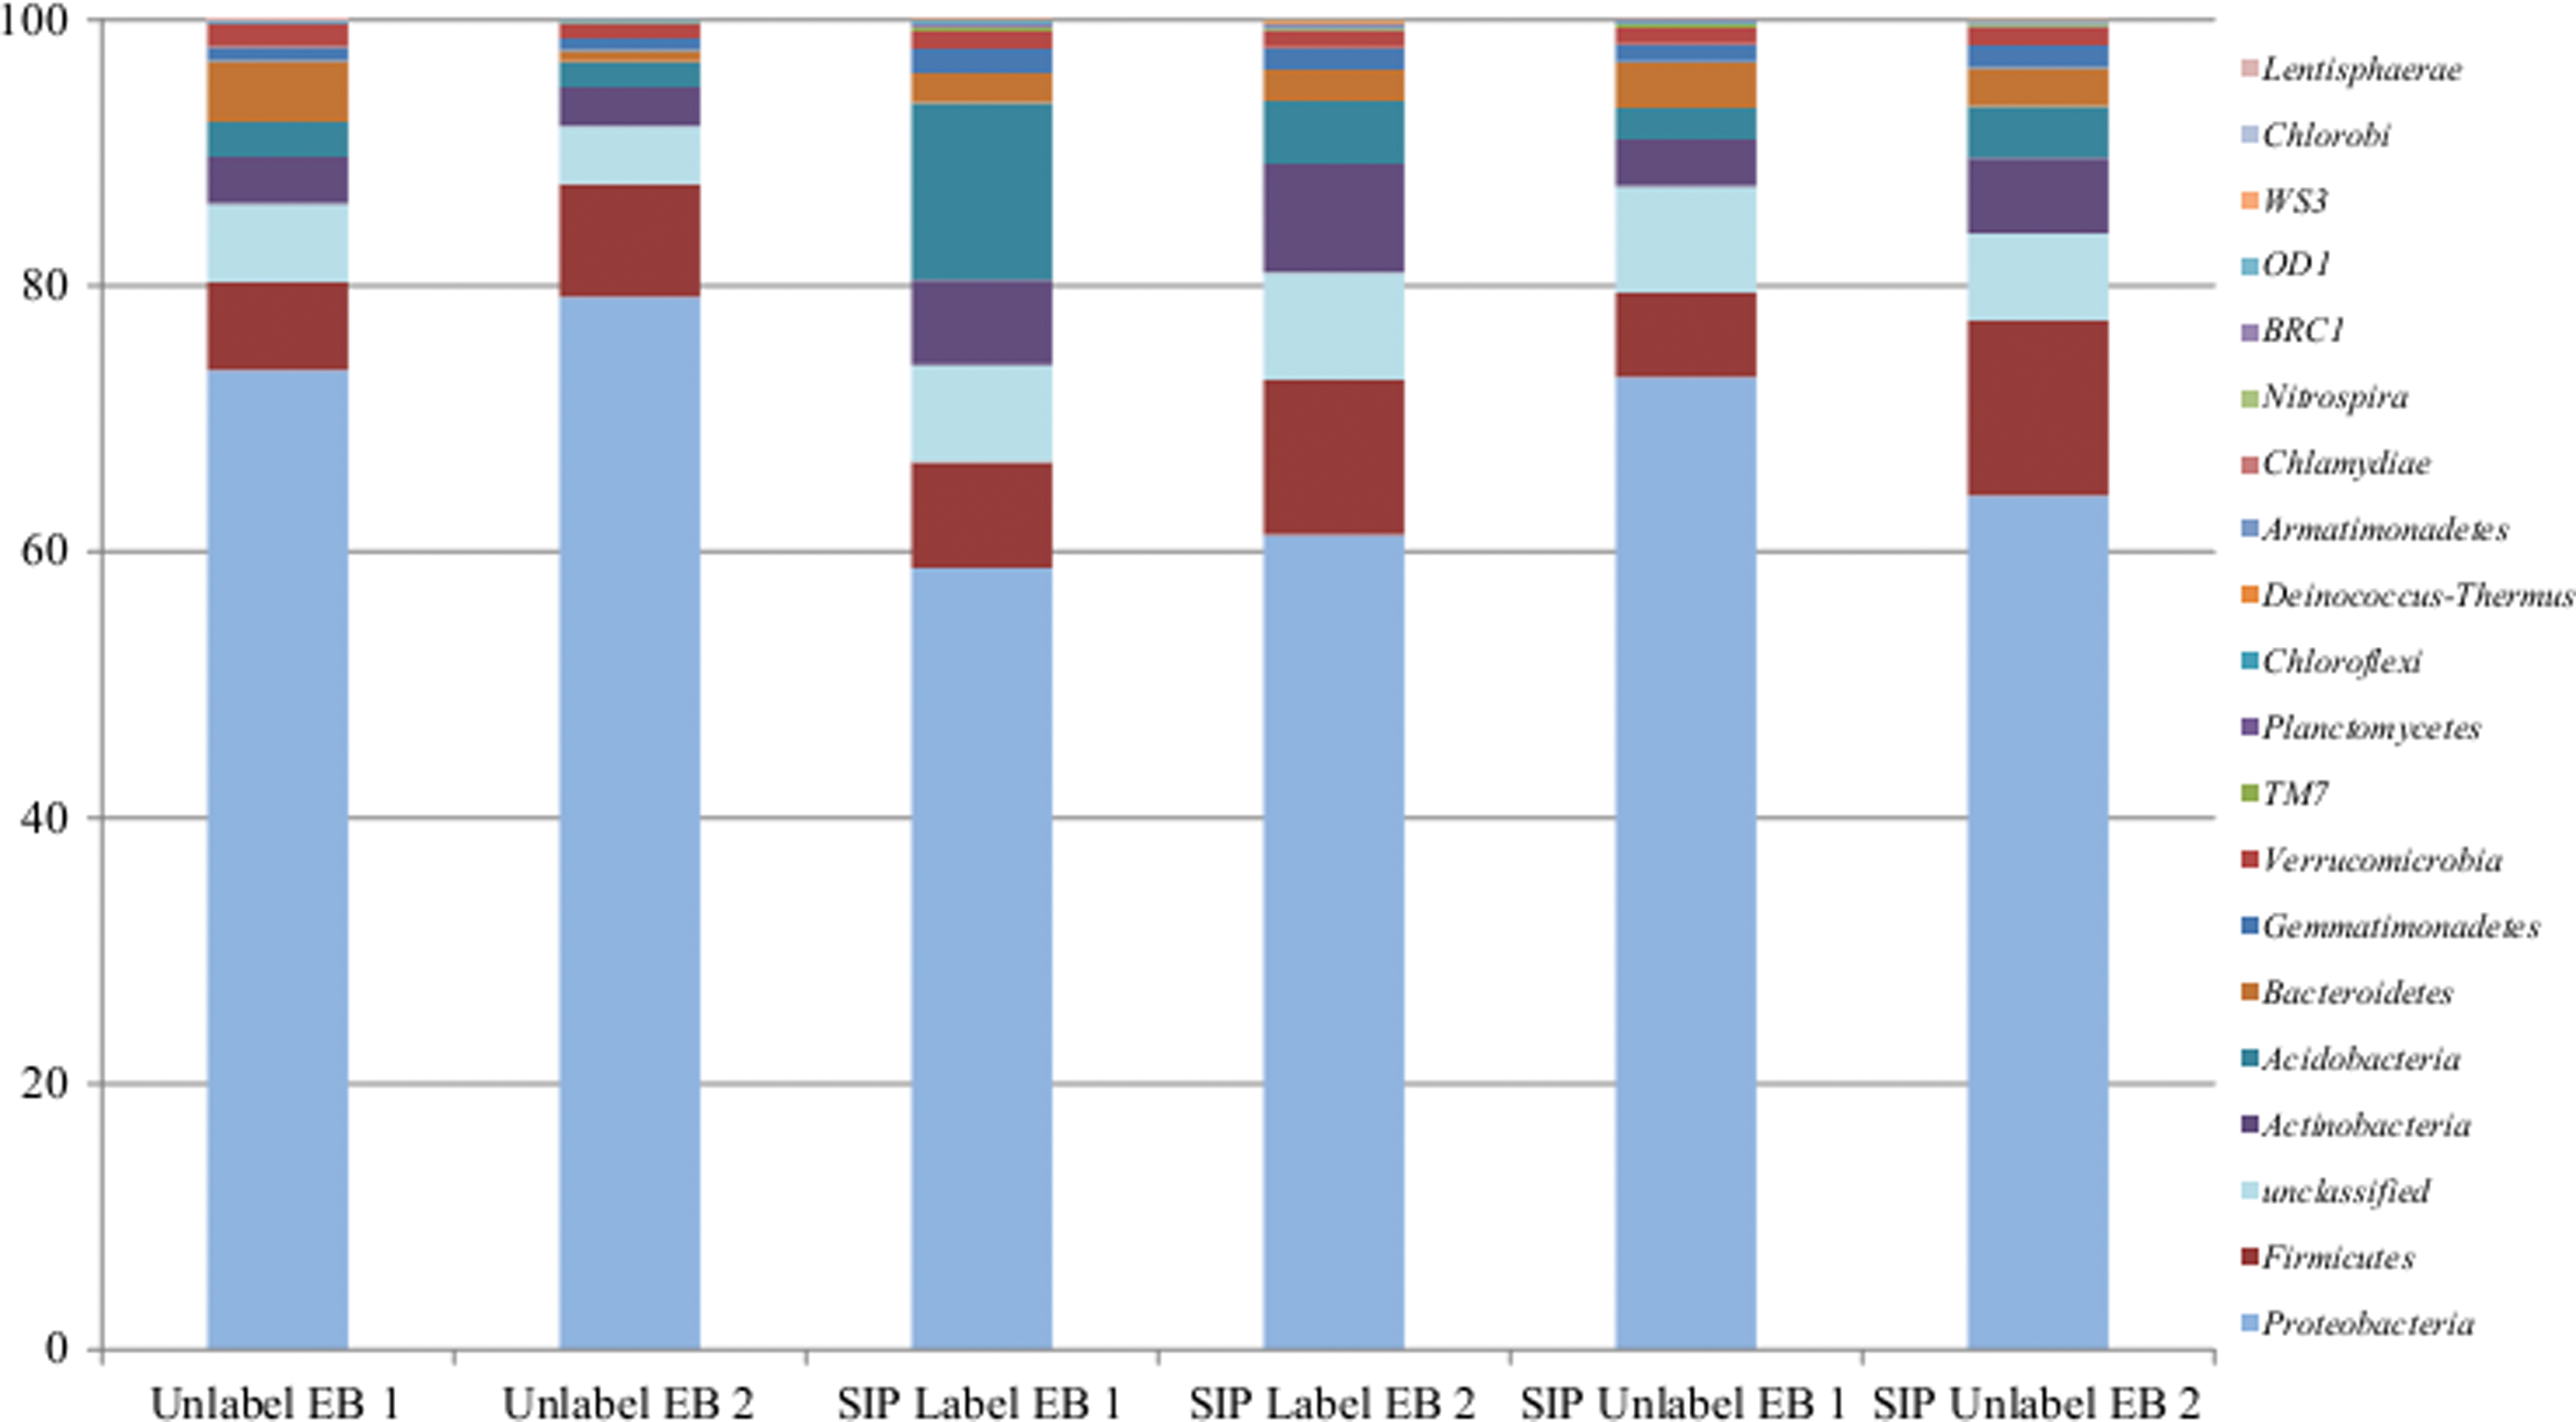
Comparison of relative abundance of sequences in total genomic DNA extracted from six microcosms amended with 13C6 labeled or unlabeled ethylbenzene at phylum level classification.
The relative abundance of all phylotypes with a relative abundance of >1% were compared across all six microcosms (Fig. 3). This resulted in a comparison of 15 phylotypes. In four (Unlabel EB 1, SIP Label EB 1, SIP Label EB 2, and SIP Unlabel EB 2) of the six microcosms, Rhodanobacter (Gammaproteobacteria) was the most abundant phylotype (14.1–15.6%), and in the other two microcosms, it was the second (14.2%, SIP Unlabel EB 1) or third (11.7%, Unlabel EB 2) most abundant phylotype. In two microcosms (Unlabel EB 2 and SIP Unlabel EB 1), Azoarcus was the most abundant phylotype (24.1% and 14.6%); however, in the other four microcosms, it was present at very low levels (<0.006%). In four microcosms (Unlabel EB 1, Unlabel EB 2, SIP Unlabel 1, and SIP Unlabel 2), unclassified Rhodospirillaceae, a family within the Alphaproteobacteria, was the second most dominant phylotype (10.7–14.1%). In the other two microcosms, it was present at lower levels (2.7% and 5.1%). In all six microcosms, unclassified Oxalobacteraceae (Betaproteobacteria) was present at high levels (5.5–14.1%). Unclassified Xanthomonadaceae (the family containing Rhodanobacter) was also present in all six microcosms, but at lower levels (1.9–6.3%). Other unclassified families occurring in all six microcosms at lower levels include Bacillaceae 1 (Firmicutes), Chitinophagaceae (Bacteroidetes), and Comamonadaceae (Betaproteobacteria). Three unclassified orders (Bacillales, Rhodospirillales, and Rhizobiales), unclassified Bacteria, and unclassified Betaproteobacteria were also present in all six microcosms. In addition, two phylotypes classifying as Thiobacillus (Betaproteobacteria) and Gemmatimonas (phylum Gemmatimonadetes) were found in all six microcosms.

Relative abundance (%) of the most common phylotypes (>1%, at the lowest classification level) in all six microcosms (from total DNA extracts). The phylotypes are at the genus level, unless unclassified.
16S rRNA gene clone library
A clone library was generated so that a comparison could be performed between traditional Sanger sequencing and high-throughput sequencing data and to provide longer read lengths. The clone library consisted of a 120 clones (Table 1) belonging to 8 different phyla: Proteobacteria (73.1%), Firmicutes (10.9%), Bacteriodetes (8.4%), Acidobacteria (5.0%), Armatimonadetes (0.8%), Gemmatimonadetes (0.8%), TM7 (0.8%), and Verrucomicrobia (0.8%). Among the Proteobacteria, the majority belonged to Betaproteobacteria (45.8% of the total). The major phyla present in the clone library were relatively consistent with the high-throughput sequencing results. Notably, no clones belonging to Actinobacteria were present in the clone library; however, this phylum exhibited a relative abundance of between 2.9% and 8.4% in high-throughput sequencing results. Furthermore, the clone library did not contain representatives from 11 additional phyla that were found in the high-throughput sequencing data. Consistent with the high-throughput sequencing data, the clone library did contain a high number of Rhodanobacter (relative abundance of 10.0%) and unclassified Oxalobacteraceae sequences (25.0%). In contrast, the number of sequences of unclassified Rhodospirillaceae was much lower in the library (3.3%) compared to the Illumina data. Azoarcus was not present in the clone library, however, Gemmatimonas was present (0.83%).
Phylotype relative abundance across SIP fractions
The relative abundance of phylotypes in heavy fractions was compared between the labeled and unlabeled ethylbenzene-amended microcosms to determine which phylotypes could be linked to label uptake. For this, the analysis focused on the most abundant phylotypes in fractions from the labeled ethylbenzene-amended microcosms. The relative abundance of these phylotypes was then compared to their relative abundance in fractions from the unlabeled ethylbenzene-amended microcosms. Overall, seven phylotypes were dominant in the heavy fractions from both the labeled ethylbenzene-amended microcosms (Fig. 4). Rhodanobacter was the most abundant in these fractions; however, the relative abundance was similar in fractions from the labeled and unlabeled ethylbenzene-amended samples, indicating no label uptake. Following this, unclassified Oxalobacteraceae and Rhodospirillaceae were also dominant. A comparison of the relative abundance of these phylotypes indicates that label uptake likely occurred in one labeled ethylbenzene-amended microcosm (SIP Label EB 2), but not in the other (SIP Label EB 1). Unclassified Xanthomonadaceae and Rhodocyclaceae illustrated a higher relative abundance in the fractions from the labeled ethylbenzene-amended microcosms compared to the unlabeled ethylbenzene-amended microcosms. No difference in relative abundance was noted for unclassified Bacillales between treatments. Finally, the phylotype Gemmatimonas was more abundant in fractions from one labeled ethylbenzene-amended microcosm (SIP Label EB 1). Azoarcus was not dominant in the heavy fractions of either labeled ethylbenzene-amended microcosms.

Relative abundance of most common phylotypes in heavy fractions from labeled ethylbenzene-amended (closed diamonds) microcosms compared to those from unlabeled ethylbenzene-amended (open diamonds) microcosms (SIP Label EB1 and SIP Unlabel EB1 on left, SIP Label EB2 and SIP Unlabel EB2 on right). SIP, stable isotope probing.
Discussion
Biodegradation studies using the SIP aim to identify active organisms involved in chemical transformations that are typically not identified using culture-based techniques (Ronen et al., 2008; Kunapuli et al., 2010; Sun and Cupples, 2012). Combining SIP with high-throughput sequencing has the added advantage of a greater depth of analysis (compared to Sanger sequencing). Although Illumina amplicon sequencing produces shorter reads even with paired reads (250 bp) compared to Sanger sequencing (up to ∼1,000 bp) (Kleparnik et al., 1996; Shendure and Ji, 2008), previous studies have shown that the method can still resolve the differences between microbial communities (Caporaso et al., 2011). The data generated in the current study indicated that one clone library (120 clones) with Sanger sequencing provided a weaker representation of the microbial community compared to the Illumina data. For example, Actinobacteria, a major phylum in the Illumina data, was absent from the clone library, as were 11 other phyla (that were present in the Illumina data). The contrasting results from these two sequencing methods are consistent with previous studies that used both techniques. The large amount of sequencing information from amplicon sequencing is an improved predictor of phylotype relative abundance (Bell et al., 2011; Pilloni et al., 2011; Xia et al., 2011) and thus has a great potential for SIP studies. The clone library data were generated in this study to obtain longer read lengths for the expected enriched phylotypes. However, as the enriched phylotypes were unclassified at the family level, the longer sequences did not provide additional useful information. When the longer sequences were compared to GenBank sequences, they were only similar to other unclassified microorganisms.
Although Rhodanobacter was the most abundant phylotype in the majority of the six microcosms, its relative abundance was similar in the fractions obtained from the labeled and unlabeled ethylbenzene-amended microcosms, indicating that it was not responsible for label uptake. Phylotypes from the families Oxalobacteraceae and Rhodospirillaceae appeared to be involved in carbon uptake from ethylbenzene in one microcosm (SIP Label EB 2). According to the Ribosomal Database Project (http://rdp.cme.msu.edu/index.jsp), Oxalobacteraceae (order Burkholderiales, class Betaproteobacteria) contains 11 genera and Rhodospirillaceae (order Rhodospirillales, class Alphaproteobacteria) contains 27 genera. Any of these genera could be responsible for label uptake in this microcosm. The phylotype Gemmatimonas was more abundant in the fractions from one labeled ethylbenzene-amended microcosm (SIP Label EB 1). This microorganism belongs to the phylum Gemmatimonadetes, which only contains one genus (with 15 known isolates), with the first isolate being obtained in 2003 (Zhang et al., 2003). The family Xanthomonadaceae (order Xanthomonadales, class Gammaproteobacteria) contains 21 genera and phylotypes within this family appeared to responsible for label uptake in both the labeled ethylbenzene-amended microcosms. Again, any of these genera could be responsible for label uptake. To date, all known anaerobic ethylbenzene-degrading isolates belong to the families Desulfobacteraceae or Rhodocyclaceae.
Phylotypes within the family Rhodocyclaceae were also more abundant in the fractions from the labeled ethylbenzene-amended microcosms compared to similar fractions from the unlabeled ethylbenzene-amended microcosms. This pattern indicates that phylotypes classifying as Rhodocyclaceae were involved in carbon uptake from ethylbenzene (or ethylbenzene degradation products). These results are consistent with pure culture studies, as the majority of anaerobic ethylbenzene-degrading isolates belong to this family. Previous research has indicated that phylotypes classifying as Rhodocyclaceae (Azoarcus, Dechloromonas, Georgfuchsia spp.) are capable of ethylbenzene degradation (Rabus and Widdel, 1995; Ball et al., 1996; Chakraborty et al., 2005; Weelink et al., 2009). In addition, previous studies have linked organisms from this family to transformation of several organic and inorganic substances, such as phenanthrene (Martin et al., 2012; Regonne et al., 2013), naphthalene (Singleton et al., 2013), other petroleum products (Bell et al., 2011), arsenic (Sun et al., 2010a), uranium (Martins et al., 2010a), chromium (Martins et al., 2010b), and alkanes (Mbadinga et al., 2011). Members of this family are also shown to degrade almost all the BTEX compounds, particularly under nitrate-reducing conditions (Rabus and Widdel, 1995; Ball et al., 1996; Kniemeyer et al., 2003; Chakraborty et al., 2005; Kasai et al., 2006; Rotaru et al., 2010; Pilloni et al., 2011; van der Zaan et al., 2012). These findings indicate that these microorganisms play an important role in monoaromatic hydrocarbon degradation in isolation as well as in mixed communities. Furthermore, two ethylbenzene-degrading strains, A. aromaticum EbN1 and D. aromatica RCB, were isolated from uncontaminated freshwater sediments. The other sulfate-reducing ethylbenzene-degrading bacterium was isolated from uncontaminated marine sediment, emphasizing the importance of ethylbenzene-degrading bacteria in communities not previously exposed to monoaromatic or polyaromatic hydrocarbons (as in the current study).
In summary, combining the culture-independent technique SIP with high-throughput amplicon sequencing can be a useful approach for investigating the biodegradation of xenobiotics by minority organisms or by a community of organisms. The current work illustrates the utility of these methods for examining carbon pathways in soil communities. Although it was not possible to identify enriched phylotypes at the genus level, important families involved in carbon assimilation were identified. Interestingly, all were classified within the Alpha-, Beta-, or Gammaproteobacteria.
Footnotes
Acknowledgments
Funding for this work was provided by a grant awarded to A.M.C. from the National Science Foundation (Grant 0853249). The authors thank Sarah Wescott (Patrick Schloss Laboratory, University of Michigan) for her advice during the Mothur analysis.
Author Disclosure Statement
No competing financial interests exist.
References
Supplementary Material
Please find the following supplemental material available below.
For Open Access articles published under a Creative Commons License, all supplemental material carries the same license as the article it is associated with.
For non-Open Access articles published, all supplemental material carries a non-exclusive license, and permission requests for re-use of supplemental material or any part of supplemental material shall be sent directly to the copyright owner as specified in the copyright notice associated with the article.