
Abstract
Abstract
A mathematical model system for the kinetics of 2,4-dichlorophenol (2,4-DCP) was derived in a fixed-biofilm reactor using ceramic particles composed of dewatered sludge and fly ash as supporting media. Mechanisms in the kinetic model system included biodegradation of 2,4-DCP by attached and suspended biomasses as well as mass transport diffusion of 2,4-DCP. Batch kinetic tests were independently performed to determine biokinetic parameters of aerobic mixed culture. Molecular diffusion in biofilm (Df), film transfer coefficient (kf), and biofilm shear-loss coefficient (bs) were determined from the literature. Laboratory-scale column tests were conducted to validate the kinetic model system. In a steady-state condition, the removal efficiency for 2,4-DCP was ∼89%. Furthermore, the increase of the 2,4-DCP loading rate from 15 to 41 mg/(L·h) led to a constant removal efficiency of ∼90%. The model-predicted biofilm thickness reached up to 622 μm whereas suspended biomass in the effluent was 35 mg/L. Experimental results for effluent concentrations of 2,4-DCP and suspended biomass agreed closely with the results of the model predictions.
Introduction
C
The physical and chemical methods, including activated carbon adsorption, ion exchange, incineration, have been proposed for treating or recovering chlorophenolic compounds (Raung, 1984). The biological treatment is superior to physicochemical methods such as activated carbon adsorption and incineration because the latter ones have high treatment costs and possibilities of causing a secondary pollution (Wang et al., 2000). Biological treatment can be a viable alternative for CPs removal, since these compounds can be degraded by indigenous microorganisms under aerobic and anaerobic conditions (Annachhatre and Gheewala, 1996; Haggblom et al., 2000). A large amount of work has been carried out on chlorophenol biodegradation, particularly on aspects relating to different pure culture and fungi (Farrell and Quilty, 2002; Kargi and Eker, 2005).
Chemically, 90–99% of the fly ash consists of Si, Al, Fe, Ca, Mg, Na, and K. Si, Al, Fe, and Ca are the major elements present in most compounds, with minor amounts of Mg, Ti, and K, and traces of silicates, oxides, sulfates, and borates (Schumann and Sumner, 2000). Fly ash also contains some trace metals, such as Zn, Cu, Ni, Cr, and V (Sadasivan and Negi, 1991). The application of fly ash in agriculture and forestry, because of its favorable physicochemical properties, including appreciable amounts of K, Ca, Mg, S, and P has been advocated for three decades (Yunusa et al., 2006). Because of the substantial levels of micronutrients, fly ash is suitable for enhancement of soil fertility, which promotes the growth of various crops and non-crop species (Sharma et al., 2001). The application of fly ash may pose a contamination risk to soil, plants, and groundwater due to elevated concentrations of potentially toxic heavy metals (Jankowski et al., 2006).
Dewatered sludge from municipal wastewater treatment and fly ash from coal electric plant became an important environmental issue due to their large quantities and difficult disposal (Han et al., 2009b). Thus, recent studies indicate that the reclamation of dewatered sludge and fly ash is not only to reduce the impact of environmental pollution, but also to lower the posttreatment cost of waste disposal, which benefits the environmental balance and economy (Wang et al., 2005). At present, the dewatered waste sludge produced from municipal wastewater treatment plant was used for additive of cement, production of bricks, and cultivated soil (Zorpas et al., 2003). Fly ash was reused as a substitute of part of cement for reduction of cement use and to lower the energy consumption as well as the production of carbon dioxide (Cao et al., 2007). The raw materials of ceramic particles were primarily obtained from the clay of farmland, however, a great amount of clay used for the production of ceramic particles used in the water and wastewater treatment would harm the conservation of farmland (Han et al., 2009a). Thus, it is urgent to find the suitable materials to replace clay for the production of ceramic particles used in water and wastewater treatment. The characteristics of dewatered sludge and fly ash were similar to clay, thus, the dewatered sludge and fly ash were two good substitutes to replace clay as the materials of ceramic particles used in the water and wastewater treatment (Han et al., 2009a).
Han et al. (2009a) conducted the laboratory-scale upflow anaerobic bioreactor packing with sludge–fly ash ceramic particles (SFCP) or commercial ceramic particles (CCP) for denitrification. Their experimental results indicated that SFCP column, as hydraulic retention time (HRT) became shorter, was superior to comparison to CCP column. Total nitrogen (TN) removal of SFCP and CCP were 88.42% and 82.85%, respectively. Moreover, both columns presented that the removal efficiencies of TN ranged from 97.3% to 99.5% corresponding to volumetric loading rate ranging from 0.48 to 3.69 kg TN/(m3·day). But compared with the CCP column, SFCP column still presented a relative advantage. Therefore, it was assumed that the special characteristics of SFCP such as higher porosity, larger surface area contributed to the better performance.
Biological fixed films exhibit properties that make them preferable to suspended-cell systems for many continuous bioprocess applications. These properties include a high cell density, enhanced cell retention due to cell immobilization, and an increased resistance to the detrimental effects of toxic shock loadings. Therefore, a high removal capacity for organic pollutants can be achieved under conditions of slow microbial growth (Nicolella et al., 2000). Biofilm reactors can be classified between fixed-film systems such as packed-bed bioreactors and particle-based systems such as fluidized bed bioreactors. Particle-based systems allow better mass transfer of contaminants and oxygen and are generally very efficient, but fixed-film systems have been also successfully tested for various organic contaminants (Guieysse et al., 2000; Soares et al., 2003).
Andrews (1968) and Edwards (1970) proposed mathematical models based on Monod biokinetic for both batch and continuous cultures of native cells. These kinetic models were based on the Haldane equation and made use of an inhibition constant, Ki, to relate substrate concentrations to specific growth rates. Buitrón et al. (1998) conducted various batch tests to determine biokinetic coefficients from the adjustment of the Haldane model to the experimental results. Wang et al. (2007) demonstrated that specific 2,4-dichlorophenol (2,4-DCP) biodegradation rates in the granules followed the Haldane model for substrate inhibition in a sequencing batch reactor (SBR). Although biodegradation of CPs by pure cultures, mixed cultures, and granulation in aerobic environments has been investigated (Kargi and Eker, 2005; Salmerón-Alcocer et al., 2007; Wang et al., 2007), the kinetic model of biodegradation of CPs by mixed bacterial consortia in a continuous flow fixed-biofilm reactor has not been reported. Hence, the kinetic model and reactor performance of biodegradation of 2,4-DCP in a fixed-biofilm reactor using dewatered sludge–fly ash composite ceramic particle (DFCCP) as a supporting medium were investigated in this study.
Kinetic models are of value in investigating both the capacity and stability of biological processes which utilize inhibitory substrates. A kinetic model based on the Haldane equation was developed to describe a continuous flow fixed-biofilm process for treating 2,4-DCP by mixed culture. Experimental data were used to verify the kinetic model in fitting measured values of biokinetic parameters obtained from the batch kinetic test. The experimental and modeling results obtained from this study are expected to demonstrate feasible operation strategies to utilize the fixed-biofilm process for an efficient biodegradation of CPs-laden wastewaters.
Kinetic Model
Fixed biofilm model assumptions
To model the kinetics of 2,4-DCP degradation in a fixed biofilm reactor, the following assumptions are made: (1) a stagnant layer covers the biofilm; (2) concentration of substrate within the biofilm are assumed to vary only in the direction normal to biofilm surface; (3) the substrate is transported from bulk liquid to biofilm phase through the stagnant liquid layer by molecular diffusion; and (4) a single substrate is both diffusion and reaction limiting in the biofilm; and (5) biofilm growth does not effect the flow pattern of liquid in the reactor. These assumptions are essentially similar as those made by Williamson and McCarty (1976a) and Suidan and Wang (1985). The steady-state biofilm model incorporated liquid layer mass transport, biofilm molecular diffusion, and Monod kinetics was developed by Williamson and McCarty (1976a). They also conducted a diffusion reactor for nitrification to validate the steady-state biofilm model (Williamson and McCarty, 1976b). The non-steady-state biofilm model developed in this study is a more convenient and utilizable than steady-state biofilm model. Experimental data for verification of the non-steady-state biofilm model are presented.
Diffusion with biodegradation in biofilm
Assuming that 2,4-DCP concentration within the biofilm changes only in the zf-direction normal to the surface of the biofilm, the utilization rate in the biofilm based on diffusion (Fick's law) with biological inhibition reaction (Haldane kinetics) and initial condition can be expressed as (Jih and Huang, 1994):
In the above equations, Sf is the concentration of 2,4-DCP in the biofilm (MsL−3); Df is the diffusion coefficient of 2,4-DCP in the biofilm (L2T−1); Rm is the maximum specific degradation rate of 2,4-DCP (MsMxT−1); Ks is the Monod half-velocity coefficient of 2,4-DCP (MsL−3); Ki is inhibition constant for 2,4-DCP (MsL−3); Xf is the density of biofilm (MxL−3); and zf is the radical distance in biofilm (L). Two boundary conditions are required for Equation (1). One boundary condition shows a no-flux condition at the interface of ceramic particle. The other boundary condition specifies that the flux diffusing into the interface from liquid film must be equal to the flux diffusing out the interface from liquid film into biofilm. Two boundary conditions for Equation (1) can be expressed as
Growth of biofilm
As the 2,4-DCP diffuses into and through the biofilm during biodegradation, the biofilm utilizes 2,4-DCP as carbon source for biosynthesis and respiration. The biomass in the biofilm can increase or decrease with time until the growth rate is balanced by the decay rate and shear-loss rate (Chang and Rittmann, 1987). Since the biofilm grows upon the utilization of 2,4-DCP, the growth rate of biofilm and initial condition can be expressed by the following equation:
where Lf is the biofilm thickness (L); Y is the yield coefficient of biomass (MxMs−1); b is the decay coefficient of biomass (T−1); and bs is the shear-loss coefficient of biofilm (T−1). The initial biofilm thickness must be set to a small value in order that the biofilm can start to grow for model simulation.
Mass balances of 2,4-DCP and suspended biomass
A fixed biofilm reactor in which the kinetic model can be applied is a completely mixed biofilm reactor. All suspended biomass at the liquid/biofilm interface are exposed to the same 2,4-DCP concentration. Since the reactor is operated at a high recycle flow rate and the recycle system can be considered as a part of control volume, thus, the mass balance of 2,4-DCP and suspended biomass in the bulk liquid as well as initial conditions can be described by the following equations:
where Sb is the concentration of 2,4-DCP in the bulk liquid (MsL−3); Sb0 is the concentration of 2,4-DCP in the feed (MsL−3); Ss=concentration of 2,4-DCP at liquid/biofilm interface (MsL−3); Xb is the concentration of suspended biomass in the bulk liquid (MxL−3); Xb0 is the initial condition of suspended biomass in the reactor (MxL−3); Q is the flow rate of the feed substrate (L3T−1); V is the effective reactor volume (L3); Af is the total surface area of media (L2); and ɛ is the porosity of the reactor (dimensionless).
Model solution techniques
One partial differential equation with three ordinary differential equations can be simplified and converted to dimensionless forms by defining the dimensionless variables. The Legendre polynomials (an even function) in planar geometry were used to approximate the exact phenol concentration profile in the biofilm. The root of Legendre polynomials was used as the collocation points. The number of internal collocation points in biofilm was fixed at 9. The partial differential equation in dimensionless form can be converted to six ordinary differential equations by orthogonal collocation method. The entire model system, including nine ordinary differential equations, was solved by using the Gear's method to determine the 2,4-DCP concentration profile in biofilm, the growth of biofilm, the effluent concentration of 2,4-DCP in bulk liquid, and the effluent concentration of suspended biomass in bulk liquid.
Materials and Methods
Preparation of ceramic particles
The ceramic particles were composed of two waste materials (dewatered sludge and fly ash) with a mass ratio of 1:1; dewatered sludge was obtained from leachate wastewater treatment plant and fly ash was taken from the coal-fired power generation plant, Taichung of Taiwan. The waste raw materials were mixed in a muller and transported into a rotational disk; meanwhile tap water was injected to make powdered materials keep slightly wet (Han et al., 2009a). And then, the powdered materials were transported to a granulator to make particles with a similar diameter. The particles were desiccated using a furnace with a temperature of 1100°C. Finally, the ceramic particles as a cylindrical shape with an average grain diameter of 0.4–0.6 cm and a height 0.95 cm were obtained and cooled off after screen separation.
Acclimation of microorganisms
Preadaptation can improve activated sludge activity by reducing the time required for degradation of CPs (Haller, 1978) and can also provide protection from chlorophenolic shock loads (Hickman and Novak, 1984). Activated sludge was obtained from a municipal wastewater treatment plant located in central Taiwan and then it was conditioned in a batch reactor of 5 L at 25°C. During this acclimation period, the batch reactor was fed with 50 mg/L of 2,4-DCP and 500 mL culture sample in 400 mL of mineral media. The 2,4-DCP was used as the sole source of carbon and energy. Mixing of the batch reactor was performed by a magnetic stirrer. The concentration of 2.4-DCP was periodically monitored and amended to two or three more times to a final concentration of 50 mg/L when it had been completely removed from the batch reactor (Zilouei et al., 2006). The cultures supporting the fastest 2,4-DCP removal rate were then further enriched by inoculating each 5 mL culture sample in 45 mL of fresh mineral media. This procedure was repeated three to four times for 70 days (Buitrón et al., 1998). Then each culture sample was mixed and used for further experiments. The mineral media contained the following ingredients (per liter) (Chang et al., 2003): KH2PO4, 1.0 g; K2HPO4, 1.0 g; NaHCO3, 1.0 g; MgCl2 0.02 g; NH4Cl, 0.03 g; and trace elements, 1 mL. The trace elements solution comprised of the following ingredients (per liter): CaCl2·H2O, 7.3 g; MnCl2·4H2O, 2.5 g; CoCl2·6H2O, 0.5 g; (NH4)6Mo7O24·4H2O, 0.5 g; FeCl2·4H2O, 2.0 g; ZnCl2, 1.0 g; and CuCl2, 0.1 g. The medium's pH was 7.43 and adjusted to 7.1±0.1 using 2 N H2SO4 (Guieysse et al., 2001). The phosphate buffer was used to prevent a drop in pH caused by the release of HCl during the 2,4-DCP mineralization. The 2,4-DCP and all inorganic chemicals were purchased from Merck Co. as analytical reagent grade.
Batch experiments for 2,4-DCP biodegradation
The ability of acclimated activated sludge to degrade 2,4-DCP was evaluated in 125-mL serum vials which contained the mineral medium and the 2,4-DCP target compound at initial different concentrations ranging from 50 to 300 mg/L. For each serum vial, 12.5 mL of acclimated sludge and 100 mL of mineral medium were added into the bottle. The initial suspended biomass concentration in each vial was adjusted to ∼110 mg volatile suspended solids (VSS)/L. Vials were then shaken at 25°C on an orbital shaker at 200 rpm for 15 h and assayed periodically for 2,4-DCP concentration (Wang et al., 2007). Furthermore, the final concentration of suspended biomass in each vial was measured at 15 h. All experiments were performed in triplicate.
A working volume of reactor with 5 L was used to evaluate the batch kinetic test to determine the yield coefficient (Y) and decay coefficient (b) of acclimated sludge. Approximately 500 mL of acclimated sludge with 450 mL of mineral medium containing an initial 2,4-DCP concentration of 150 mg/L was added into the reactor. The initial biomass concentration was adjusted to about 110 mg/VSS. A complete mixing reactor was maintained by using the stirrer. The concentrations of 2,4-DCP and suspended biomass were measured periodically. The time course of this batch kinetic experiment was 92 h. The value of yield coefficient (Y) is determined at the exponential phase of the growth curve and decay coefficient (b) is determined at endogenous phase of the decay curve.
Biokinetic parameters determination
Batch suspended-growth tests were conducted to determine the five biokinetic coefficients—Rm, Ks, Ki, Y, and b. A kinetic analysis of the degradation data was performed on the basis of the Haldane's equation for describing biodegradation of an inhibitory substrate as the following equation (Juang and Tsai, 2006):
where μ and μm are the specific and the maximum specific growth rates (d−1), respectively, and S, Ks, and Ki are the 2,4-DCP concentration, half-saturation constant, and inhibition constant (mg/L), respectively.
The Haldane's kinetics for substrate degradation and biological growth in the batch tests can be represented by
and the relation between biomass formation and substrate degradation can be written as
where Y is the yield coefficient (mg VSS/mg 2,4-DCP−1), and X is biomass concentration (mg VSS/L). For small changes in the biomass and substrate concentrations in the growth phase, Equation (13) can be integrated to yield the relation
where X0 is initial biomass concentration (mg VSS/L) and S0 is initial substrate concentration (mg 2,4-DCP/L). The yield coefficient is assumed approximately constant over the range of substrate concentrations encountered in the growth phase, and the slope of a linearized plot of (X–X0) versus (S0–S) is the yield coefficient (Y).
Once the maximum specific growth rate (μm) and yield coefficient (Y) were determined, the maximum degradation rate (Rm) of 2,4-DCP can be computed with the following equation
The kinetic data in the endogenous phase can be used for estimating the decay coefficient of the microorganisms. The substrate degradation and microbial growth and decay equations corresponding to the constant phase and endogenous phase are written as follows (Templeton and Grady, 1988)
where rx is the rate of biomass growth (mg VSS/[L·day]) and b is the decay coefficient (per day). In the endogenous phase, where μ is greatly smaller than b, the biomass growth rate equation can be approximated to
which, on integration and simplifications, yields the relation
where X1 and X2 are biomass concentrations at time t1 and t2. The decay coefficient of microorganisms, b, can thus be determined from the slope of a linearized plot of lnX versus time in the endogenous phase.
Biofilm reactor
The reactor made of a cylindrical glass vessel with a diameter of 7 cm and height of 46 cm was used in these experiments (Fig. 1). The reactor was filled with 680 cm3 of ceramic particles, with diameters of 4–6 mm and 9.5 mm in height (porosity of ∼58%), and 940 mL of mineral salt medium. The liquid level in the reactor was kept 4 cm above the carrier materials for excess effluent. The liquid was recirculated from the top of the liquid level to the bottom side of the reactor using a peristaltic pump (Zilouei et al., 2006). The recirculation rate was 0.068–0.071 L/min and superficial upflow velocity was 23.58 m/h. The feed solution was pumped into the reactor using a second peristaltic pump. The effective working volume of the reactor was 1.616 L, which yields a HRT of 9.7 h. The reactor was aerated by air pump from the bottom of the reactor with a distributed plate to uniform the air flow. The aeration rate was enough to maintain at least a dissolved oxygen (DO) concentration of 3 mg O2/L in all experiments carried out in continuous-flow column tests (Salmerón-Alcocer et al., 2007). The reactor temperature was controlled at 25±1°C by passing water through a water jacket using a circulating water bath (Yih Der, Inc.) (Oh et al., 2011). Before being inoculated, the bioreactor was fed with mineral salt medium at a HRT of 9.7 h without aeration. The bioreactor was then inoculated by charging a 160 mL mixed culture with mineral medium. A pump was then used to circulate the flow for biomass attachment. The initial concentration of suspended biomass in biofilm reactor was ∼5 mg VSS/L after biomass attachment. Aeration was then started at 120 mL/min at an initial 2,4-DCP concentration of 150 mg/L to evaluate the performance of continuous-flow column test. Samples for 2.4-DCP and VSS analysis were periodically taken from the feed and the effluent. The experimental period of a column study was about 80 days. Furthermore, at a state-steady condition, the removal efficiency of 2,4-DCP at different loading rates of 5.1–51.5 mg/(L·h) was evaluated in the column tests.
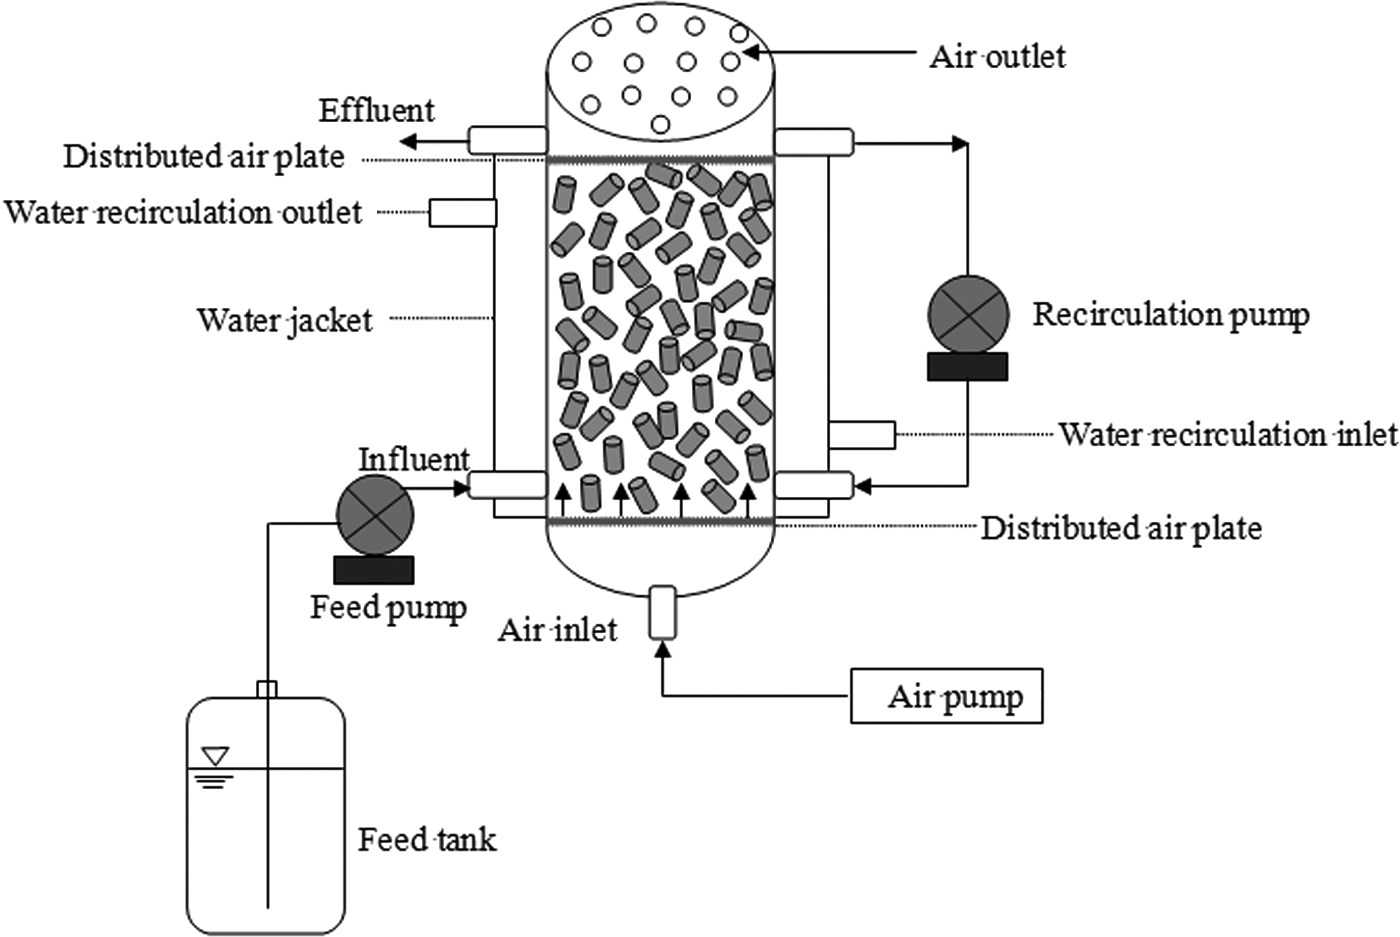
Schematic diagram of packed-bed bioreactor. Reactor working volume=1.616 L.
Analytical methods
The concentration of 2,4-DCP was determined by high-performance liquid chromatography (HPLC)-UV using an Alliance 2695 liquid chromatograph (Waters). The HPLC apparatus consisted of a Waters 2707 autosampler and a Waters 2487 UV/Vis detector, and was equipped with a SUPELCOSIL LC-8 (Supelco). The column size is 4.6 mm in diameter with a height of 15 cm. The samples were eluted at 1.5 mL/min with a mobile phase composed of methanol/water/acetic acid (60/39/1, v/v) for 20 min at a temperature of 30°C. The UV/Vis spectrophotometric detector was set at 280 nm. The 2,4-DCP concentration was found to follow the following regression equation: 2,4-DCP (mg/L)=0.081728+1.5105×10−5 (area), r2=0.9982. The VSS were determined by employing procedures in Standard Methods (American Public Health Association, 2005). The toxicity characteristics leaching procedure (TCLP) was used to evaluate the heavy metals contents in solid samples (Samaras et al., 2008). The heavy metal contents in lixivium of solids were detected by inductively couple plasma/mass spectrometry (Agilent 4500).
Results and Discussion
Heavy metals in lixivium of dewatered sludge, fly ash, and DFCCP
During the DFCCP production, heavy metals mostly derived from dewatered sludge and fly ash were solidified into glassy phase in the form of metallic oxides (Han et al., 2009a). To determine the lixiviation of heavy metals in water, the tests of heavy metal contents in lixivium of dewatered sludge, fly ash, and DCCCP were performed using TCLP method. Table 1 presents the contents of heavy metal elements in lixivium. Most of heavy metal contents in lixivium were not detected. All heavy metal contents meet the TCLP leaching standard stipulated by the government of Taiwan.
TCLP, toxicity characteristics leaching procedure; ND, not detected.
2,4-DCP biodegradation in batch tests
In the experimental serum vials with different initial 2,4-DCP contents, the 2,4-DCP concentration decreased with time, whereas in the control flask 2,4-DCP content did not change significantly during the course of experiments (Fig. 2). The decreases in 2,4-DCP contents were steeper with high initial 2,4-DCP contents than with low initial contents. The extent of adsorption and nonbiological degradation of 2,4-DCP was negligible (Wang et al., 2007). Changes in final 2,4-DCP concentrations and percentage of 2,4-DCP removal at different initial 2,4-DCP concentrations after 15 h batch experiments is presented in Fig. 3. The final 2,4-DCP contents were 14.3, 39.5, 80.6, 140.3, 198.2, and 248.4 mg 2,4-DCP/L for initial 2,4-DCP contents of 50, 100, 150, 200, 250, and 300 mg 2,4-DCP/L, respectively. The experimental results revealed that the percentage removal decreased and final 2,4 DCP concentration was proportionally higher with increasing initial 2,4-DCP content. Percentage of 2,4-DCP removal was 71% at an initial 2,4-DCP concentration of 50 mg/L, dropping to 30% at an initial 200 mg 2,4-DCP/L, and to only 17% at 300 mg 2,4-DCP/L. The 2,4-DCP removal rate in the serum vials increased with initial 2,4-DCP up to 150 mg 2,4-DCP/L (Fig. 4), but at an initial concentration of 300 mg/L was only approximately three-fifths of the maximum rate, indicating 2,4-DCP concentration exceeding 150 mg/L was inhibitory. The average removal rate of 2,4-DCP was 3.65±0.8 mg/(L·h).
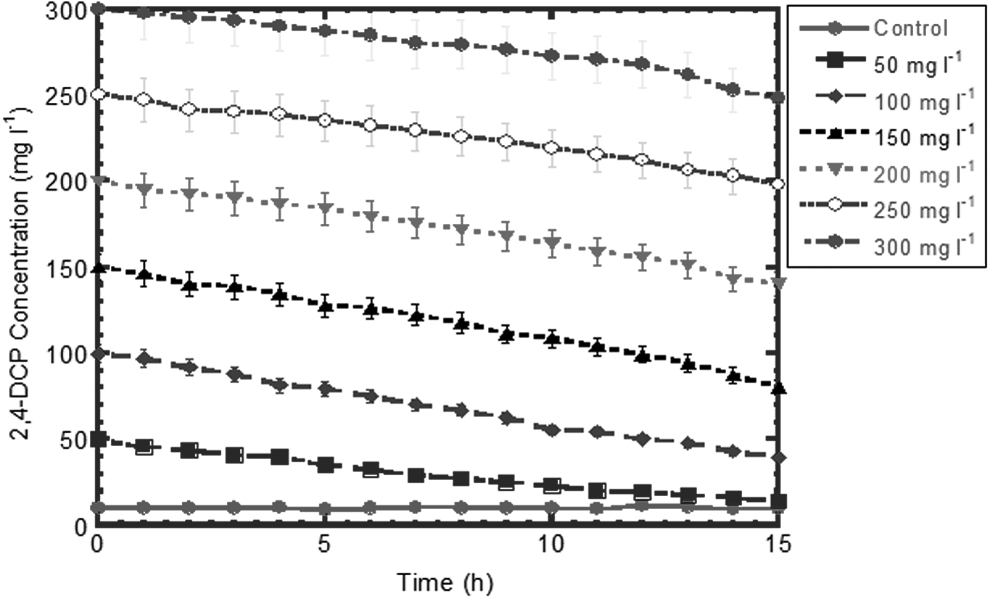
Time courses of 2,4-dichlorophenol (2,4-DCP) concentration for different 2,4-DCP contents.
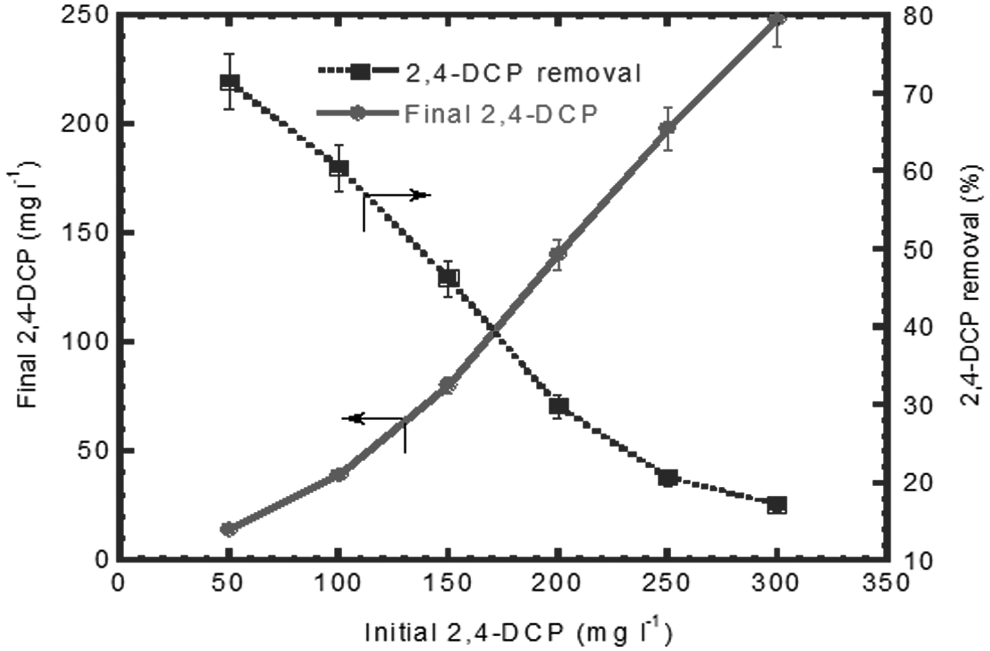
Differences in effluent 2,4-DCP content and percentage of 2,4-DCP removal after batch operation for 15 h.
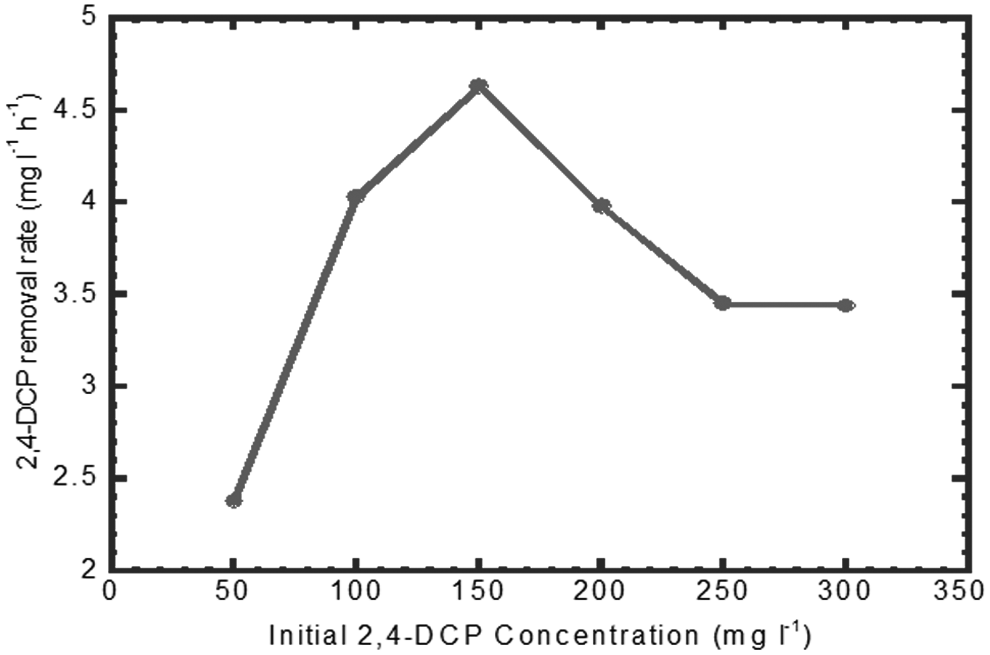
Relationship between the rate of 2,4-DCP degradation and initial 2,4-DCP concentration.
Biokinetic parameters determination
Figure 5 illustrated the variation of specific growth rate (μ) with initial concentration of 2,4-DCP. The specific growth rate increased with the increasing initial 2,4-DCP content up to 150 mg/L, peaked at 0.39/day, but then decreased for the initial contents between 150 and 300 mg/L, indicating the inhibitory effect of 2,4-DCP at a concentration exceeding 150 mg/L. Therefore, the Haldane equation was used to model the specific growth rate of mixed culture (Juang and Tsai, 2006). Wang et al. (2007) have applied Haldane model to describe the inhibition kinetics of 2,4-DCP degradation by acclimated sludge. They found the inhibitory effect of 2,4-DCP at a concentration exceeding 105 mg/L. The Haldane equation for substrate-inhibited growth was fitted to the data of specific growth rate (μ) as a function of 2,4-DCP concentration (S) using a nonlinear least square error technique (Kumar et al., 2000). The biokinetic parameters estimated with the nonlinear least square regression method were μm=4.96/day; Ks=574 mg/L, and Ki=17.2 mg/L, with a correlation coefficient (r2) of 0996. Therefore, the resulting kinetic equation is as below:
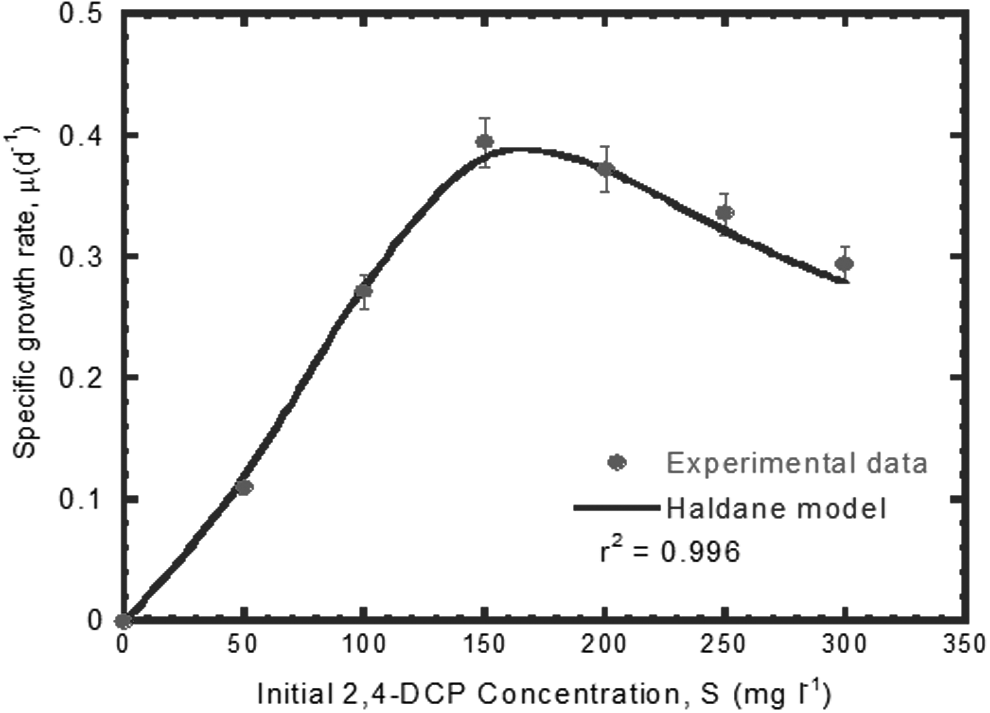
Specific growth rate of aerobic sludge at different 2,4-DCP concentrations.
These values agreed reasonably well with the values obtained by Wang et al. (2007) (Ks=587 mg/L, Ki=19.1 mg/L) for 2,4-DCP biodegradation by aerobic granulation in a SBR at 25±2°C.
The biokinetic studies provided data on the variation of 2,4-DCP and biomass concentration versus time, as depicted in Fig. 6. It can be observed that the biomass concentration data represent the typical growth and decay curve with a well-defined growth phase, followed by a constant growth phase and endogenous phase. The biomass and 2,4-DCP concentration data facilitated a priori estimation of biokinetic parameters for evaluation of the growth rate of biomass and the extent of degradation of 2,4-DCP.
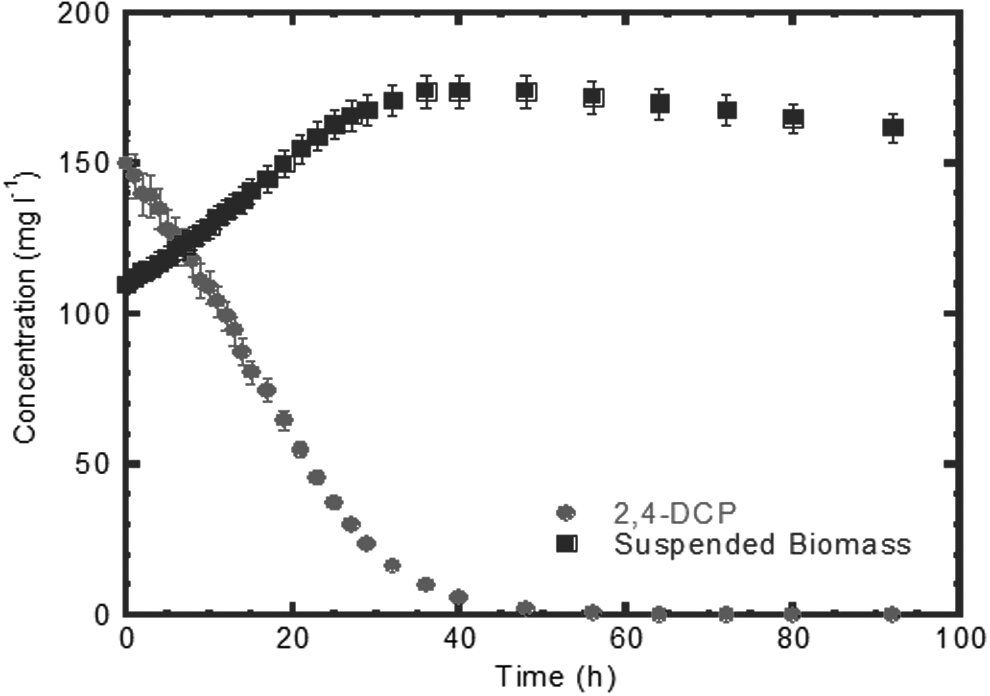
Batch kinetic data on the variation of 2,4-DCP and suspended biomass.
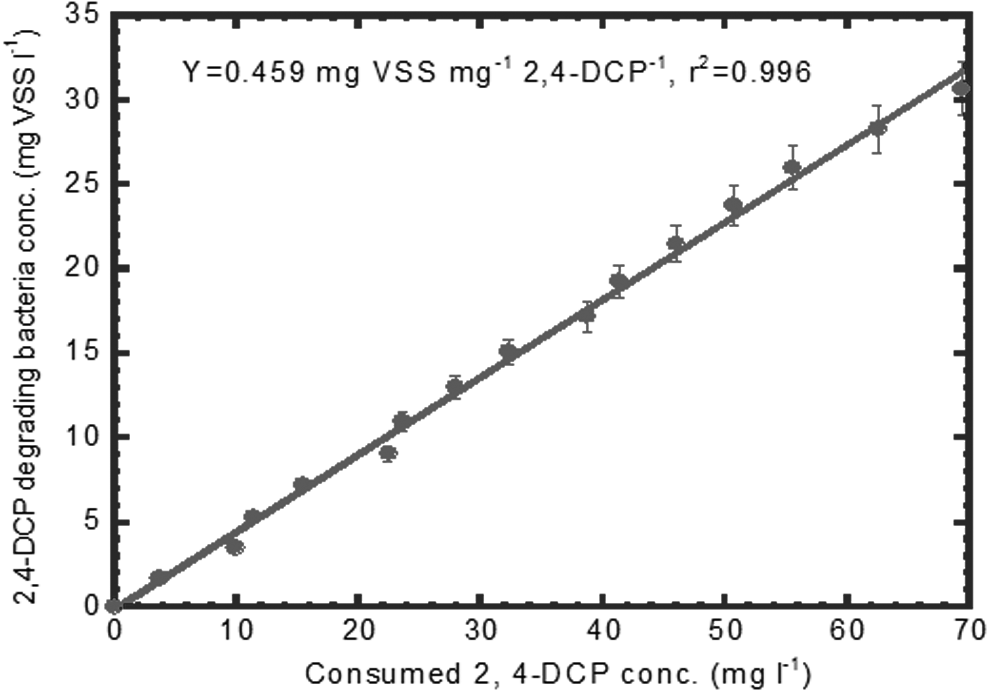
The yield coefficient for biomass determined from the slope of a linearized plot of (X–X0) versus (S0–S) is shown in Fig. 7. The yield coefficient for mixed culture was 0.459 mg VSS/mg 2,4-DCP−1 with a correlation coefficient (r2) of 0.996. Buitrón et al. (1998) conducted the batch kinetic tests for biodegradation of phenolic compounds to determine the yield coefficient of acclimated sludge. They found that the yield coefficient of acclimated sludge was 0.94 mg VSS/mg TOC−1 (0.415 mg VSS/mg 2,4-DCP−1), which was close to the value obtained in this study.
Batch kinetic test to determine the yield coefficient of suspended biomass.
The maximum specific degradation rate (Rm) of 2,4-DCP can be computed by μm/Y. The Rm value for mixed culture was 10.8 mg 2,4-DCP/mg VSS−1/day, which agreed reasonably well with the value determined by Wang et al. (2007) (Rm=11.47 mg 2,4-DCP/mg VSS−1/day).
The decay coefficient of mixed culture can be determined from the slope of a linearized plot of lnX versus time shown in Fig. 8. The value of decay coefficient for biomass was 0.0367/day with a correlation coefficient (r2) of 0.981. Chang and Rittmann (1987) conducted a batch kinetic experiment for phenol biodegradation to determine the decay coefficient of acclimated sludge, which was 0.068/day. The lower decay coefficient obtained from this study could be attributed to the longer acclimation period.

Batch kinetic test to determine the decay coefficient of suspended biomass.
Biofilm density determination
Biofilm (attached cells) grown on composite ceramic particles was used to determine biofilm density. At the end of the experiment, 150 composite ceramic particles with biofilm were transferred, one by one with a tweezer to preclude inclusion of interstitial water, to a tared aluminum pan. The composite ceramic particles containing biofilm were weighed before and after drying in the 103°C oven for 1 h to determine biofilm mass as total solids. Then the ceramic particles containing biofilm was heated in a muffle furnace at 550°C for 15 min to burn off volatile solids (American Public Health Association, 2005). Thus, the biofilm mass (as VSS) can be determined. Clean composite ceramic particles were immersed in clean water and picked out to measure the amount of attached water on composite ceramic particles by the same methods. The biofilm volume was obtained by the difference of the two measurements. The biofilm density thus computed by dividing the biofilm mass by biofilm volume was 10.86 mg VSS/mL.
Mass transfer coefficients
Molecular diffusion coefficients in water (Dw) and in biofilm (Df) and the film transfer coefficients (kf) were determined from the literature. The diffusion coefficient of ammonium in bulk liquid (Dw) was determined from the empirical formula of Wilke and Chang (1955). The formula can be described by the following equation:
where φb is association parameter; Mb is molecular weight of water; T is absolute temperature in K; μb is absolute viscosity of the solution in centipoises for water; and Va is molar volume of the solute as liquid at its normal boiling point. Molar volumes of solutes can be estimated from the atomic volume of their atoms (Perry and Chilton, 1973). For 2,4-DCP, Vb was equal to 160.2 cm3/mol. Therefore, Dw was equal to 0.696 cm2/day.
Diffusion coefficients in the biofilm (Df) are generally less than those in the liquid phase due to the diffusional resistance to the transport of the chemical species, which is posed by bacteria and their extracellular materials. Therefore, the diffusion coefficient in the biofilm is obtained by multiplying the diffusion coefficient in the bulk liquid phase (Dw) by a factor of 0.8 to correct the additional diffusional resistance in the biofilm (Williamson and McCarty, 1976b). The diffusion coefficient of 2,4-DCP in the biofilm (Df) was equal to 0.557 cm2/day.
The film transfer coefficient (kf) was determined using a formula suitable for packed-bed reactor (Williamson et al., 1963)
where vs is the superficial flow velocity through reactor (LT−1); Re is the
The biofilm shear-loss coefficient (bs) can be calculated from the following empirical formula (Speitel and DiGiano, 1987):
where μw is the viscosity of water (L2T−1); and a is the specific surface area of bed (L−1). The computed value of bs was 5.32×10⁻²/day.
2,4-DCP biodegradation in biofilm reactor
The kinetic model was verified by investigating 2,4-DCP biodegradation using the biofilm reactor fed with 2,4-DCP of 150 mg/L. The concentration of 2,4-DCP in control reactor (without biofilm) did not change significantly (<3%) during the course of experiments. The biokinetic parameters obtained from batch kinetic tests and reactor parameters are listed in Table 2 as input data for model prediction. Figure 9a presents the 2,4-DCP concentration in effluent varied over time. The curve of 2,4-DCP concentration was described in three parts. First, the 2,4-DCP concentration increased steadily to about 145 mg/L (0.968 Sb0) during the first 13 days. At this period, biodegradation of 2,4-DCP by biofilm was insignificant. The 2,4-DCP concentration curve was a typical dilute-in curve, which was a characteristic of completely mixed continuous-flow bioreactor filled with only growth media at time zero (Gaudy and Gaudy, 1980). The second part of the 2,4-DCP curve ran from day 13 to 33, when the 2,4-DCP concentration curve started to deviate from the top of the dilute-in curve. The effluent concentration of 2,4-DCP leveled off and then decreased. Apparently, the biofilm was vigorously utilizing 2,4-DCP during this period due to its active growth. The third part of 2,4-DCP concentration curve ran from day 33 to 80. During this period, the system had reached a steady state condition and the 2,4-DCP concentration in effluent was about 16 mg/L (0.107 Sb0). The removal efficiency for 2,4-DCP was ∼89%. The model predicted the experimental results well with a correlation coefficient (r2) of 0.993.

Experimental data and model prediction in effluent
2,4-DCP, 2,4-dichlorophenol; VSS, volatile suspended solids.
Biofilm growth
Figure 9b presents the biofilm growth curve by model prediction. About 15 days are required for the biofilm to start growing. The predicted biofilm growth increased vigorously to utilize 2,4-DCP at a transient-state period of 15–60 days. The biofilm growth peaked at a maximum value of 622 μm at a steady-state condition.
Growth of suspended biomass
Figure 9c plots the growth curves of suspended biomasses. One indicator of the generating biomass growth was the suspended biomass concentration in the effluent. Good agreement existed between model prediction data and experimental data for suspended biomass growth in the fixed-biofilm reactor. The growth of suspended biomass was insignificant during the first 15–20 days. The suspended biomass degraded a considerable amount of 2,4-DCP for growth at a transient period of 20–60 days. The growth curve of suspended biomass reached a steady-state condition at 60–80 days. The concentration of suspended biomass reached a maximum growth of ∼35 mg/L at a steady-state condition. The model predictions are in good agreement with the experimental results with a correlation coefficient (r2) of 0.979.
Flux into biofilm
Figure 9d presented the model-predicted flux of 2,4-DCP into the biofilm varied over time. At the start of the test, no significant 2,4-DCP flux into the biofilm was observed during the first 10 days as the biofilm growth was negligible. The 2,4-DCP flux increased abruptly at 10–30 days. During this period, the predicted biofilm thickness gradually increased and vigorously consumed 2,4-DCP. Thus, the difference in 2,4-DCP concentration in the bulk liquid phase and the biofilm/liquid interface increased, which significantly increased DCP flux into the biofilm due to biological activity. During 30–80 days, the 2,4-DCP flux remained maximal because the 2,4-DCP concentration in the effluent continued decreasing and then reached a constant concentration under a steady-state condition.
Concentration profiles of 2,4-DCP
Rittmann and McCarty (1981) defined three characteristic concentration profiles, including fully penetrated case, deep case, and shallow case. The fully penetrated biofilm case has a negligible decrease from the surface concentration (Ss) whereas the deep biofilm case has the maximum decrease because the substrate concentration reaches zero at or before the attaching surface. The shallow biofilm case is intermediate, having a concentration at the attaching surface (Sw) between 0 and Ss. The predicted 2,4-DCP concentration profiles in liquid film and biofilm on day 7, 37, and 78 are shown in Fig. 10. The 2,4-DCP diffused through the liquid film into the biofilm to form a concentration profile due to diffusional resistance. The biofilm thicknesses are 1.043 μm at 7 days, 448.9 μm at 37 days, and 621.5 μm at 78 days, respectively. The 2,4-DCP concentration profile at 7 days was a straight line in the liquid film and biofilm phase, which could be called the fully penetrated biofilm. The biofilm at 37 days showed a shallow curve in the biofilm phase and slant straight line in the liquid film phase, which could be called a shallow biofilm. Moreover, on day 78, there exists a deep curve in the biofilm phase and a slant straight line in the bulk liquid, which could be called a deep biofilm (Suidan et al., 1987).
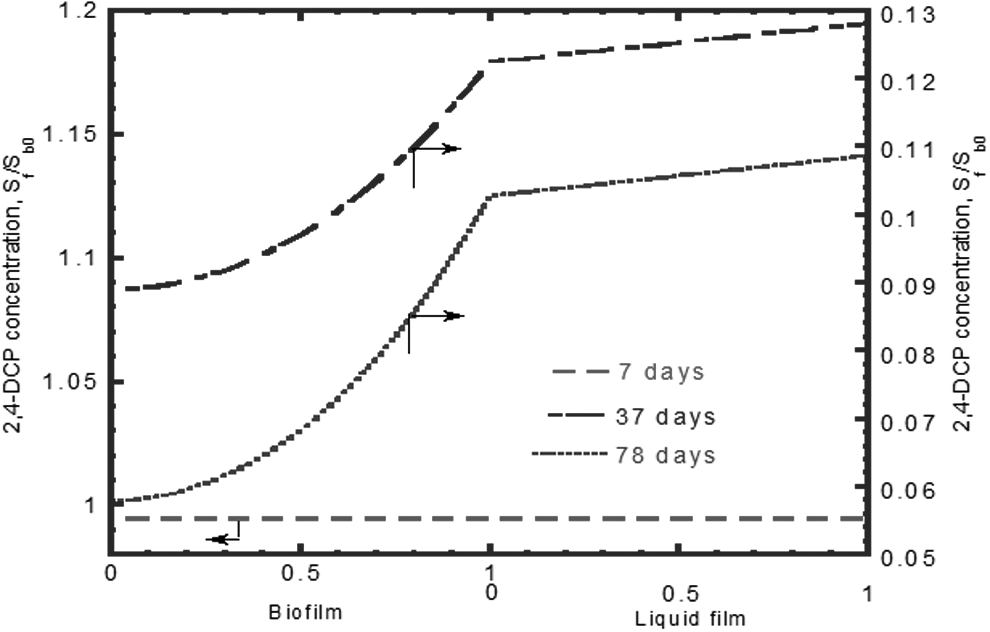
Model predicted the 2,4-DCP concentration profiles in liquid film and biofilm at different times.
Effect of loading rate on removal efficiency
Figure 11 displays the effect of 2,4-DCP loading rate on removal efficiency. The removal efficiency increased rapidly as 2,4-DCP loading rate increased from 5 to 15 mg/(L·h). The increase of the 2,4-DCP loading rate from 15 to 41 mg/(L·h) led to a constant removal efficiency ∼90%. A more rapid decrease of removal efficiency for 2,4-DCP was observed when the loading rate exceeded 40 mg/(L·h). At a loading rate of 51 mg/(L·h), the 2,4-DCP removal efficiency fell to 66% at a steady-state condition. Similar fixed-biofilm experiments were conducted by Zilouei et al. (2006), who found that the removal efficiency of CPs increased from 78.6% at a pollutant loading rate (PLR) of 7 mg/(L·h) to 99.7% at PLR of 11 mg/(L·h). However, increasing the PLR to 26 and 40 mg/(L·h) was followed by a decrease in the total removal efficiencies of 2-CP and 4-CP in effluents. The experimental results obtained in this study were different with their works (Zilouei et al., 2006) due to different operating conditions for fixed-biofilm reactors.

Effect loading rate on removal efficiency of 2,4-DCP.
Conclusions
In batch kinetic tests, the removal efficiency of 2,4-DCP decreased whereas the residual 2,4-DCP concentrations proportionally increased with increasing initial 2,4-DCP concentrations. Percentage of 2,4-DCP removal declined from 71% at the lowest initial 2,4-DCP concentration (50 mg/L) to 17% at the highest initial 2,4-DCP concentration (300 mg/L). Specific growth rate of mixed culture for 2,4-DCP biodegradation following the Haldane model was used to determine the biokinetic parameters. A kinetic model was developed to describe the performance of 2,4-DCP biodegradation in a fixed-biofilm reactor. The model was verified by conducting a biofilm reactor packing with ceramic particles as the supporting media. Experimental results demonstrated that the fixed-biofilm process reached a removal efficiency of 89% for 2,4-DCP biodegradation under a steady-state condition. In the steady state, model-predicted biofilm thickness reached up to 622 μm and suspended biomass in the effluent was ∼35 mg VSS/L. The model predicted the experimental results of 2,4-DCP and suspended biomass in effluent well with a correlation coefficient (r2) of 0.993 and 0.979, respectively.
Footnotes
Acknowledgments
The author thanks the National Science Council of Taiwan for supporting this research under Contract No. NSC 102-2221-E-166-001-MY2. Ted Knoy is appreciated for his editorial assistance.
Author Disclosure Statement
No competing financial interests exist.