
Abstract
Abstract
Denitrifying stormwater biofiltration systems that include submerged zones containing organic carbon sources can alleviate eutrophication by reducing nitrogen loadings from stormwater runoff. The objective of this research was to evaluate performance of denitrifying biofilters containing wood chip medium under varying dynamic loading rates and antecedent dry conditions (ADCs). Results showed that during ADCs, dissolved organic carbon (DOC) concentrations increased in pore water due to dissolution of the wood chip medium. During a storm event, nitrate (NO3−) removal was enhanced due to high pore water DOC concentrations and mixing of NO3− from the influent with pore water; however, as DOC was gradually flushed out of the biofilter, higher effluent NO3− concentrations were observed over time. At lower hydraulic loading rates, effluent NO3− concentrations were low due to sufficient hydraulic residence time for denitrification. For all storm events tested, an overall NO3− mass removal efficiency of 85% was achieved. Sulfate reduction was observed at long ADCs (up to 30 days). Phosphate release was observed when NO3− was absent from the effluent, possibly due to dissolution of iron oxyhydroxides under low redox conditions. Findings from this study are being used to develop a mathematical model of nitrogen removal in denitrifying stormwater biofilters.
Introduction
U
Denitrification is a process that requires the presence of an electron donor, such as organic carbon or elemental sulfur. An overall stoichiometric equation for denitrification using a simple carbohydrate (CH2O) as an electron donor is shown below:
Denitrification is a stepwise process where NO3− is converted to nitrite (NO2−), nitric oxide, nitrous oxide, and finally to nitrogen gas. Anoxic conditions are required before denitrification can proceed (Madigan et al., 2009). After oxygen and NO3− have been depleted, sulfate (SO42−) reduction, fermentation, and methanogenesis may occur (Madigan et al., 2009). Therefore, bioavailable organic carbon in stormwater biofilters can be utilized through a number of terminal electron accepting processes.
Factors that have been reported to affect NO3− removal in denitrifying biofilters include: influent NO3− concentration, oxidation–reduction potential, temperature, detention time, and electron donor bioavailability (Kim et al., 2003; Smith, 2008; Schmidt and Clark, 2013; Peterson et al., 2015). Other factors that may be important include biofilm acclimation, biofilter depth, electron donor hydrolysis rate, transport of influent dissolved organic carbon (DOC), and antecedent dry conditions (ADCs) (Kim et al., 2003; Chun et al., 2009; Chu and Wang, 2013). ADCs are the number of days between storm events. For bioretention systems, decaying vegetation and/or plant exudates may also increase DOC concentrations and affect NO3− removal in submerged biofilters (Zhang et al., 2011).
Due to ADCs, stormwater biofiltration systems receive influent on an intermittent basis. Prior studies investigating the effect of ADCs on the removal of NO3− in denitrifying biofilters are limited. Zinger et al. (2007) compared the NO3− removal performance of biofilters with and without a submerged zone at ADCs between 1 and 8 weeks. After an ADC of 2 weeks, NO3− removal in biofilters with a submerged zone was greater than in biofilters without a submerged zone. Kim et al. (2003) studied submerged biofilters with ADCs of 7 and 37 days and observed low initial effluent NO3− concentrations, which increased over time as the influent mixed with the pore water. Cho et al. (2011) observed that NO3− leaching occurs as a result of increased ADCs; however, their study evaluated unsaturated biofilters.
Several studies have investigated processes that occur in denitrifying biofilters during rainfall events (Dietz and Clausen, 2006; Smith, 2008; and Ergas et al., 2010; Lucas and Greenway, 2011; Lee et al., 2013). However, processes that occur in denitrifying biofilters during ADCs can also affect water quality performance. Barrett et al. (2013) observed phosphate (PO43−) removal in biofiltration mesocosms that included a submerged zone and hypothesized that PO43− precipitation may occur during ADCs. Lynn et al. (2015) observed total Kjeldahl nitrogen (TKN) and DOC export in denitrifying biofilter microcosms, suggesting that the organic carbon from wood chip media will continually be released and then consumed by a variety of microbial terminal electron-accepting processes (aerobic, denitrifying, SO42− reducing). Understanding the different transformations that occur in denitrifying biofilters during storm events and ADCs could be useful for improving stormwater biofiltration system designs (Grebel et al., 2013; LeFevre et al., 2014).
The overall goal of this research was to investigate the processes that occur in denitrifying biofilters under dynamic loading conditions. The specific objectives were to evaluate: (1) the overall water quality performance of denitrifying biofilters; (2) their performance under dormant conditions; and (3) their performance during storm events of varying intensity and ADCs. Although denitrifying biofilters may be incorporated into systems that may contain other elements (e.g., unsaturated sand layer, mulch, vegetation), this study focused solely on processes that occur in denitrifying biofilters with wood chip media. Data from three laboratory-scale columns that were operated in parallel are presented in this article. Although the columns had different depths, they were hydraulically loaded to achieve the same hydraulic residence time. Information on the effect of biofilter depth on performance can be found in Lynn (2014).
Materials and Methods
Reactor description
A schematic of the laboratory setup for the column study is shown in Figure 1. Experiments were carried out in three completely submerged 12.7 cm ID acrylic columns to mimic denitrifying biofilters with depths of 30, 45, and 60 cm. All studies were performed in the laboratory at ∼22°C. The media type used in this study contained a 2:1 (vol/vol) mixture of 0.6–1.3 cm pea gravel (Seffner Rock & Gravel, Tampa, FL) and 1.3–2.5 cm eucalyptus wood chips (Sarasota County, Sarasota, FL). This medium was found to have the best performance among several mixtures tested in a preliminary study in our laboratory (Lynn et al., 2015). The gravel–wood medium (bulk porosity=0.42) was supported by a 7.6 cm under-drain layer of pea gravel to prevent clogging. Due to wall effects, the measured porosity in laboratory columns is lower than the actual porosity observed in field systems using the same medium (Cohen and Metzner, 1981). Stormwater (described below) was pumped from a 0.21-m3 polyethylene reservoir using a separate Cole Parmer Masterflex L/S peristaltic pump (Thermo Fisher Scientific, Waltham, MA) for each column.
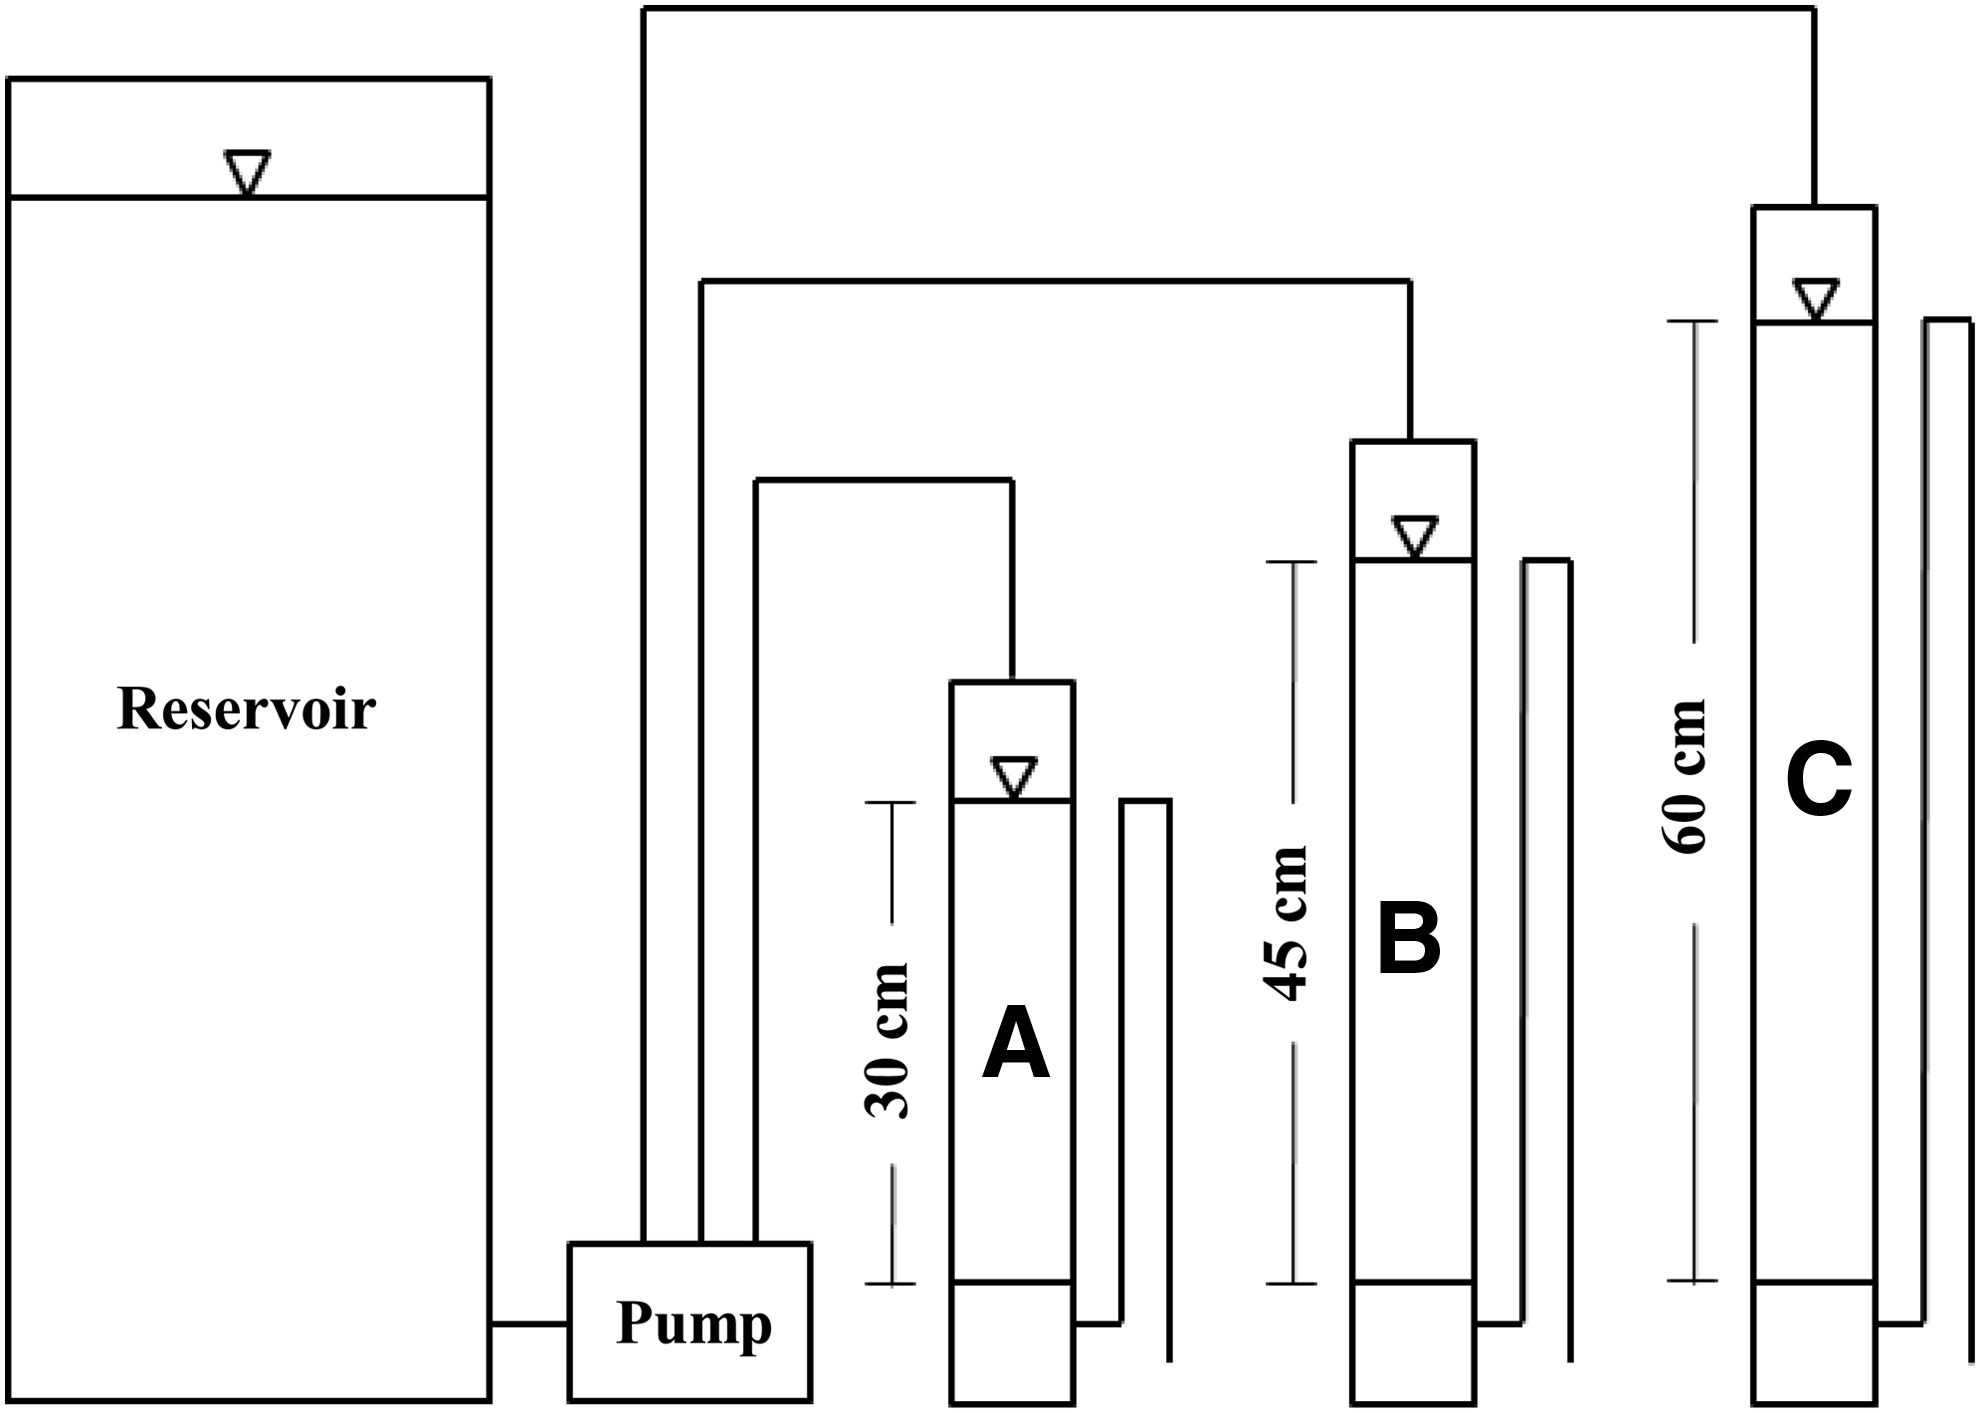
General laboratory setup for storm event studies. The 30 cm
Reactor operation
Eleven storm events were investigated in this study, as shown in Table 1. Storm Events (SE) Nos. 1, 2, 3, 4, 5, and 9 were defined as normal storm events. These storm events were operated under the same hydraulic loading conditions and only differed in ADCs. For this study, the term ADC is defined as the number of days between the prior and current storm event. The term dormant time is defined as the period of time the columns were not in operation before the storm event. For example, a storm event had an ADC of 8 days (general term), but the dormant time of the columns before the same storm event was 7.6 days (specific term). The normal storm events were also designed to operate for a period of 37.5 h to satisfy the typical requirement of filtering the treatment volume within 24–72 h (UDFCD, 2010; SWFWMD, 2013; NJDEP, 2014). SE Nos. 6 and 7 were operated with a higher influent NO3− concentration (4 mg/L NO3−-N) and higher hydraulic loading rate, respectively, compared to the normal storm events. SE Nos. 8, 10, and 11 were operated at constant detention times of 1, 2, and 3 h, respectively. The storm events were set up to discharge an equal number of pore volumes from every column and during every storm event with the exception of SE No. 11, where 28.75 pore volumes were discharged from each column.
SE Nos. 1, 2, 3, 4, 5, and 9 were defined as normal storm events. A leak occurred in the columns during the ADCs of SE Nos. 10 and 11.
—, not measured.
ADCs, antecedent dry conditions; SE, storm event.
The column experiments were designed to mimic the temporal flows that occur in stormwater biofiltration systems. During a storm event, runoff is conveyed to the stormwater ponding area, where the ponding elevation reaches its maximum height. In this period, the denitrifying biofilter flow rate is high; hence, high hydraulic loading rates were utilized for the initial stage of the experiment. After a storm event, runoff no longer enters the ponding area, while the ponding elevation decreases and conveys runoff through the biofilter. At this stage, water initially retained in the biofilter is discharged and is followed by runoff from the storm event. During this period, the flow rate decreases until the water elevation reaches the top elevation of the denitrifying biofilter. This experimental setup used pumps controlled by timers so there were step decreases in flow rate over each storm event rather than continuous decreases, as shown in Table 2. No pore water samples were collected; however, the water quality characteristics of the initial effluent samples and biofilter pore water were assumed to be similar (Lynn, 2014). The columns were also operated under equivalent detention times by adjusting the hydraulic loading rate of each column. The term detention time is defined as the theoretical time it takes for water to enter and exit the reactor, and duration is defined as the time of each experiment (or storm event). Note that the hydraulic loading rates used in this study can be ensured with an outlet control in the biofilter design (Lucas and Greenway, 2011; LeFevre et al., 2014).
Targeted hydraulic loading rates to achieve equal detention times for each column.
Initial refers to the sampled water that was detained in the columns during the dormant period before the storm event and then flushed out during the storm event.
Sample was collected when the columns were operated with a 1 h detention time; however, the sampled water was detained in the columns during the ADCs before the storm event.
Source water
Source water used for this study was local surface water from a pond at the Botanical Gardens at the University of South Florida, Tampa campus. Stormwater was spiked with KNO3 to achieve a feed NO3−-N concentration above 2 mg/L to mimic nitrified stormwater runoff. This water was chosen to maintain relatively consistent water quality characteristics compared to actual stormwater runoff and to include natural constituents contained in nitrified stormwater compared with dechlorinated tap or synthetic water. Before SE No. 1, the columns were acclimated by the daily addition of one pore volume of source water to each biofilter for 1 month. The biofilters were not inoculated with seed microorganisms based on our prior study (Lynn et al., 2015), which showed that microorganisms present in the source water or wood chips were an effective inoculant. Mean influent characteristics with standard deviations can be found in Table 3. Specific influent characteristics for each storm event can be found in Lynn (2014). The analytical methods for this study, including method detection limits (MDLs), are shown in Table 4.
Flow-weighted influent and effluent concentrations (mg/L) are shown with the standard deviation (mg/L) in parenthesis and the total mass removed [%] in brackets. Flow-weighted effluent values are shown for pH.
Targeted influent NO3−-N concentration for all storm events was 2.0 mg/L, except for SE No. 6 (4 mg/L).
SE Nos. 1, 2, 3, 4, 5, and 9 were defined as normal storm events for this study.
DOC, dissolved organic carbon; TKN, total Kjeldahl nitrogen; TN, total nitrogen; TSS, total suspended solids; VSS, volatile suspended solids.
DOC concentrations were estimated from nonpurgeable organic carbon concentrations.
TKN concentrations were calculated by difference TN−NO2−-N−NO3−-N.
Organic nitrogen (Org-N) concentrations were calculated by difference TKN−NH4+-N.
DO, dissolved oxygen; MDL, method detection limit; SAB, same as above.
Data analysis
Flow-weighted influent and effluent concentrations were calculated for each storm event and were used to calculate mass removal efficiencies (Table 3). Initial sample data were assumed to represent the water quality characteristics of the pore water during the dormant period. Dormant period values from SE Nos. 10 to 11 were not included in dormant period means due to a leak that occurred during the dormant period of these storm events. The following analyses were determined through linear regression to calculate the coefficient of determination (r2): first-order kinetics for SO42−; zero-order kinetics for PO43−-P; and increases in TKN during ADCs.
Results
Flow-weighted influent and effluent concentrations and mass removal efficiencies for all measured water quality parameters for the 45 cm column are shown in Table 3 [See Lynn (2014) for results from the 30 and 60 cm columns]. Average mass removal efficiencies for NO3−, TKN, and total nitrogen (TN) were 85%, 43%, and 66%, respectively. Influent and effluent NH4+-N concentrations were consistently below the detection limit (BDL) of 0.07 mg/L. Removal of PO43−, SO42−, total suspended solids (TSS), volatile suspended solids (VSS) and dissolved oxygen (DO), decrease in pH, and export of DOC were observed. During normal storm events, the lowest NO3−, TN, and SO42− mass removal efficiencies and the lowest mean effluent DOC concentrations were observed during the 0-day ADC storm events (SE Nos. 1 and 5). The lowest PO43− mass removal efficiency was observed during the 30-day ADC storm event (SE No. 9). Similar phenomena were observed in the 30 and 60 cm columns.
Mean water quality data for the water that discharged from the columns just after the dormant period (assumed to be similar to the pore water) are shown in Figure 2. These data represent the initial samples that were taken after ∼0.25 pore volumes were discharged from the columns. Pore water DOC concentrations increased to a maximum of 114±25 mg/L for the 16-day ADC storm event and then decreased to 76±14 mg/L for the 30-day ADC storm event (Fig. 2a). Sulfate concentrations rapidly decreased between the 0 and 8-day ADC storm events and then remained low with increasing ADCs (Fig. 2b). A first-order kinetic model was fit to the SO42− data (0.42 h−1; r2=0.99). PO43− concentrations were observed to increase approximately linearly with increasing dormant period (0.040 mg/L-d; r2=0.83) (Fig. 2c). Although TKN export (mean=0.2 mg/L) was observed to consistently occur during dormant conditions (Fig. 2d), it was not correlated with dormant time (r2=0.13). Similarly, pH was observed to decrease during dormant conditions (data not shown), but was not correlated with dormant time (r2=0.41).

Initial sample (collected after 0.25 pore volumes discharged) mean effluent dissolved organic carbon (DOC)
The mean values for water quality data from the 45 cm column for all the normal storm events (SE Nos. 1 through 5 and 9) are shown in Figures 3 and 4. Similar trends were observed in the 30 and 60 cm columns. Initial pore water NO3− removal efficiencies of at least 98% were observed for all of the normal storm events. After the initial pore water volume was discharged, mean effluent NO3− concentrations increased (second sample taken) and then decreased as the hydraulic loading rate decreased (Fig. 3a). Mean effluent DOC concentrations decreased from the average pore water value of 49.9 mg/L to a minimum of 5.2 mg/L and then increased slightly as the hydraulic loading rate continued to decrease (Fig. 3b). Initial mean effluent PO43−-P concentrations decreased from 0.37 mg/L to BDL and then increased after the hydraulic loading rate decreased to 5.3 cm/h (Fig. 3c). Mean effluent SO42− concentrations rapidly increased up to the mean influent SO42− concentration (Fig. 3d). Higher mean TKN concentrations, lower mean pH values, and lower mean TSS and VSS concentrations were observed in the effluent compared to the influent for all sampling events (Fig. 4a–d).

Mean influent and effluent NO3−-N

Mean effluent TKN
Effluent NO3− and PO43− concentration data from the 45 cm column constant flow storm events (SE Nos. 8, 10 and 11) are shown in Figure 5a and b. During these storm events, effluent NO3− concentrations increased over time throughout the experiment. Effluent PO43− concentrations for SE Nos. 8, 10, and 11 decreased to BDL after three, three and four pore volumes were discharged, respectively, and remained BDL for the remainder of the storm events. Similar trends were observed in the 30 and 60 cm columns. A plot of effluent NO3− versus DOC concentration for all columns and constant flow storm events (excluding SE No. 11) is shown in Figure 6. The effluent NO3− concentrations were significantly lower (paired t-test; p-value <0.001) in the samples that contained an effluent DOC concentration greater than 10 mg/L (NO3−-N=0.10±0.10 mg/L) compared to lower than 10 mg/L (NO3−-N=0.53±0.38 mg/L).
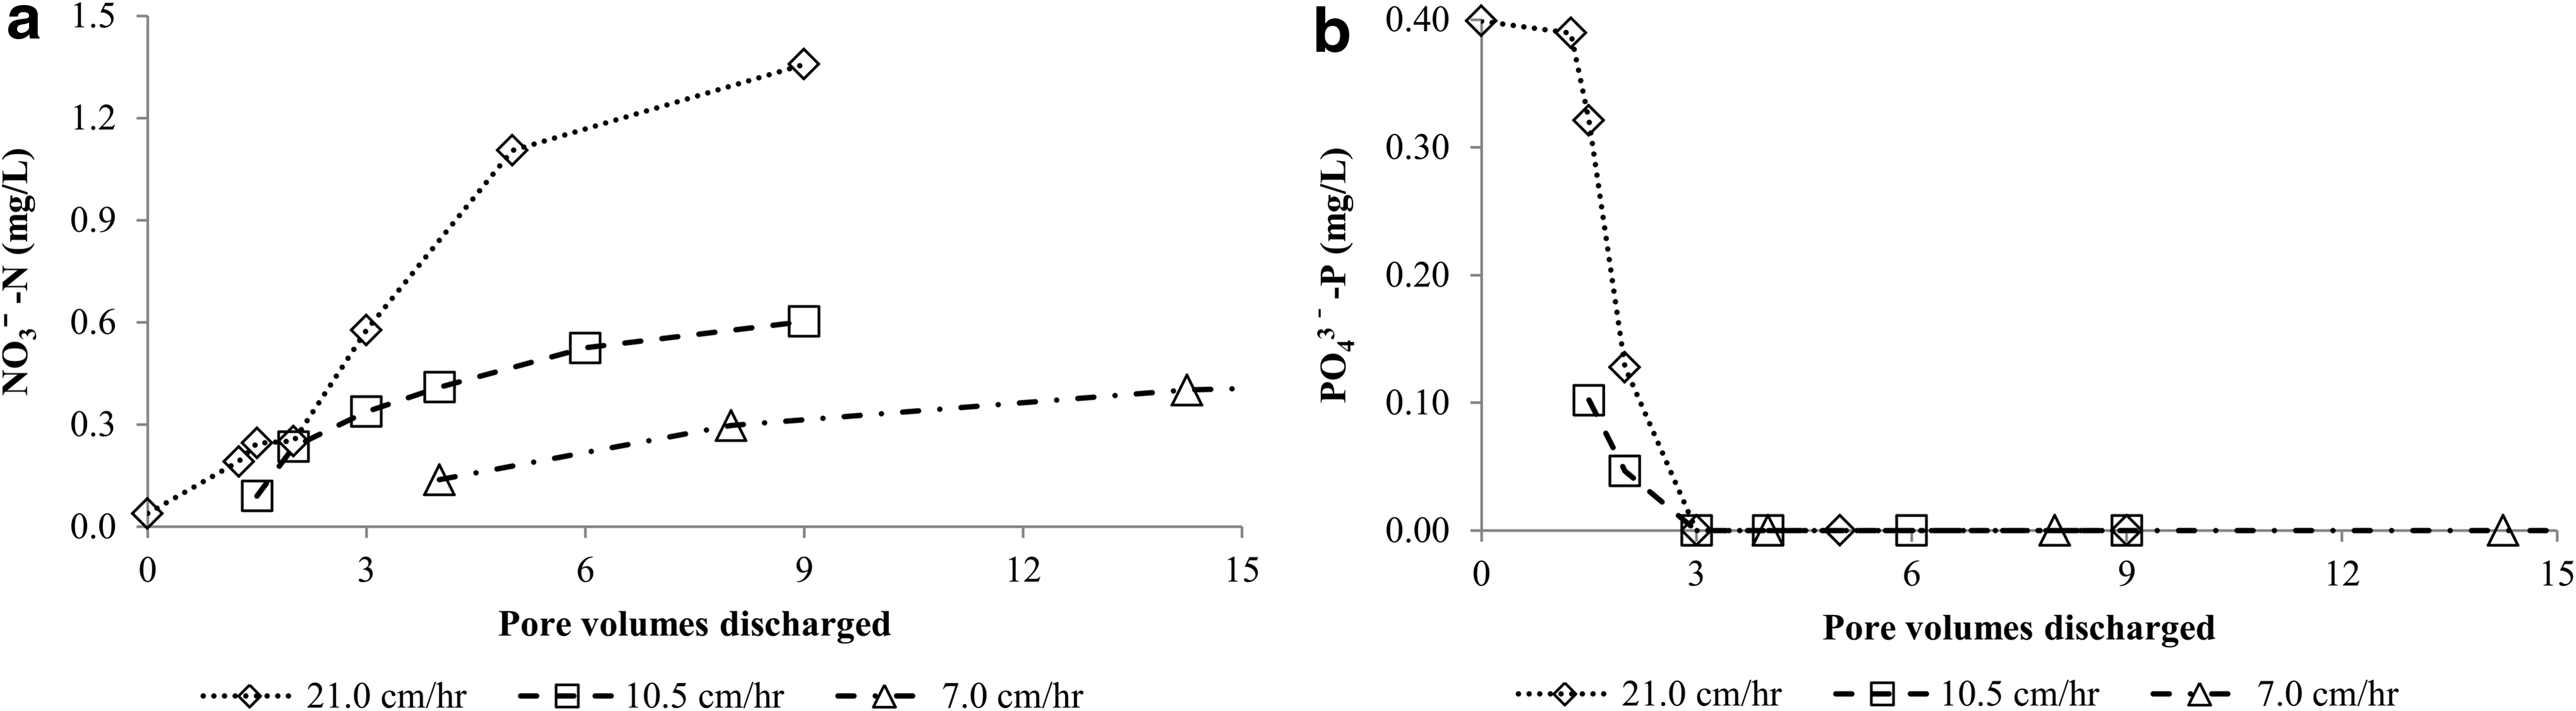
Effluent NO3−
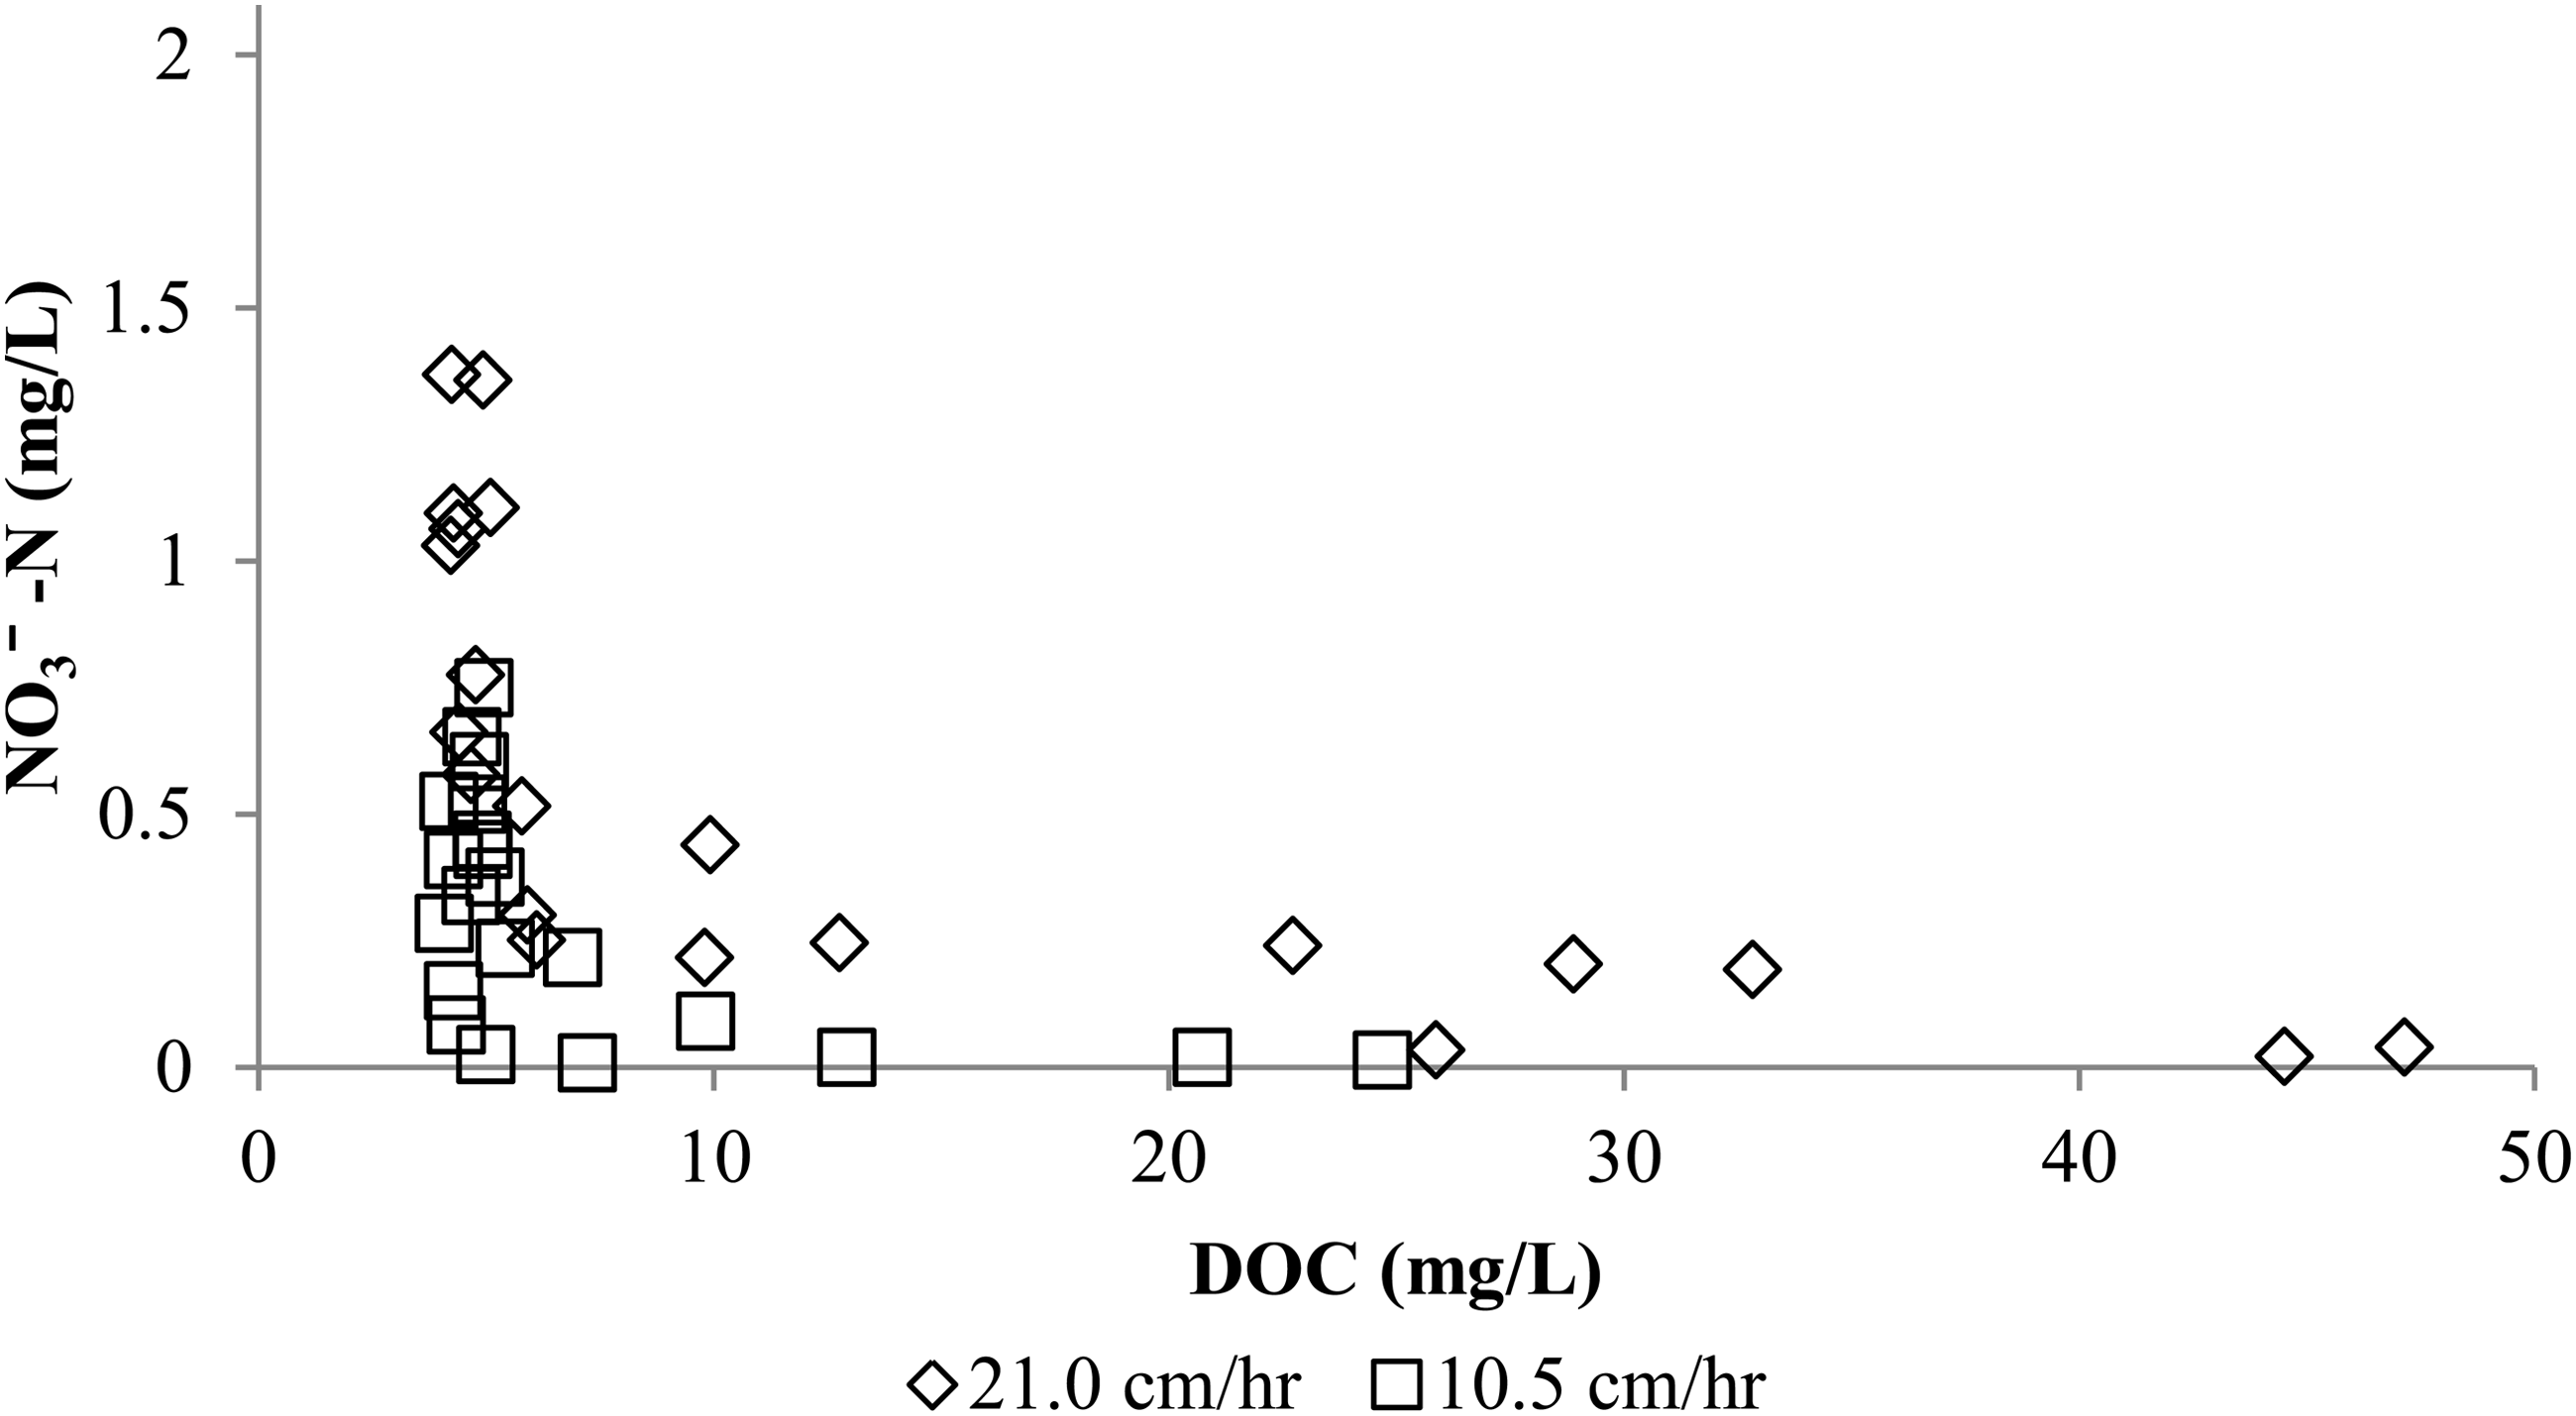
Effluent NO3− and DOC concentration data from the 30, 45 and 60 cm columns during the constant flow 21.0 cm/h (SE No. 8) and 10.5 cm/h (SE No. 10) storm events.
Discussion
Overall results (Table 3) show that consistent NO3− and TN removals can be achieved in properly designed wood chips biofilters. However, some export of TKN was observed, possibly due to leaching of organic nitrogen from the wood chips (Schmidt and Clark, 2012; Peterson et al., 2015). The overall PO43− results provide evidence that denitrifying biofilters are capable of retaining phosphorus. The low SO42− removal efficiencies observed were similar to the findings by Lynn et al., (2015) and Elgood et al., (2010) who studied denitrifying biofilter microcosms using stormwater and mesocosms using wastewater, respectively. The overall TSS and VSS results (Table 3) indicate that denitrifying biofilters can be utilized for other stormwater treatment applications such as polishing filters to improve TSS and VSS removal in wet detention systems. However, the high TSS and VSS removals indicate that problems with clogging may be a concern. Hatt et al., (2007) evaluated the performance of a gravel filter and observed clogging throughout their study. However, their filters incorporated an underlain layer of fine sand, which may have induced system clogging. The overall pH results (Table 3) indicate that volatile fatty acids (VFAs) are produced through hydrolysis of the wood chips, which dissolve into the pore water and decrease the pH.
Overall results (Table 3) also show how ADCs affect the performance of denitrifying biofilters. During periods with frequent rainfall events (SE Nos. 1 and 5), lower NO3− and higher PO43− removal efficiencies may occur compared to dryer periods with longer ADCs (SE Nos. 2, 3, 4, and 9). Moreover, longer ADC storm events will likely discharge higher DOC loadings. Nitrate removal results observed in this study were similar to the results reported by Kim et al., (2003) who observed high NO3− mass removal efficiencies in saturated denitrifying biofilter columns that were subjected to long ADC storm events. However, the PO43− removal results are in contrast with Barrett et al., (2013) who hypothesized that PO43− removal could increase with an increase in ADCs due to PO43− precipitation.
Dynamic NO3− removal performance of the columns showed that during normal storm events the initial mean effluent NO3− concentration was near or equal to MDL, increased to the highest effluent concentration at the highest hydraulic loading rate, and then decreased as the hydraulic loading rate decreased (Fig. 3a). Based on these data alone, an increase in detention time will increase NO3− removal as was previously observed by others (Kim et al., 2003; Smith, 2008; Lucas and Greenway 2011; Peterson et al., 2015). However, mixing of the influent and pore water may also affect effluent NO3− concentrations (Kim et al., 2003) (Fig. 5a). In addition, DOC flushing will decrease the rate of heterotrophic denitrification and will result in higher effluent NO3− concentrations over time (Figs. 5a and 6). Similar results were reported by Yang et al. (2010), who observed that higher carbon to nitrogen ratios in rain gardens yield greater NO3− removal efficiencies, and Warneke et al. (2011) who observed that bioavailable carbon in the pore water limited NO3− removal rates in microcosms that contained high initial NO3− concentrations. The results of this study indicate that many factors control NO3− transformations in denitrifying biofilters. The findings from this study are currently being incorporated into a mathematical model to gain further insight into the performance of stormwater denitrifying biofilters (Lynn, 2014).
Understanding pore water DOC concentrations during ADCs (Fig. 2a) and storm events (Fig. 3b) can be useful in identifying the underlying processes that occur in denitrifying stormwater biofilters. Higher pore water and mean effluent DOC concentrations compared with influent DOC concentrations indicate that a DOC dissolution process, such as hydrolysis, was occurring during ADCs and during operation. Aerobic and anaerobic bacteria and fungi can hydrolyze solid organic substrates such as wood (Malherbe and Cloete, 2002) to VFAs which dissolves into and increases the pore water DOC concentration. In this study, pore water DOC concentrations (Fig. 2a) increased with increasing ADCs up to 16 days, indicating that the wood chip DOC dissolution rate usually exceeded the DOC utilization rate during ADCs. The decrease in pore water pH may also be an indicator of VFA production. The decrease in pore water DOC concentrations at very long dormant periods (30 days) may indicate that DOC dissolution rates decreased over time (Malherbe and Cloete, 2002; Cameron and Schipper, 2010; Schmidt and Clark, 2012) or that other microbial processes, such as methanogenesis consumed DOC. Methane emissions have been observed in denitrifying bioreactors used for wastewater treatment (Warneke et al., 2011), but methanogenic processes have not been studied in denitrifying stormwater biofilters. Nonetheless, higher mean effluent compared to influent DOC concentrations were observed during storm events (Fig. 3b). Future research on this topic is warranted because higher DOC loadings could cause an increase in biological oxygen demand (BOD), which may inhibit DO replenishment in downstream ecosystems. Problems with BOD export may be a particular concern during start up (Lynn et al., 2015) and may be reduced by flushing the media before installation.
To further illustrate the effect of ADCs on the dynamic relationship between NO3− and DOC, mean concentration data from the first three samples (Table 2) collected during the 0-day ADC (SE No. 5) and 8-day ADC (SE No. 4) normal storm events are shown in Figure 7a and b. The highest NO3− removal efficiencies (all at least 94%) and effluent DOC concentrations were observed in the initial sample taken from all columns and both ADC storm events. After the initial pore volume was flushed out, an increase in NO3− (Fig. 7a) and decrease in DOC (Fig. 7b) concentrations were observed from the second samples during both storm events. When the second and third samples were taken, significantly lower NO3− (second sample p-value=0.042 and third sample p-value=0.023) and significantly higher DOC (0.014 and 0.002) concentrations were observed in the effluent samples taken during the 8-day ADC compared with the 0-day ADC storm event. Similar high NO3− removal efficiencies (Table 3) from the 4+ADC normal storm events were observed.
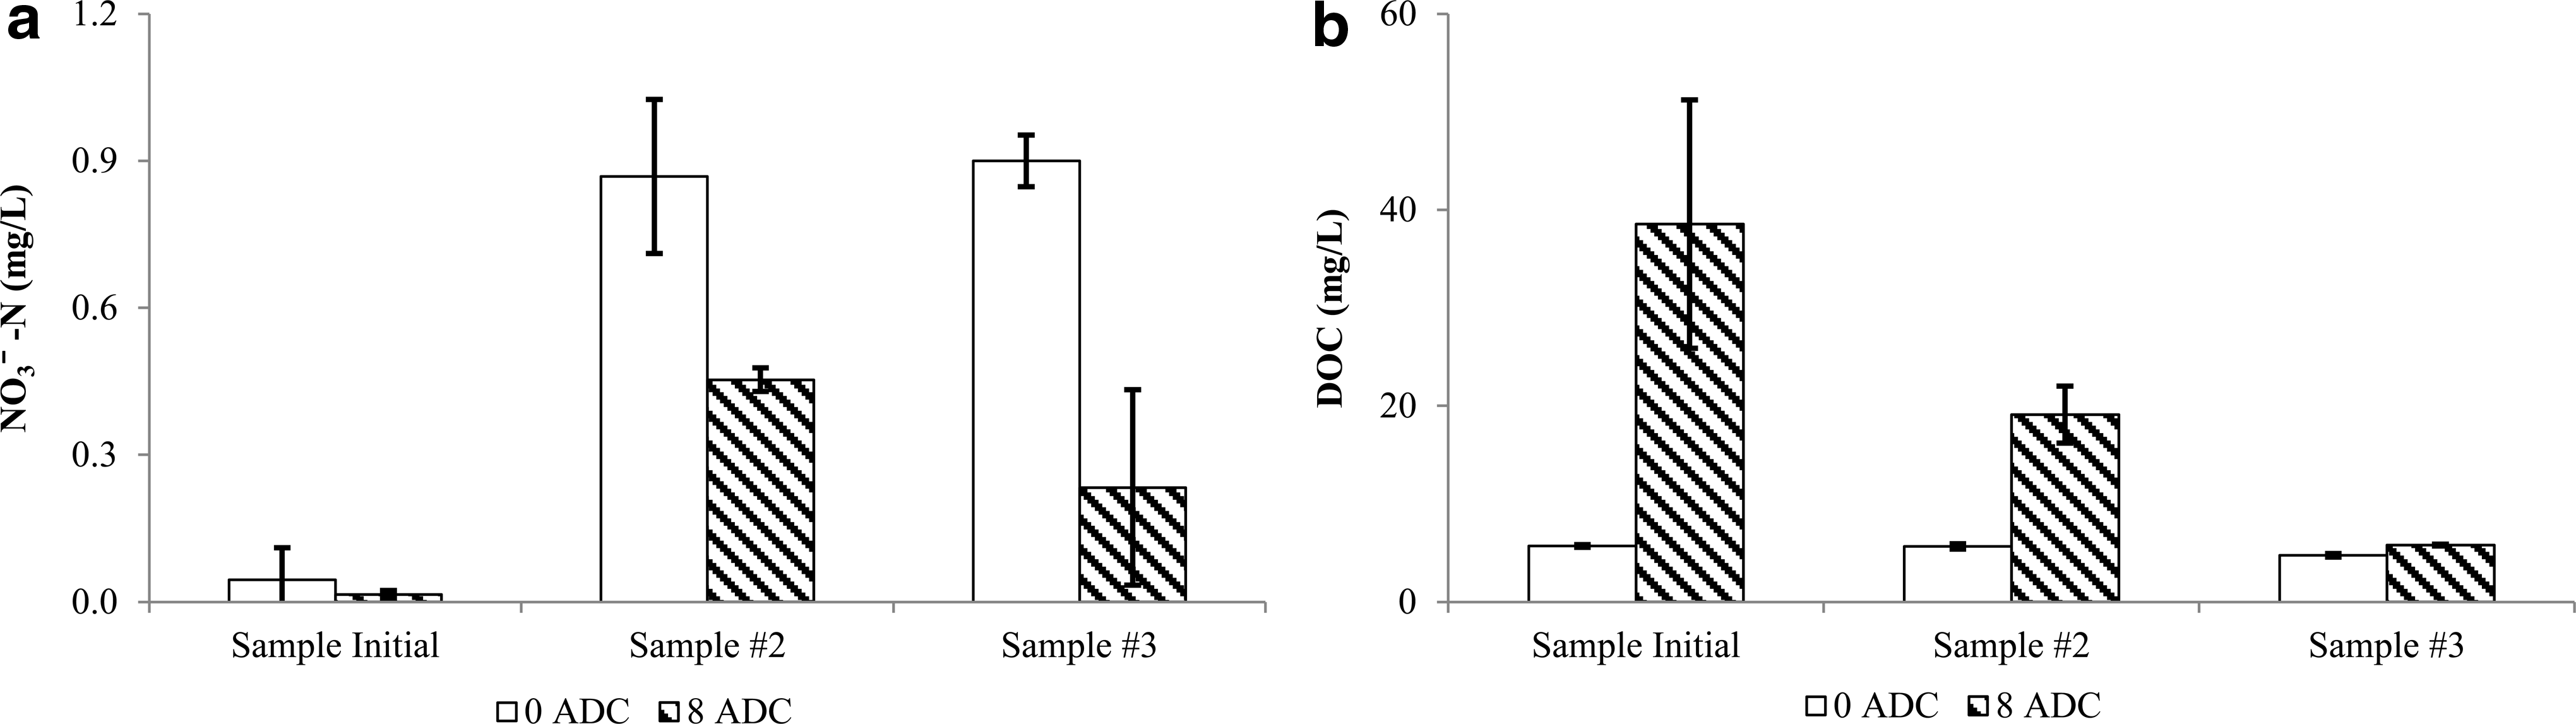
Mean effluent NO3−
Sulfate, NO3−, and DOC concentration data are useful for understanding other terminal electron-accepting processes that occur during ADCs (Fig. 2a, b) and storm events (Fig. 3a, d). Over the first 16 days of dormancy, DOC (Fig. 2a) and SO42− (Fig. 2b) concentration data were inversely correlated (DOC vs. 1/SO42−-S; r2=0.78). Moreover, when effluent NO3− concentrations (Fig. 3a) were present during the storm events, low or no removal of SO42− (Fig. 3d) was observed (excluding the effects of mixing). These results can be explained by the combined effects of hydrolysis and biological SO42− reduction. Sulfate-reducing bacteria can utilize SO42− and DOC to produce gaseous hydrogen sulfide when NO3− is absent (Yamashita et al., 2011; Tang et al., 2013). Previous studies of denitrifying bioreactors for wastewater treatment had conflicting findings as to whether or not biological SO42− reduction occurs in these systems (Elgood et al., 2010; Warneke et al., 2011; Yamashita et al., 2011). One concern with SO42− reduction in denitrifying biofilters with long ADCs is the potential for odor production; however, one benefit may be metal precipitation (Rittmann and McCarty, 2001).
TKN (primarily as organic nitrogen) and DOC concentration data are useful in understanding how different organic constituents are released at varying redox conditions. During storm events (i.e., aerobic/anoxic), effluent TKN concentrations (Fig. 4a) decreased with decreasing hydraulic loading rate possibly because biofilm scouring was reduced. During ADCs (i.e., anoxic/anaerobic), pore water DOC concentrations (Fig. 2a) generally increase with increasing ADCs, but the increase in pore water TKN concentrations (Fig. 2d) is not correlated with ADCs. This indicates that different processes control TKN and DOC release from the wood chips or biofilm. Similar results were observed by Schmidt and Clark (2012) who observed no correlation between TKN and DOC in a denitrification wall for wastewater treatment; however, Peterson et al., (2015) observed similar trends between TKN and DOC in a denitrifying biofilter that was evaluated under alternating saturated and unsaturated conditions.
Phosphate concentration data show that, in general, PO43− was retained during operational periods (Fig. 3c) and released during dormant periods (Fig. 2c) or when hydraulic loading rates were low (<3.5 cm/h) and NO3− was absent from the effluent. These results indicate that PO43− transformations in stormwater biofilters are influenced by changes in microbial factors and/or redox conditions. The results are consistent with prior studies, which have documented increases in dissolved phosphorus after the development of reducing conditions in submerged soils and sediments, possibly due to dissolution of iron oxyhydroxides (Shober and Sims, 2009).
Conclusions
Processes that occur in submerged denitrifying stormwater biofilters under intermittent conditions were investigated using a gravel–wood media mixture. Based on the results from this study, the following conclusions were drawn:
• During dormant conditions, NO3− was almost completely reduced, DOC and PO43− concentrations increased and SO42− concentrations decreased in the pore water. • During operational conditions, effluent DOC and TKN concentrations were higher and effluent PO43− concentrations were lower than the influent. • Higher NO3− removal efficiencies were observed with increasing ADCs, decreasing hydraulic loading rates or decreasing operation time. • When NO3− was present in the effluent, up to 100% PO43− removal was observed. • Data from this study are currently being used to develop a nitrogen removal model for denitrifying stormwater biofilters.
Footnotes
Acknowledgments
The authors would like to thank the staff from Sarasota County, FL for providing the eucalyptus wood chips. This article is based upon the work supported by the Environmental Protection Agency Center for Reinventing Aging Infrastructure for Nutrient Management (RD835569) and the National Science Foundation (Grant Number 0965743). Any opinions, findings, and conclusions or recommendations expressed in this article are those of the author(s) and do not necessarily reflect the views of the funding agencies.
Author Disclosure Statement
No competing financial interests exist.