
Abstract
Abstract
Life cycle assessment was used to evaluate environmental impacts of simultaneous fish and plant production through the aquaculture practice of aquaponics. In aquaponics, hydroponic plant production replaces the conventional water treatment processes of microbial nitrification and water exchanges required in recirculating aquaculture systems (RAS) to maintain water quality. The system expansion method was used to assess potential avoided burdens from coproduction of recovered solids, plant production, and water treatment. Results indicated that electricity and feed were the main contributing factors to environmental impact. Impact assessment results were highly sensitive to changes in electricity inputs, suggesting that a small reduction in electricity could contribute to a correspondingly large change in the environmental impact. Avoided burdens associated with coproducts contributed to a moderate reduction in environmental impact compared to reducing total electricity inputs or sourcing electricity from renewable sources. Of the coproducts considered, avoided water treatment contributed greatest to reductions in environmental impact due to reductions in energy use, water use, and eutrophication potential. The large reduction in water use suggests that plant production can contribute to increased recirculation rates and further reduce water inputs associated with aquaculture. Aquaponics, similar to other RASs, essentially eliminates local ecological impacts at the cost of high energy use and the addition of industrial fish feeds. Development of sustainable land-based aquaculture will encompass many production systems, including aquaponics; however, all systems will benefit from improved energy efficiency, increased accessibility to renewable energy sources, and development of sustainable fish feeds.
Introduction
A
Species are produced through a variety of methods, although ponds are the most common, making up 48% of aquaculture farms in the United States (USDA, 2014). The environmental impact of aquaculture varies with production method and farm practices; however, efforts to eliminate potential negative impacts to local water quality led to the creation of more intensive systems such as recirculating aquaculture systems (RAS). RAS are land-based systems that employ physical, chemical, and biological water treatment processes to allow continual recirculation of system water. Depending on the RAS design, water and solids may still be discharged to the environment; however, RAS operators have more control over the location and method of disposal.
Aquaponics, a specific type of RAS, combines recirculating aquaculture technologies with hydroponic plant production. Hydroponic plant production limits the accumulation of dissolved nutrients, specifically nitrate, in system water. The reduction in nitrate eliminates the need for water exchanges typically used to dilute nitrate concentrations in closed systems (Masser et al., 1999). In addition, the hydroponic plant beds remove ammonia and nitrite, potentially eliminating the need for a specific nitrification reactor and its associated capital cost and energy requirements (Rakocy, 2012).
Rapidly gaining popularity over the last 10 years in the United States, aquaponics is more commonly practiced on a small commercial scale or for private use. The growth of the private industry is demonstrated by the increased availability of formal courses and informal learning sources available in the form of Internet forums and videos. The number of commercial facilities in the United States more than doubled between 2013 and 2015, increasing from 71 to 145 systems (Love et al., 2015). The systems are often small by commercial standards with 90% of farms annually producing less than 453 kg of fish biomass. By comparison, a typical catfish farm in the United States produces on average 5,053 kg annually (Johnson et al., 2014).
Research on RAS, including aquaponics, has focused on system functionality and performance parameters, including fish health, in-system nutrient cycling, and fish and plant yields (Roque d'Orbcastel et al., 2009; Rakocy, 2012; Espinosa Moya et al., 2014). Several studies have examined the efficiency of water treatment processes and associated local water quality impacts (Piedrahita, 2003; Troell et al., 2003; Martins et al., 2010; van Rijn, 2013). Water quality impacts include discharge of particulate matter, nutrients, including nitrogen and phosphorus, and other inorganic compounds, which contribute to eutrophication and degradation of local water bodies (Piedrahita, 2003; van Rijn, 2013).
The performance research typically consists of large facilities producing between 4 and 100 metric tons of fish per year (Roque d'Orbcastel et al., 2009; Martins et al., 2010; Rakocy, 2012). Alternatively, small experimental systems have been evaluated, which produced less than one metric ton, and are completed over short time periods (Espinosa Moya et al., 2014). Qualitative assessments have indicated that these systems reduce the spread of diseases and invasive species, prevent degradation of coastal areas, and reduce water use (Gutierrez-Wing and Malone, 2006; Wik et al., 2009). Missing from these studies is a quantitative evaluation of both the local ecological impacts and the potential global impacts of intensification.
Life cycle assessment (LCA) is a tool used to quantitatively evaluate the environmental impact of a product or process. The tool allows a comparison of local impacts, such as eutrophication, regional impact, such as smog, and global impacts, such as greenhouse gas emissions. It has been used previously to evaluate fisheries and aquaculture systems (Ayer and Tyedmers, 2009; Roy et al., 2009; Henriksson et al., 2012); however to the authors' knowledge, no prior LCAs have been published on aquaponic systems (Boxman, 2015). Considering the growing number of commercial-scale aquaponic systems and the research focus on system performance, quantitative information on the environmental impact will aid the future development and enhancement of aquaponic systems. The goal of this study was to use LCA methods to identify “hot-spots” of environmental impact in a commercial-scale aquaponic system and effective strategies to reduce environmental impact on the aquaponic system.
System Description
A commercial-scale aquaponic system designed to produce fish was evaluated for this study. For the purposes of this study, the system produced tilapia and basil. Tilapia was selected because it is commonly cultured in aquaponics. Basil was selected because it is representative of the herbs and leafy greens predominately cultured in floating-raft aquaponic system and due to the availability of previous research on its production in the commercial-scale system. The commercial-scale system occupied a footprint of 500 m2 and required at least one manager and one full-time staff member for production.
The University of the Virgin Islands (UVI) in St. Croix has operated an aquaponic system for over 30 years (Fig. 1). The system consisted of four 3 m diameter fish rearing tanks stocked with either Nile tilapia (Oreochromis niloticus) or red tilapia (Oreochromis sp.) at densities of 77 and 154 fish/m3, respectively. The biomass density at harvest for both species was on average 18 kg/m3. The fish densities were selected based on the expectation of the critical standing crop, a biomass density that results in growth reduction. This threshold is reached when dissolved oxygen, carbon dioxide buildup, total ammonia nitrogen, nitrite, or behavioral limits are exceeded. Different densities were selected to accommodate variation in growth rates between species and maintain a constant feeding rate.
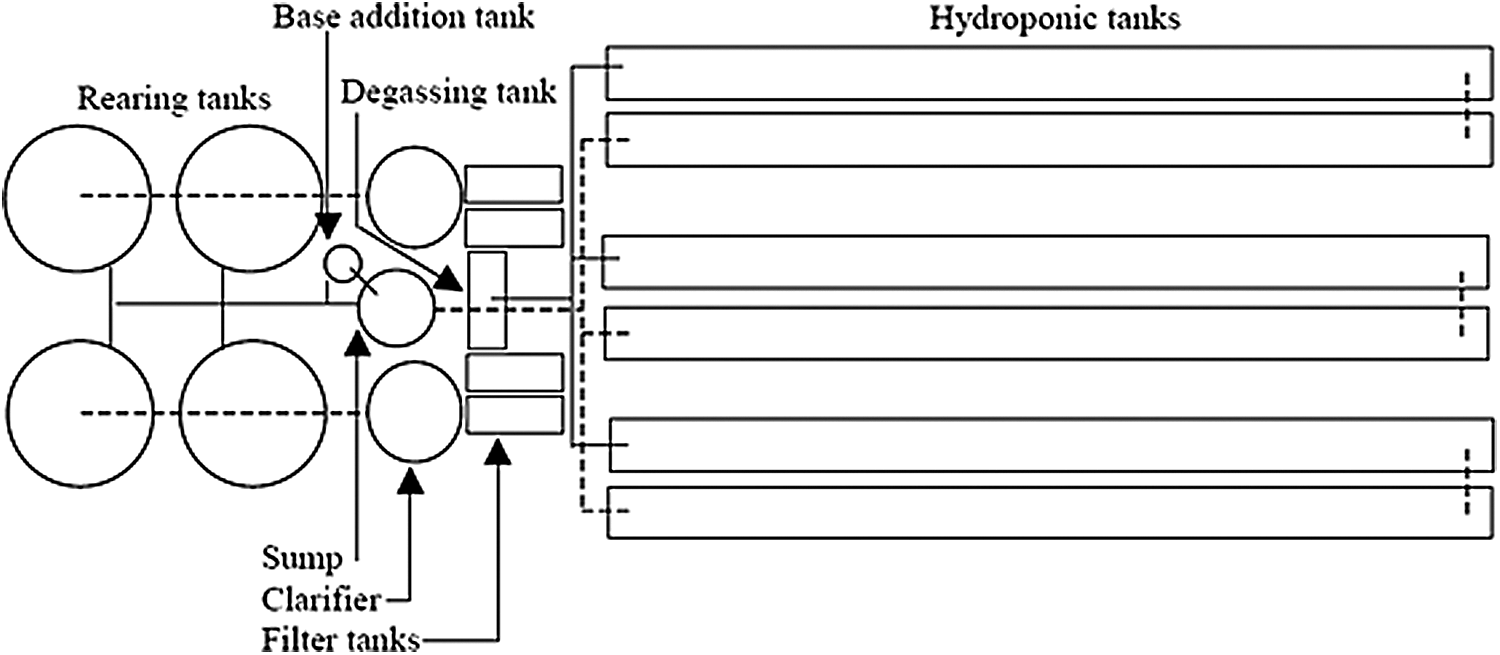
Schematic of commercial-scale aquaponic system.
Water flowed from the fish tanks to two cylindroconical clarifiers followed by four filter tanks filled with orchard netting for fine particulate removal. Solid wastes from the clarifiers were drained daily and the filter tanks were cleaned once or twice weekly. All solid wastes were routed into an aerated pond adjacent to the fish tanks and ultimately recovered as an agricultural amendment. Plants were grown in six floating raft-style hydroponic tanks with surface areas of 214 m2 and a total volume of 11.4 m3. A variety of vegetables have been grown in the UVI aquaponic system, and this study uses data collected during two basil production cycle (Rakocy et al., 2004).
Methodology
A process-based LCA was conducted following the International Standard Organization (ISO) 14040 standards, including four steps: goal and scope definition, inventory analysis, impact assessment, and interpretation.
Goal and scope definition
The main goal of this LCA was to assess the environmental impacts of a commercial-scale aquaponic system producing tilapia and basil. In this study, the system boundaries included farm production of fish and plants, feed production, infrastructure, and water treatment processes (Fig. 2). The boundaries were roughly “cradle to farm-gate,” although the hatchery phase was excluded from the system boundaries based on a similar exclusion in Aubin et al. (2009). In addition, Ayer and Tyedmers (2009) and Pelletier et al. (2009) found the hatchery phase to have a small impact on intensive aquaculture systems. Postharvest processing, packaging, transportation to market, and use were not included in the system boundaries.

System diagram for freshwater aquaponic system:
The function of an aquaponic system can simply be described as the production of fish and vegetables, although in practice, the situation is more complex. In initial designs, the main function of an aquaponic system was the production of fish, and vegetable production was a by-product of water treatment (Lewis et al., 1978). In more recent systems, vegetable production contributes to the main revenue source; as such, vegetable production could be considered the main function where fish function as a source of fertilizer, not necessarily a product (Love et al., 2015).
For the purposes of this LCA, aquaponics was considered from an aquaculture perspective and therefore the main product of an aquaponic system was fish and vegetable production was a by-product of water treatment. Therefore, the functional unit selected for this study was 1 ton live-weight fish produced annually in the commercial-scale aquaponic system described above. Fish production occurred in the U.S. Virgin Islands during the year 2002. The additional by-products, including vegetable production, were accounted for with system expansion. This functional unit was chosen to allow comparison with other LCAs of aquaculture systems (Aubin et al., 2009; Ayer and Tyedmers, 2009; Jerbi et al., 2012).
Coproduct allocation procedure
Coproducts in this study were the 1 ton live-weight fish, recovered solids used as fertilizer (941 kg solids), the quantity of wet-weight basil produced as a function of the total fish biomass (2,562 kg basil), and the water treatment provided by the basil growth (108 kg nitrogen removed). In this study, system expansion or the avoided burdens method was applied to avoid allocation (Weidema and Schmidt, 2010).
In system expansion, product systems with identical functions are substituted for coproducts such that isolation of a single output process occurs (Shu et al., 2010). The environmental impacts and resource use of alternative production methods for the listed coproducts were considered avoided burdens or “credits” and were subtracted from the total system burdens to isolate the desired functional unit of 1 ton live-weight fish (Azapagic and Clift, 1999; Weidema, 2000). This method of avoiding allocation has been applied previously for waste management systems, agriculture, and aquaculture (Cederberg and Stadig, 2003; Ayer and Tyedmers, 2009; Laurent et al., 2014; Cottle and Cowie, 2016).
The recovered solids were assumed to replace an equivalent mass of synthetic fertilizer in terms of elemental nitrogen, phosphorus, and potassium (Ayer and Tyedmers, 2009). Alternative disposal mechanisms for the solids could include anaerobic digestion for methane production, incineration for combined heat and power, or disposal as solid waste; however, on-site reuse as an agriculture amendment occurred at the study site, supporting the choice to substitute the recovered solids with synthetic fertilizer.
Conventional water treatment was assumed to consist of nitrification in a moving bed bioreactor (MBBR) followed by water exchanges to maintain a stable nitrate concentration. An MBBR was chosen because it is commonly used for the removal of total ammonia nitrogen in RAS and information pertaining to energy use was available. Due to the plant production, both the electricity required for aeration in the MBBR and nutrient emissions associated with water exchanges were avoided.
To address the coproduction of basil, the system boundaries were expanded to include conventional production of basil. Herbs such as basil can be cultivated using soil-based agriculture in fields and greenhouses, or hydroponically (Adam, 2005; Mossler, 2005). While these practices vary regionally and with farm size, for the purposes of this study, it was assumed that conventional basil production was completed with soil-based agriculture in outdoor fields. This is a common practice for commercial production in the United States and the U.S. Virgin Islands (Palada et al., 1999; Mossler, 2005). Furthermore, field experiments on basil production were completed at the Agriculture Experiment Station at the UVI, St. Croix campus, providing information on basil production, fertilizer use, pesticide use, and irrigation under similar climatic conditions as the aquaponic system (Palada et al., 1999).
To account for differences in basil production rates between aquaponic systems and agricultural systems, the inputs required to produce an equivalent quantity of basil was used to calculate the agricultural inputs and was not based on an equivalent production area (Naudin et al., 2014).
Life cycle inventory
Operational data on the commercial aquaponic system was collected from UVI through interviews with the facility manager and previous publications on the system (Rakocy et al., 2004, 2009). Infrastructure inputs were collected through facility records denoting materials required to replicate the system. Based on these records and interviews, estimated life spans were calculated for all infrastructure inputs and attributed to annual impact by dividing unit of inventory item by the life span of the component.
Nutrient budget modeling has been applied previously to determine emissions from fish production systems (Aubin et al., 2006, 2009; McGrath et al., 2015). In the nutrient budget model, the quantity of dissolved and particulate nitrogen and phosphorus emissions were calculated based on the difference between nutrients provided to fish in feed and the quantity assimilated into fish biomass. The quantity of particulate and dissolved wastes were estimated based on the nutrient digestibility of the feed, composition of the fish, and quantity of wasted feed (Aubin et al., 2006). The quantities of the coproducts-recovered solids and water treatment were then estimated based on this nutrient budget model (Table 1). For more detail on the model development, refer to Boxman (2015).
Water treatment includes avoided nutrient and water discharges due to water exchange. Recovered solids show mass of nutrients replaced with synthetic fertilizer. Quantity per ton of live-weight fish.
3.5% of feed was excreted by fish as ammonia, of which all was converted to nitrate by the biofilter (Piedrahita, 2003).
0.3% of feed was considered dissolved phosphorus (Cripps and Bergheim, 2000).
56% of feed was considered total solids (Piedrahita, 2003).
1.04% of feed was considered particulate nitrogen (Piedrahita, 2003).
0.4% of feed was considered particulate phosphorus (Cripps and Bergheim, 2000).
It was assumed that 100% of particulate nitrogen and phosphorus were captured by the clarifiers due to absence of information about the quantity of solids retained in the clarifiers. This represents an ideal scenario as additional solids were likely retained in the net tanks or settled out in other locations within the system. The solids captured replaced an equivalent mass of synthetic nitrogen and phosphorus fertilizer, and it was assumed that nutrient uptake from recovered solids was equal to synthetic fertilizers.
Dissolved emissions from the aquaponic system were avoided due coproduction of water treatment. As mentioned previously, it was assumed that hydroponic plant production replaced an MBBR. Water treatment with an MBBR is traditionally completed in two steps. First, an attached growth microbial nitrification process is used to oxidize ammonia to nitrate and to oxidize organic matter. Second, water exchanges are completed to maintain stable nitrate concentrations by discharging a certain volume of system water to local water bodies and replacing it with an equivalent volume of freshwater (Masser et al., 1999).
For the aquaponic system, 13% of system water must be discharged daily to maintain a stable nitrate concentration of 40 mg/L. The quantity of dissolved nutrients present in the discharge was estimated using the nutrient budget model. The model was also used to estimate aeration requirements in the biofilter. Aeration is added for nitrification and media mixing where the size and electricity requirements are based on ammonia excreted by fish and aeration requirements to fully mix media and oxidize ammonia to nitrate (Table 2).
TAN = maximum feed rate × 3.5% TAN from feed − passive nitrification − TAN concentration in water; where passive nitrification = 10% × maximum feed rate and TAN concentration in water = 0.5 mg/L (Losordo and Hobbs, 2000).
Media volume = (TAN/nitrification rate)/media surface area; where media surface area = 350 m2/m3 and nitrification rate = 0.00051 kg TAN/m2/day (Losordo and Hobbs, 2000).
Based on industry ratio of 142 lpm required per 1 m3 media volume (J. Michaels, pers. comm.).
Air provided by a 1/2 HP pump.
TAN, total ammonia nitrogen.
Background inventory such as manufacture of infrastructure inputs, feed processing, transportation, and electricity generation was obtained from ecoinvent v3 available within the SimaPro 8.0, PhD version software (Weidema et al., 2013). A custom medium voltage energy mix for the U.S. Virgin Islands (98.3% fuel oil and 1.7% solar) was used (EIA, 2016). Information on aquaculture feed components and the ingredients in the 32% protein aquaculture feed were estimated based on a literature review (Table 3). The fertilizer and water requirements for basil production through agriculture were based on field experiments at the Agriculture Experiment Station at the UVI, St. Croix campus (Palada et al., 1999).
Feed composition was based on order of ingredients on package and comparison of other feeds in literature (Pelletier and Tyedmers, 2010; Tacon et al., 2011; Mungkung et al., 2013).
Indicates it was an ingredient listed in the food, but was not considered in the analysis.
System data consisted of primary data collected on-site or from the literature (Palada et al., 1999; Rakocy et al., 2004). Data on feed composition and processing were collected from literature and validated by comparison with previous studies (Pelletier and Tyedmers, 2010; Tacon et al., 2011; Mungkung et al., 2013). Data for the mass balance model were validated through comparison with previous studies (Aubin et al., 2006, 2009; McGrath et al., 2015). Additional secondary data were provided from the ecoinvent database. A complete inventory is provided in the supplementary material (Supplementary Table S1). A qualitative data quality assessment of all input parameters is also provided in the supplementary material (Supplementary Table S2) using the guidelines outlined in Greenhouse Gas Protocol (2011).
Life cycle impact assessment
Impact categories selected were global warming potential (GWP), human toxicity potential (HTP), acidification potential (AP), eutrophication potential (EP), energy use (EU), land competition (LC), and water use (WU). CML-IA midpoint approach was used to estimate GWP, HTP, AP, EP, and LC (Guinée, 2002). A review by Henriksson et al. (2012) indicated that the midpoint CML baseline method was the most commonly used impact assessment method in aquaculture. For this reason, the most recent version of the CML method was selected for this study to allow for comparison with other aquaculture studies in the discussion.
While a more region-specific impact assessment method could provide more regionally appropriate results, it would hinder comparison with other studies. Cumulative energy demand method v 1.02 was used to evaluate the EU (Frischknecht et al., 2007). WU is a relatively new development in LCA characterization factors and the ISO14046 Water Footprint method was still undergoing development until recently (ISO, 2014). Direct WU was calculated based on the quantity of water in m3 used in the production system (Roque d'Orbcastel et al., 2009).
These impact categories were selected because they highlight many issues surrounding intensive aquaculture systems. In particular, GWP, AP, EP, and EU have been identified as having a large environmental impact depending on the method of intensive production (Ayer and Tyedmers, 2009; McGrath et al., 2015). The human health impact category of HTP was selected to account for potential human health impacts and has been used previously in aquaculture studies (Ayer and Tyedmers, 2009). LC was included to assess the potential land use changes associated with aquaculture feeds (Pelletier et al., 2009) and WU was selected due to the implied water conservation of recirculating systems (Roque d'Orbcastel et al., 2009).
The LCA results for the categories GWP, HTP, AP, and EP were normalized using the World 2000 database, which is compliant with the CML-IA method (Sleeswijk et al., 2008). The LCA results presented in this study are relative expressions and do not predict impacts on category end points, the exceeding of thresholds, safety margins, or risks.
Sensitivity analyses
A sensitivity analysis was performed to determine the sensitivity of input parameters with corresponding changes in the impact assessment results. Sensitivity factors were calculated by varying specific parameters and then recalculating the characterization results (Cornejo et al., 2013). The sensitivity factor was calculated as a ratio between the relative change in characterization results and in input parameters. A large sensitivity factor indicates that a small change in the input parameter can contribute to large changes in the impact results (Held et al., 2013).
The input factors electricity, feed, and avoided burdens were varied by ±20%. The ±20% in feed corresponded to feed conversion ratios (FCRs) of 1.9 and 1.3, which are within a reasonable range for tilapia aquaculture (El-Sayed, 2013). In aquaponic systems, electricity and avoided burden inputs will vary with equipment selection, age, maintenance schedules, and other parameters. Therefore, a ±20% variation was considered acceptable to account for possible changes in equipment efficiencies.
Two electricity grid mix scenarios were also considered to evaluate changes in electricity source. To consider the potential impact of an aquaponic system operated in the United States, the average U.S. electricity mix (50% coal, 18% natural gas, 20% nuclear, 12% other) was used. The second scenario was based on the U.S. Virgin Island's plan to reduce fossil fuel use by 60% by 2025 (NREL, 2011). A projected mix for 2025 of 40% fuel oil, 40% solar, 12% wind, and 8% biomass was used. Since the impact assessment selection can influence the results, the U.S.-focused TRACI impact assessment method was also evaluated to determine if there were differences with the more European-focused CML method. The results of the TRACI impact assessment are presented in Supplementary Table S3.
While there was a likely uncertainty associated with the data, the probability distributions were unknown for a majority of the input variables; therefore an uncertainty analysis was not performed.
Results
Impact assessment
The system was divided into five processes and the contribution of each process to the selected impact categories was evaluated. A quantitative assessment of the impacts attributed to each process was estimated for the system presented in Table 4. The potential impacts from construction and chemicals were small with less than 11% of the total impact associated with these processes for all categories except EP. After EP at 16%, construction contributed greatest to HTP at 11%. Chemicals contributed greatest to EP at 27%.
The values for avoided burdens are negative because they were credited to the system.
AP, acidification potential; EP, eutrophication potential; EU, energy use; GWP, global warming potential; HTP, human toxicity potential; LC, land competition; WU, water use.
Electricity dominated the environmental impact with the greatest contribution to the impact categories AP (93%), GWP (74%), HTP (41%), and EU (85%). Feed was the second highest contributor to the impact categories of AP (18%), GWP (32%), HTP (60%), and EU (22%). The energy carriers, electricity, and natural gas, required to process feed components, specifically the maize/corn, contributed to these impact categories. Feed contributed greatest to the LC with 98% of the impact associated with feed.
Avoided burdens contributed to a reduction between 0% and 15% for the categories AP, GWP, HTP, EU, and LC. The greatest reductions in life cycle impacts due to the avoided burdens were from a −1,625% reduction in EP. The coproduction of water treatment and corresponding elimination of direct nitrogen and phosphorus discharges to the environment contributed to this large reduction in EP. Avoided burdens also contributed to a large reduction in WU of 111%, also due to the avoidance of water treatment. In the category WU, construction, chemicals, feed, and electricity required 0 m3 of water due to the inclusion of only direct WU.
The normalization results indicated that the relative global, per capita contributions were greatest for the category HTP and lowest for EP (Fig. 3). Electricity and feed continued to dominate the environmental impacts after normalization.
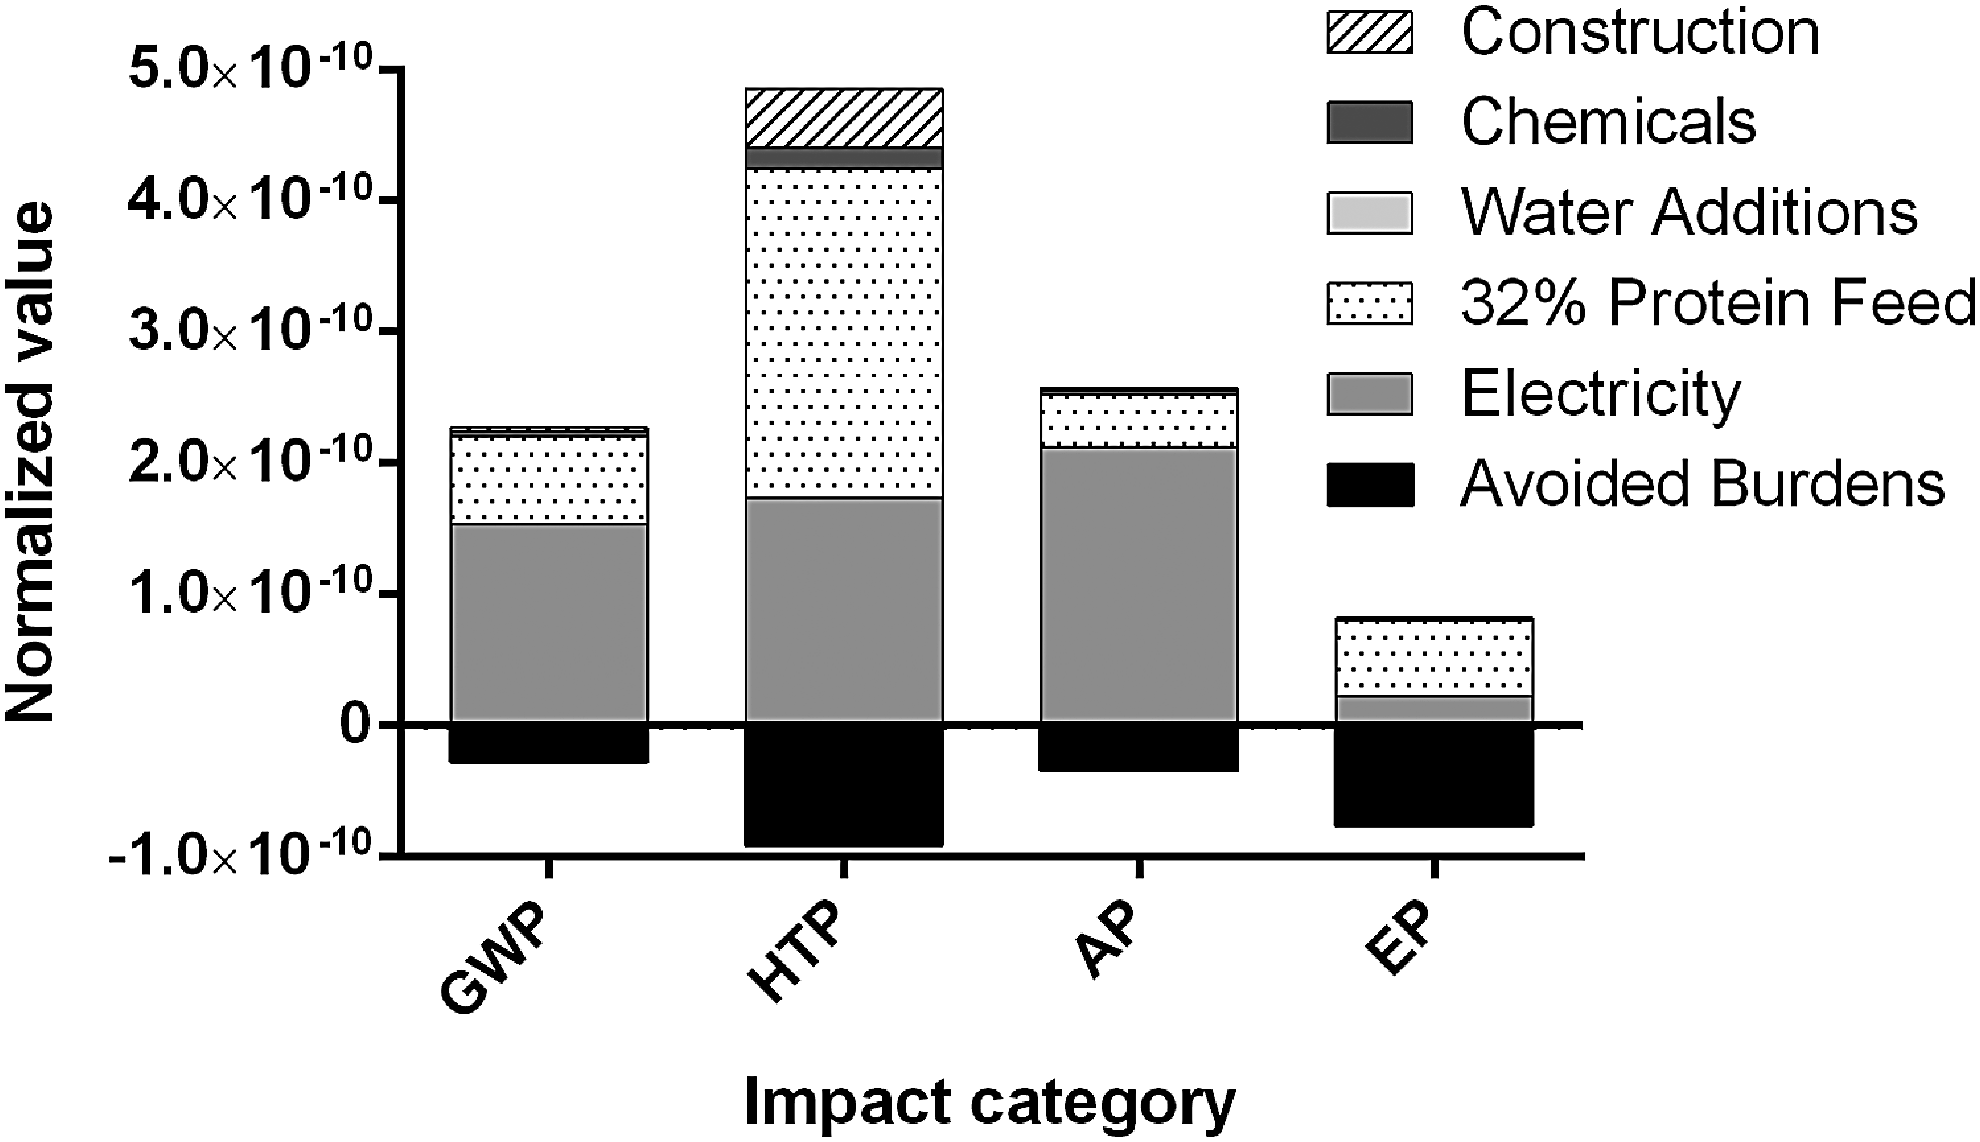
Normalization results for GWP, HTP, AP, and EP using World 2000 normalization set compliant with the CML-IA method. AP, acidification potential; EP, eutrophication potential; GWP, global warming potential; HTP, human toxicity potential.
Sensitivity analysis
Based on the results of the impact, assessment feed, electricity, and avoided burdens were selected for the sensitivity analysis (Table 5). A ±20% change in the quantity of feed corresponds with high sensitivity factors of 12 and 0.97 in the categories of EP and LC, respectively. All categories with the exception of LC and WU were sensitive to changes in electricity. For the system process electricity, EP had the greatest sensitivity factor of 4.7 followed by AP (0.93), EU (0.85), GWP (0.74), and HTP (0.41).
Due to potential variation in the ways to address coproduction of solids, basil production, and water treatment, total avoided burdens and each individual coproduct were considered in the sensitivity analysis. Compared to feed and electricity, the total avoided burdens were less sensitive to changes in the input parameters with the exception of EP, which had the highest sensitivity factor of 16. WU was also sensitive to changes in total avoided burdens with a sensitivity factor of 1.1. When the coproducts were considered individually, recovered solids and basil production were not sensitive to changes in input parameters. Alternatively, water treatment was highly sensitive for the categories EP and WU with sensitivity factors of 16 and 0.94, respectively.
The current U.S. Virgin Islands grid mix had the greatest environmental impact for the categories AP, GWP, and EU (Table 6). For the categories of EP, HTP, and LC, the U.S. average mix had the greatest impact. The greater use of renewable energy sources in the U.S. Virgin Islands 2025 projected grid mix reduced EU by almost half compared to the current mix. Smaller reductions occurred with AP, EP, and GWP. In HTP, the reduction was negligible and LC resulted in a slight increase compared to the current mix.
Percent change from U.S. Virgin Islands mix in parentheses.
In addition, a brief analysis of the TRACI impact assessment method was completed to evaluate differences with the CML method. The TRACI impact assessment results follow the same trends as in the CML method in regard to the impacts of electricity and feed. See Supplementary Table S3 for percent contribution of each process to the specified characterization factors.
Discussion
Identification of hot spots
The first objective of this research was to identify hot spots of environmental impact in a commercial-scale aquaponic system. Based on the results, two hot spots were identified: electricity and feed. Electricity requirements were large in the aquaponic system due to the water pumping and aeration requirements. The dominant impact of electricity in this study echoes the trends found in previous LCA studies of intensive land-based aquaculture systems.
Ayer and Tyedmers (2009) compared production of 1 ton live-weight salmon in four different aquaculture systems with increasing levels of intensification. The most intensive system, a RAS, consistently contributed greatest to the environmental impact categories selected due to the higher electricity requirements. Only in the category of EP did the RAS contribute least to environmental impact when compared to other aquaculture systems. As an intensive land-based system, it was expected that aquaponic systems, like their RAS counterparts, are subject to the trade-off between electricity use and direct emissions to the water.
While electricity has a large environmental impact, the contribution of electricity was not equal across the system. The contribution of electricity to each impact category was proportional to the electrical consumption of the equipment used. In the commercial-scale system 43% of the electrical requirements were for aeration in the fish tanks and degassing immediately after the fish tanks (Fig. 4). Aeration in the plant beds contributed to 51% of the electricity requirement.

Relative contribution of electricity inputs in commercial-scale aquaponic system.
Plant bed aeration is necessary to provide oxygen for root respiration and for nitrifying bacteria. Research on deep water hydroponic systems, like those used in the aquaponic system in this study, demonstrated the necessity of adequate oxygen levels in system water (Morard et al., 2000). Failure to supply enough oxygen to roots results in limited plant growth and increased susceptibility to disease (Morard and Silvestre, 1996).
Alternative hydroponic designs can potentially eliminate the need for constant aeration used in deep water hydroponic systems. The nutrient film technique (NFT) exposes roots to only a thin layer of water and does not require additional aeration as plant roots are not subjected to complete submergence. This design has been successfully applied to aquaponics in research (Lennard and Leonard, 2006) and is commonly used in commercial or hobbyist aquaponic systems (Love et al., 2015). In addition, NFT systems are compact and light weight, allowing for multiple levels of plant growth to maximize use of vertical space. The trade-off with NFT systems is a lack of passive nitrification on system walls. The absence of this nitrification mechanism could result in the need for a separate biofilter and subsequently additional aeration, thereby negating any electrical savings from operating an NFT plant bed.
The second hot spot identified was feed, which is well known to be one of the main impediments to the development of sustainable aquaculture. Other LCA studies on intensive aquaculture systems have found that feed was the main contributor to several impact categories, including EU, GWP, and LC (Aubin et al., 2009; Roque d'Orbcastel et al., 2009; Jerbi et al., 2012). In this study, feed contributed greatest to EP relative to other categories, which was unusual compared to other studies. The greater relative impact was due to the reductions in impact from the coproducts. When the production of 1 ton live-weight fish was compared based on kg PO4 eq, the absolute value for EP of 9.16 kg PO4 eq in this study was similar to the 8.4 kg PO4 eq found in Ayer and Tyedmers (2009).
LC was particularly large due to the high percentage of agricultural ingredients in the feed. Rising prices for fish meal and fish oil combined with increased awareness of dwindling fisheries stocks have led to the development of fish feeds with higher plant-based protein sources (Naylor et al., 2000). Soy meal, a common replacement for fish meal, was found to have a 30–44% reduction in environmental impact when compared to fish meal for all impact categories considered in Pelletier and Tyedmers (2007). However, the reduction in environmental impact of plant-based feeds comes at the cost of higher land use impacts. In this study, 98% of LC impacts were due to feed. Similar results were found in Roque d'Orbcastel et al. (2009), which suggested that a lower FCR was more effective at reducing environmental impact than feed composition.
Another option for reducing the environmental impact of aquaculture feeds could be the use of microalgae. Recent research has shown microalgae to be a suitable source of protein in animal feeds (Becker, 2007). Microalgae-based fish feeds are currently used in larval fish rearing and are added to artificial diets to enhance the coloration of species such as salmon and trout (Spolaore et al., 2006).
Microalgae have several advantages over plant-based crops in that they can be grown on land unsuitable for agriculture, have higher productivity than terrestrial plants, and can utilize nutrients from various wastewater sources (Demirbas and Demirbas, 2011). An LCA of a microalgae cultivation system indicated that microalgae-based feed could reduce impacts to LC and WU, although the system did not contribute to lower carbon emissions (Taelman et al., 2013). At present, the cost of microalgae production remains prohibitive to widespread use of microalgae in aquaculture feeds, especially when compared to production costs of traditional feed ingredients (Vigani et al., 2015). The current emphasis on microalgae biofuels and significant investment in algae cultivation for biofuels will potentially lead to improved technologies and thereby increase the use of microalgae in aquaculture feeds.
Avoided burdens
The first potential avoided burden was from nutrients contained in captured solid fish waste. The solid waste collected daily was assumed to offset production of similar quantities of synthetic nitrogen and phosphorus fertilizer. The greatest contribution of the recovered solids to environmental impact was due to a 63% reduction in EP. For all other impact categories, the reduction was less than 0–2%. In both systems, the quantity of captured solids was small relative to other inputs such that any offset was negligible.
Plant production in aquaponic systems theoretically contributes to reduced environmental impact in several ways. The first considered in this study was the avoidance of fertilizer, pesticides, and irrigation due to plant production aquapoincally. In aquaponic systems, fertilizer is provided by the fish waste such that no additional nitrogen or phosphorus is added (Bernstein, 2011). Similarly, pesticides cannot be used due to their potential negative impacts on fish health (Rakocy, 2012).
The results indicated that the avoidance of pesticide production had negligible environmental impact. At its greatest, avoided pesticides contributed to an 8.0% reduction in HTP. Avoided synthetic fertilizer did result in 39% reduction to EP, although the reduction in other categories was less than 1%. While the average basil yields per square meter in the aquaponic system were greater than in agriculture, the impacts of feed and energy dominate any avoided burdens from fertilizer and pesticides.
Plant production aquaponically did contribute to a large reduction in WU. WU was reduced by 17% due to the avoided irrigation. Previous LCA studies of aquaculture systems have already demonstrated that RAS consume less water than other types of aquaculture. Samuel-Fitwi et al. (2013) compared an RAS to an extensive aquaculture system and found the WU in RAS to be 99% lower.
The results of this study indicated that when plant production is added to the culture system, there are additional water savings. The importance of those water savings should not be overshadowed by the high energy requirements. Agriculture faces conflicting challenges of substantially reducing water use, while significantly increasing production to meet food demands of a growing population (WWAP, 2015). Based on this LCA, aquaponics is one tool that can help increase water use efficiency in food production.
The second coproduct considered to be derived from plant growth was water treatment. Plant production and associated nutrient uptake replaced the need for ammonia removal by means of a biofilter otherwise required in an RAS. The avoided electricity for aerating a biofilter contributed greatest to the reduction in environmental impact of the whole system for the categories of AP, GWP, HTP, and EU. Compared to the other energy sources in the system, avoided biofilter aeration was 14% of the system's total EU.
When the results of this study are compared to other studies of RAS with similar system boundaries, it is difficult to isolate the impacts of avoided water treatment relative to the other systems, which typically report aggregated EU. If examined based on total energy usage, the EU of 112,000 MJ in this study was less than the 353,000 MJ used per ton live-weight fish in Ayer and Tyedmers (2009). Although Ayer and Tyedmers (2009) did include fingerling production in the system boundary unlike this study, the contribution to total energy usage was less than 1%. An examination of the life cycle inventory indicated that the RAS system in Ayer and Tyedmers (2009) required three times more electricity per ton live-weight fish than this study; however, it is unclear what percentage of the energy was for water treatment, pumping, water temperature control, or other uses.
In Roque d'Orbcastel et al. (2009), which also employed similar system boundaries, an RAS operated with a biofilter had a lower EU of 63,202 MJ per ton of live-weight fish. The lower EU in Roque d'Orbcastel et al. (2009) was likely due to the use of airlift pumps that require less electricity than the centrifugal pumps used in this study.
In addition to the impacts on EU, water treatment through plant production contributed to a reduction in WU and EP. Plant production replaced the need for water exchanges and reduced the WU by 111%. This avoided discharge contributed to a large reduction in EP of 1,463%. A comparison of a flow-through and RAS producing 1 ton live-weight fish showed that the EP from production of the flow-through and RAS were 60.8 and 69.9 kg PO4 eq, respectively (Aubin et al., 2009). The reduction in EP found in this study compared to the flow-through and RAS in Aubin et al. (2009) demonstrates the importance of post-treatment of RAS effluents.
Constructed wetlands can be employed to treat water discharged from RAS (Zhong et al., 2011), although the dilute concentrations of aquaculture effluents reduces the treatment efficiency (Martins et al., 2010). Heterotrophic denitrification, algal ponds, and periphyton systems have also been used successfully to improve recirculation rates in RAS (van Rijn, 2013). These alternative nutrient removal mechanisms would result in similar water use reductions, although only algal ponds have the potential to provide a secondary product as in aquaponic systems (Merz and Main, 2014). The water treatment provided by plant production is a key advantage to aquaponic systems, allowing for 100% recirculation of system water, a demonstrated reduction in environmental impact, and a secondary income source.
Plant production had the potential to reduce the environmental impact of the aquaponic system in two ways: through avoided conventional plant production and through avoided conventional nutrient removal. Economically, plant production is often considered the most important aspect of the aquaponic systems as it typically provides greater revenue than fish production (Love et al., 2015).
The results of this study indicated that environmentally, avoided nutrient removal was more important. The main advantages were a small reduction in EU and a large reduction in water use, advantages that are not isolated to an aquaponic system. An RAS in Roque d'Orbcastel et al. (2009) using a biofilter for nutrient removal had lower EU than the commercial-scale aquaponic system. Ultimately, energy-efficient system designs with secondary nutrient removal to achieve 100% recirculation are more critical to the environmental impact of an intensive land-based aquaculture system than the presence or absence of plants.
External comparisons
To provide perspective on the assessment results at a global level, a normalization step was completed. The normalized results indicated that HTP had the greatest global impact on a per capita basis. As in the characterization step, feed contributed greatest to HTP due to the energy and manufacturing requirements of feed production. While normalization enables a comparison of all environmental impacts on the same reference scale, it is also useful to compare aquaponic fish production with other food products for impact categories of interest.
It is known that animal and agriculture products require large quantities of increasingly constricted fresh water resources and animal products typically require substantially greater quantities of water (Pimentel et al., 2004). Since aquaponics is a relatively new method of fish production, water use in this study was compared to other food products using data from Mekonnen and Hokestra (2010a, 2010b) and Tom et al. (2015). When compared on an L/kCal basis, fish production has lower water requirements on average than any other food product (Fig. 5a). If the analysis is narrowed down to intensive aquaculture systems, the aquaponic system has a net water savings compared to RAS and flow-through systems (Fig. 5b).

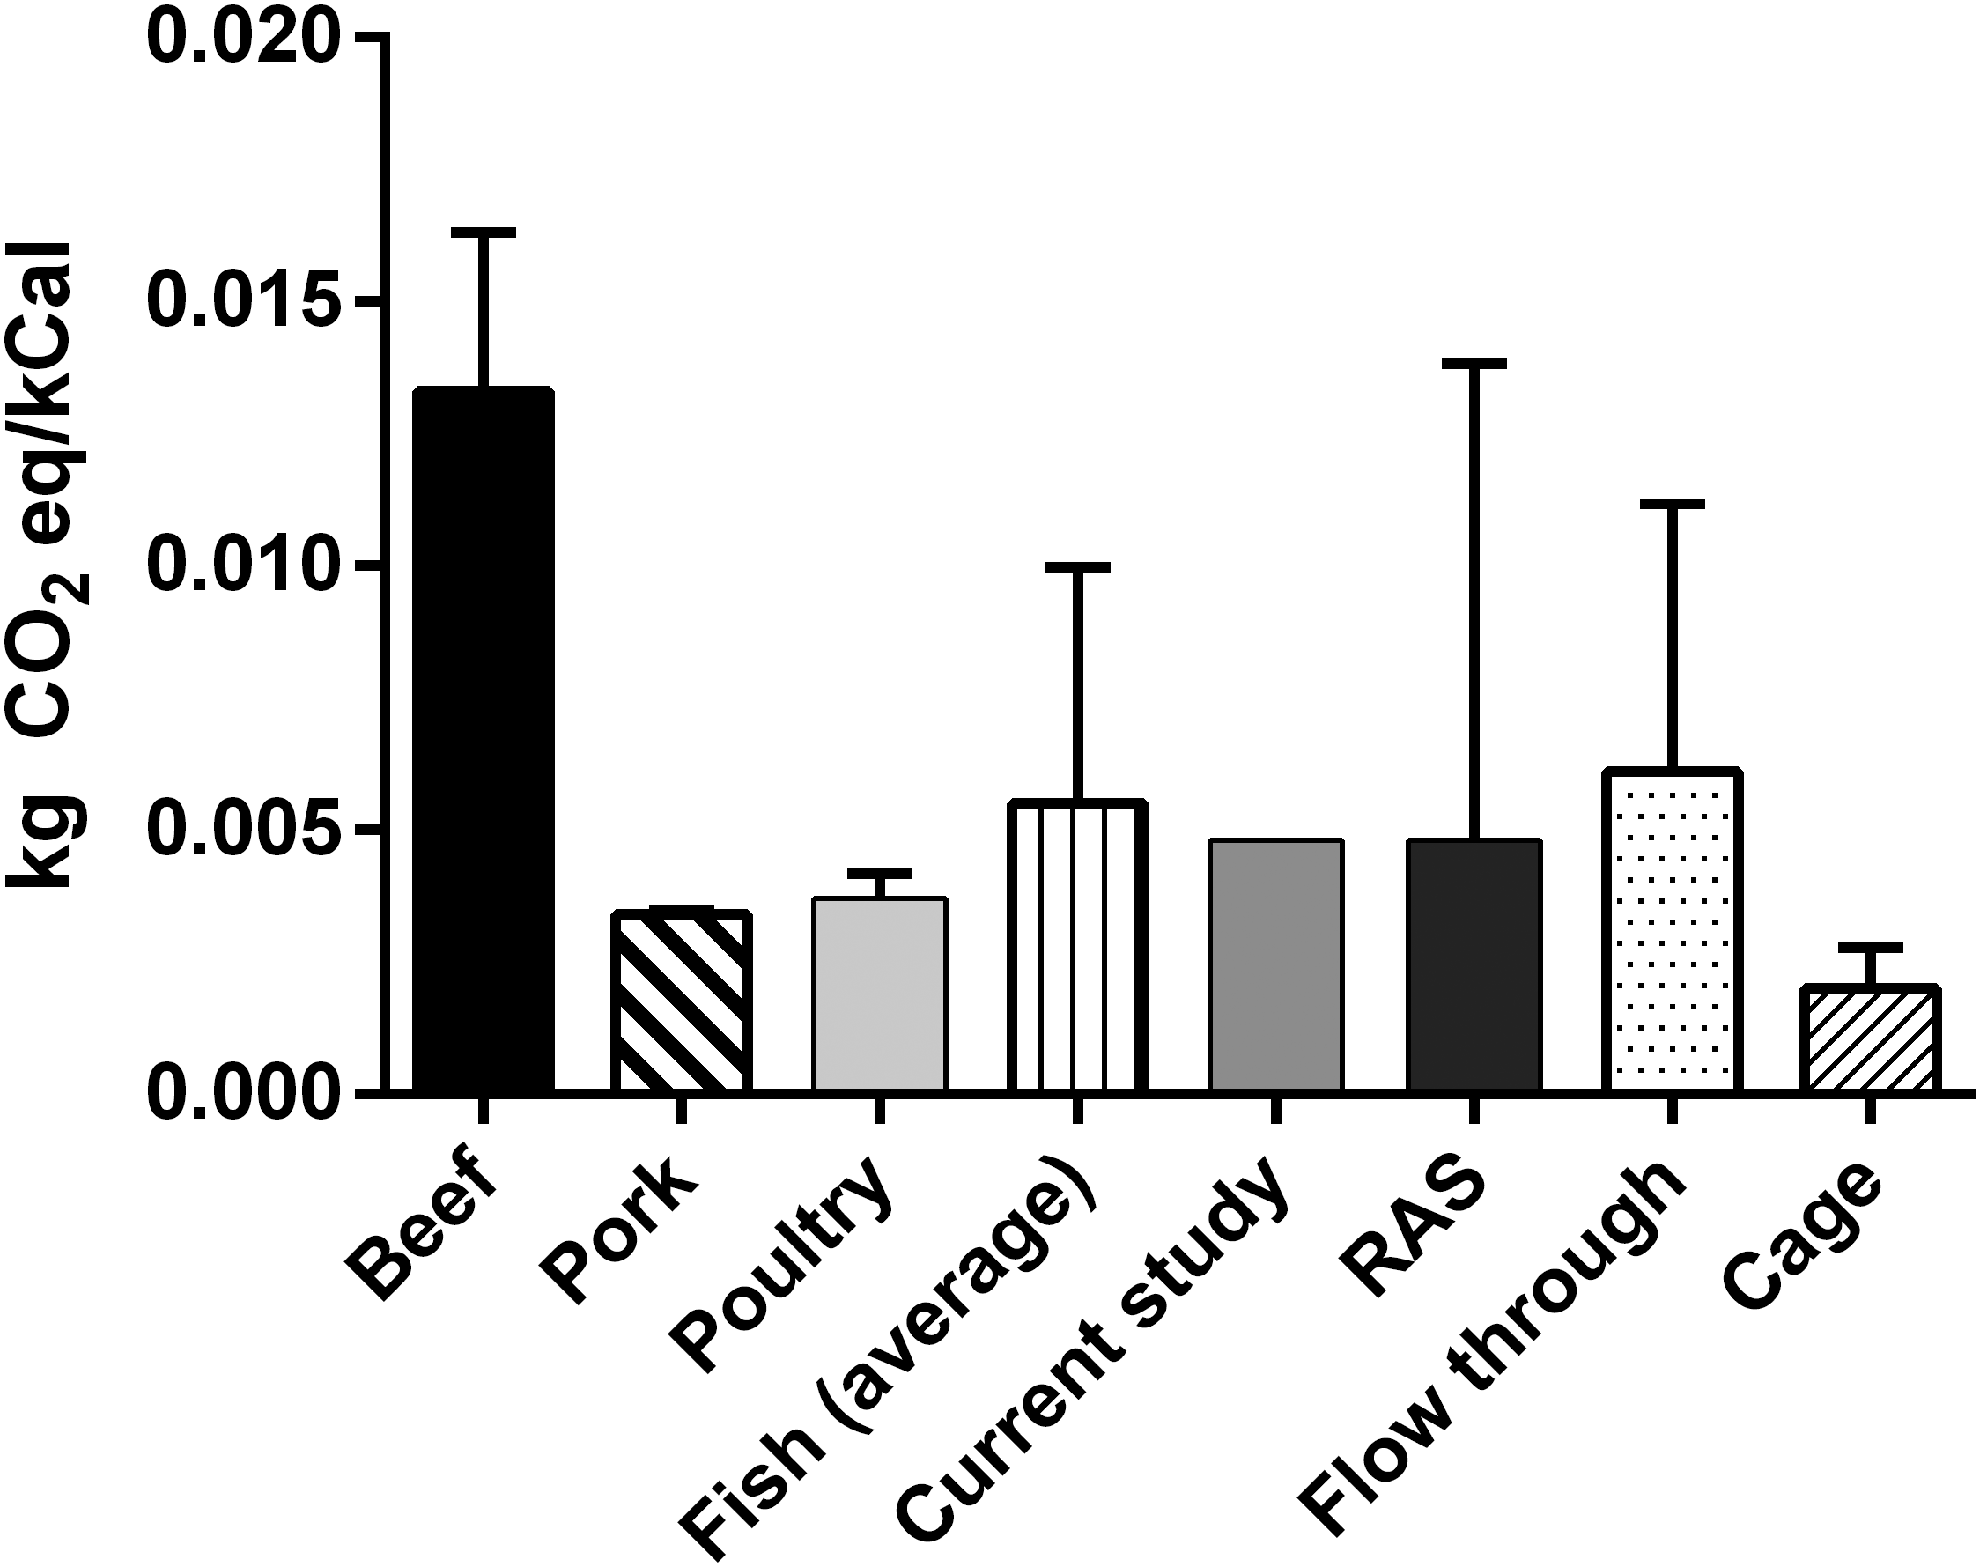
In an effort to consider additional environmental impacts important for food production, the CO2 emissions per kCal were also compared to other protein sources using data from Williams et al. (2006). While greater than pork and poultry, CO2 emissions from fish production were lower than beef (Fig. 6). Operation of aquaculture systems can vary widely; thus, average CO2 emissions for fish production had a correspondingly large standard deviation. CO2 emissions from the aquaponic system in this study were similar to RAS. The additional energy required for aeration in the plant beds likely contributed to high CO2 emissions, although this analysis only represents one system and other aquaponic systems could have lower emissions. Based on these comparisons, aquaponic fish production is highly water efficient at the expense of high CO2 emissions relative to pork and poultry.
Sensitivity analysis
The sensitivity analysis further supports the importance of energy-efficient aquaponic systems. The analysis indicated that with small changes in electricity input parameters, there was a large change in the impact assessment results, particularly global impacts. Thus, reducing electricity use could result in a significant decrease in the environmental impact, more so than any other single system process.
The environmental impact also varied with grid mix such that the results with the U.S. average grid mix were 14–29% lower for the categories of AP, GWP, and HTP. The trade-off with the predominately coal-based mix was a 368% increase in EP. In this energy scenario, the reduction of EP achieved by operating an aquaponic system is even more important in terms of reducing regional environmental impacts.
Multiple studies have also shown that changing the energy mix of aquaculture systems to include more renewable energy sources results in significant reductions to environmental impact (Aubin et al., 2009; Ayer and Tyedmers, 2009; McGrath et al., 2015). The results of this study also support this as the 60% renewable mix for the U.S. Virgin Islands resulted in reductions for almost all impact categories. Considering that electricity mixes vary greatly between regions, the environmental impact of aquaponic systems will be heavily influenced by total electricity requirements, regional electricity grid mixes, and use of renewable energy resources.
Reducing the electricity requirements and incorporation of renewable resources also have an economic incentive. Electricity costs are one of the most expensive variable costs in RAS and aquaponic systems (Bailey et al., 1997; Boxman et al., 2015). The electricity requirements will have an even greater effect for aquaponic systems located on islands where the monetary cost of fossil fuel-based electricity generation is substantially greater (EIA, 2016). Alternatively, islands with renewable energy resources can reduce the operational costs of aquaculture systems, such as aquaponic systems, while simultaneously reducing environmental impacts.
The sensitivity analysis also indicated that the environmental impact was sensitive to changes in feed inputs. Feed inputs were based on the yearly average presented in Rakocy et al. (2004) and equated to an FCR of 1.6. The variation of inputs by the ±20% used for the sensitivity analysis corresponded with FCRs of 1.9 and 1.3, respectively. These changes only reflect differences in the input quantity of feed and do not account for associated changes in waste produced or coproducts. The sensitivity of feed to changes in inputs supports previous research highlighting the importance of a low FCR for reducing the environmental impact of fish production (Roque d'Orbcastel et al., 2009).
An alternative option to reduce the environmental impacts from feed would be to harvest fish at a smaller size as this would reduce the total feed requirements. Final harvest weights are based on consumer expectations and additional research would be needed to determine if changes in expectations would be feasible. Studies related to meat consumption and the environment have demonstrated that it is difficult to change people's consumption patterns based on positive environmental impact alone (Mäkiniemi and Vainio, 2013).
The sensitivity of the avoided burdens to changes in input values was low compared to feed and electricity. When the avoided burdens are considered on an individual basis, the basil production was the least sensitive to changes. Recovered solids were also insensitive to changes. Considering that the assumption of 100% solids capture represented an ideal scenario, the sensitivity analysis indicated that reduced solids capture would have minimal impact on the assessment results. Similarly, the assumption that recovered solids were of equivalent quality to synthetic fertilizer had a small impact on the results.
Avoided water treatment was highly sensitive in regard to EP and WU. Even small increases in direct emissions of nitrogen and phosphorus have a large environmental impact. This information is important as it clearly identifies the capability of aquaponic systems to mitigate local water quality impacts due to direct discharge. Similarly, the system was sensitive to small changes in the quantity of avoided water discharge due to water treatment.
While the impact of aquaculture feeds is an important issue for all aquaculture systems, the sensitivity analysis of electricity and avoided water treatment highlights the benefits of operating aquaponic systems in resource-limited, ecologically sensitive areas with access to renewable energy. Coastal areas and islands where overfishing is an issue, water and land resources are limited, and ecosystems that are particularly sensitive are ideal candidates for aquaponic systems.
In this context, the fish- and plant-producing minimal nutrient discharge and water-efficient aquaponic systems have a clear advantage of protecting fisheries and vulnerable coastal ecosystems, while enhancing local food security. Coupled with the presence of lower cost renewable energy (EIA, 2016) and the economic and social costs of imported food (Beckford and Rhiney, 2016), there is a clear economic and environmental advantage for these local food production systems. While not appropriate for every context, in this situation, aquaponic systems could be a valuable tool to improve the self-sufficiency of islands and resource-limited areas, while sustaining local livelihoods.
Conclusion
LCA was used to evaluate the environmental impacts of a commercial-scale aquaponic system. Two hot spots of environmental impact were identified from the contribution analysis: electricity and feed. Similar to previous LCA studies on RAS and intensive aquaculture, the electricity requirements of the aquaponic system contributed greatest to four of seven environmental impact categories. Several impact categories were not evaluated in this study, in particular, the full range of human health impacts as only HTP was considered, and other categories such as ozone layer depletion, ecotoxicity, and photochemical oxidation also impact human health.
Considering the dominant impact of electricity and its sensitivity to changes, a small reduction in electricity requirements or an increase in access to renewable energy sources could contribute to a relatively large reduction in the environmental impact of aquaponic systems. While electricity requirements may vary with aquaponic system design, in floating raft-style aquaponic systems, the plant beds are a potential location for optimization. Feed was identified as the second hot spot and is well established as an impediment to sustainable aquaculture. Better FCRs, plant-based feeds, and the development of new feed sources will all likely contribute to reductions in environmental impact from feed.
In addition to fish, aquaponic systems produce several coproducts of which vegetable products are most frequently considered due to their tangibility and economic value. Equally important is the contribution of vegetable production as a water treatment process. Calculation of the avoided burdens through system expansion indicated that avoided water treatment from vegetable production contributed greatest to a total reduction in environmental impacts. Vegetable products alone contributed to large reductions in WU. As such, it is important to consider the avoided burdens from plant production and water treatment collectively. Only then the aquaponic system resulted in a lower environmental impact than intensive fish production alone.
Ultimately, aquaponic systems are exceptional at reducing local impacts from nutrient discharges. As the aquaculture industry expands, it is time to shift from a focus on reducing local impacts to creating highly productive, intensive systems with similarly low global impacts. Joint reductions in local and global impacts will lead to better aquaponic systems and help guide the next phase of sustainable aquaculture.
Footnotes
Acknowledgments
This research has received support by funding from Florida Sea Grant #SI-2014-0006; the University of South Florida Graduate School Challenge Grant; Partnerships for International Research and Education (PIRE), project number 1243510; and the U.S. Department of Education Graduate Assistants in Area of National Need (GAANN) Fellowship, project number P200A090162. Any opinions, findings, and conclusions or recommendations in this material are those of the author(s) and do not necessarily reflect the views of the sponsors.
Author Disclosure Statement
No competing financial interests exist.
References
Supplementary Material
Please find the following supplemental material available below.
For Open Access articles published under a Creative Commons License, all supplemental material carries the same license as the article it is associated with.
For non-Open Access articles published, all supplemental material carries a non-exclusive license, and permission requests for re-use of supplemental material or any part of supplemental material shall be sent directly to the copyright owner as specified in the copyright notice associated with the article.