
Abstract
Abstract
Adsorption of arsenate on titanium dioxide nanoparticles and bulk particles was studied at pH 4.5 and 7. Nanoparticle and bulk particle concentrations were 0.1–0.5 and 0.5–1.0 g/L, respectively. Initial Arsenic (As) (V) concentration ranged from 40 to 3,100 μg/L. Nanoparticles adsorbed more As (V) when normalized by mass, and bulk particles adsorbed more As (V) when normalized by surface area. At the same initial As (V) concentration, more As (V) was adsorbed at pH 4.5 than at pH 7. Adsorption data were best fitted with Freundlich isotherm model with r2 ranging from 0.97 to 0.99. Kinetic study showed that pseudo-second order model best describes the adsorption rate with r2 > 0.99. Simultaneous adsorption of single (As) and multiple metals (Zn, Cd, Pb) in San Antonio tap water was studied. Presence of multiple metals did not compete for As (V) adsorption sites in San Antonio tap water. The kinetic study showed an increased adsorption rate of As (V) in the presence of coexisting metals. Comparison of distribution coefficient (Kd) values with other works showed that TiO2 nanoparticles have 33–2,533 times greater Kd values than other nanoparticles and commercial activated carbon. Therefore, TiO2 nanoparticles could provide a better solution for the synergistic removal of arsenic and metals from water.
Introduction
A
The countries affected by arsenic contamination are Argentina, Bangladesh, Cambodia, China, Chile, India, Japan, Mexico, Nepal, New Zealand, Taiwan, USA, and Vietnam (Mohan and Pittman, 2007). Consumption of arsenic even at very low concentration can be carcinogenic (Zhu et al., 2008). Studies reported that long-term exposure to arsenic through drinking water causes lung and kidney cancers, hyperkeratosis, nausea, appetite loss, and neurological disorders (Jain and Ali, 2000; Mandal and Suzuki, 2002). The removal of arsenic from groundwater is of great concern. The maximum contaminant level of arsenic enforced in drinking water by USEPA is 10 μg/L (USEPA, 2001). Many different processes have been used to remove arsenic from groundwater and meet the regulatory standards; the major processes are adsorption, ion exchange, coagulation–precipitation, and membrane processes (Yu et al., 2013).
Adsorption due to its simplicity, cost-effectiveness, potential for regeneration, and sludge-free operation, is considered a promising process compared to other arsenic removal processes (Mohan and Pittman, 2007). Previous studies have suggested that surface areas, pore structure, and presence of surface hydroxyl groups determine the adsorption performance of adsorbents; however, it is still unclear why adsorbents have different arsenic adsorption performance even if they have similar pore structure, surface areas, and presence of surface hydroxyl groups (Pattanayak et al., 2000; Dutta et al., 2004).
Past studies have reported that metal oxides are more effective due to their high surface area to mass ratio, high surface reactivity, and unique catalytic activity (Ferguson et al., 2005; Waychunas et al., 2005). TiO2 has been used for the removal of As (V). Gupta et al., conducted an adsorption experiment with varying As (V) concentrations (1,000–10,000 μg/L) adsorbed on to 0.3 g/L TiO2 powder (rutile and anatase) (Gupta et al., 2013). The maximum adsorption was 84% for anatase with 220 m2/g surface area at pH 7. Dutta et al. (2004) conducted an adsorption experiment using two different TiO2 samples, Hombikat UV100 (99% anatase), and Degussa P25 (80% anatase and 20% rutile). The maximum As (V) was adsorbed at pH 3 (∼80%), and the minimum was adsorbed at pH 9 (∼15%) after 120 min using Hombikat UV100. Removal of arsenic using oxide/hydroxide nanoadsorbents is gaining popularity due to their large surface area, high specificity, and reactivity (Liang et al., 2004; Engates and Shipley, 2011).
Hristovski et al., reported >98% arsenate removal in all water matrices using TiO2, ZrO2, Fe2O3, and NiO nanoparticles (Hristovski et al., 2007). Pena et al. (2005) investigated As (V) adsorption on monocrystalline TiO2 in two different samples; 0.04 M NaCl, and synthetic water containing Mg2+, SO42−, NO3−, F−, SiO2, PO43−, Ca2+, CO32−, and Cl−. The As (V) was adsorbed effectively in a pH range below 8, and the ions present in synthetic water had a moderate effect on As(V) adsorption. It is important to look at the effect other species have on adsorption. Arsenic and other inorganic toxic metals were reported together in drinking water in Laos (Chanpiwat et al., 2011), Bangladesh and India (Frisbie et al., 2009; Bacquart et al., 2012), and Thailand (Tupwongse et al., 2007).
Furthermore, there is a lack of work on the influence of coexisting metals on arsenic adsorption particularly with nanomaterials such as titanium dioxide. Cui et al. (2015) investigated the coexisting effects of Ca2+, Mg2+, silicate, and HCO3− on As (V) adsorption and reported that Ca2+ and Mg2+ enhanced the As (V) adsorption; whereas, HCO3− and silicate decreased As (V) adsorption by 52% and 57%, respectively. However, their study was unable to report on the removal of heavy metals such as Pb, Zn, and Cd, which may also be present in the water and are harmful to humans and the ecosystem. In addition, it focused on granular media not nanomaterials, which have been shown to have large surface area, high specificity, and reactivity (Liang et al., 2004; Engates and Shipley, 2011).
Previous studies have proposed TiO2 nanoparticles as good sorbents for the removal of contaminant metals (Hu et al., 2006; Shipley et al., 2009; Engates and Shipley, 2011). Therefore, there is a need to study the sorption behavior of As and toxic metals such as Zn, Cd, and Pb to TiO2 in real water sample and study nano-TiO2 adsorption.
The objectives of this study were the following: (1)to investigate the adsorption of As (V) using 0.1 and 0.5 g/L nano-TiO2, and 0.5 and 1.0 g/L bulk-TiO2 at pH 7 and 4.5; (2) to compare the adsorption capacities and the rate of As (V) uptake using adsorption isotherms and adsorption kinetics, respectively; (3) to observe the simultaneous adsorption of single and multiple metals in San Antonio tap water; and (4) to determine the chemical binding affinity of As and the metals to TiO2 nanoparticles.
Experimental Protocols
Materials
Chemicals used in this experiment were of scientific grade brought from Fisher Scientific. A 100 mg/L stock solution of As (V), Zn (II), Pb (II), and Cd (II) were prepared from As2O5, ZnSO4.7H2O, Pb(NO3)2, and CdCl2.H2O, respectively. Solutions of various concentrations were prepared by diluting the stock solutions. Experiments conducted at pH 7.07 ± 0.02 were buffered with 0.01 M tris(hydroxymethyl) aminomethane (THAM) and adjusted to the desired pH with 6 N HNO3. Experiments conducted at pH 4.56 ± 0.02 used CH3COONa buffer and adjusted with 0.1 M CH3COOH to the desired pH. An electrolyte background of 0.01 M NaNO3 was added to all buffer solutions. Water was prepared by reverse osmosis by sand and nanofiltration, using a NANOpure Diamond Barnstead with hollow fiber filter.
The San Antonio tap water was treated groundwater from Edwards Aquifer. Before collecting the water samples from the tap, the tap was flushed for 30 min. Water quality parameters of the San Antonio tap water were measured before the adsorption experiments (results are shown in Table 1). The nano-TiO2 and anatase bulk-TiO2 were purchased from Sigma-Aldrich. The specific surface area of nano- and bulk-TiO2 was determined to be 185.5 and 9.5 m2/g using the BET method (Brunauer, 1938).
ND, not detected.
Analytical methods
Alkalinity, hardness, pH, turbidity, organic matter in terms of COD, and total Fe and phosphate were measured using HACH methods. (Alkalinity: method no. 8203, hardness: method no. 8226, COD: method no. 8000, pH: method no. 8156, total Fe: method no. 8008, and phosphate: method no. 8190). The As, Pb, Zn, and Cd were measured using PerkinElmer Inductively Coupled Plasma Mass Spectroscopy (ICP-MS), and Cl, Na, K, Ca, Mg, and silica were measured using PerkinElmer Optima 2100 DV Inductively Coupled Plasma Optical Emission Spectrometer (ICP-OES). The instruments were optimized for each parameter. For the ICP-MS, argon gas was used as plasma with a nebulizer gas flow of 0.93 L/min, RF power of 1,100 W, and the lens voltage of 6.5 V. For the ICP-OES, which uses both nitrogen and argon gas. The nebulizer gas flow rate is 0.80 L/min, pump flow rate is 1.5 mL/min, with RF power of 1,300 W. ICP-OES standards were prepared for concentrations of 0.1, 1, and 10 mg/L and ICP-MS standards were prepared for concentrations of 1, 10, and 100 μg/L. Each calibration standard was acidified with 2% HNO3 by volume. The coefficient of determination (r2) for ICP-MS and ICP-OES calibration was greater than 0.999. The relative standard deviation of triplicate measurements at both the instruments (ICP-MS and ICP-OES) was less than 5%.
Arsenate adsorption
Adsorption experiments were conducted in 50 mL batch reactors. Forty, 170, 469, 744, 1,230, and 3,100 μg/L As (V) were added to six different reactors and diluted to 50 mL using 0.01 M NaNO3 buffered with 0.01 M THAM. The pH was adjusted to 7.07 ± 0.02 using 6 N HNO3 and 1 N NaOH. 0.1 and 0.5 g/L nano-TiO2, and 0.5 and 1.0 g/L bulk-TiO2 were put into each reactors then stirred for 24 h at 24 revolutions per minute (rpm). The same experiment was repeated at pH 4.56 ± 0.02 using 0.01 M C2H4O2 (acetic acid) buffered with 0.01 M sodium acetate (C2H3NaO2). After the experiment was completed, 10 mL of sample solution was filtered using a 0.45-μm syringe filter for analysis. The sample solution was then acidified with 1% (by volume) concentrated HNO3, and analyzed on ICP-MS.
Batch experiments were conducted to determine the kinetics of adsorption using 50 mL batch reactors. 150 μg/L As (V) was prepared using 0.01 M NaNO3 buffered with 0.01 M THAM and the pH was adjusted to 7 ± 0.02 using 6 N HNO3 and 1 N NaOH. 0.1 g/L nano-TiO2 was added to the solution. The solution was continuously mixed using a rotor at 24 rpm. Approximately 10 mL aliquots were taken at 5, 20, 30, 60, 90, and 120 min of the reaction. The samples were filtered using a 0.45-μm syringe filter, acidified using 1% (by volume) HNO3 then measured for As on the ICP-MS. The same procedure was repeated for 0.5 g/L nano-TiO2, 0.5 g/L bulk-TiO2, and 1.0 g/L bulk-TiO2.
Spiking experiments using San Antonio tap water
Simultaneous adsorption of single and multiple metals (Pb, Cd, As, Zn) to 0.5 g/L nano-TiO2 was studied in San Antonio tap water. The spiked tap water from San Antonio, Texas was used to represent a contaminated water sample. The stock solution was then diluted to 262.81 ± 2.07 μg/LAs (V), 264.6 ± 2.25 μg/L Zn (II), 222.38 ± 1.91 μg/L Pb (II), and 287.83 ± 2.57 μg/L Cd (II). Two sets of experiments were conducted: first, only As (V) was spiked into the San Antonio tap water; second, multiple metals (Zn, Pb, Cd) and As were spiked into the San Antonio tap water. 0.5 g/L nano-TiO2 was used as an adsorbent. The experiment was run for up to 24 h rotating at 24 rpm. After 24 h, 10 mL aliquots were filtered using a 0.45-μm syringe filter, acidified using 1% (by volume) concentration. The residual metal and arsenic concentrations were measured on the ICP-MS. The 10 mL sample aliquots were also collected at 5, 15, 30, 60, 90, and 120 min to study the adsorption kinetics.
Result and Discussion
Arsenate adsorption
Adsorption of As (V) at various initial concentrations on 0.5 g/L nano- and bulk-TiO2 at pH 7 and 4.5 was studied (Fig. 1). The result was normalized by adsorbent mass and adsorbent surface area. The amount of As (V) adsorbed per gram of nano- and bulk-TiO2 increased simultaneously with the increase in the As (V) initial concentration. When the adsorption was normalized by mass, the nano-TiO2 adsorbed more As (V) than the bulk-TiO2 at pH 7 (Fig. 1a). The maximum adsorption was 6,088 μg/g at 3,108 μg/L initial As (V) concentration using nano-TiO2. For the same initial As (V) concentration, the adsorption capacity of bulk-TiO2 was only 3,108 μg/g. When the adsorption was normalized by the surface area, the bulk-TiO2 adsorbed more As (V) than nano-TiO2 (Fig. 1b). The respective As (V) adsorption using nano- and bulk-TiO2 at 40.5, 169.5, 468.5, 744.3, 1,231, and 3,108 μg/L initial As (V) concentrations were 0.4, 1.8, 5, 7.9, 13, 32.8 and 4.7, 21.4, 64.5, 100, 163.8, and 368 μg/m2, respectively. The bulk-TiO2 adsorbed about 11 times more As (V) than nano-TiO2 when adsorption was normalized by surface area. The same adsorption trend was reported by previous studies (Giammar et al., 2007; Engates and Shipley, 2011).

As (V) adsorption with 0.5 g/L nano-TiO2 and 0.5 g/L bulk-TiO2 normalized by
At pH 4.5, the As (V) adsorption followed the same trend of pH 7 either normalized by adsorbent mass or adsorbent surface area (Fig. 1). The amount of As (V) adsorbed at pH 4.5 was significantly greater than at pH 7 at higher initial As (V) concentration. At pH 7, the maximum As (V) adsorbed was 6,088 μg/g and 32.8 μg/m2 using nano-TiO2, and 3,509 μg/g and 367.9 μg/m2 using bulk-TiO2. At pH 4.5, the maximum As (V) adsorbed was 6,155 μg/g and 33.5 μg/m2 using nano-TiO2, and 3,871 μg/g and 407.7 μg/m2 using bulk-TiO2. The same adsorption trend was reported by previous studies (Savage and Diallo, 2005; Waychunas et al., 2005; Giammar et al., 2007; Engates and Shipley, 2011). Waychunas et al. (2005) explained the difference in adsorption after normalization due to changes in the number and type of adsorption sites caused by an inverse relationship between crystalline size and surface disorder. The nano-TiO2 seems to be more effective than bulk-TiO2 for the removal of contaminants from water due to their large surface area to mass ratio.
Adsorption isotherm
Adsorption capacities of nano- and bulk-TiO2 at two different concentrations were further studied through the isotherm experiments. The isotherms were obtained by adding As (V) concentrations ranging from 40 to 3,100 μg/L in a suspension containing 0.1 and 0.5 g/L nano-TiO2 and 0.5 and 1.0 g/L bulk-TiO2, at pH 7 and 4.5. The adsorption data were fitted with Freundlich isotherm models. An adsorption isotherm is used to correlate the variables established between the adsorbate and the adsorbent in dynamic equilibrium (Paraguay et al., 2014). Several isotherm models have been used to analyze the interaction between the adsorbate and adsorbent (Hu and Shipley, 2012). This study used Freundlich isotherm model to fit the adsorption data obtained from the experiments, which can be described using the following equation:
where, qe is the quantity of arsenic adsorbed (μg/g), Ce is the equilibrium arsenic concentration (μg/L), KF is the Freundlich isotherm constant representing the adsorption capacity, and n is the Freundlich exponent related to energy of adsorption. The term, 1/n is the adsorption intensity.
Freundlich isotherm model constants for As (V) adsorption onto 0.1 and 0.5 g/L nano-TiO2 and 0.5 and 1.0 g/L bulk-TiO2 at pH 7 and 4.5 are presented in Table 2. In general, an increased adsorption capacity of As (V) was observed at pH 4.5 using bulk-TiO2 compared to pH 7 (Table 2). It can be explained based on pHpzc. The pHpzc of nano- and bulk-TiO2 used in this study was 5.2 (Engates and Shipley, 2011). At pH < pHpzc, the TiO2 has net positive charge that adsorbs the As (V) anions to a greater extent increasing the adsorption capacity. The same trend was observed for 0.1 g/L nano-TiO2 increasing the adsorption capacity six times at pH < pHpzc than pH > pHpzc. Increasing the adsorbent concentration from 0.1 to 0.5 g/L (nano-TiO2) and 0.5–1.0 g/L (bulk-TiO2) increased the adsorption capacity at both pH 7 and 4.5 (Table 2). The increased adsorption capacity is due to the increase in available surface sites for As (V). The term 1/n represents the heterogeneity factor. A smaller 1/n represents greater expected heterogeneity. The lower 1/n value of nano-TiO2 indicates that it has more heterogeneous surfaces compared to bulk-TiO2 at both pH 7 and 4.5. The coefficient of determination (r2) value for the Freundlich isotherm model ranged from 0.92 to 0.99. It means that more than 92% of the data variability is explained by the model.
Adsorption kinetics
Kinetic parameters for As (V) adsorption by 0.1 and 0.5 g/L nano-TiO2, and 0.5 and 1.0 g/L bulk-TiO2 at 150 μg/L initial As (V) concentrations were studied and shown in Table 3. The pseudo-second order model was found to be the best fit. The pseudo-second order kinetic parameters were calculated using the following equation:
where, t is the time in minute, qt is the amount of As (V) adsorbed at time t (μg/g), q2 is the amount of As (V) adsorbed in equilibrium (μg/g), and k2 is the pseudo-second order reaction rate (g/[mg.min]). The coefficient of determination (r2) for different nano- and bulk-TiO2 are greater than 0.99 indicating that the model is capable of describing more than 99% data variability. The maximum adsorption rate (0.217 g/[mg.min]) was observed at 0.5 g/L nano-TiO2 and the minimum adsorption rate (0.0025 g/[mg.min]) was observed at 0.5 g/L bulk-TiO2. Increasing the nano-TiO2 from 0.1 to 0.5 g/L increased the adsorption rate only by 4%. Increasing the bulk-TiO2 from 0.5 to 1.0 g/L increased the adsorption rate by 52%. The adsorption rate for 0.5 g/L nano-TiO2 was around 87 times greater than that of 0.5 g/L bulk-TiO2. The k2 reported in this study in 0.5 g/L nano-TiO2 (0.217 g/[mg.min]) is close to the k2 (0.244 g/[mg.min]) reported by Li et al. (2014).
It was observed that the As (V) was adsorbed very rapidly and most of the uptake occurred within 20 min (Fig. 2). The amount of As (V) adsorbed doubled when the nano-TiO2 increased from 0.1 to 0.5 g/L within the first 5 min. After 120 min, 77% and 99% As (V) was removed using 0.1 and 0.5 g/L nano-TiO2, respectively. The bulk-TiO2 was not effective in the removal of As (V) at both sorbent concentrations. After 120 min, only 14% and 34% As (V) was removed using 0.5 and 1.0 g/L bulk-TiO2, respectively. It is important to note that the residual As (V) concentration was only 8.3 μg/L after 30 min and 3.2 μg/L after 120 min using 0.5 g/L nano-TiO2, which meets the USEPA drinking water standard (i.e., <10 μg/L).

Adsorption of 150 μg/L As (V) using 0.1 g/L and 0.5 nano-TiO2; and 0.5 and 1.0 bulk-TiO2 at pH 7.0. Error bars standard deviations of multiple replicates.
Single and multiple metal adsorption in San Antonio tap water
The water composition of San Antonio, TX, tap water is presented in Table 1. The Cd and Pb content were below the detection limit; however, zinc was present, but within the drinking water range provided by USEPA. The high Ca and Mg concentration indicates the hardness of water. The hardness of water was measured as 256 mg/L CaCO3, indicating a hard water (Mahajan et al., 2006). The pH of the water, 7.65 is similar to the pH of the other experiments in this article.
This work studied the removal efficiency of individual metals (Zn, Pb, Cd) and As at two different experimental conditions: First, As (V) spiked in San Antonio tap water and the second, multiple metals and arsenic (V) spiked in San Antonio tap water, which is presented in Fig. 3. For single metal adsorption, 264 μg/L As (V) was spiked in San Antonio tap water. The Zn content present in the tap water initially was 190 μg/L. After 24 h of adsorption, 98.5% As (V) and 98.6% Zn were removed from the tap water. For multiple metal adsorption, 262.8 μg/L As (V), 287.8 μg/L Cd, 222.4 μg/L Pb, and 264.6 μg/L Zn were spiked in the tap water. The total Zn concentration was 454.8 μg/L. After 24 h of adsorption, 98.9% As (V), 99.8% Cd, 99.9% Pb, and 98.9% Zn were removed from the tap water. The presence of coexisting metals slightly increased As (V) and Zn adsorption on TiO2 nanoparticles rather than competing for adsorption sites. Earlier studies have explained that the facilitation of As (V) adsorption in the presence of cations is due to the electrostatic attraction (Stachowicz et al., 2008; Kanematsu et al., 2012).
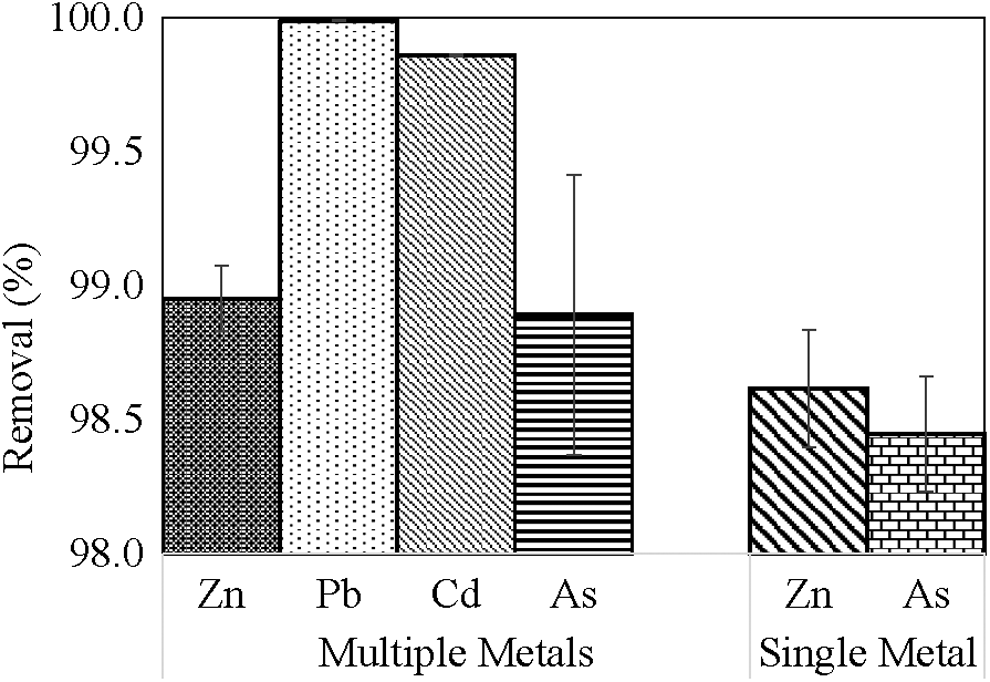
Single and multiple metal and As (V) removal in spiked in San Antonio tap water. Error bars the standard deviation of multiple replicates. The initial metal concentrations are: Zn = 454.84 ± 7.78, Pb = 222.38 ± 1.91, Cd = 287.83 ± 2.57, As = 262.81 ± 2.07.
The kinetics of multiple metal adsorption by 0.5 g/L nano-TiO2 at initial metal concentration ranging from 222 to 454 μg/L were studied. The kinetic parameters are presented in Table 4. The coefficient of determination (r2) for all the metals studied was very good, meaning all the data variability was explained by the model. The pseudo-second order kinetics was the best fit for the adsorption data. The reaction rate for As (V), Zn (II), Cd (II), and Pb (II) was 2, 5, 16.7, and 50 mg/(g.min), respectively. The metals can be arranged by the decreased rate of reaction as follows: Pb> Cd > Zn > As. One important point to be noted is that multiple metals in a real water sample, the rate of As (V) adsorption using 0.5 g/L nano-TiO2 increased from 0.217 to 2 g/(mg.min). The increase in As (V) adsorption rate in the presence of multiple metals could be explained due to the coadsorption of multiple metals on TiO2 nanoparticles. Previous studies have pointed that the coadsorption of multiple metals on TiO2 could achieve synergetic removal in industrial wastewater (Hu et al., 2015). So, further study needs to be conducted to determine if using multiple metals increases the rate of adsorption for all the metals or it is limited to certain metals only.
Adsorption of individual metals and As (V) at different time intervals is presented in Fig. 4. A significant amount of metal removal was observed within 5 min of adsorption. The As (V), Zn (II), Pb (II), and Cd (II) removal within 5 min of adsorption was 95.5%, 95.3%, 99.7%, and 98.7%, respectively. Increasing the adsorption time beyond 20 min did not result in any further removal of Cd (II) and Pb (II) and it appears that steady state was reached. Only 2% increase in the removal of As (V) and Zn (II) was observed after 20 min of adsorption time.
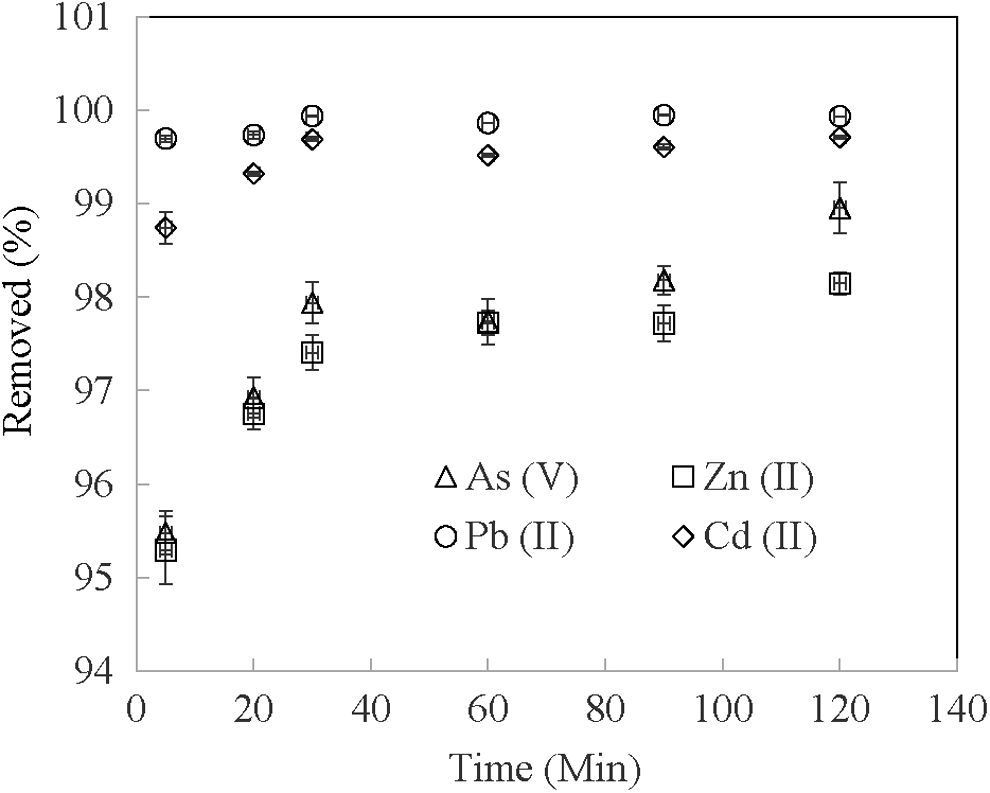
Removal of As (V) and metals simultaneously with 0.5 g/L nano-TiO2 at pH 7.65 spiked in San Antonio tap water. Error bars the standard deviation of multiple replicates.
Distribution coefficient (Kd)
Distribution coefficient is used to express the chemical binding affinity of a sorbent. Previous studies have reported that Kd value of 103 mL/g is considered a good adsorbent (Yantasee et al., 2007). Fryxell et al. (2002) have reported that the Kd value >104 are the best adsorbents. Based on the Kd values, the nano-TiO2 are the best adsorbents having Kd values >106 (Table 5). The bulk-TiO2 can also be considered good adsorbents as the Kd value is in the range of 103. This study has better Kd values for the adsorbents used compared to other sorbents under similar experimental conditions (Dutta et al., 2004; Pena et al., 2005; Yantasee et al., 2007; Gupta et al., 2013). Yantasee et al. (2007) used nano-Fe3O4 and commercial activated carbon to remove the multiple metals from filtered groundwater at pH 8.1. The Kd value (for the adsorption of As) from this study is 33 and 2,533 times greater than magnetite and commercial activated carbon, respectively. The nano-TiO2 has 10–100 times greater Kd values than other adsorbents for the removal of multiple metals (Pb and Cd). Overall, the nano-TiO2 (from this study) was a better adsorbent for the removal of multiple metals from water sample compared to other adsorbents used in previous studies (Yantasee et al., 2007).
Commercial activated carbon. NA, not available.
Summaries
Nano-TiO2 adsorbed more As (V) when normalized by mass and the bulk-TiO2 adsorbed more As (V) when normalized by surface area at both pH (4.5 and 7). Using the same initial As (V) concentration, more As (V) were adsorbed at pH 4.5 than at pH 7. The adsorption data were best fitted with Freundlich isotherm model. Pseudo-second order rate equation was used to describe the adsorption kinetics of As (V) to nano- and bulk-TiO2. The rate of adsorption for nano-TiO2 was 87 times greater than bulk-TiO2. The maximum adsorption rate (0.217 g/[mg.min]) was observed at 0.5 g/L nano-TiO2. The presence of coexisting toxic metals enhanced the As (V) adsorption on nano-TiO2. The kinetic study of multiple metals showed an increased As (V) adsorption rate indicating the coadsorption of multiple metals on nano-TiO2. The Kd values showed that nano-TiO2 were better sorbents than bulk-TiO2. Furthermore, this study achieved better Kd values compared to other studies having similar experimental conditions. This work shows the potential of using TiO2 nanoparticles for treatment of water particularly for metals and As (V).
Footnotes
Acknowledgment
The authors would like to thank the Burzik Professorship in Engineering Design for its financial support.
Author Disclosure Statement
The authors of this publication have research support from Burzik Professorship in Engineering Design. There is no competing financial interest. The terms of the arrangements have been reviewed and approved by the University of Texas at San Antonio in accordance with its policy on objectivity in research.