
Abstract
Abstract
The effect of predeposition of Fe3O4 on ultrafiltration (UF) processes has been widely studied in recent years. However, there have been no reports of effects of phosphate on the predeposition process. In this article, the fluxes of humic acid (HA) solutions filtered by Fe3O4+UF and Fe3O4+H2PO4−+UF were studied and filtered water was analyzed. Results indicate that the optimum concentration of Fe3O4 for the predeposition process was 0.45 g/L. Filtration fluxes of HA solutions using UF, Fe3O4+UF, and Fe3O4+H2PO4−+UF were 0.32, 0.52, and 0.41, respectively, after 10 min. Removal efficiencies of HA filtrated by UF, Fe3O4+UF, and Fe3O4+H2PO4−+UF were 32.6%, 41.1%, and 35.8%, respectively, according to dissolved organic matter results. After Fe3O4 adsorbed phosphate, the effect of Fe3O4 predeposition on removal of high and medium molecular weight HA was weaker. However, Fe3O4 predeposition enhanced removal of low molecular weight HA. Scanning electron microscopy and atomic force microscopy demonstrated that phosphate decreased compactness of the Fe3O4 predeposition layer. These data provide new insights into use of Fe3O4 predeposition in UF applications.
Introduction
U
In the past, ferric coagulants were frequently used in predeposition studies due to their low price and high efficiency. Ferric salts have many advantages, such as a high specific surface area, low cost, and the ability to absorb a variety of organic and inorganic substances (Kim et al., 2008). In addition, ferric salts have the advantage of easy separation and recycling (Campinas and Rosa, 2010; Yu and Graham, 2015), especially because magnetic iron adsorbents can be effectively separated by application of an external magnetic force. To our knowledge, research studies on the influence of inorganic ions in raw water on the predeposition process have not been performed in any detail. In particular, phosphate levels are high in secondary effluent from wastewater treatment plants and the effect of phosphate on predeposition has not been well studied. Some scholars believe that there is competition between phosphate and organic molecules for adsorption to iron, aluminum, and other positively charged metals because of their similar negative charge (Antelo et al., 2007; Qin et al., 2012). Studies have also confirmed the competitive adsorption between phosphate and HA for metal ions (Fu et al., 2013).
In this study, we examined the differences in Fe3O4 adsorption in the presence and absence of phosphate during the predeposition process and its effects on membrane fouling. HA removal efficiencies under these two conditions were investigated using synthetic wastewaters in the laboratory as an example. Phosphate inhibited Fe3O4 absorption under our experimental conditions. The mechanism underlying the influence of phosphate on Fe3O4 predeposition process was examined using multiple approaches. The implications of our findings are discussed.
Experimental protocols
Chemical agents and materials
Chemical reagents used in this study were humic acid (HA; Aldrich), Fe3O4, KH2PO4, KNO3, NaOH, NaNO3, and HNO3. Most of the reagents were pure (Analytical Reagents), except HA (chemical pure). Fe3O4 was purchased from Beijing Dk Nano technology Co., Ltd., and its specific physical parameters were as follows: color: black; content: 99.9%; particle morphology: spherical; density: 4.8–5.1 g/cm3.
In experiments, 1 g/L HA solution was prepared by dissolving a certain amount of HA in deionized (DI) water. Then the HA solution was filtered using a 0.45 μm pore size filter membrane and stored at 4°C as a reserve liquid. Polyvinylidene fluoride [PVDF; Ande Membrane Separation Technology & Engineering (Beijing) Co., Ltd, China] flat sheet UF membranes (100 kDa cutoff) were used and their characteristics are shown in Table 1.
UF experiments
Each membrane was soaked in DI water for at least 24 h to remove impurities. The filtration process is shown in Fig. 1. The filtration pressure provided by nitrogen gas was maintained at 0.10 Mpa. Raw water was filtered through the membrane fixed at the bottom of a stirred UF cell and the filtered water was collected in a beaker placed on an electronic balance. The weight data were recorded every minute and transferred to a computer.
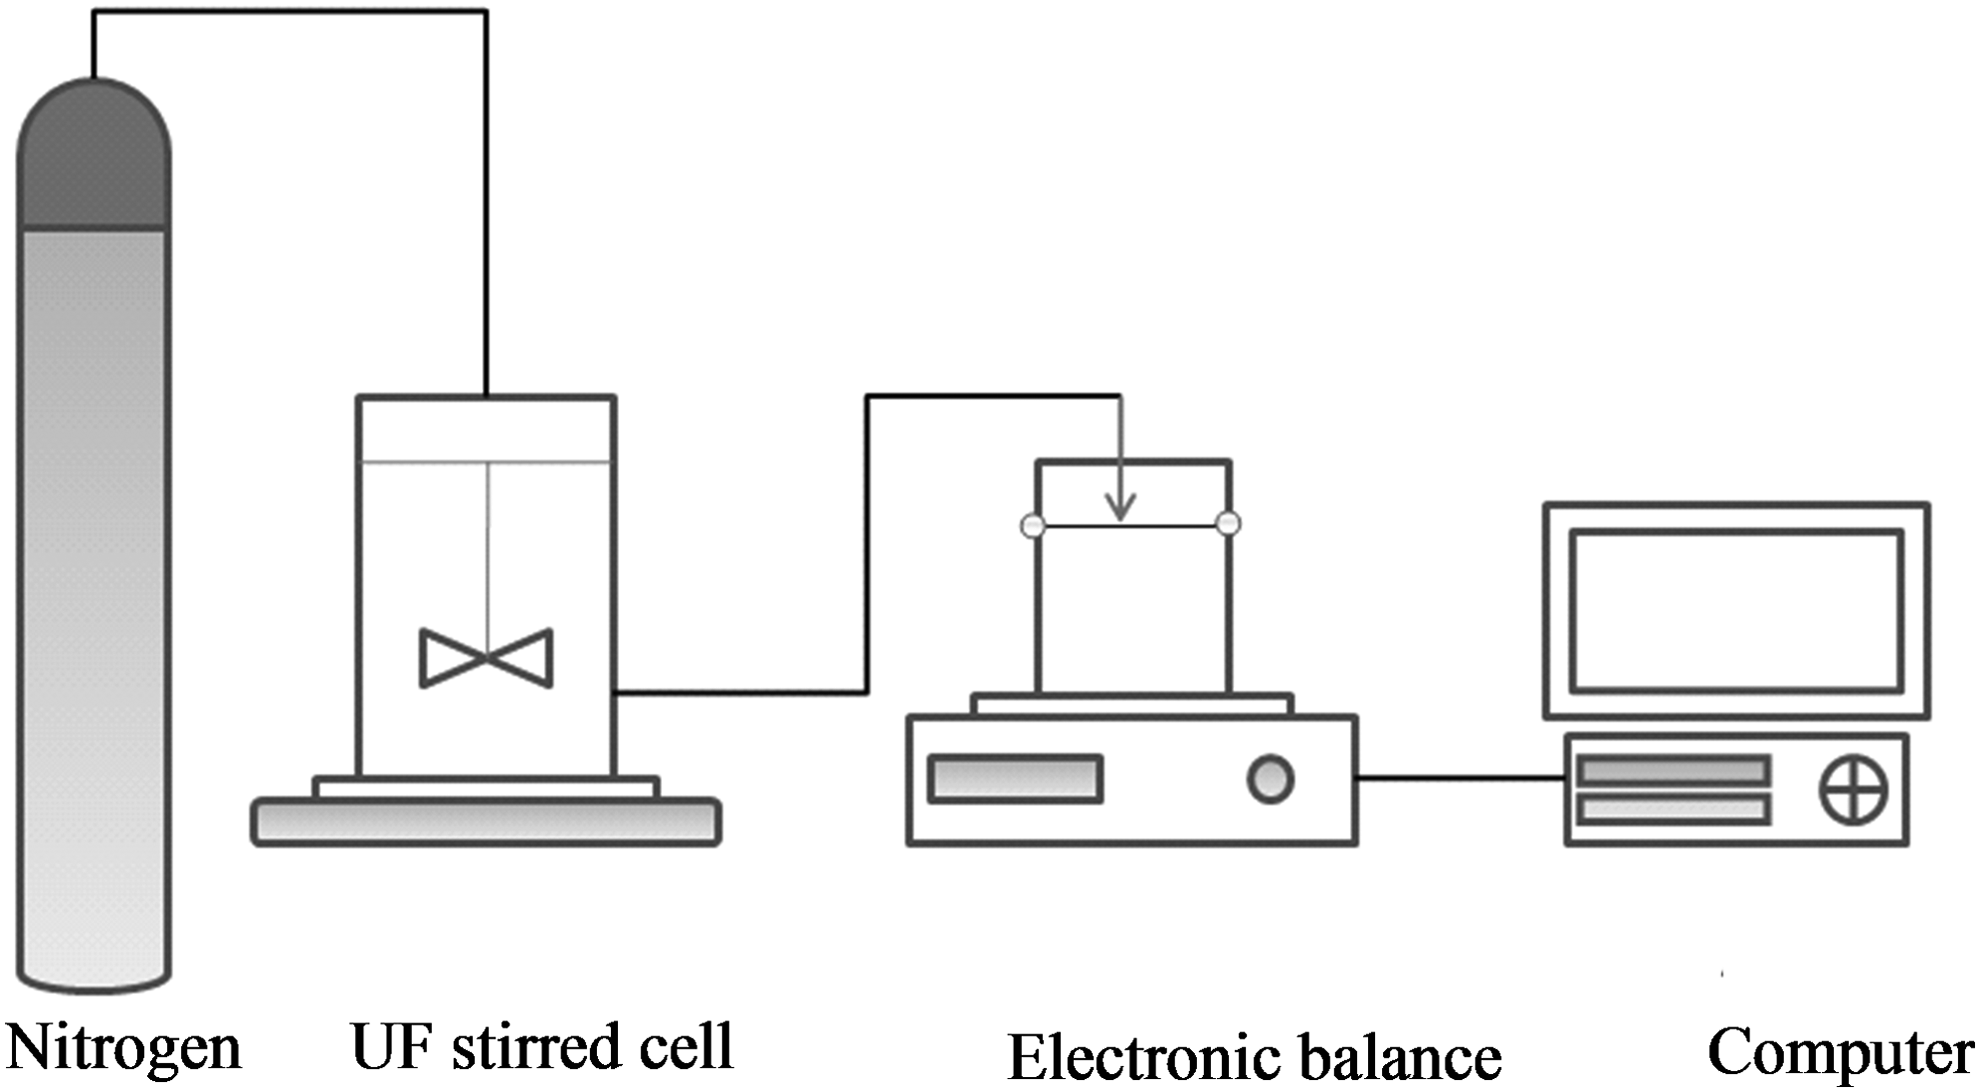
Schematic diagram of ultrafiltration test device.
Before the start of the experiment, 350 mL DI water was filtered through the membrane to test the DI water flux and the stable filtration flux was recorded as J0. In the experiment, the filtration flux of HA was recorded as J and normalized flux J/J0 as a function of time was used to reflect the change of filtration flux.
Process 1 (UF)
First, the UF membrane was soaked in DI water for 24 h, and then 350 mL pure water was filtered to measure the membrane flux J0. After that, 350 mL 20 mg/L HA solution was filtered through the membrane.
Process 2 (Fe3O4+UF)
17.5 mg Fe3O4 was weighed and put in a beaker containing 350 mL DI water. The beaker was shocked by an ultrasonic washer for 5 min, and then the pH of the solution in beaker was adjusted to 7.0. The solution was poured into the UF stirred cell and was stirred for 1 min using nonmagnetic stirrer. After that, the cell was left standing still for 10 min and then 7 mL 1 g/L HA solution was dripped into the cell. Finally, the cell was placed in a stable place for 30 min and then the solution in the cell was filtered. The other five groups in these experiments were the same as above (using 52.5, 157.5, 472.5, 1417.5, and 4252.5 mg Fe3O4).
Process 3 (Fe3O4+H2PO4−+UF)
157.5 mg Fe3O4 was weighed and poured into a beaker containing 350 mL phosphate solution (0.05 mmol/L). The pH of the solution was adjusted to 7.0 and the solution was stirred for 4 h using a nonmagnetic stirrer. The solution was then poured into a stirred UF cell and stirred for 1 min using a nonmagnetic stirrer. The cell was then stably placed still for 10 min and 7 mL 1 g/L HA solution was dripped into the cell. Finally, the cell was placed in a stable place for 30 min and the solution in the cell was filtered. All filtration experiments were repeated thrice and the mean values were calculated.
Analytical methods
A pH meter (PB-10; Sartorius, Germany) was used to monitor pH throughout the experiment. A stirred UF cell (8400; Millipore Co.) was used in the UF experiments. Variations in UF membrane flux as a function of time were recorded by a data logger (ME2002E; Mettler Toledo, Switzerland and USA). Samples were stirred using a ZR4-6 coagulation test mixer (Zhongrun Water industry Technology Development Co., China). The molecular weight distribution of HA was determined by gelpermeation chromatography (GPC; Agilent Technologies; Detector:UV254; Column: TSK; Temperature: 25°C). The samples were dispersed using an ultrasonic cleaner (YKTD-240W; YDTD, China). Zeta potential was measured using a zeta electric potential analyzer (Zetasizer NanoZS90, England). The microstructure of Fe3O4 was measured by a specific surface analyzer (BELSORP-mini II; NIKKISO GROUP, Japan). The particle size distribution was measured using a laser particle size analyzer (MS2000 Hydro 2000 MU, Malvern, England). The dissolved organic content of water samples was measured using a total organic carbon analyzer (TOC-VCPH; Shimadzu Co., Japan). The predeposited membranes were scanned using a scanning electron microscope (SEM) (S-3000N; Hitachi High-Technologies Co., Japan) and a high-resolution atomic force microscope (AFM) (Multimode-8; Bruker Co.).
Results and discussion
Flux decline caused by a critical dose of adsorbents
Figure 2 revealed the effect of Fe3O4 levels on the flux of HA solution filtered by Fe3O4+UF. When the Fe3O4 concentration was 0.05, 0.15, 0.45, 1.35, and 4.05 g/L, the filtration flux of HA solution was 2.9%, 5.4%, 20.1%, 16.3%, and 0.5% higher, respectively, after 10 min compared with that filtered by UF. Thus, there was an optimum concentration (0.45 g/L) for Fe3O4 predeposition, which alleviated membrane fouling and enhanced the filtration flux.

Normalized flux declines when filtering raw water with predeposited Fe3O4 at different concentrations.
Filtration fluxes of HA solution under different conditions (UF, Fe3O4+UF, and Fe3O4+H2PO4−+UF) were investigated according to the analysis shown in Fig. 2. The results are shown in Fig. 3.

Normalized flux decline when filtering raw water by different processes.
This shows that the filtration fluxes of HA solution were Fe3O4+UF>Fe3O4+H2PO4−+UF>UF. The filtration fluxes of HA solution filtrated by UF, Fe3O4+UF, and Fe3O4+H2PO4−+UF were 0.32, 0.52, and 0.41, respectively, after 10 min. The filtration of HA by UF decreased by 68.3% after 10 min, which demonstrated that the HA solution had seriously contaminated the filtration membrane. The filtration flux of HA by Fe3O4+UF was 20.1% higher than that filtered by UF after 10 min. This demonstrated that the predeposition process effectively improved the filtration flux and alleviated membrane fouling. The effect of Fe3O4 predeposition on HA filtration was consistent with previous studies (Schippers et al., 2001; Harman et al., 2010; Malczewska et al., 2015). After Fe3O4 adsorption of phosphate for 4 h (0.71 mg/g), the filtration flux of the HA solution by Fe3O4+H2PO4−+UF was higher than that filtered by UF, but it was lower than that filtered by Fe3O4+UF. After 10 min, the filtration flux of HA solution by Fe3O4+H2PO4−+UF was 10.8% lower than that filtered by Fe3O4+UF. It was speculated that phosphate occupied adsorption sites on the surface of Fe3O4 particles and the adsorption capacity of Fe3O4 on HA molecules was therefore weakened. In conclusion, the Fe3O4 predeposition process alleviated membrane fouling and its effect was weakened after adsorption of phosphate.
Particle size analysis
The microstructure of Fe3O4 was then measured with the following results: mean particle size: 201.32 nm; specific surface area: 10.71 m2/g; total pore volume: 0.02 mL/g; and mean pore size: 8.37 nm. The particle size distribution of Fe3O4 is presented in Fig. 4.
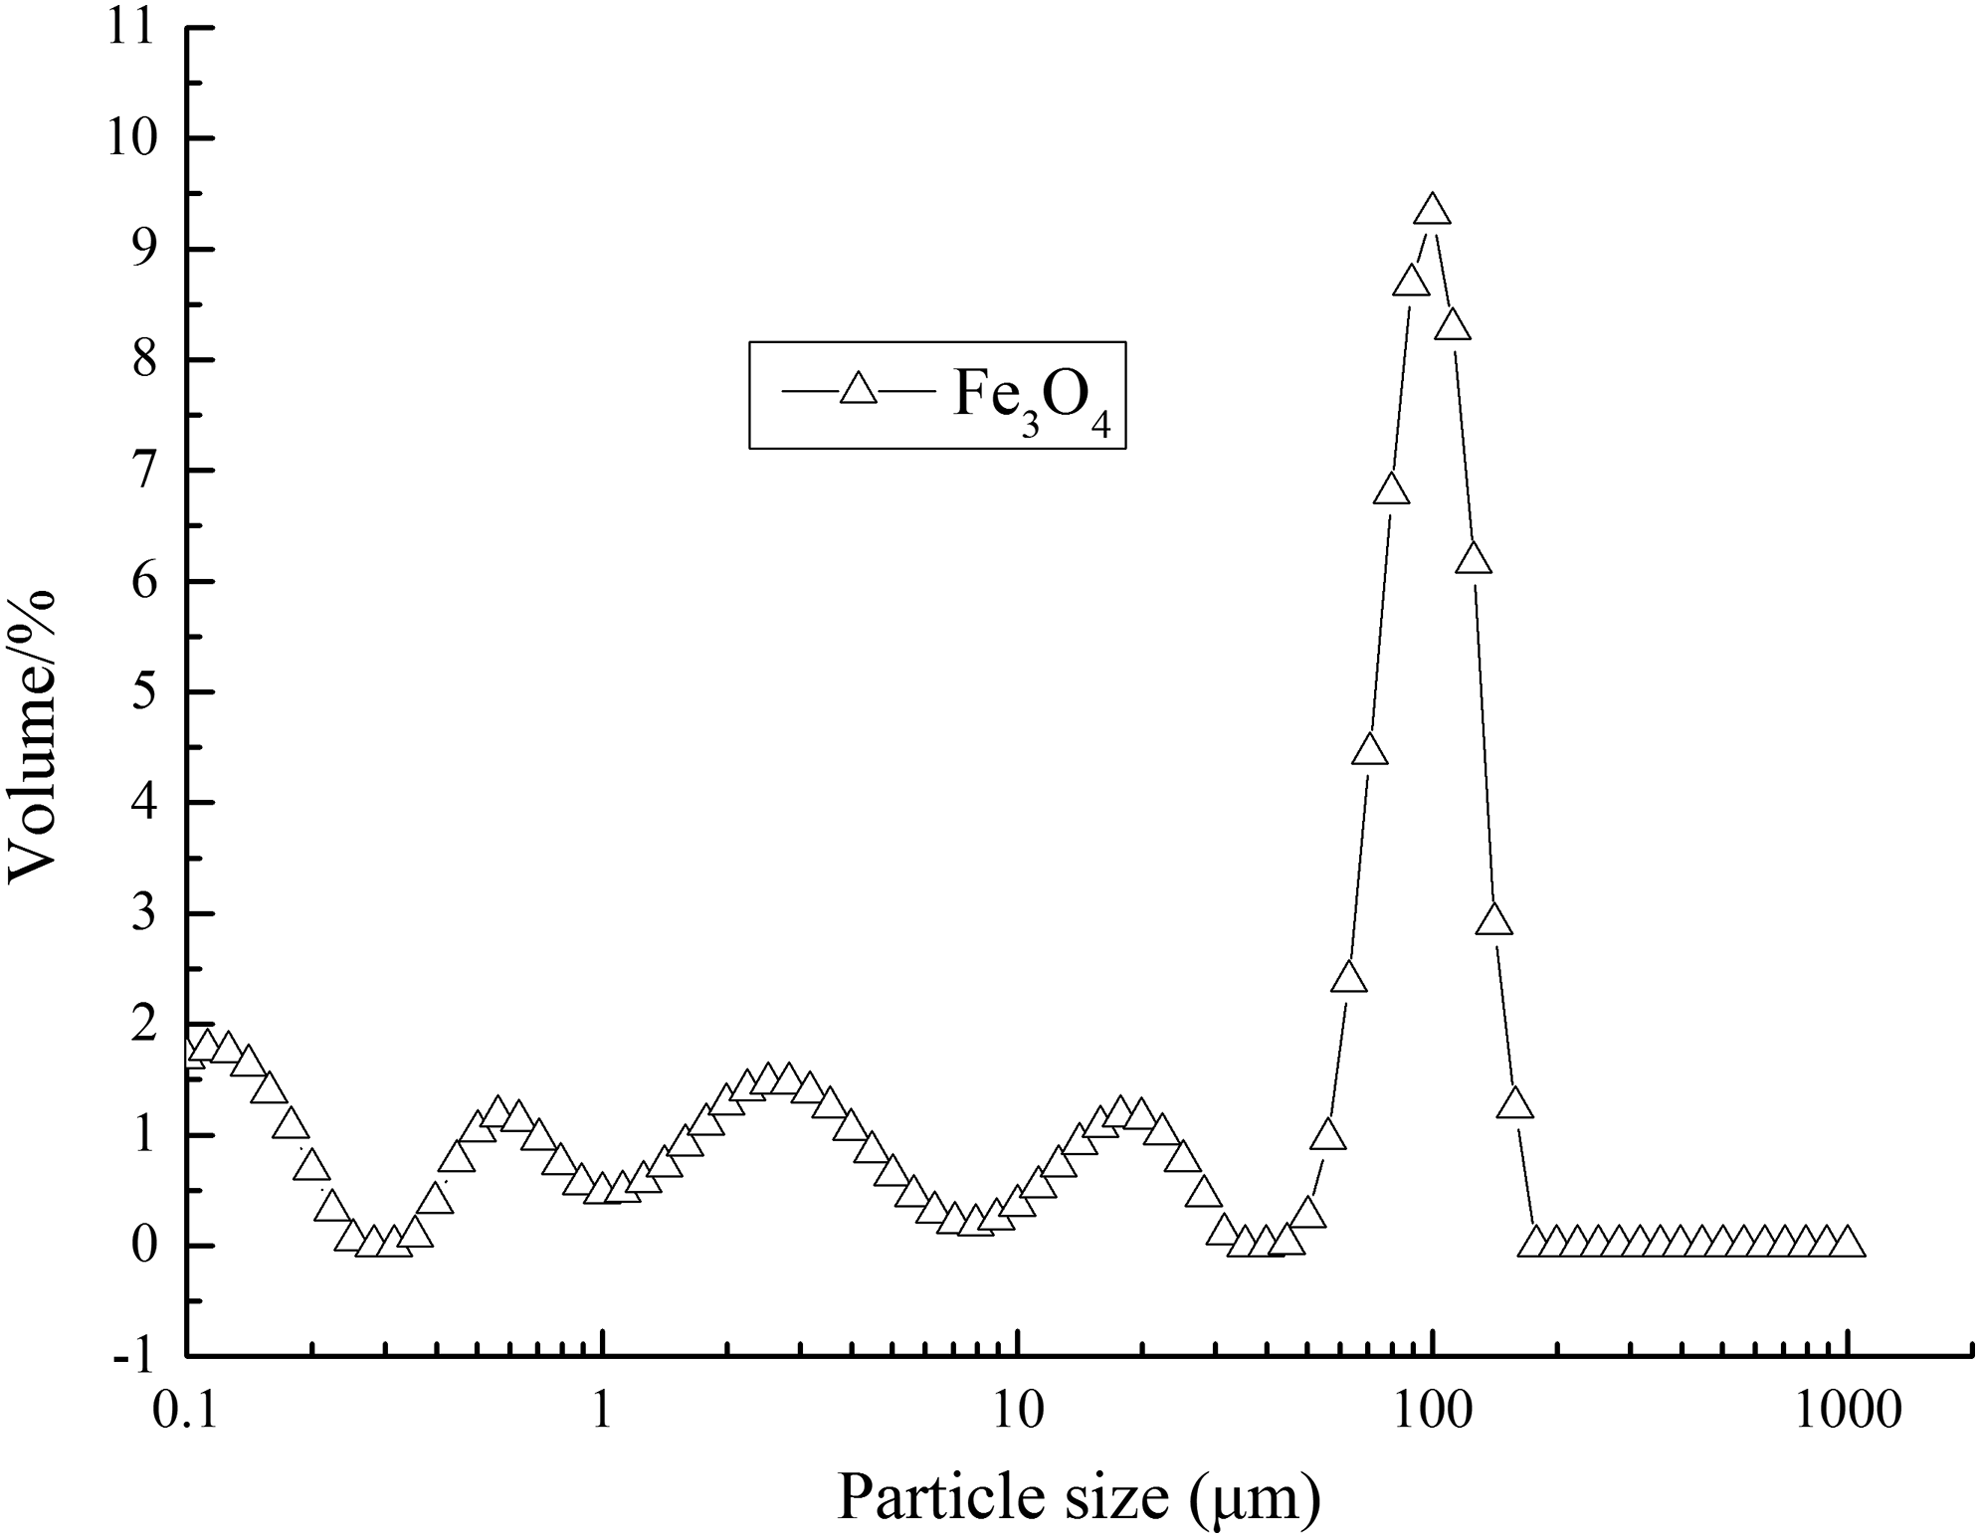
Fe3O4 particle size distribution.
The mean Fe3O4 particle size was 201.32 nm, which was small enough to make the deposition layer dense and was favorable for the interception of HA molecules. However the Fe3O4 particle size distribution was not consistent with this. There were five peaks at 0.112, 0.562, 2.818, 17.783, and 100 μm, respectively. The average diameter of Fe3O4 particles was 56.17 μm. It was inferred that Fe3O4 particles must have joined with one another, which made the measured particle size larger than the actual size. The specific surface area of Fe3O4 and its total pore volume were not large, which indicated that the adsorption ability of Fe3O4 was not strong. The mean pore size of Fe3O4 was 8.37 nm, which is large enough to retain HA molecules. The efficiency of the predeposition process on HA removal depended on its adsorption function and interception function.
Effect of different processes on removal of organic compounds
Analysis of dissolved organic carbon in the water treated by different processes was carried out to identify the influence of phosphate on the filtration of HA as it relates to the predeposition process. The results are shown in Table 2.
Fe3O4 dosage = 0.45 g/L, H2PO4− = 1.55 mg/L, HA = 20 mg/L, pH = 7.0.
DOC, dissolved organic matter; HA, humic acid; UF, ultrafiltration.
Removal efficiencies of HA filtered by UF, Fe3O4+UF, and Fe3O4+H2PO4−+UF were 32.6%, 41.1%, and 35.8%, respectively. The predeposition process of Fe3O4 effectively improved HA removal efficiency and alleviated membrane fouling. Phosphate weakened the effect of Fe3O4 predeposition on the efficiency of HA removal.
To further analyze the effect of the predeposition process on the removal of HA with different molecular weights, water treated by different processes was analyzed by gel chromatography. The results are displayed in Fig. 5.

Molecular weight distribution of raw water before and after treatment by different filtration processes.
The molecular weight distribution of HA changed after treatment with different processes. The peak value of HA in raw water was 10,671 Da and was reduced to 10,433 Da after UF, which indicated UF efficiently removed high molecular weight HA. The peak value of HA after Fe3O4+UF was 9,432 Da and it was lower than that after UF. This demonstrates that there is a synergistic effect between UF and Fe3O4 predeposition that increased the removal efficiency of medium to high molecular weight HA. The peak value of HA after Fe3O4+H2PO4−+UF increased to 10,201 Da and it was much higher than that after Fe3O4+UF, which inferred that phosphate weakened the effect of Fe3O4 predeposition on medium to high molecular weight HA.
Table 3 shows the effect of different treatment processes on the removal efficiencies of HA with different molecular weights. Changes were calculated by the integration of different response time periods.
Removal efficiencies of high, medium, and low molecular weight HA filtered by Fe3O4+UF were 25.3%, 29.1%, and 17.3% higher, respectively, than after filtration with UF alone. This shows that predeposition of Fe3O4 effectively enhanced the effect of UF and increased the HA removal efficiency, especially for medium and high molecular weight HA. The removal efficiencies of high and medium molecular weight HA filtered by Fe3O4+H2PO4−+UF were 9.0% and 9.0% lower than those filtered by Fe3O4+UF. However, the efficiency of removal of low molecular weight HA by Fe3O4+UF+H2PO4− increased by 3.6%. This suggests that phosphate weakens the adsorption of high and medium molecular weight HA on the Fe3O4 predeposition layer, while the adsorption of low molecular weight HA by the Fe3O4 predeposition layer was not affected.
Mechanism of membrane fouling reduction by predeposition of Fe3O4
Zeta potential
Zeta potentials of Fe3O4 in the presence and absence of phosphate at pH = 3–9 were measured. The result is presented in Fig. 6. The Zeta potential of Fe3O4 with phosphate was lower than in the absence of phosphate. The difference in the Zeta potentials of Fe3O4 increased at pH = 3–7 and then decreased at pH = 7–9. Under acidic conditions, the surface of Fe3O4 was positively charged and it attracted phosphate. The positive charges on the surface of Fe3O4 increased along with the degree of acidity. Therefore, the attractive electric force between Fe3O4 and phosphate increased with decreasing pH and more phosphate was adsorbed on the surface of Fe3O4. However, the increase in the level of adsorbed phosphate was far less than the increase of positive charges with increasing acidity, which contributed to a smaller change in Zeta potential. In contrast, under more alkaline conditions, the surface of Fe3O4 was negatively charged and it no longer bound to phosphate. This is because the negative charges on the surface of Fe3O4 increased along with alkalinity. Consequently, the repulsive electric force between Fe3O4 and phosphate increased and less phosphate was adsorbed on the surface of Fe3O4. As a result, the Zeta potential change was reduced as alkalinity increased.
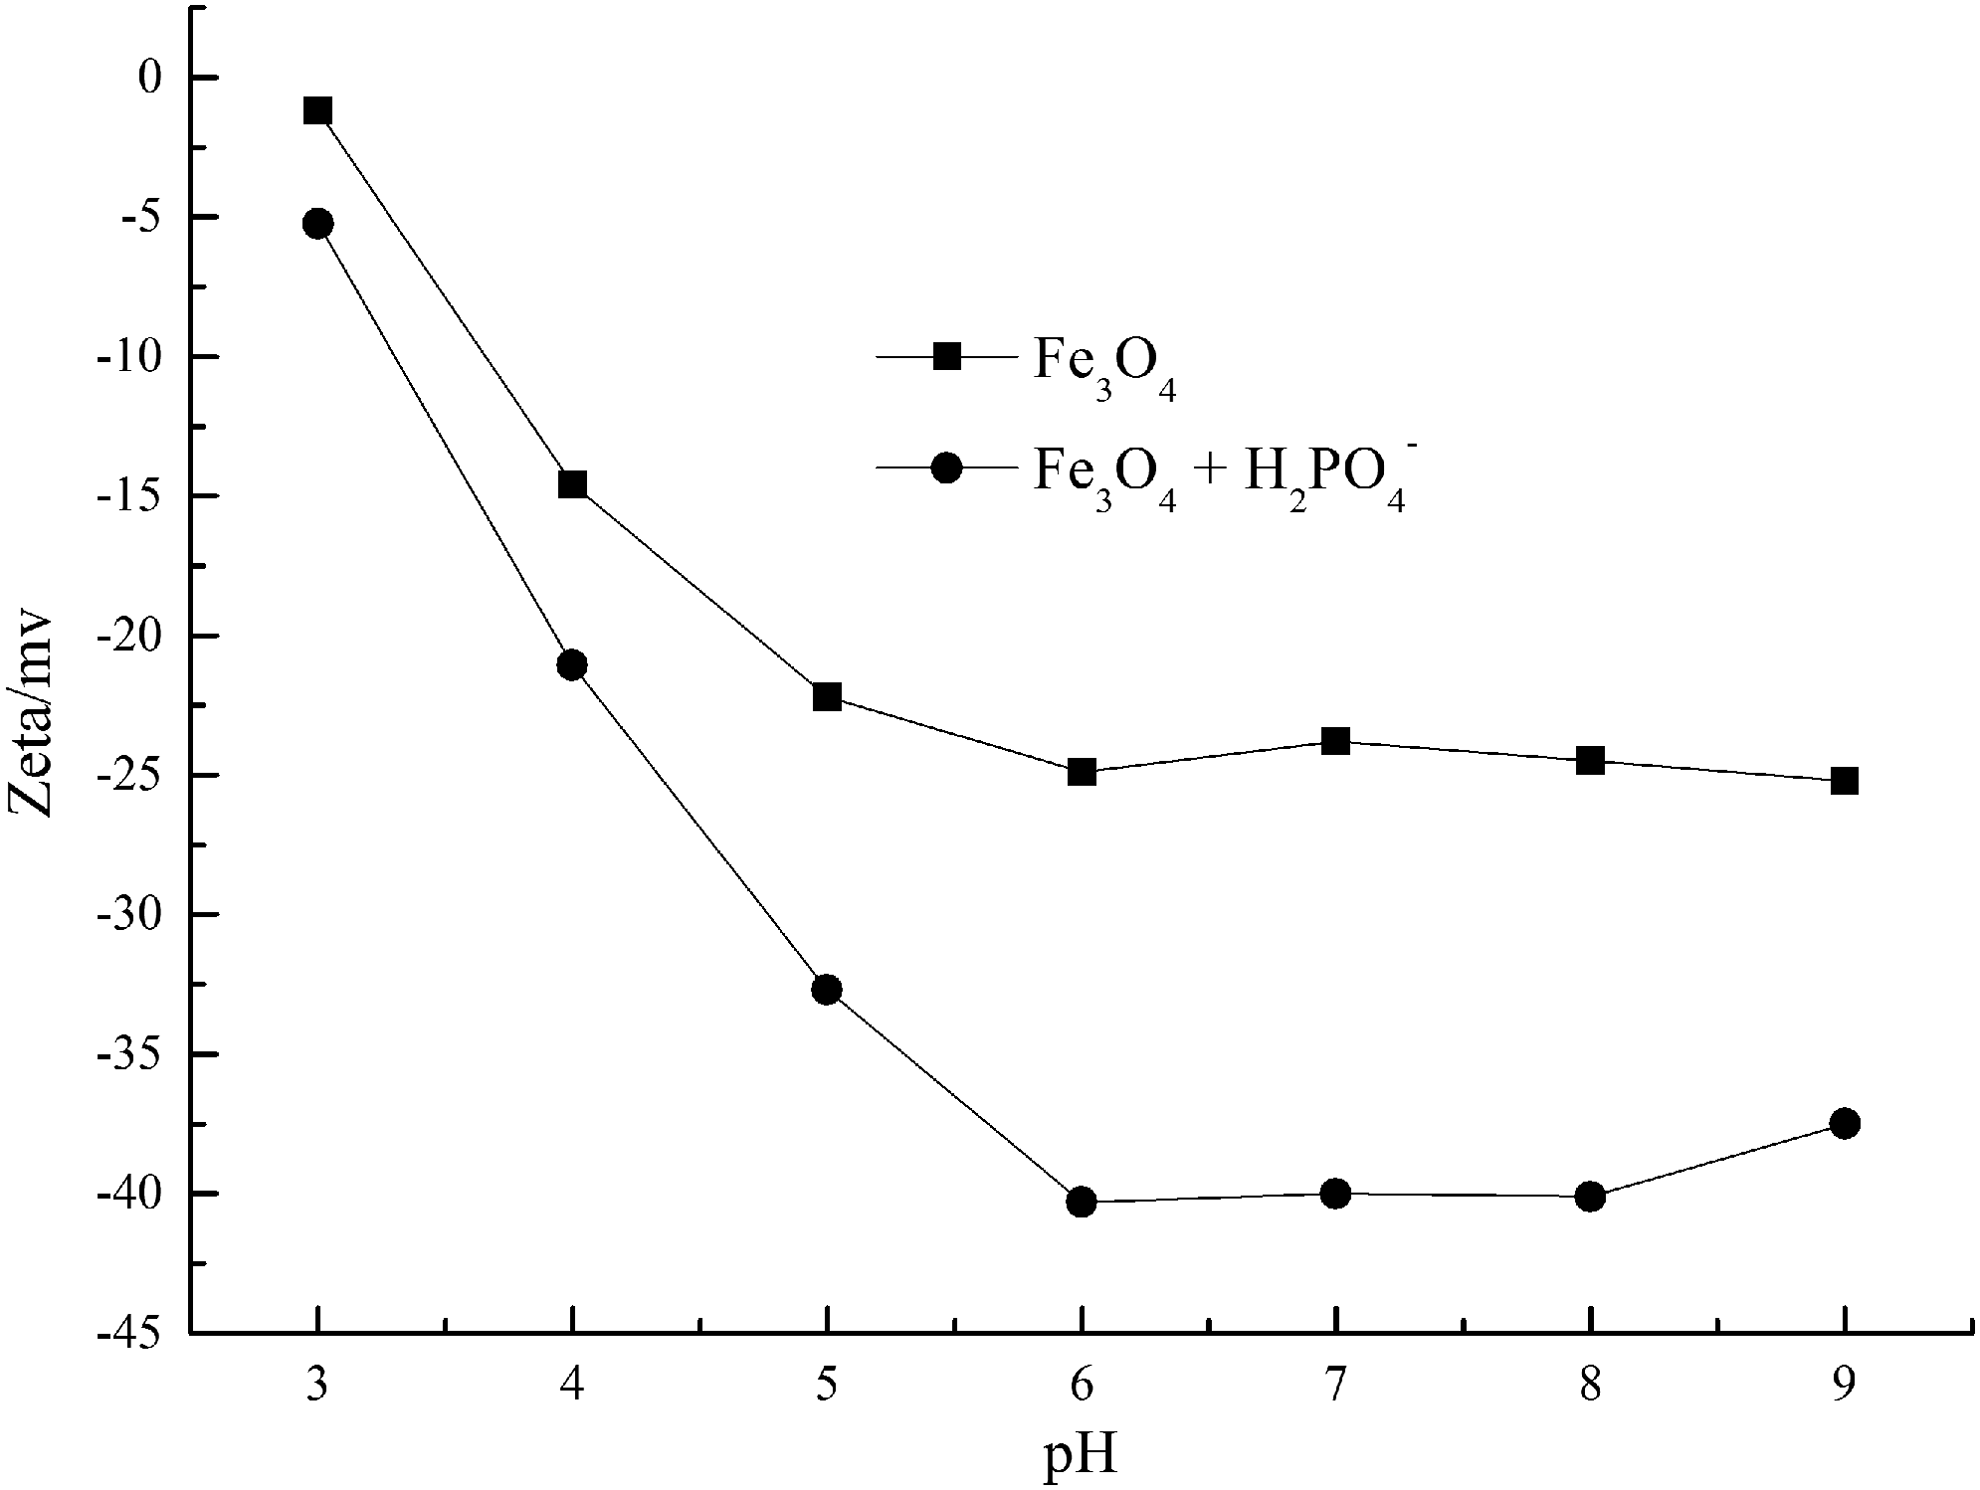
Zeta potentials of Fe3O4 with/without phosphate.
SEM images of membranes
To observe the variation of morphology of Fe3O4 deposition layer preadsorption and postadsorption of phosphate, the surfaces of UF membranes after different treatment processes were tested by SEM. The results are shown in Fig. 7.
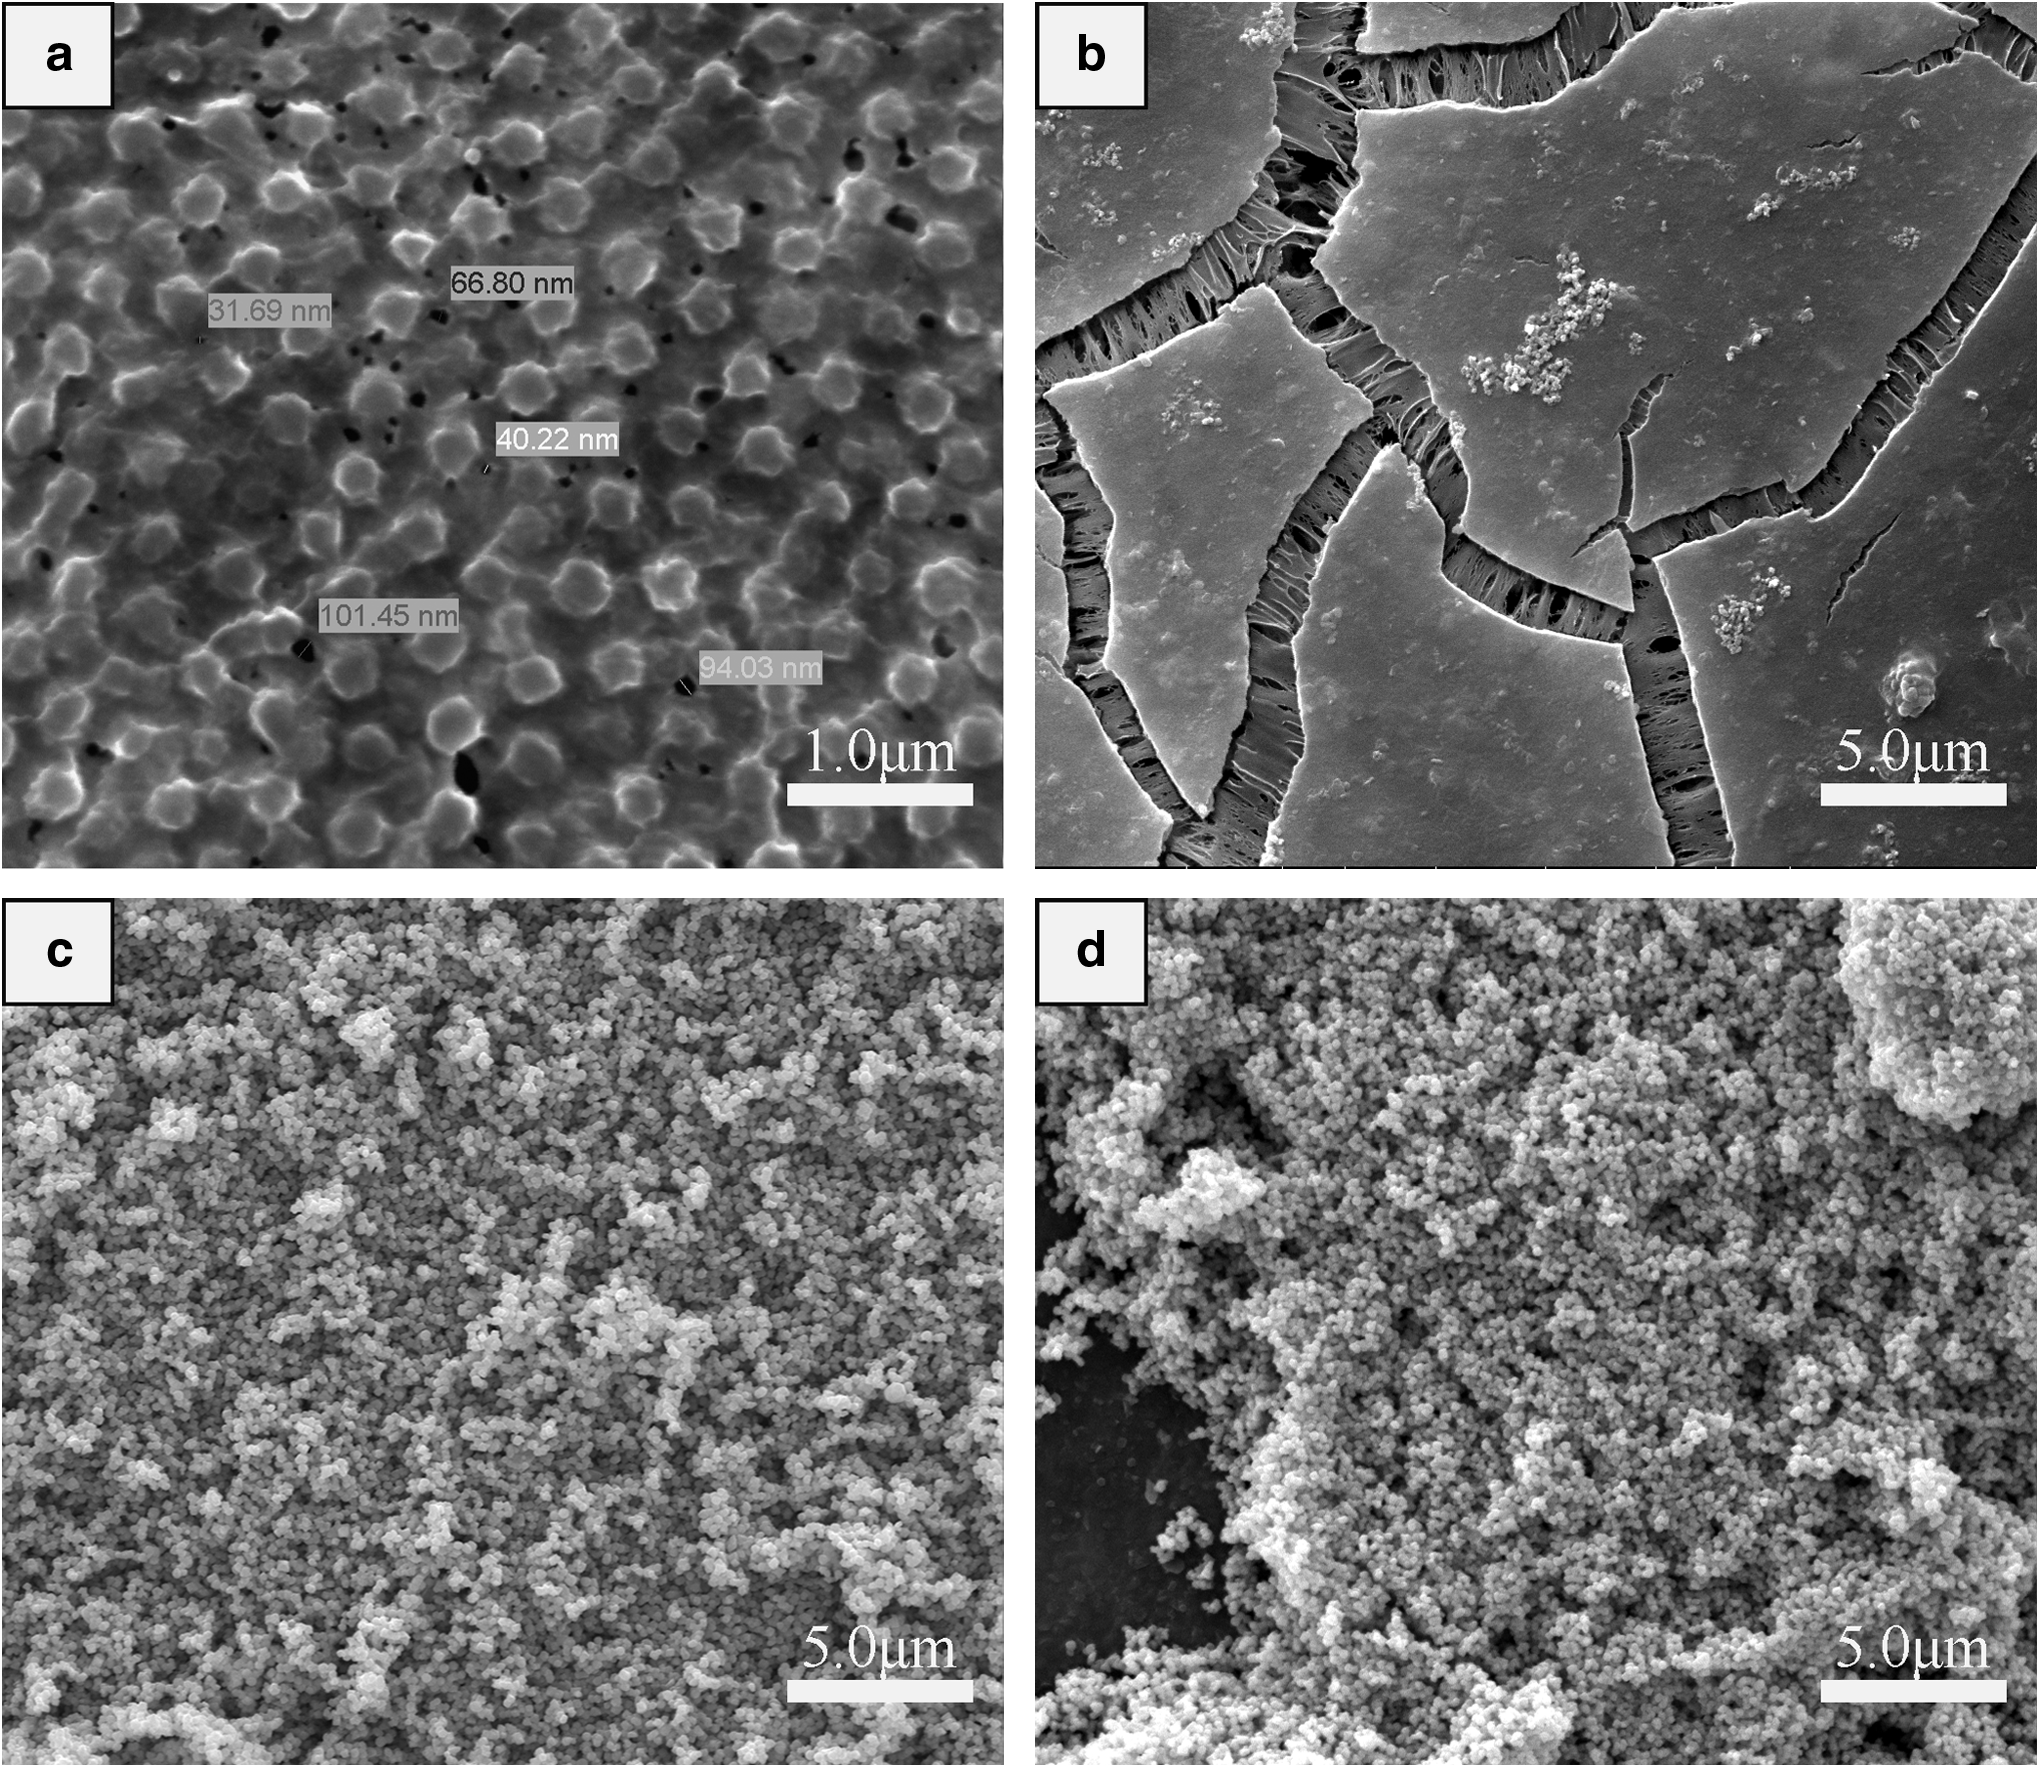
Scanning electron microscope characterization of membrane by different processes:
It can be seen clearly from Fig. 7(a) that the pore size distribution of the UF membrane was mainly in the 30–100 nm range, which is much smaller compared with Fe3O4. Accordingly, the UF membrane could support Fe3O4 particles without Fe3O4 particles traversing through the membrane. As shown in Fig. 7b, there was a layer that was formed by HA caked on the surface of the UF membrane. This was the main reason that led to the decreased flux of HA during UF. As revealed in Fig. 7c, Fe3O4 particles exhibited a complete crystal structure and were arranged in an ordered manner, which made the Fe3O4 predeposition layer more compact and smooth. In addition, the small diameter made the gap between the particles small, which created a high probability for HA molecules to collide with Fe3O4 particles. Therefore, Fe3O4 particles adsorbed HA molecules easily and the filtration flux was improved as a result. Figure 7d indicates that Fe3O4 particles, which adsorbed phosphate, still have a complete crystal structure. The particles were arranged closely like a cake. Also, there were defects in the integrity of the predeposition layer formed by Fe3O4+H2PO4−+UF. Furthermore, the compactness of the Fe3O4 particles decreased. The above results show how a portion of the HA molecules was able to penetrate through the membrane, and hence, the effect of Fe3O4 predeposition decreased in the presence of phosphate
AFM images of membranes
To further study their composition, the UF membrane under different treatment conditions were examined by AFM to study the influence of the Fe3O4 predeposition process on membrane fouling. The results are presented in Fig. 8 and Table 4.
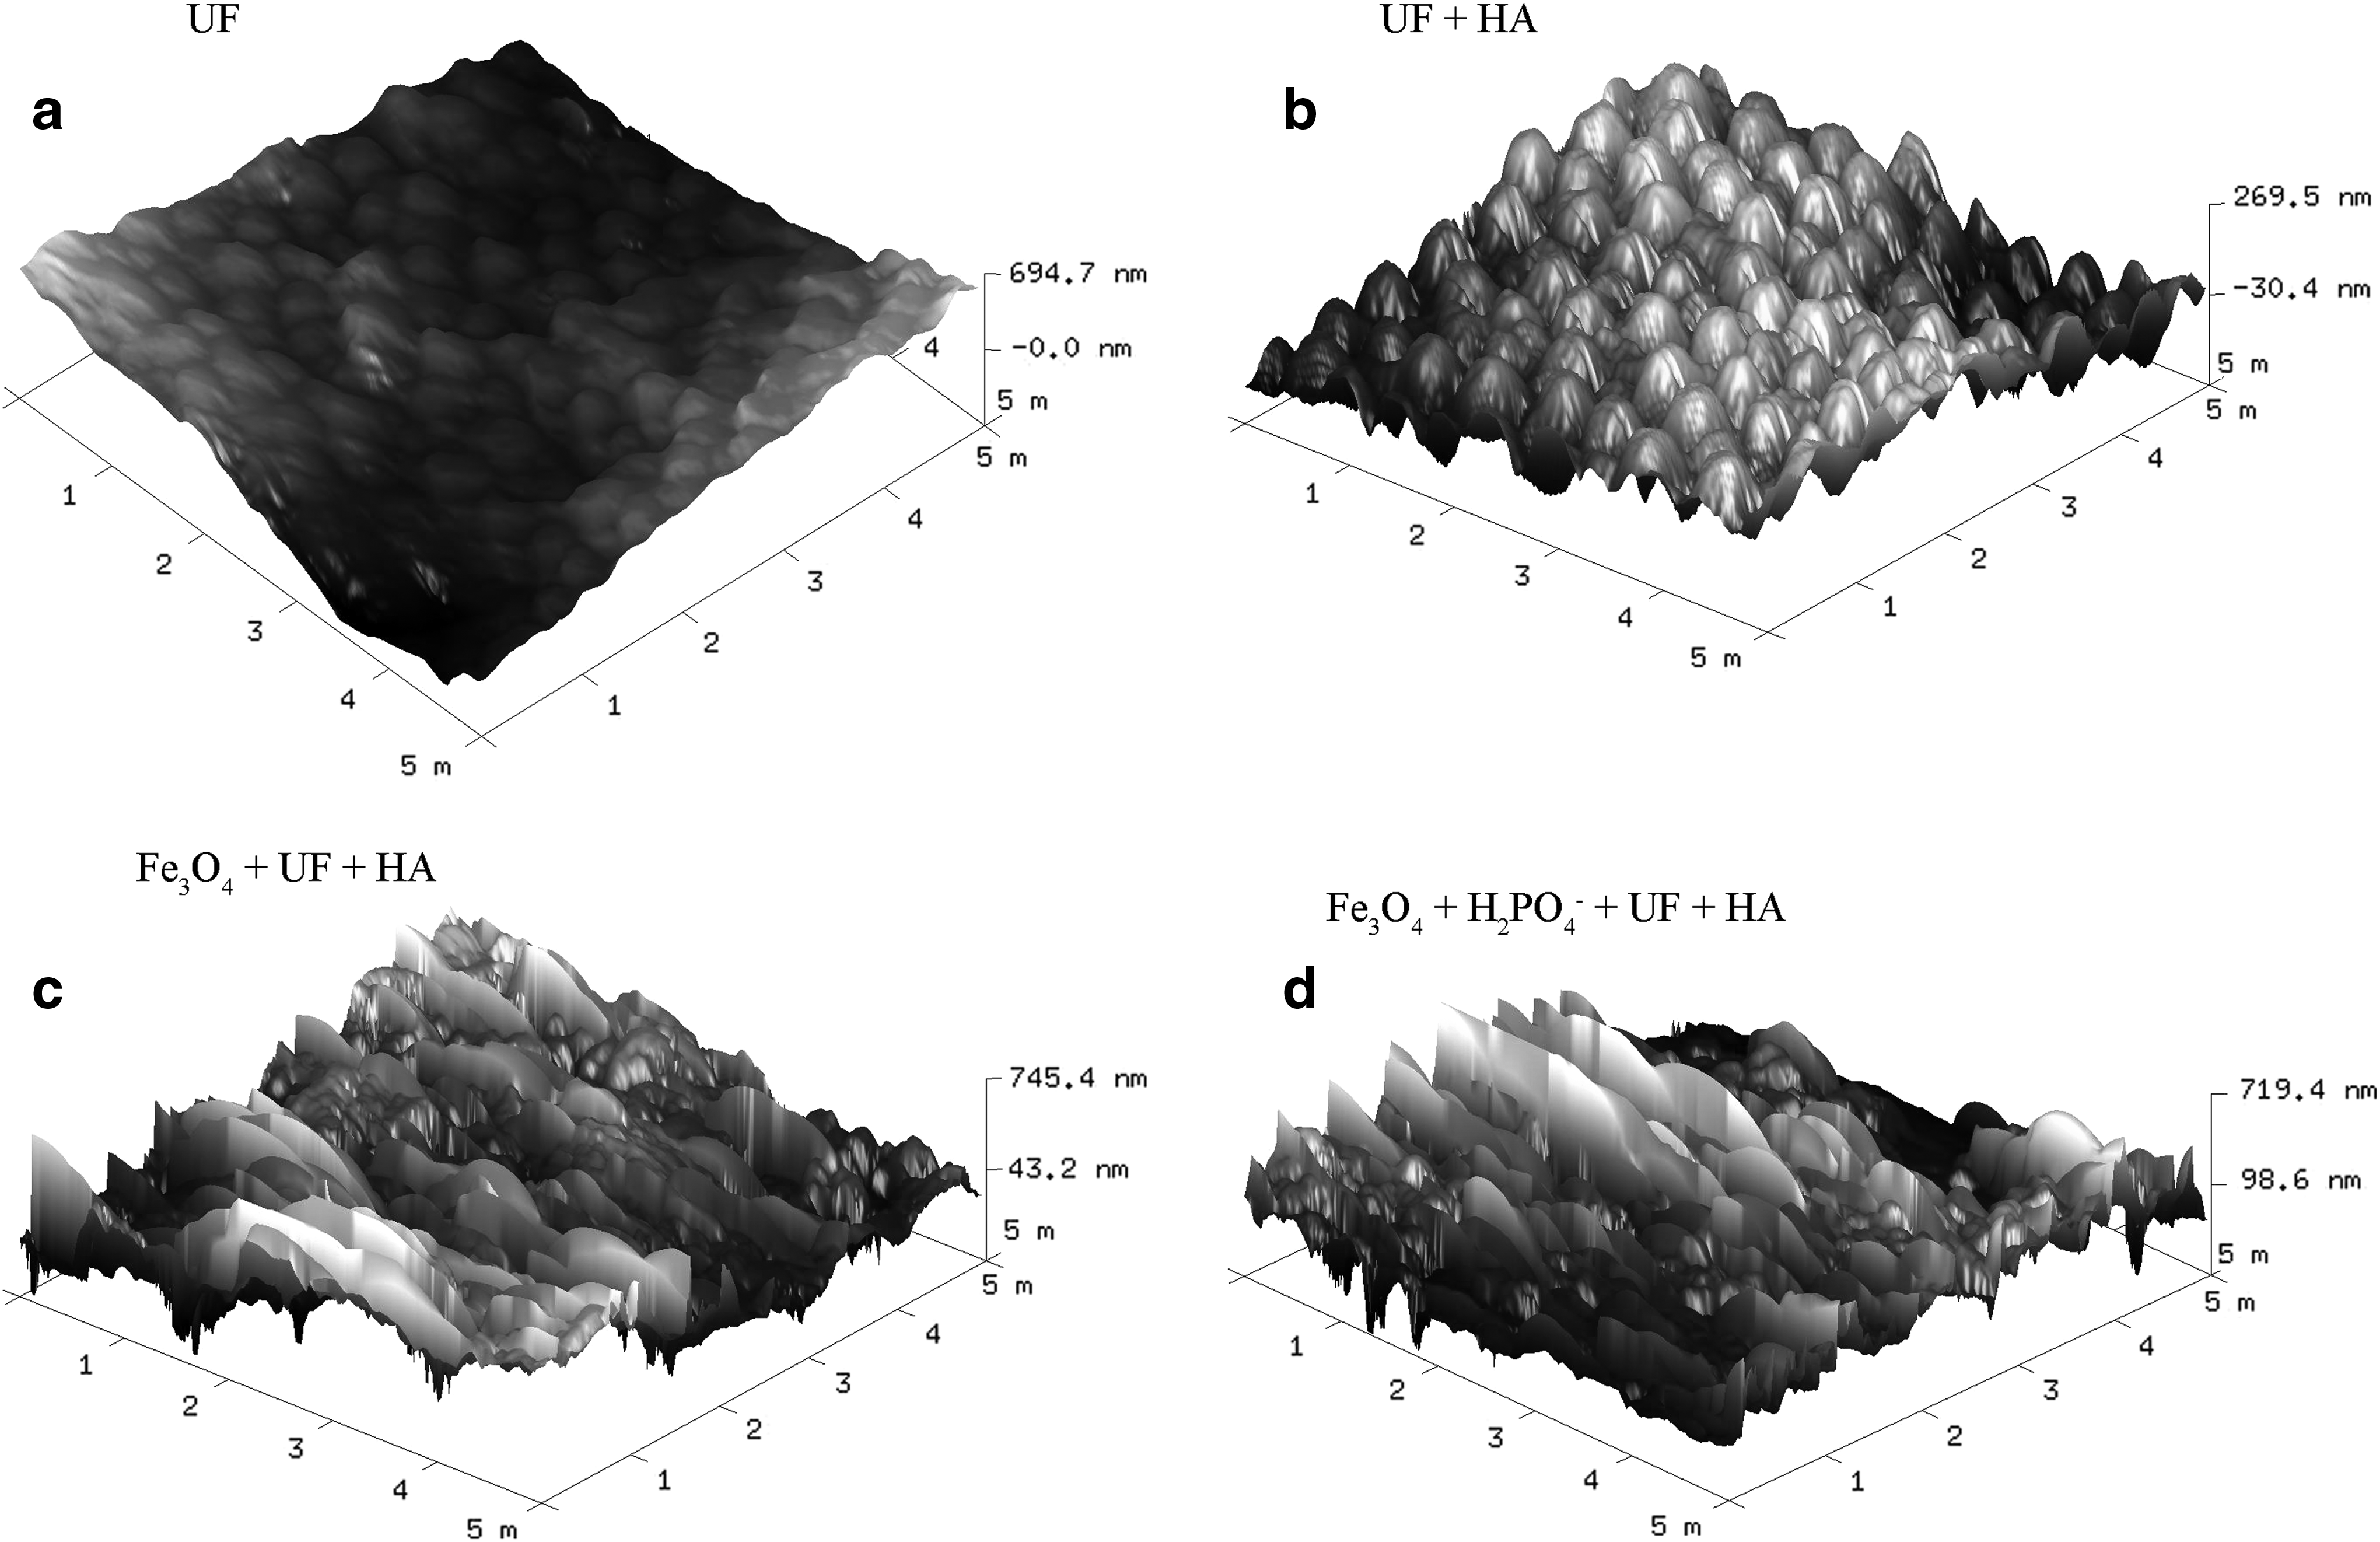
Three-dimensional shapes of membrane after different processes:
The three parameters (Ra, Rq, and Z) reflect the roughness of the surface of membranes tested by high-resolution atomic force microscope in different ways. Ra: Average roughness, the arithmetic mean value of the absolute value of the height of each point of the membranes relative to the zero plane. Rq: Root mean square roughness, the root mean square of the height of each point of membranes relative to the zero plane. Z: the maximum height of the profile, which is between the diaphragm surface peak and valley line distance.Fe3O4 dosage = 0.45 g/L, H2PO4− = 1.55 mg/L, HA = 20 mg/L, pH = 7.0
The results show that the predeposition process increased the roughness of the UF membrane surface, consistent with previous research (Diallo et al., 2005; Xiarchos and Doulia, 2006). It was speculated the predeposition layer could work by intercepting HA molecules; so the number of HA molecules that reached the membrane surface was reduced greatly. In addition, it also cut off the adsorption function between organic matter and the membrane surface (Ma et al., 2017). Hence, membrane fouling was alleviated and the filtration flux increased. The interception effect was mainly dependent on the adsorption ability and compactness of the Fe3O4 predeposition layer.
As observed in Table 4, the roughness of membrane surface of Fe3O4+UF increased significantly after filtering HA compared with the roughness of direct UF. The values of Ra, Rq, and Z increased by 26.2%, 27.2%, and 136%, respectively. The roughness of the membrane surface of Fe3O4+H2PO4−+UF was largest. The values of Ra, Rq, and Z of it were 12.0%, 4.4%, and 0.2% higher than those of Fe3O4+UF, which inferred that phosphate caused the increased roughness. The increased roughness appeared as the decreased compactness of the Fe3O4 predeposition layer. Consequently, the ability of predeposited Fe3O4 to intercept HA molecules decreased.
Conclusions
Fe3O4 predeposition effectively alleviated membrane fouling and increased filtration flux of raw water by UF. However, after adsorption of phosphate, the effect of Fe3O4 predeposition on membrane flux and HA removal was reduced. There was an optimum concentration for the Fe3O4 predeposition process. The filtration flux of HA and HA removal efficiency were both highest under optimum concentration. The removal efficiency of Fe3O4 predeposition on HA with medium and high molecular weight increased after phosphate adsorption, but the removal efficiency of low molecular weight HA changed very little. The adsorption and interception functions of Fe3O4 predeposition weakened after adsorption of phosphate. As a result, the study of the effect of phosphate on the Fe3O4 predeposition process would be helpful in the application of an effective method for alleviating membrane fouling.
Footnotes
Acknowledgments
This work was supported by the Funds for the National Natural Science Foundation of China (Grant Nos. 51678027 and 51678026).
Author Disclosure Statement
No competing financial interests exist.