
Abstract
Abstract
In this study, amino-functionalized magnetic graphene oxide (Fe3O4/GO-NH2) nanocomposites were fabricated by one-pot solvothermal method. As-prepared Fe3O4/GO-NH2 nanocomposites were characterized by transmission electron microscopy (TEM), X-ray diffraction (XRD), Fourier transform infrared spectroscopy (FT-IR), X-ray photoelectron spectroscopy (XPS), nitrogen adsorption/desorption isotherm, elemental analysis, and vibrating sample magnetometer (VSM). Adsorption behaviors of Fe3O4/GO-NH2 nanocomposites for Ag(I) in aqueous solution were investigated. Detailed adsorption studies demonstrate that Ag(I) was reduced to silver in the process of the adsorption by Fe3O4/GO-NH2 nanocomposites. The pH value of aqueous solution had a major impact on Ag(I) adsorption. The maximum adsorption capacity of Fe3O4/GO-NH2 nanocomposites for Ag(I) was 114.90 mg/g. The adsorption process of Fe3O4/GO-NH2 nanocomposites for Ag(I) was well described by the pseudo-second-order kinetics model and the Langmuir isotherm model.
Introduction
H
Adsorbent plays a main role in the process of adsorption, which is the key to decide whether the adsorption technique can be applied successfully. Graphene oxide (GO) is a kind of two-dimensional carbon nanomaterial that contains various oxygen-containing functional groups, including hydroxyl, carboxyl, and epoxy groups. Considering the oxygen-containing functional groups and the high specific surface areas of GO, GO-based materials have been widely studied in the field of removing heavy metal ions from aqueous solution (Wang et al., 2016). Zhou et al. ( 2015) prepared a sponge-like polysiloxane-graphene oxide (PS-GO) gel adsorbent by simple one-step sol–gel method for removing lead and cadmium from wastewater. As we all know, magnetic nanoparticles have been widely used in the field of biology and environment for their unique magnetic properties, which can be separated quickly and simply from solution by an appropriate additional magnetic field. Therefore it can further promote the GO-based nanomaterials applied in the field of environmental detection and wastewater treatment by introducing magnetic nanoparticles into GO (Gao et al., 2009; Lee et al., 2010). Gollavelli et al. (2013) developed a one-pot, solvent-free, and rapid synthesis of smart magnetic graphene (SMG) by microwave irradiation of GO and ferrocene precursors for heavy metal removal. However, the reactivity of aforementioned adsorbents is still not high. Introducing amino functional groups which have high activity on the surface of the composites can significantly improve their surface reactivity.
In this work, using GO as carrier, iron chloride hexahydrate (FeCl3·6H2O) as precursor, ethylenediamine as modifier and reductant, ethanediol as surfactant and reductant, and sodium acetate as stabilizer, amino-functionalized magnetic graphene oxide (Fe3O4/GO-NH2) nanocomposites were prepared by one-pot solvothermal method. The Fe3O4/GO-NH2 nanocomposites have superparamagnetic property and high reactivity, which provide an opportunity for the adsorption of Ag(I) in the aqueous solution. The effects of contact time, initial Ag(I) concentration, solution pH, and temperature on the adsorption property of Fe3O4/GO-NH2 nanocomposites were also investigated in detail. Simultaneously, the adsorption mechanism, dynamics, thermodynamics, and isothermal adsorption were further analyzed theoretically.
Experiment
Materials
Natural flake graphite (NFG) 60 BS mesh, with the purity of 99 wt%, was supplied by Shandong Qingdao Tianhe Graphite Company. Concentrated sulfuric acid, sodium nitrate (NaNO3), potassium permanganate (KMnO4), hydrogen peroxide (H2O2), anhydrous ethanol, ethylene glycol, ethylenediamine, anhydrous sodium acetate (CH3COONa), FeCl3·6H2O, silver nitrate (AgNO3), nitric acid, sodium hydroxide (NaOH), potassium hydroxide (KOH), potassium persulfate (K2S2O8), and potassium periodate (KIO4) were all analytical grade and used as received without further purification.
Preparation of Fe3O4/GO-NH2 nanocomposites
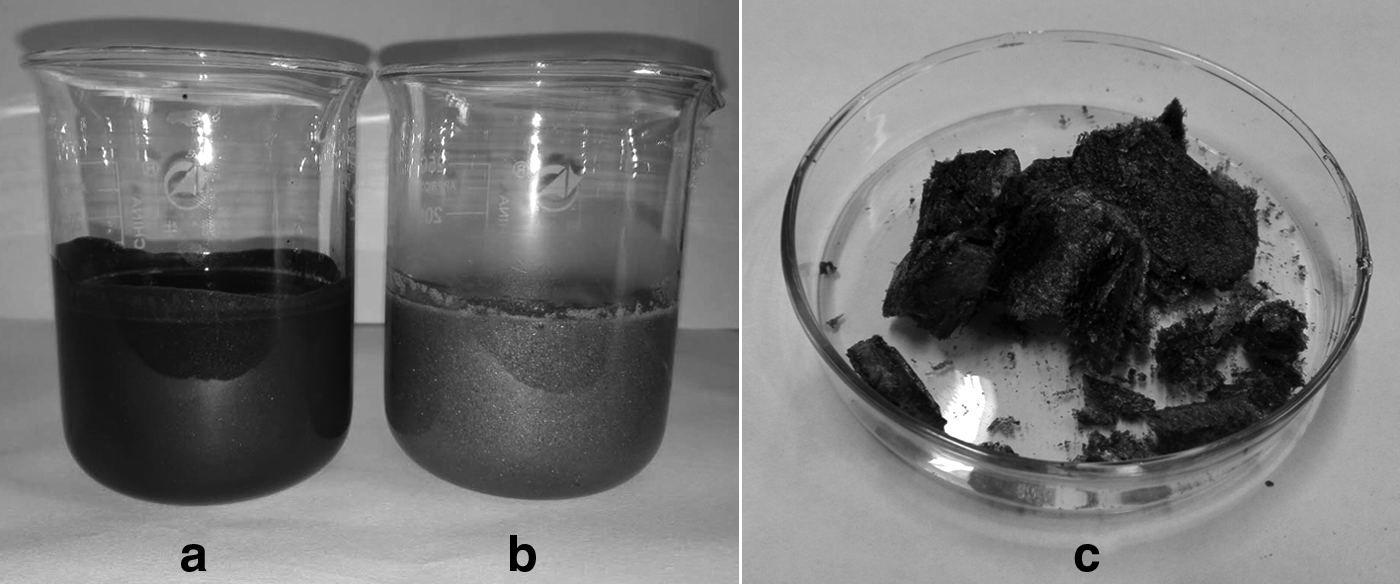
GO was synthesized from NFG by a modified Hummers method (Hummers and Offeman, 1958; Marcano et al., 2010). Two grams NFG was added into 50 mL concentrated H2SO4 under continuous stirring and ice water batch conditions. Then 1 g NaNO3 and 7 g KMnO4 were slowly added into the aforementioned system and continually stirred for 48 h. After that, the reaction was heated to 35°C and stirred for 2 h. Then 100 mL distilled water was continuously and slowly added into the mixture, and the temperature was raised to 92°C reacting for 20 min. One hundred and fifty milliliters of distilled water was added into the system to finish the reaction, and 20 mL H2O2 (30 wt%) was added to eliminate the redundant KMnO4. The color of the mixture was changed from dark brown (Fig. 1a) to brilliant yellow (Fig. 1b). Subsequently, the mixture was centrifuged at 12,000 rpm, and the supernatant was decanted away. The remaining solid material was then washed in succession with distilled water by centrifugal separation until getting neutral elution solution. The GO sample was obtained by freeze-drying at −40°C. The photograph of obtained dry GO is shown in Fig. 1c.
Mixture with “dark brown” color
An easy one-pot reaction was used for fabrication of Fe3O4/GO-NH2 nanocomposites by solvothermal method (Qi et al., 2015) according to the following procedure. First, 0.15 g GO was ultrasonically dispersed in 50 mL ethylene glycol to prepare an aqueous suspension. Then 0.5 g FeCl3·6H2O and 3.0 g CH3COONa were dissolved in GO suspension through ultrasonication for a few minutes to get a uniform mixture. Subsequently, 10 mL ethylenediamine was slowly added into the above mixture. The mixture was ultrasonically dispersed for another 1 h; the resulted homogeneous brown suspension was transferred into a Teflon-lined stainless steel autoclave and reacted at 200°C for 8 h and then cooled naturally to room temperature. The obtained black product was separated by magnet and washed with ethanol and distilled water several times. Finally, the obtained sample was dried at 50°C in vacuum oven for 12 h and denoted as Fe3O4/GO-NH2 nanocomposites.
Characterization
Size and morphology of the products were characterized by transmission electron microscopy (TEM) of JEM-2100F (JEOL) at 160 kV. The crystal structures of the samples were determined by the X-ray diffraction (XRD) of D/MAX-2400 (Rigaku) with Ni-filtered Cu Kα radiation (λ = 1.54056) and the step-scanned program from 5° to 80° (2θ). The chemical functional groups of the samples were analyzed by the Fourier transform infrared spectroscopy (FT-IR) of Nexus 670 (Thermo Electron Corporation) using the KBr pellet technique over a spectral range of 4,000–400 cm−1. The X-ray photoelectron spectroscopy (XPS) analysis was carried out on Kα instrument at the pressure <10−6 Pa. The general scan C 1 s, O 1 s, N 1 s, and Ag 3d core level spectra were recorded with unmonochromatized Mg Kα radiation (photon energy: 1,253.6 eV). The N2 adsorption/desorption isotherm was measured at liquid nitrogen temperature (77 K) using a Micromeritics ASAP 2020 analyzer. The specific surface area was calculated by the Brunauer–Emmett–Teller (BET) method. The pore size distribution was obtained from the Barret–Joyner–Halenda (BJH) method. Elemental analysis was performed by Elementar Vario EL elemental analyzer. The magnetization curves were recorded using a 7304 vibrating sample magnetometer (VSM; LakeShore) at room temperature. The concentrations of Ag(I) in aqueous solution were determined using a UV-752N ultraviolet visible (UV-vis) spectrophotometer by monitoring the absorbance at 365 nm. The pH of solution was determined using a PHS-3C pH meter (Shanghai, China).
Adsorption experiments
All adsorption experiments were carried out in 250 mL conical flask in thermostat oscillator at 120 rpm. The adsorption parameters, including adsorption time (15–960 min), initial Ag(I) concentration (20–120 mg/L), pH (1.0–7.0), and temperature (278–318 K), were studied. AgNO3 was used as the source of Ag(I). The pH was adjusted by adding negligible volume of NaOH or HNO3 solution. At the end of the adsorption process, adsorbent was separated from the solution by magnetic separation. The residual concentration of Ag(I) was detected by UV-vis spectrophotometer at λmax = 365 nm. The ranging concentrations of the Ag(I) solutions used for the UV-vis calibration curve were from 5 to 100 mg/L. Adsorption kinetics and isotherm experiments were conducted under pH of 5.0 at 298 K. The adsorption thermodynamic experiments were conducted at temperature ranging from 278 to 318 K. To investigate the adsorption capacity of the prepared Fe3O4/GO-NH2 nanocomposites for Ag(I), 50 mL solutions of various concentrations of Ag(I) were combined with 25 mg Fe3O4/GO-NH2 nanocomposites. The adsorption capacity was calculated according to the following equation (Sun et al., 2015):
where Q is adsorption capacity of Ag(I) on Fe3O4/GO-NH2 nanocomposites (mg/g), C0 and C are initial and residual concentration of Ag(I) in solution (mg/L), respectively, V is the volume of the added Ag(I) aqueous solution (mL), and m is dosage of the adsorbent (mg).
Results and Discussion
Characterization of Fe3O4/GO-NH2 nanocomposites
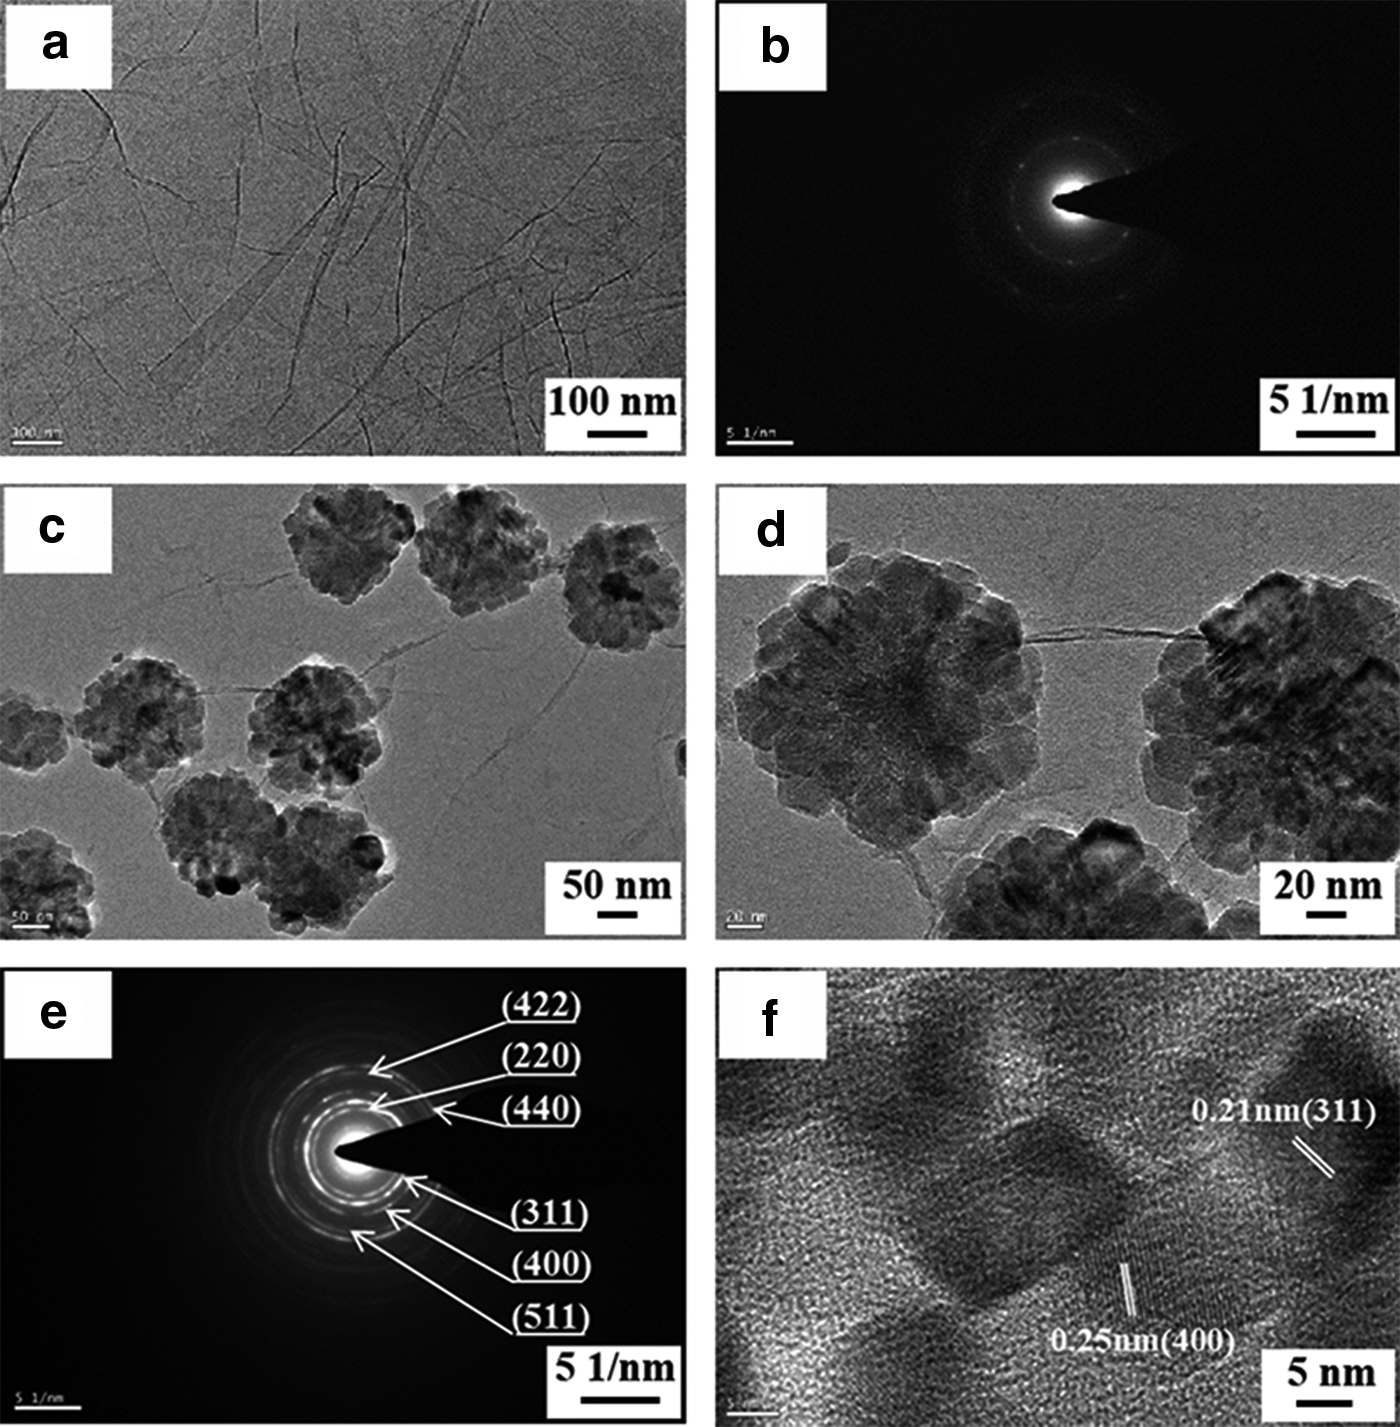
Figure 2 shows the TEM images, the selected-area electron diffraction (SAED) patterns, and high-resolution transmission electron microscopy (HRTEM) image of as-synthesized GO and Fe3O4/GO-NH2 nanocomposites. As shown in Fig. 2a, the synthesized GO has a typical film-like shape with some crumples. As GO layer is thin, the periodic arrangement of carbon atoms is irregular, so the crystallinity is poor; the SAED pattern of GO (Fig. 2b) is not clear and sharp. Figure 2c shows that flower-like shape of Fe3O4 was homogenously decorated on the surface of GO. A corresponding high-magnification TEM image (Fig. 2d) of the Fe3O4/GO-NH2 nanocomposite sample displays that the flower-like shape of Fe3O4 was made up of Fe3O4 nanoparticles with an average size of about 20 nm. According to TEM results, the Fe3O4 nanoparticles can be self-assembled to homogenous flower-like shape and loaded on the surface of GO by the one-pot solvothermal method. From Fig. 2e, it can be clearly seen that the (422), (220), (440), (311), (400), and (511) diffraction ring patterns arise from the cubic crystal Fe3O4, confirming the polycrystalline nature of flower-like shape Fe3O4 loaded on the surface of GO. In addition, more detailed structural information of Fe3O4 loaded on the surface of GO is provided by HRTEM analysis (Fig. 2f). It indicates a well-defined crystallinity with interplanar spacing of 0.21 and 0.25 nm, which are, respectively, corresponding to (311) and (400) planes of Fe3O4 (Shen et al., 2010).
TEM image
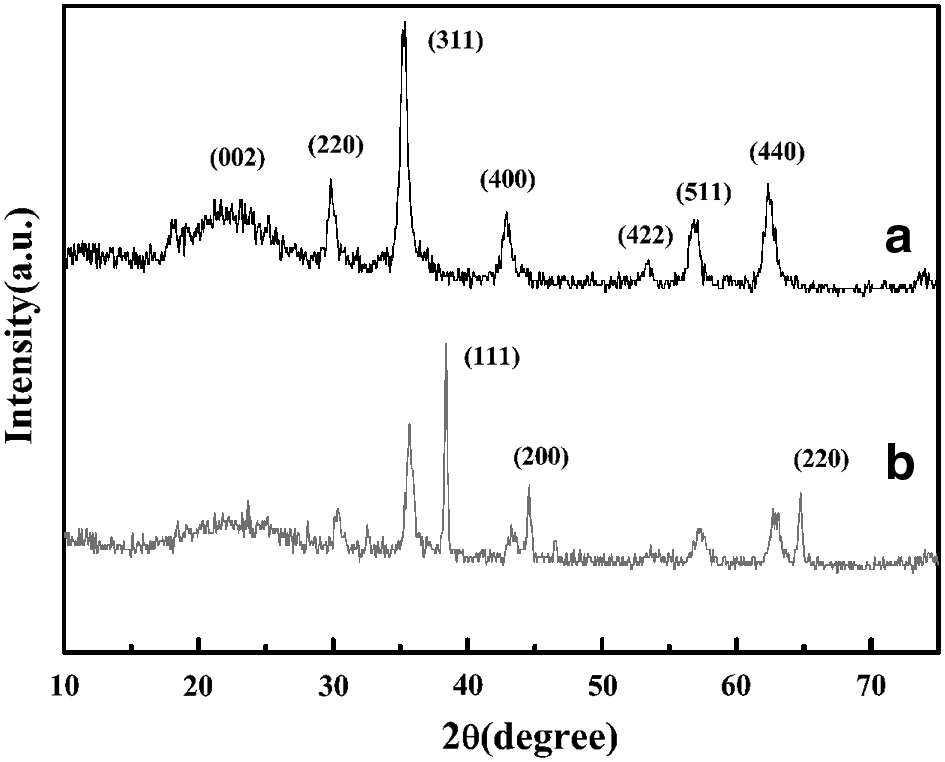
XRD patterns of Fe3O4/GO-NH2 nanocomposites before (Fig. 3a) and after (Fig. 3b) adsorption of Ag(I) with initial concentration of 100 mg/L are shown in Fig. 3. The wide peak appeared at 2θ of 22.5° is assigned to the characteristic peak of graphene. The characteristic peaks of Fe3O4 at 2θ = 30.1°, 35.4°, 43.1°, 53.4°, 57.0°, and 62.5° are found in the XRD patterns, which are assigned to the (220), (311), (400), (422), (511), and (440) diffraction planes of Fe3O4 according to JCPDS card No. 89-4319. In addition, according to JCPDS card No. 87-0720, the peaks appeared at 2θ of 38.1°, 44.3°, and 64.4° in Fig. 3b are assigned to the diffraction planes (111), (200), and (220) of silver, indicating that Ag(I) was successfully adsorbed by Fe3O4/GO-NH2 nanocomposites, and the existential state has been changed in the process of adsorption.
XRD patterns of Fe3O4/GO-NH2 nanocomposites before
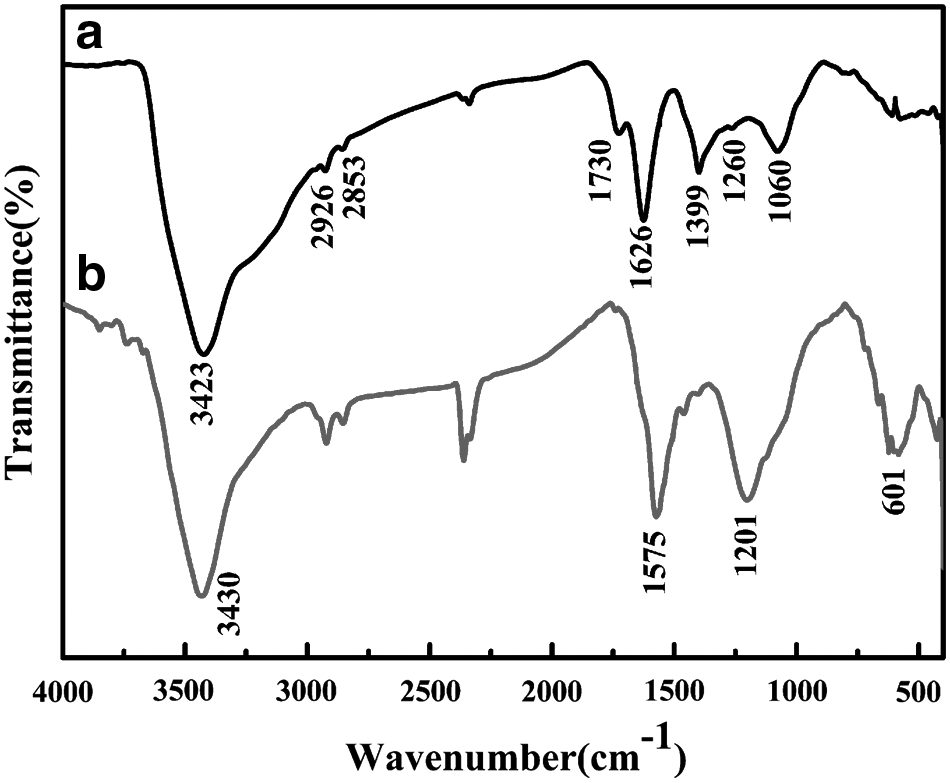
Figure 4 shows the FT-IR spectra of GO and Fe3O4/GO-NH2 nanocomposites. The peaks at 3,423 and 1,399 cm−1 are all related to the O–H stretching vibrations, the peaks at 1,730 and 1,626 cm−1 are appeared to be the C═O and C═C double-bond stretching vibrations (Cao et al., 2015), the peaks at 2,926 and 2,853 cm−1 are related to the -CH2 symmetric and asymmetric stretching vibration, and the peaks at 1,060 and 1,260 cm−1 can be assigned to C–O and C–O–C stretching vibrations. Compared with the spectra of GO (Fig. 4a), a peak at 601 cm−1 for Fe3O4/GO-NH2 nanocomposites (Fig. 4b) can be seen, which is related to the Fe-O stretching vibration (Cao et al., 2015). The result further indicates that the Fe3O4 nanoparticles were successfully decorated on the surfaces of GO. The peaks at 3,430 and 1,575 cm−1 for Fe3O4/GO-NH2 nanocomposites are, respectively, due to N-H bond stretching vibration and bending vibration, which corresponded to amino groups (Guo et al., 2014) on the surface of GO. The peak at 1,201 cm−1 for Fe3O4/GO-NH2 nanocomposites is related to the C–N stretching vibrations. In addition, the peaks of oxygen-containing functional groups (C═O, O–H, C–OH, C–O, and C–O–C) for Fe3O4/GO-NH2 nanocomposites are almost disappearing, indicating that most of the oxygen-containing functional groups on GO layers have been reduced in the process of the reaction. The above investigations demonstrate that the Fe3O4/GO-NH2 nanocomposites are successfully prepared by the one-pot solvothermal method.
FT-IR spectra of GO
The detailed information on the chemical composition of Fe3O4/GO-NH2 nanocomposites is further investigated by XPS (Fig. 5). As shown in Fig. 5a, the survey XPS spectra of Fe3O4/GO-NH2 nanocomposites clearly demonstrate that the sample was mainly composed of Fe, C, N, and O, which is in agreement with FT-IR spectra. After adsorption, there is Ag 3d on the spectra of Fe3O4/GO-NH2 nanocomposites, which indicates that Ag(I) was successfully adsorbed by Fe3O4/GO-NH2 nanocomposites. Higher-resolution spectra are recorded to understand the electronic states of the elements. In Fig. 5b (the Ag 3d spectra), the peaks of Ag 3d5/2 and Ag 3d3/2 are located at 367.4 and 373.4 eV, which are for silver. This result is consistent with the XRD analysis, which demonstrates that Ag(I) was reduced to silver in the process of the adsorption by Fe3O4/GO-NH2 nanocomposites. From Fig. 5c, the O 1 s spectra of Fe3O4/GO-NH2 nanocomposites show pronounced deconvoluted peaks at 530.3, 531.7, and 534.0 eV corresponding to O–Fe, N–C–O, and C–O–C, respectively. After adsorption of Ag(I), the peak position and peak area of O 1 s (Fig. 5d) almost did not change, indicating that the existence form of O element remained the same. In Fig. 5e, the C 1 s peaks can be deconvoluted into the peaks at 284.6 eV (C–C/C═C), 285.9 eV (C–O), and 287.5 eV (C–N), respectively. After adsorption of Ag(I), the peak position and peak area of C 1 s (Fig. 5f) almost did not change as well, indicating that the existence form of C element remained the same. As shown in Fig. 5g, the binding energy centered at 398.9 and 400.0 eV is related to –NH2 and –NH3+ which is the product of –NH2 protonation, respectively. After adsorption of Ag(I), the two peaks are shifted a little to lower binding energies of 397.6 and 399.5 eV. In addition, the peak area ratio between –NH2 and –NH3+ has decreased. This phenomenon can be attributed to the formation of NH2-Ag(I) chemical complex, then the obtained chemical complex turned into silver by electron transfer.
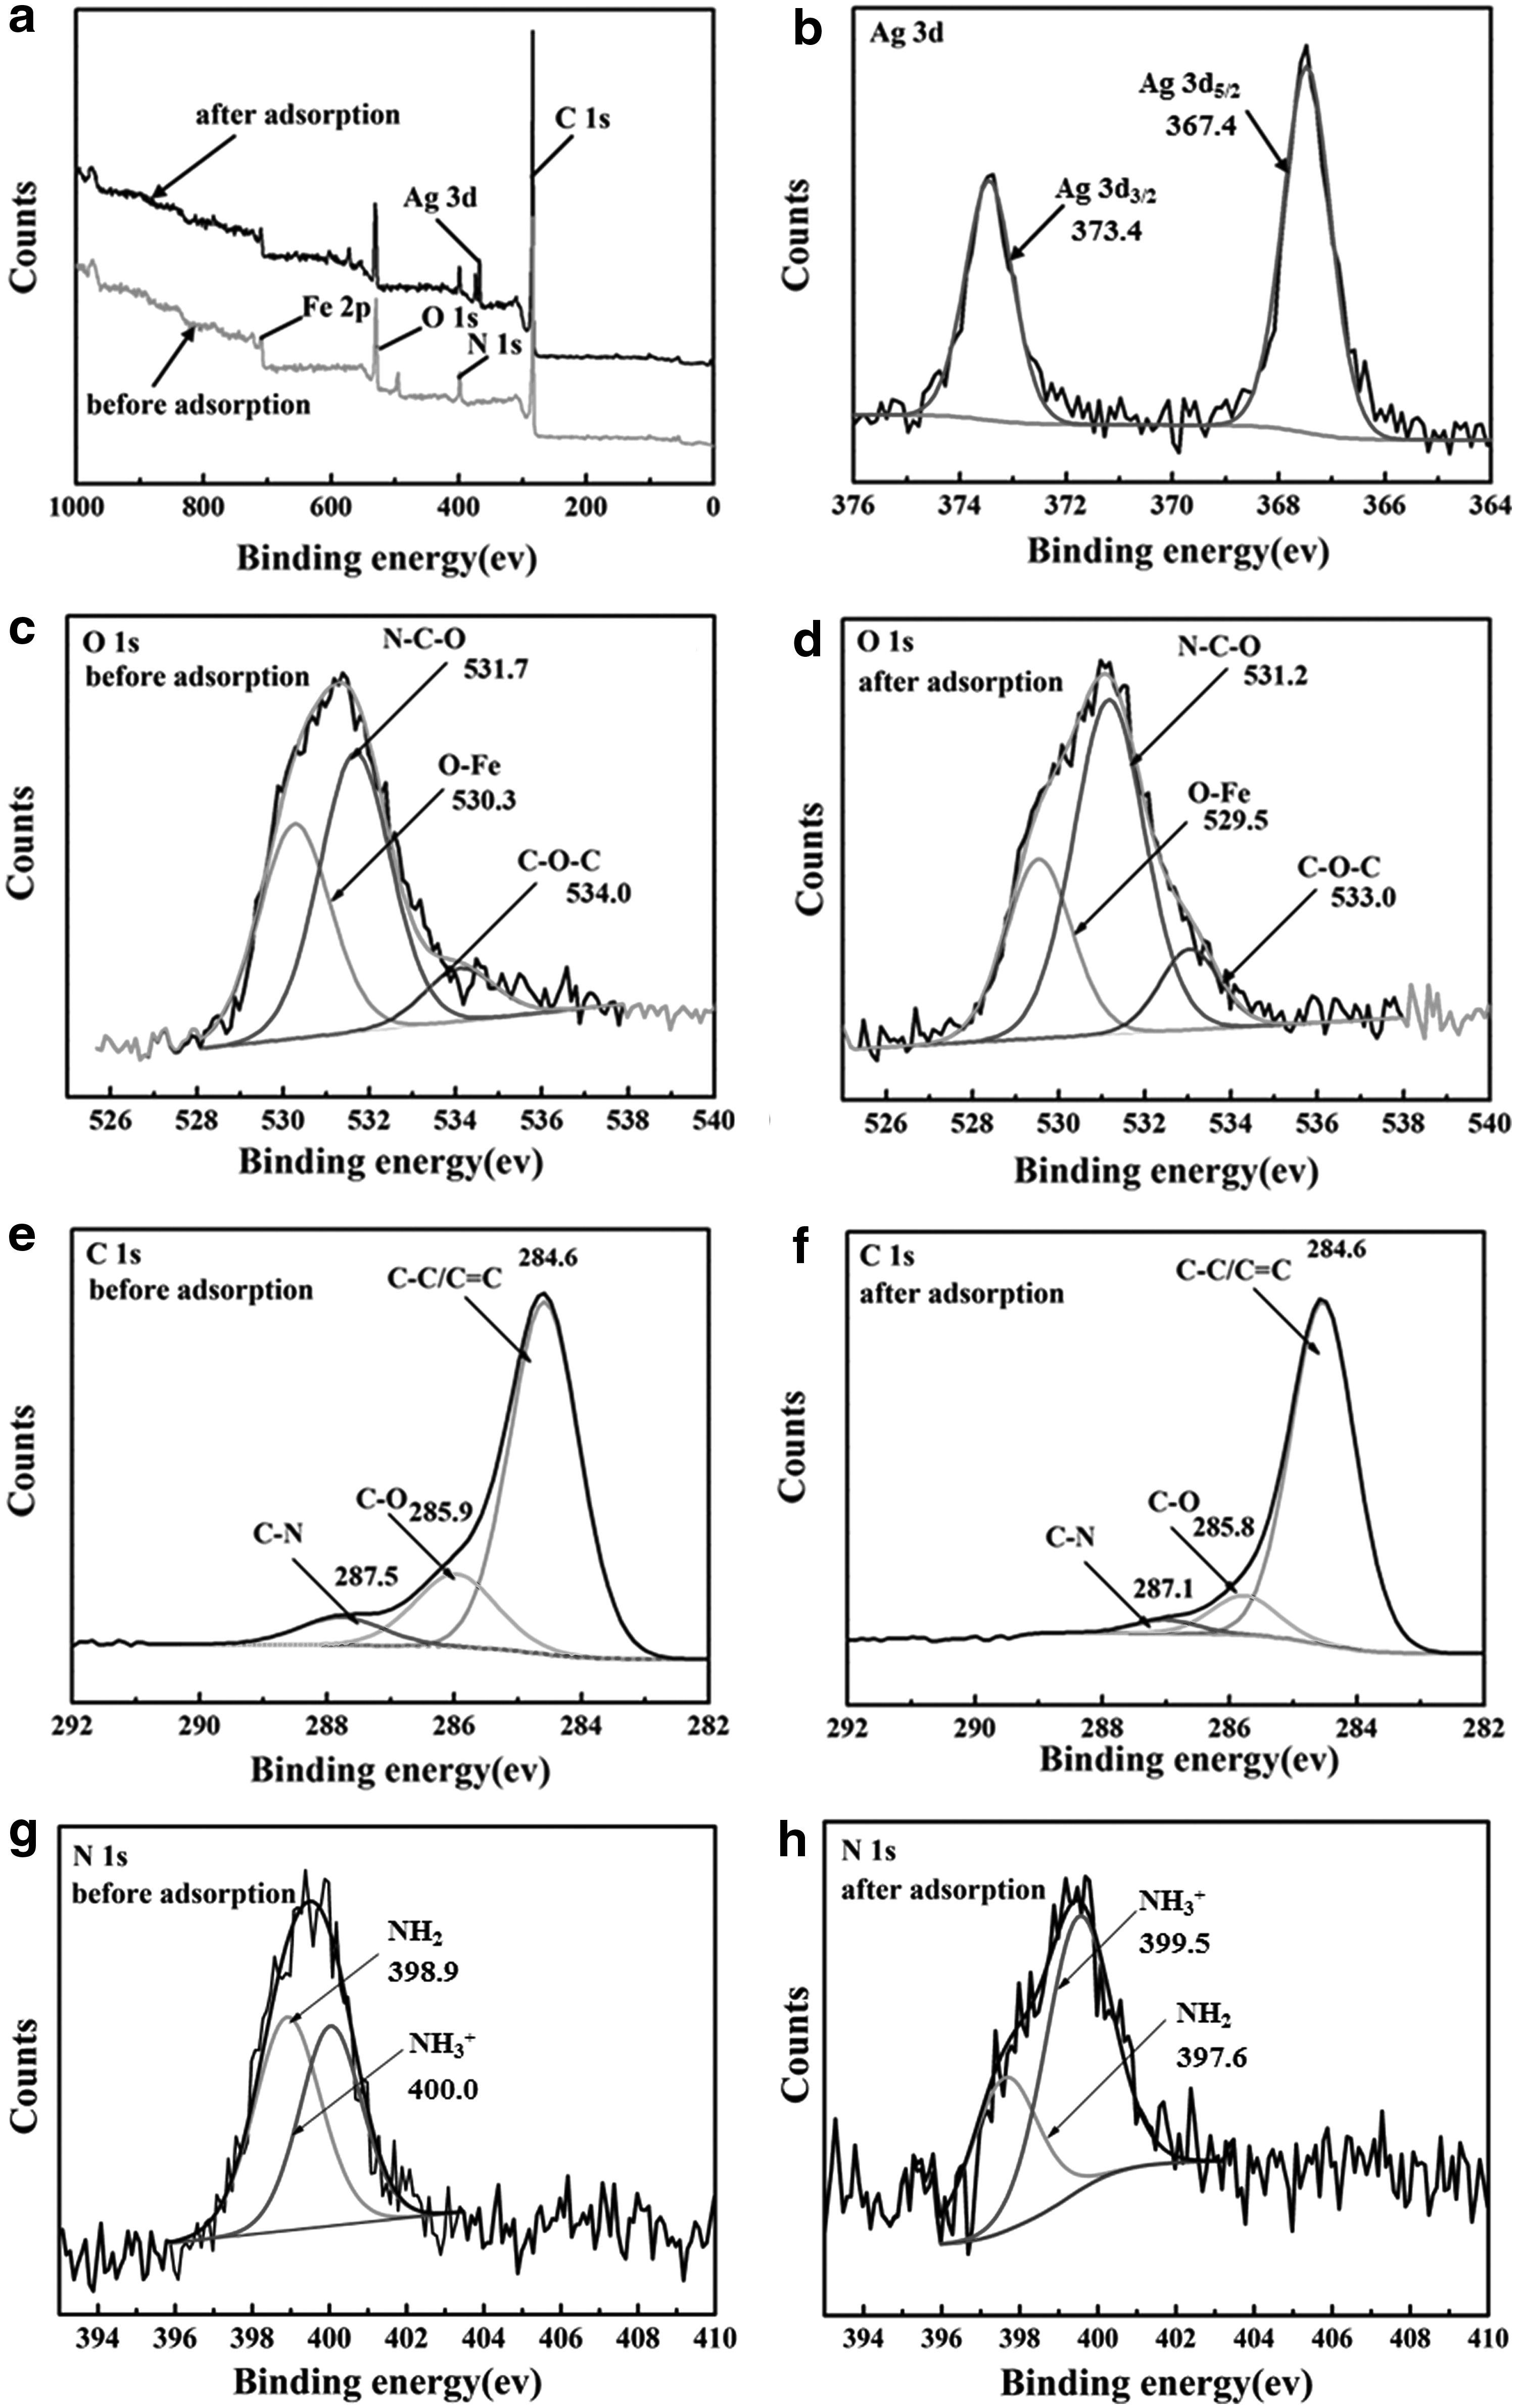
Survey XPS spectra of Fe3O4/GO-NH2 nanocomposites before and after adsorption of Ag(I) with initial concentration of 100 mg/L
Specific surface area is an important parameter that affects the adsorption performance of the adsorbent. BET analysis is reported as an effective tool for evaluating the specific surface area of nanomaterials (Cui et al., 2015). As we all know, the parameters of pore diameter and micropore volume are more important for adsorption compared with specific surface area. The physical properties of Fe3O4/GO-NH2 nanocomposites before and after adsorption of Ag(I) with initial concentration of 100 mg/L are shown in Table 1. The specific surface area of Fe3O4/GO-NH2 nanocomposites was 73.85 m2/g. Meanwhile, the average pore diameter and the micropore volume of Fe3O4/GO-NH2 nanocomposites were 8.51 nm and 0.17 cm3/g, respectively. Elemental analysis result further shows that amine groups (5.20 mmol/g) were successfully introduced on the surface of Fe3O4/GO-NH2 nanocomposites. The larger pores and the reactive amine groups in the Fe3O4/GO-NH2 nanocomposites would be suitable for the adsorption. Compared with the physical properties of Fe3O4/GO-NH2 nanocomposites before adsorption of Ag(I), after adsorption of Ag(I), the specific surface area (23.74 m2/g) micropore volume (0.14 cm3/g) was decreased, and the average pore diameter (22.97 nm) was increased. This is mainly due to that Ag(I) adsorbed on the surface of Fe3O4/GO-NH2 nanocomposites reduced to silver, a large number of silver particles coated on the surface of nanocomposites making the grain size increase, the specific surface area, hole, and the NH2 amount (1.78 mmol/g) decrease.
BET surface area; bBJH desorption cumulative volume of pores.
BET, Brunauer–Emmett–Teller; BJH, Barrett–Joyner–Halenda.
Magnetic properties of Fe3O4 and Fe3O4/GO-NH2 nanocomposites were measured by VSM at room temperature (Fig. 6). It can be found that the magnetization curves exhibited zero remanence and coercivity, indicating the superparamagnetic property of Fe3O4 and Fe3O4/GO-NH2 nanocomposites. From Fig. 6a, the saturation magnetization value of bare Fe3O4 nanoparticles is 55.4 emu/g. For Fe3O4/GO-NH2 nanocomposites (Fig. 6b), the saturation magnetization obtained at same field is 29.3 emu/g. This is mainly attributed to the existence of nonmagnetic GO in Fe3O4/GO-NH2 nanocomposites. As shown in Fig. 6c, Fe3O4/GO-NH2 nanocomposite homogeneous dispersion exists in the absence of an external magnetic field. When an external magnetic field is applied, Fe3O4/GO-NH2 nanocomposites are attracted to the vessel wall with an additional magnet conveniently, which indicates that the magnetic property of the Fe3O4/GO-NH2 nanocomposites can meet the requirements of magnetic separation.
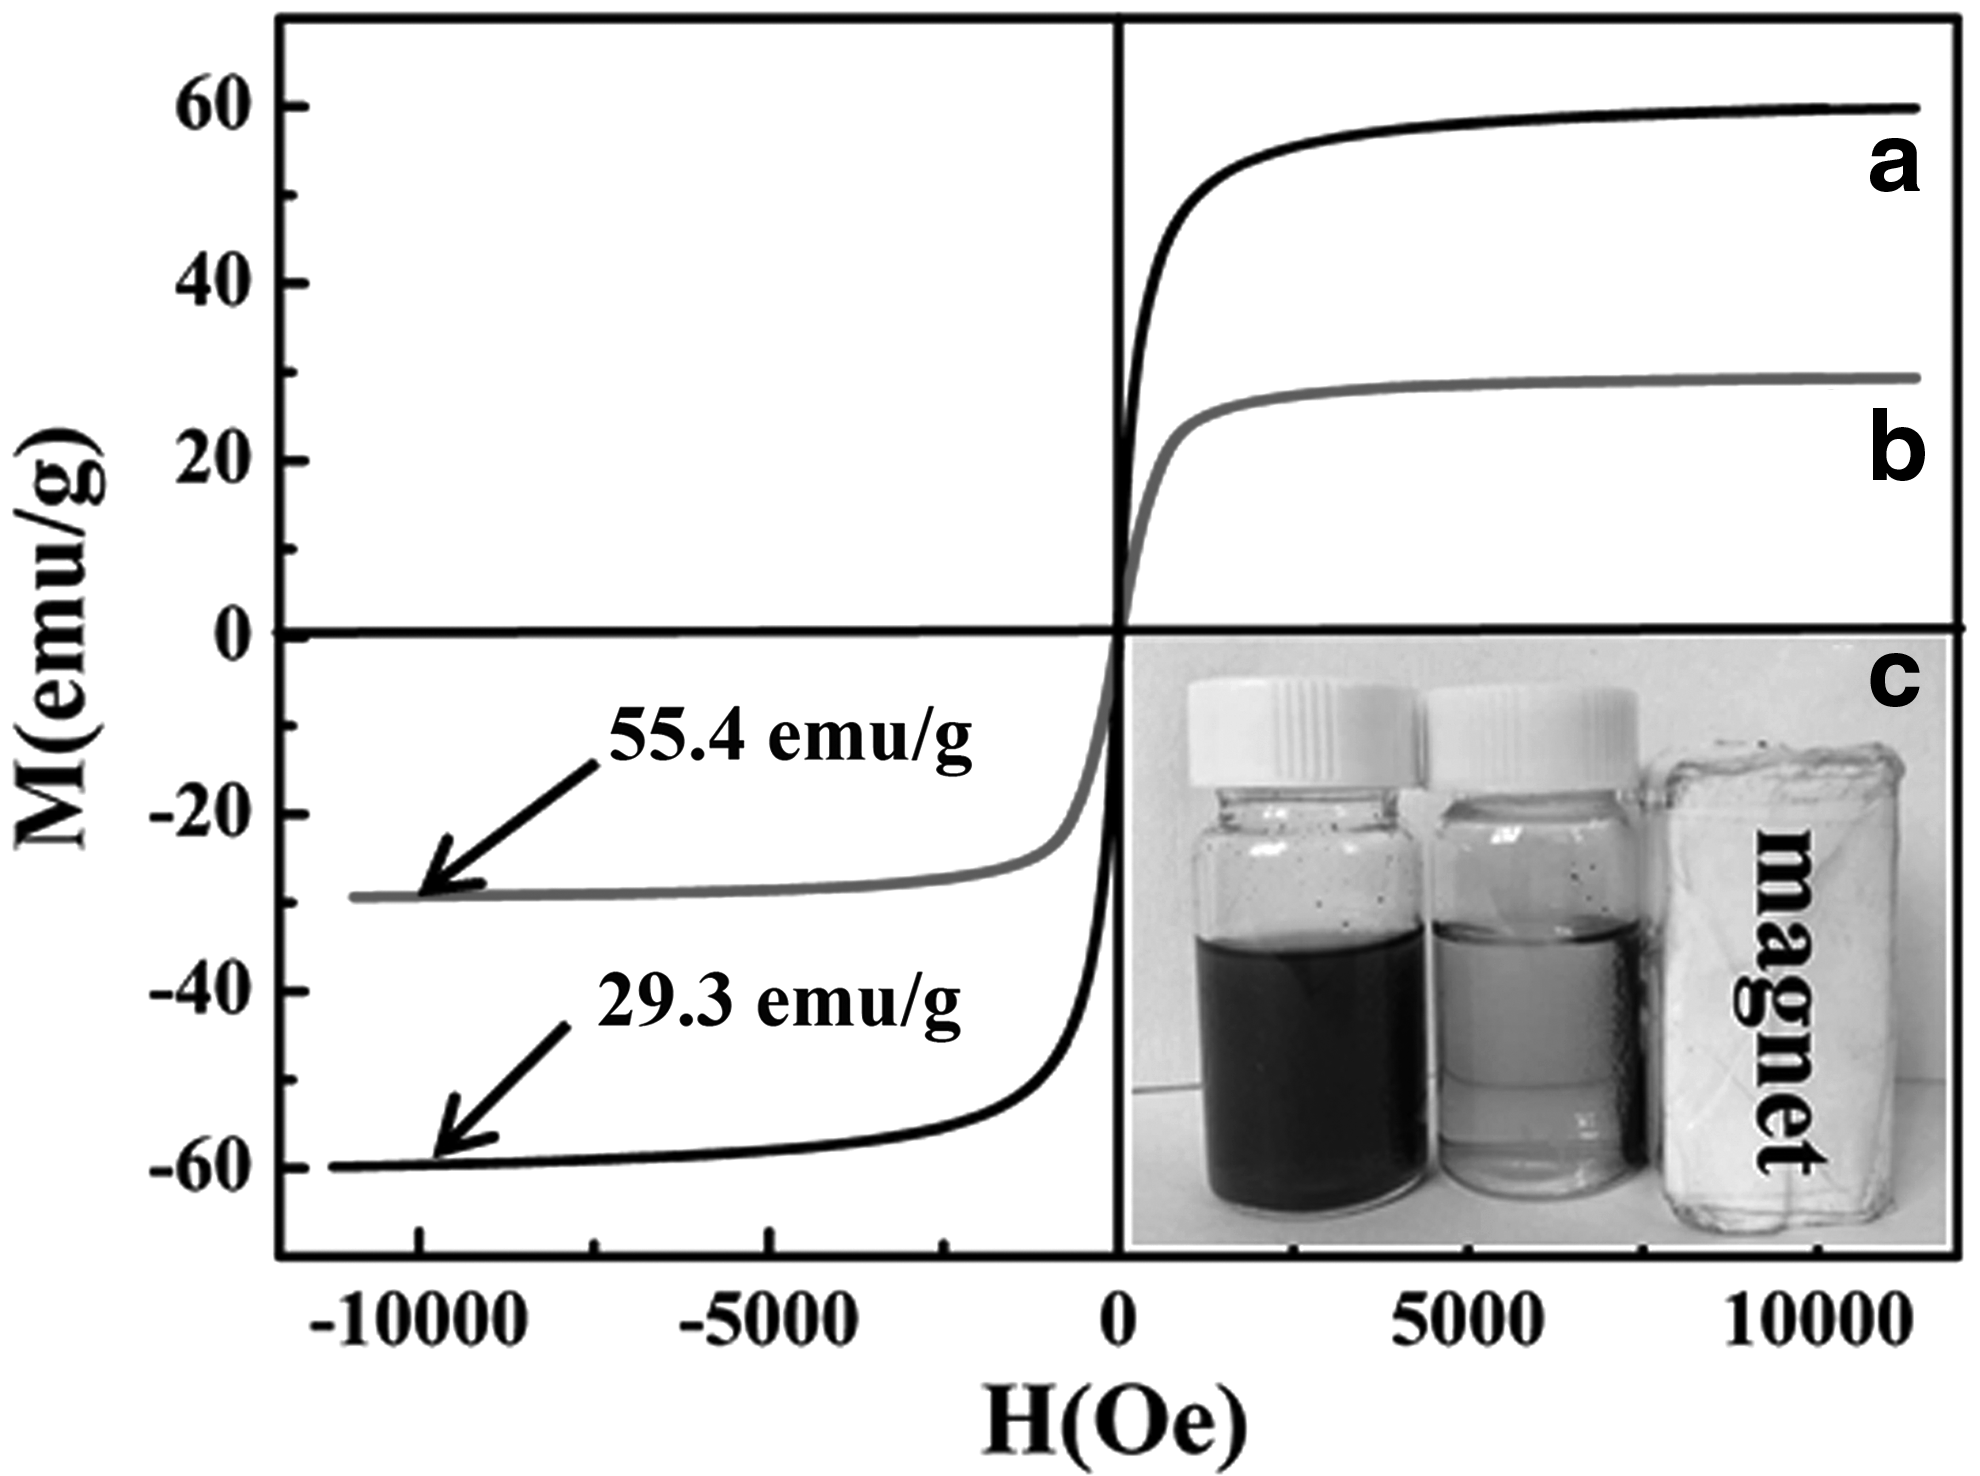
Magnetization curves of Fe3O4
Adsorption studies
Effect of contact time
To obtain the optimum adsorption time, the sample solutions with initial Ag(I) concentration of 30, 40, and 50 mg/L were adsorbed for different times. The pH was 5.0; adsorption temperature was 298 K. As shown in Fig. 7, the absorption capacity of Ag(I) raised obviously with an increase of contact time and after a period of time the system reached adsorption equilibrium. That is to say, the adsorbing process can clearly be divided into three steps as follows: an initial rapid step, a subsequent slow step, and equilibrium step.
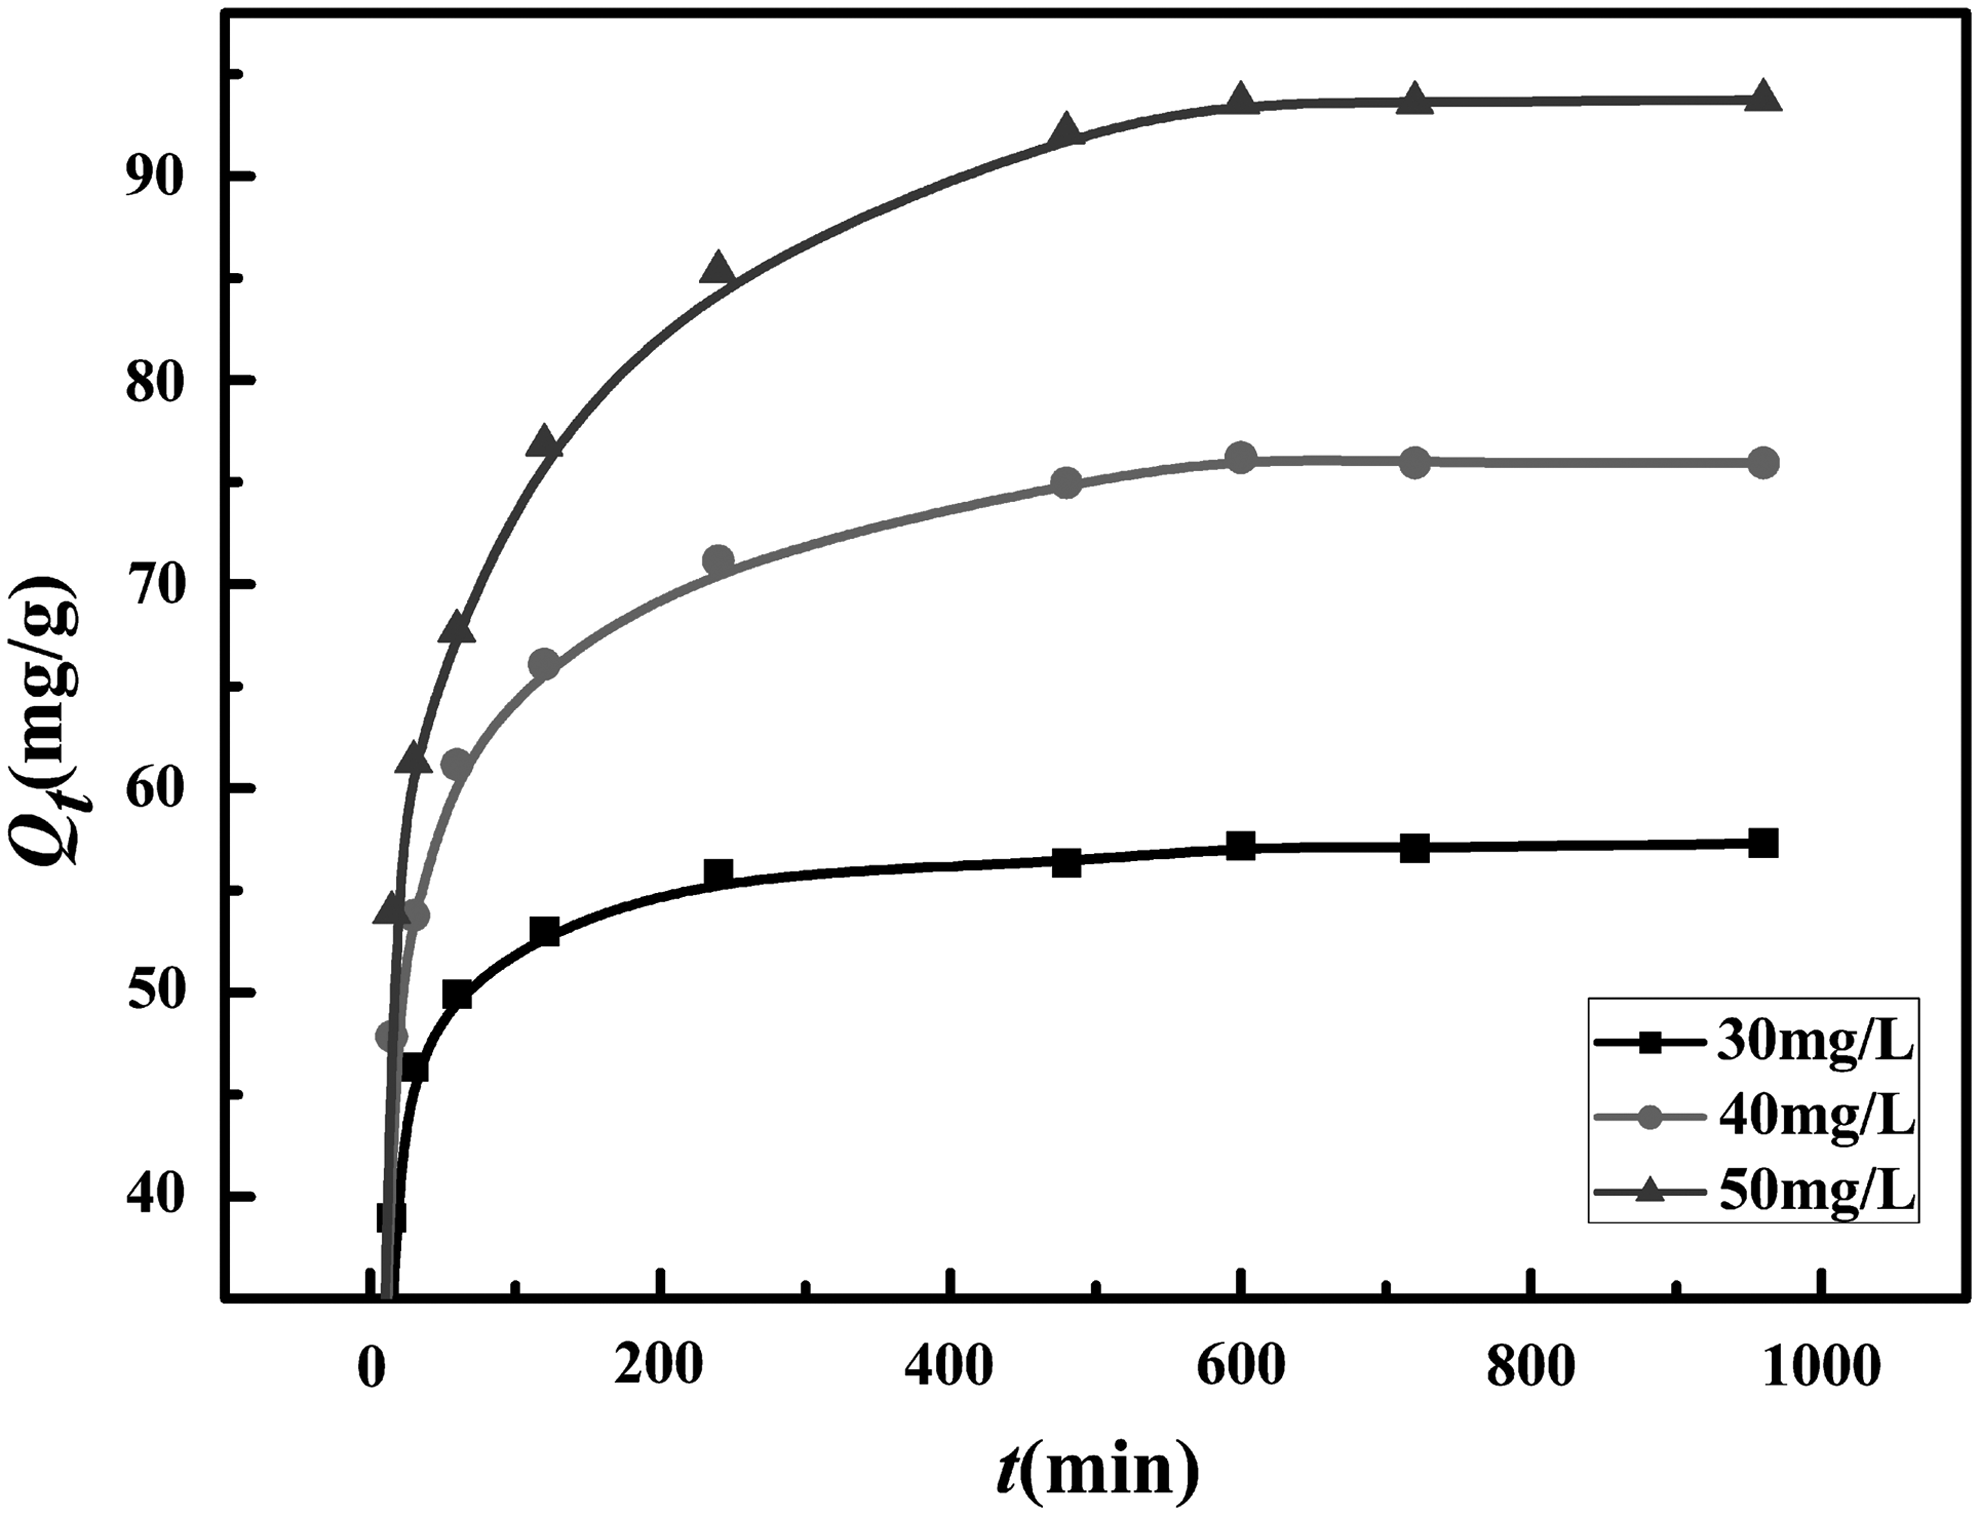
Effect of contact time on the adsorption of Fe3O4/GO-NH2 nanocomposites for Ag(I) (T: 298 K, pH: 5.0).
Effect of initial Ag(I) concentration
Effect of the initial Ag(I) concentration (20, 30, 40, 50, 60, 70, 80, 90, 100, and 120 mg/L) on the absorption capacity of Fe3O4/GO-NH2 nanocomposites for Ag(I) was studied under pH of 5.0 at 298 K for 10 h as shown in Fig. 8. The absorption capacity of Fe3O4/GO-NH2 nanocomposites for Ag(I) increased significantly with an increase of initial Ag(I) concentration in the range of 20–50 mg/L, on account of enough active sites on the surface of Fe3O4/GO-NH2 nanocomposites combined with Ag(I) at the low concentration of Ag(I). Then the absorption capacity increased slowly and reached equilibrium for the limited active binding sites. The maximum adsorption capacity was 114.90 mg/g.
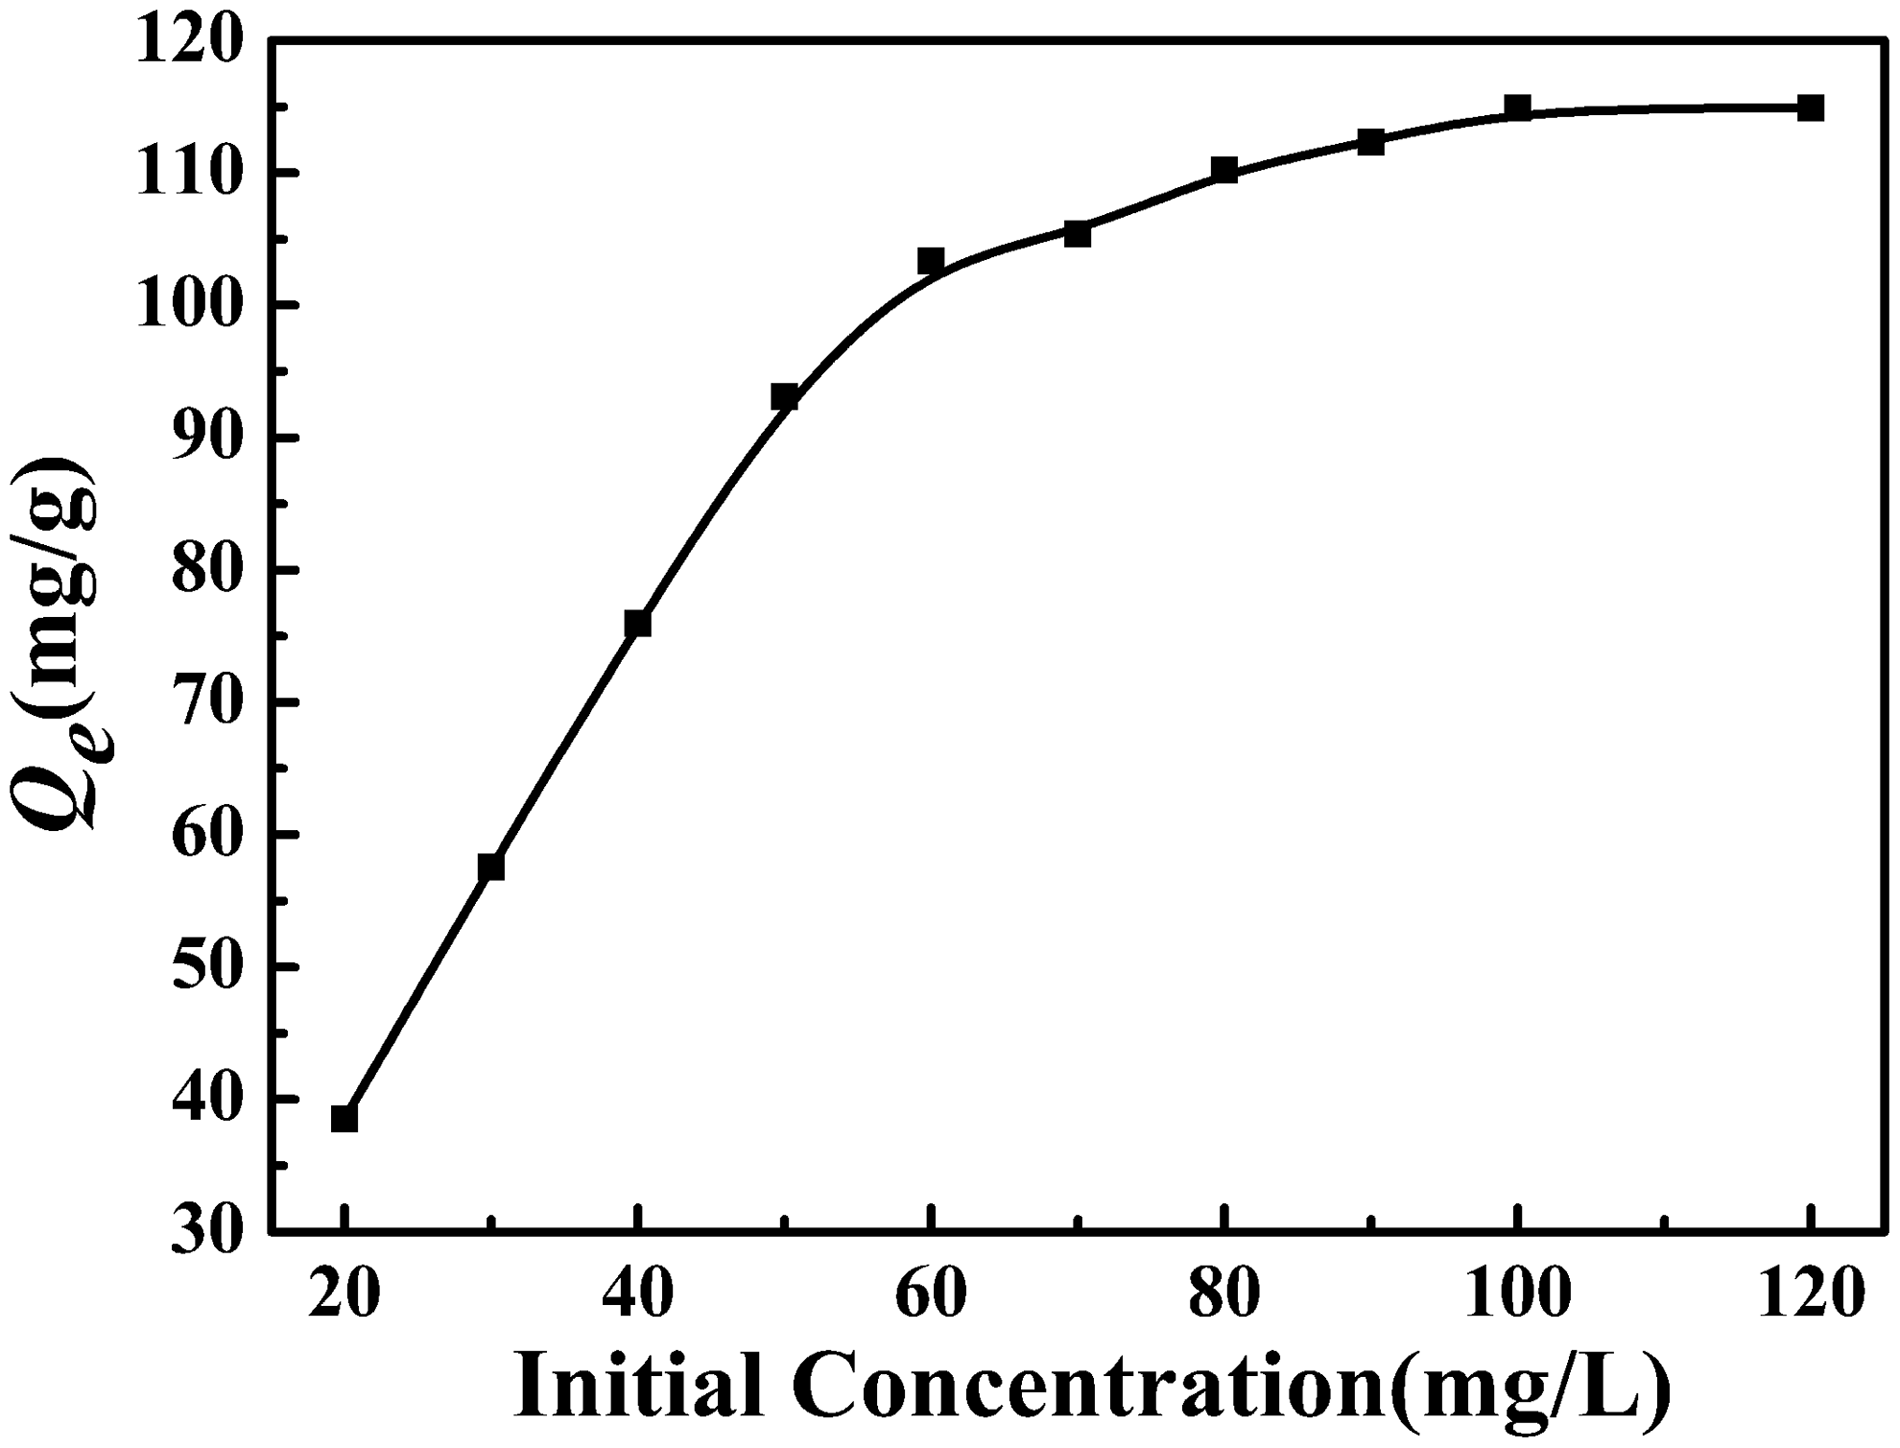
Effect of initial Ag(I) concentration on the adsorption of Fe3O4/GO-NH2 nanocomposites for Ag(I) (T: 298 K, pH: 5.0, t: 10 h).
Effect of pH
The pH acts as a key condition affecting adsorption property of adsorbent for heavy metal ions in aqueous solution (Ho, 2005). The sample solutions of pH ranging from 1.0 to 7.0 containing Ag(I) were studied, and the results were shown in Fig. 9. In this process, the initial Ag(I) concentration was 30 mg/L, contact time was 10 h, and adsorption temperature was 298 K. When the pH was <3.0, the value of Qe undulated at a lower level because the active sites on the surface of Fe3O4/GO-NH2 nanocomposites were occupied by a large number of protons in aqueous solution. Then, the adsorption capacity increased rapidly with pH increasing from 3.0 to 4.0 and the maximum adsorption capacity was observed at pH 4.0. This phenomenon can be explained by a typical kind of chelating mechanism for Ag(I) (Guo et al., 2014). When the value of pH is low, a large number of H+ protonate the amino functional groups on the surface of Fe3O4/GO-NH2 nanocomposites to make –NH2 transformed into –NH3+, causing only a few of –NH2 sites to be used to combine with Ag(I). On the contrary, when the value of pH is increased, the protonation reaction of –NH2 decreases so that the surface of the adsorbent has more –NH2 to combine with Ag(I) and lead to the adsorption capacity increase. With the pH increasing from 5.0 to 7.0, the adsorption capacity reaches a plateau value, which can be attributed to the protonation reaction to achieve the equilibrium.
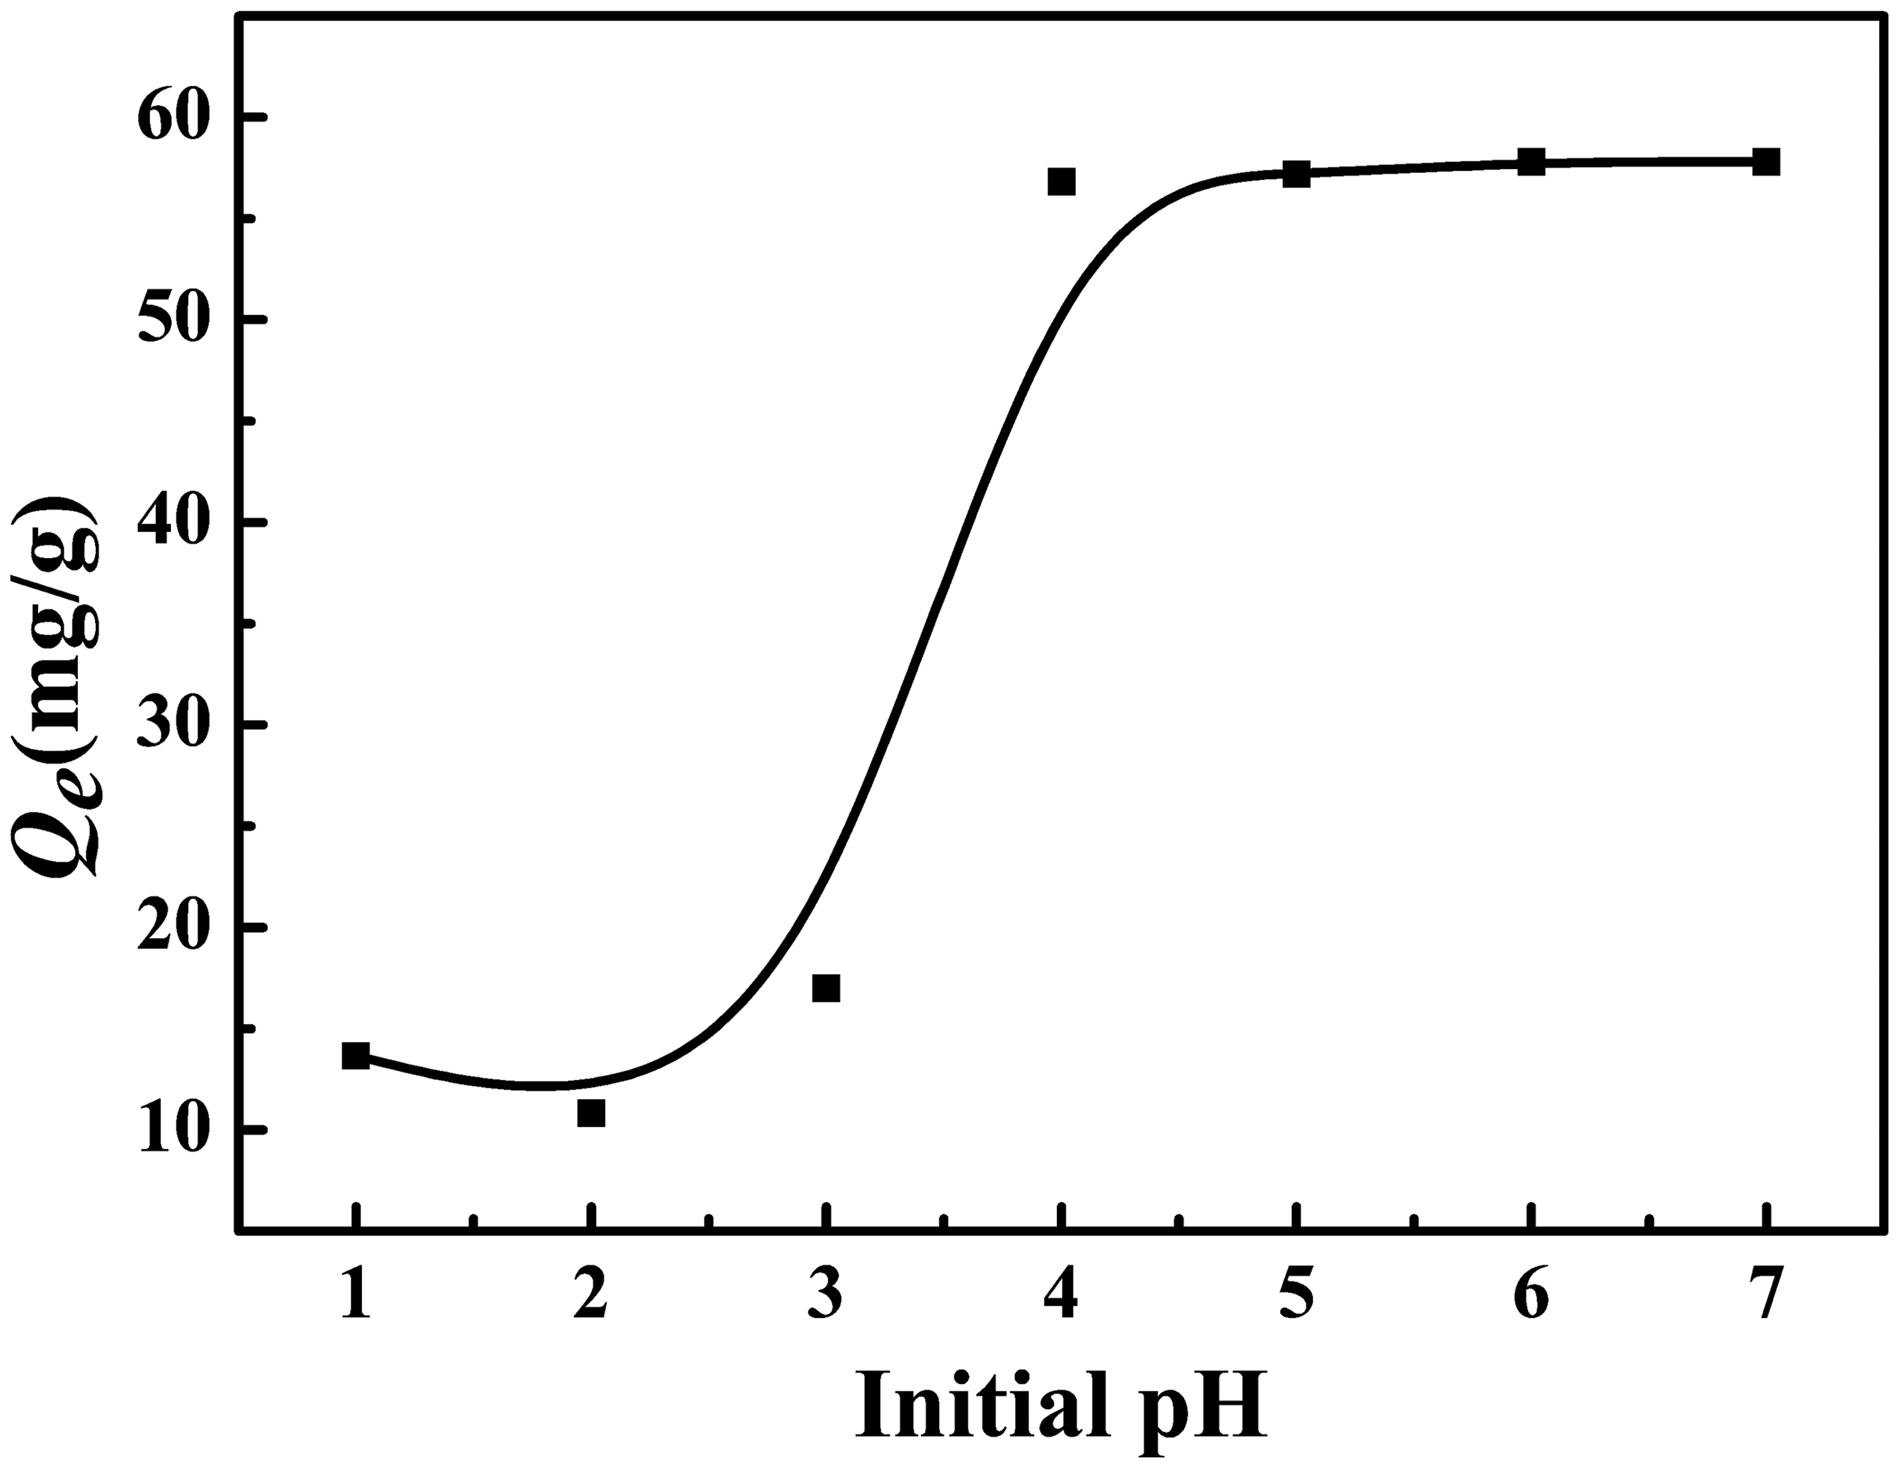
Effect of aqueous solution pH on the adsorption of Fe3O4/GO-NH2 nanocomposites for Ag(I) (C0: 30 mg/L, T: 298 K, t: 10 h).
Effect of temperature
To study the adsorption thermodynamics, the sample solutions with initial Ag(I) concentration of 50 mg/L were adsorbed at different temperatures. The pH was 5.0, and contact time was 10 h. As shown in Fig. 10, the adsorbance of Ag(I) was raised obviously with an increase of temperature; when the temperature increased to 310 K, the adsorption reached equilibrium. The temperature influences the adsorption process in two main ways. First, an increase of temperature can enhance the diffusion rate of Ag(I) across the boundary layer and within the pores, which could be achieved by decreasing solution viscosity. Second, changing temperature would change the equilibrium adsorption capacity of adsorbent for the adsorbate (Yazdani et al., 2016). The above result indicated that the higher temperature was beneficial to the adsorption.
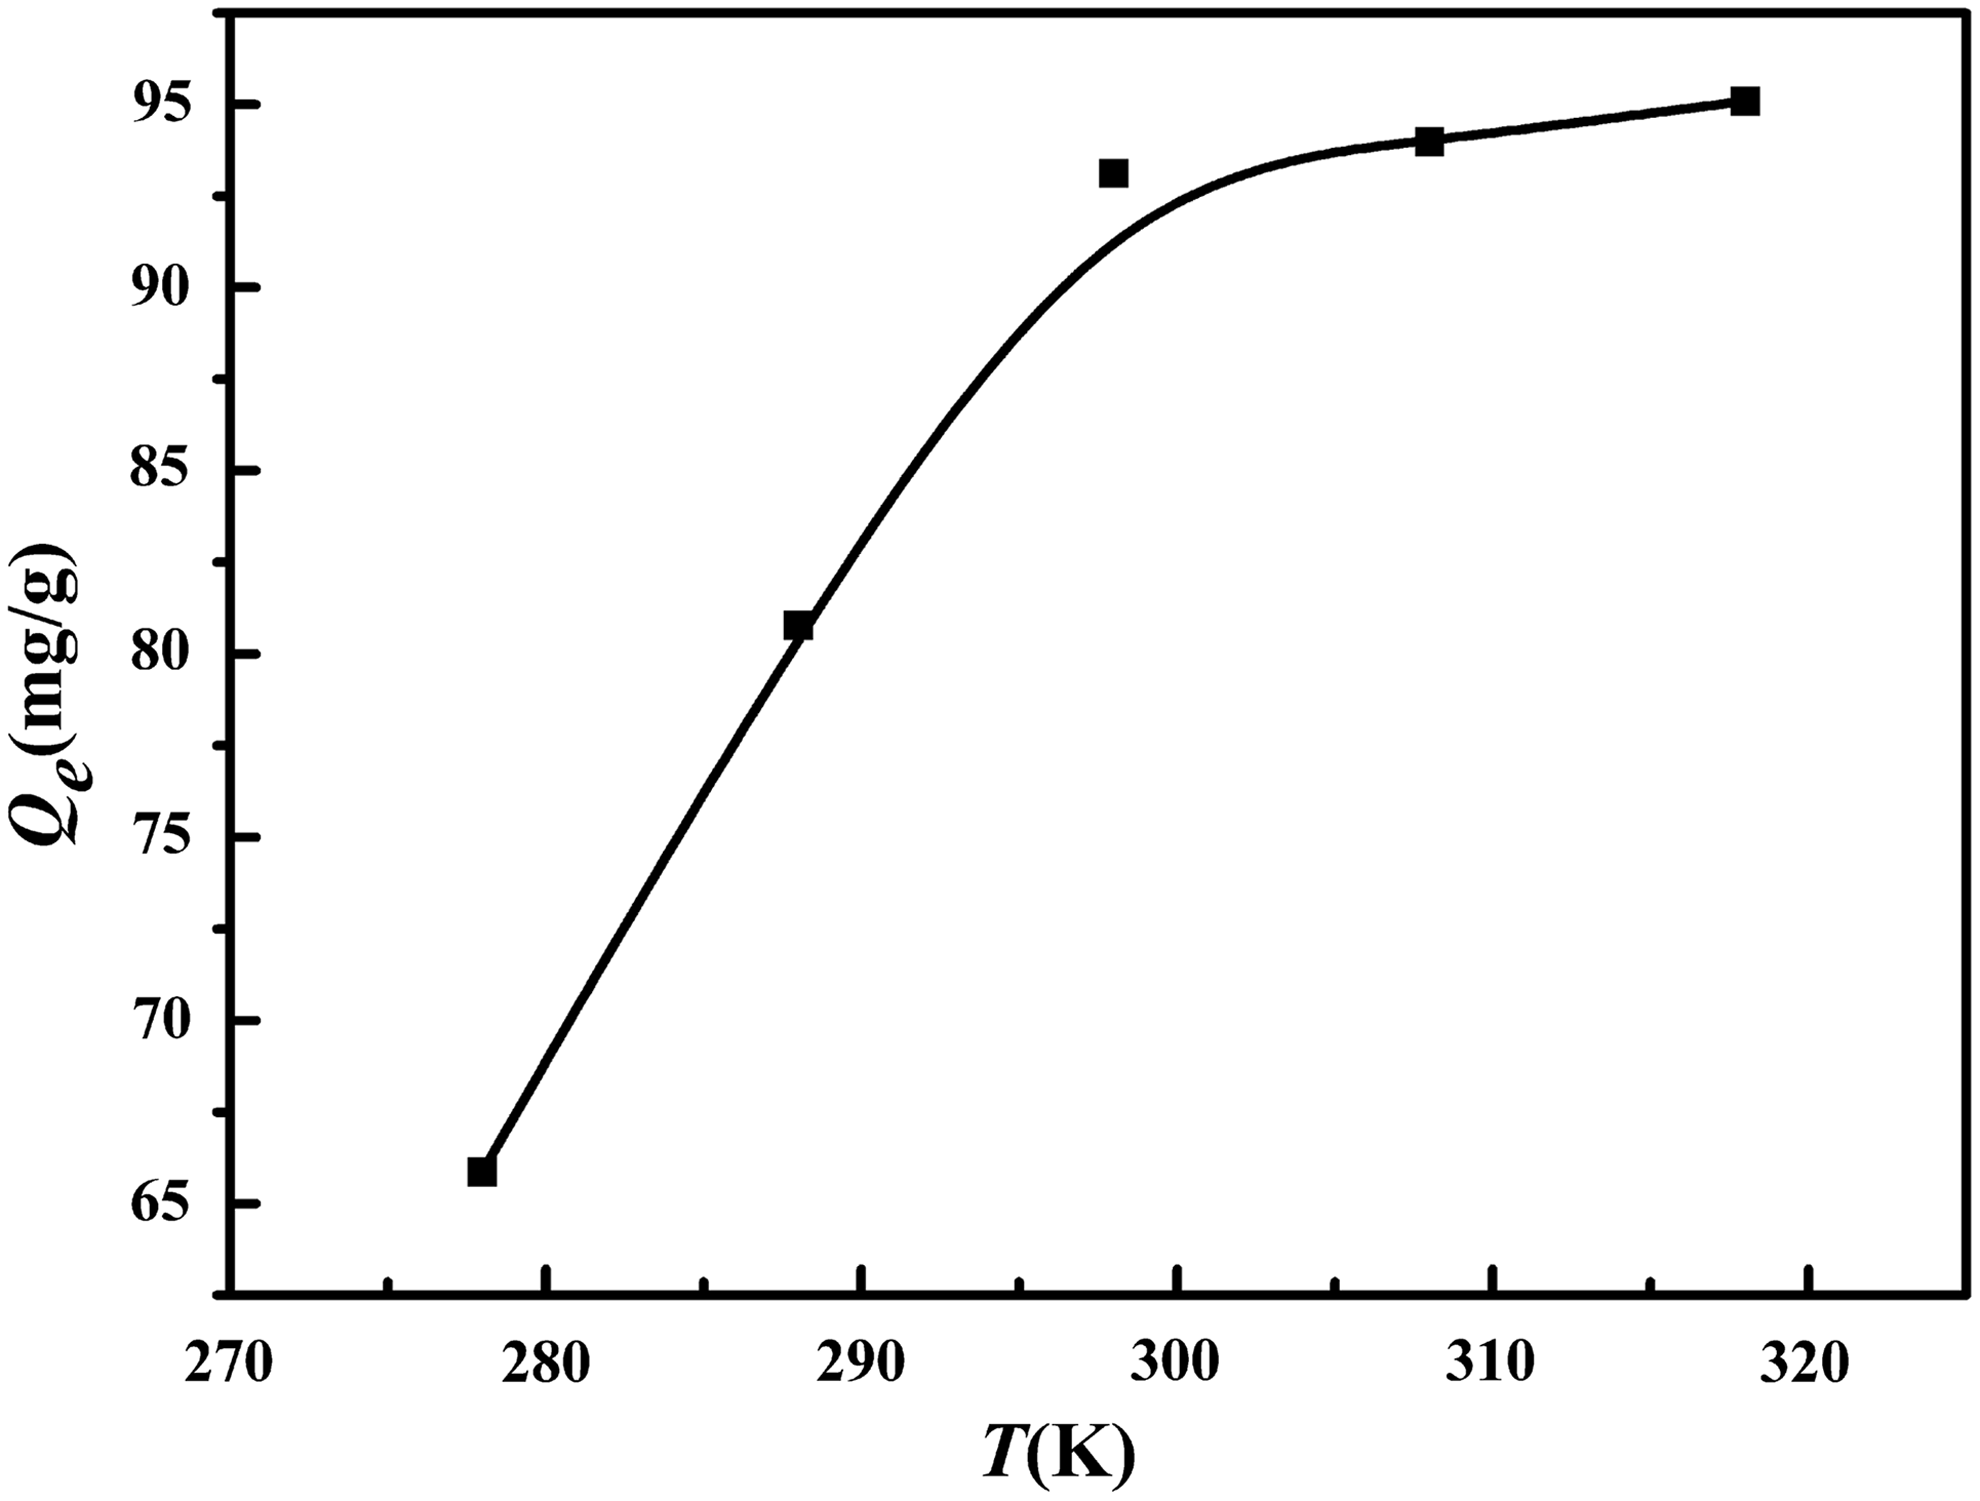
Effect of temperature on the adsorption of Fe3O4/GO-NH2 nanocomposites for Ag(I) (C0: 50 mg/L, pH: 5.0, t: 10 h).
Adsorption kinetics
Adsorption kinetics as an important aspect of adsorption mechanism study was investigated. Twenty-five milligrams of Fe3O4/GO-NH2 nanocomposites was mixed with 50 mL solution containing different concentrations of Ag(I), the pH was 5.0, and the temperature was 298 K. The experimental data were analyzed using three conventional kinetic models (pseudo-first-order, pseudo-second-order, and intraparticle diffusion models). The pseudo-first-order kinetic model (Ma et al., 2013; Ouyang et al., 2015) [Eq. (2)] and pseudo-second-order kinetic model (Badruddoza et al., 2013) [Eq. (3)] were expressed as follows:
where Qt is the adsorption capacity of Fe3O4/GO-NH2 nanocomposites for Ag(I) at several times t (mg/g), k1 is the equilibrium rate constant of pseudo-first order for the adsorption process (min−1), and Qe1 is the maximum adsorption capacity for the pseudo-first-order adsorption (mg/g). k2 is the equilibrium rate constant of pseudo-second order for the adsorption process (g/[mg·min]) and Qe2 is the maximum adsorption capacity for the pseudo-second-order adsorption (mg/g).
The kinetics data were fitted as the linear form of the models (Fig. 11). The straight lines in Fig. 11a were obtained by fitting
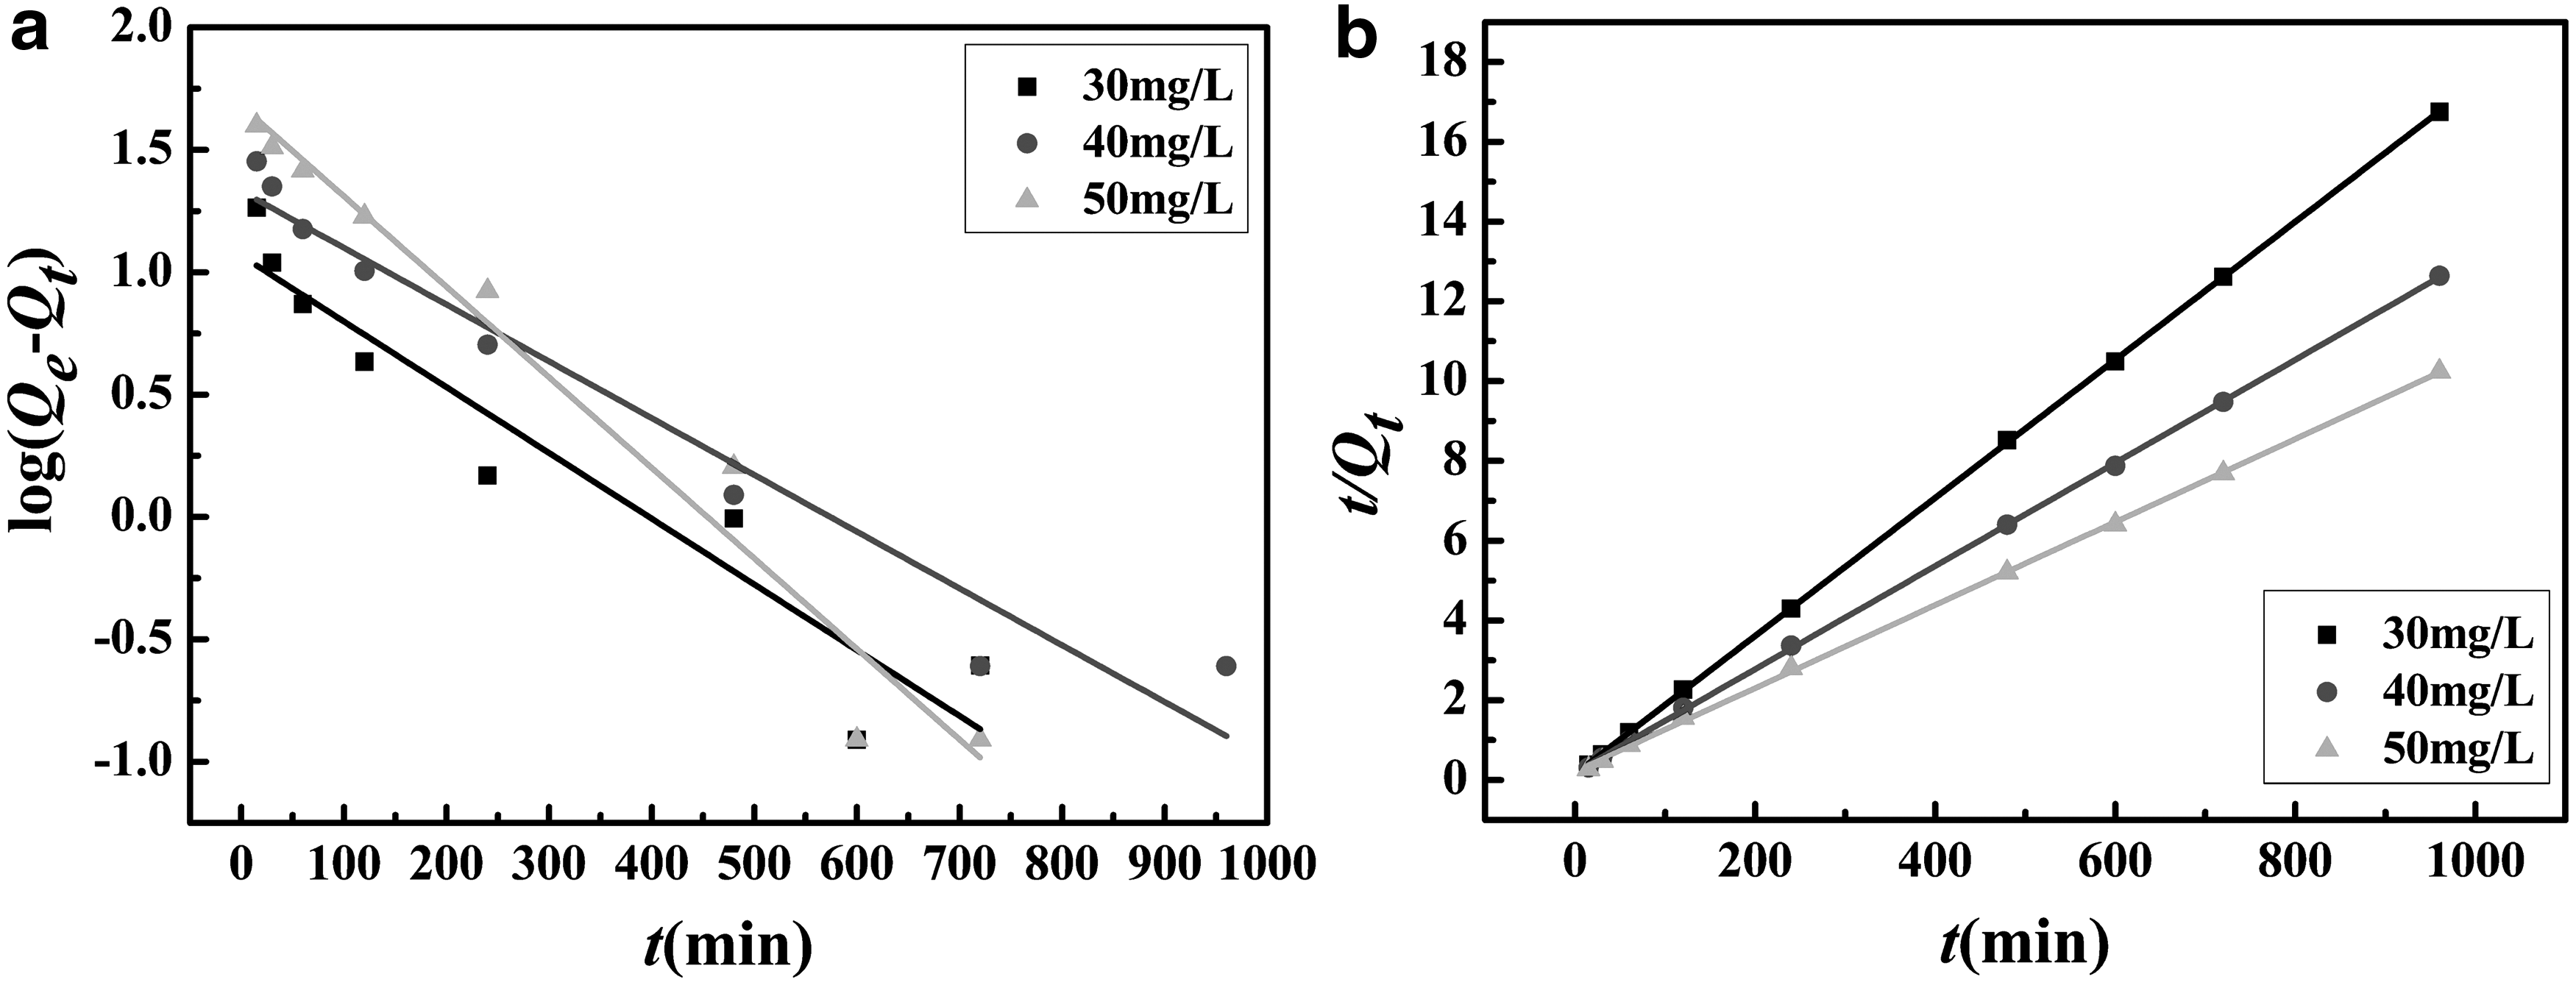
Pseudo-first-order kinetics model
To further research the adsorption process, the intraparticle diffusion model (Yang et al., 2010) was used, and the rate constant for intraparticle diffusion (ki) was introduced. The intraparticle diffusion model was expressed as follows:
where Qt is the amount of Ag(I) adsorbed on Fe3O4/GO-NH2 nanocomposites at various time t (mg/g), ki is the rate constant for intraparticle diffusion ([mg/g]·min1/2), and the value of the intercept C is indicator of the boundary layer.
The graph of Qt versus t1/2 at different concentrations of Ag(I) is shown in Fig. 12. It can be seen from the graph that there are three sections describing the mass transfer on Fe3O4/GO-NH2 nanocomposites. The intraparticle diffusion constant ki can be determined from the slop of the line and it expresses the diffusion rates of the different stages in adsorption process. It can be seen from the Table 2 that the adsorption rate is ki1 > ki2 > ki3. Intraparticle diffusion can be divided into three stages as follows: the first steep-sloped stage is the instantaneous diffusion (ki1), during which a large amount of Ag(I) was rapidly adsorbed by Fe3O4/GO-NH2 nanocomposites; in the second stage, the diffusion rate (ki2) decreased as the accumulation of Ag(I) absorbed on the surface of Fe3O4/GO-NH2 nanocomposites led to the increase of diffusion resistance; and in the third stage, the intraparticle diffusion rate gradually slowed down and finally reached the equilibrium stage (ki3) because of the rapid decrease of Ag(I) concentration (Wang et al., 2015).
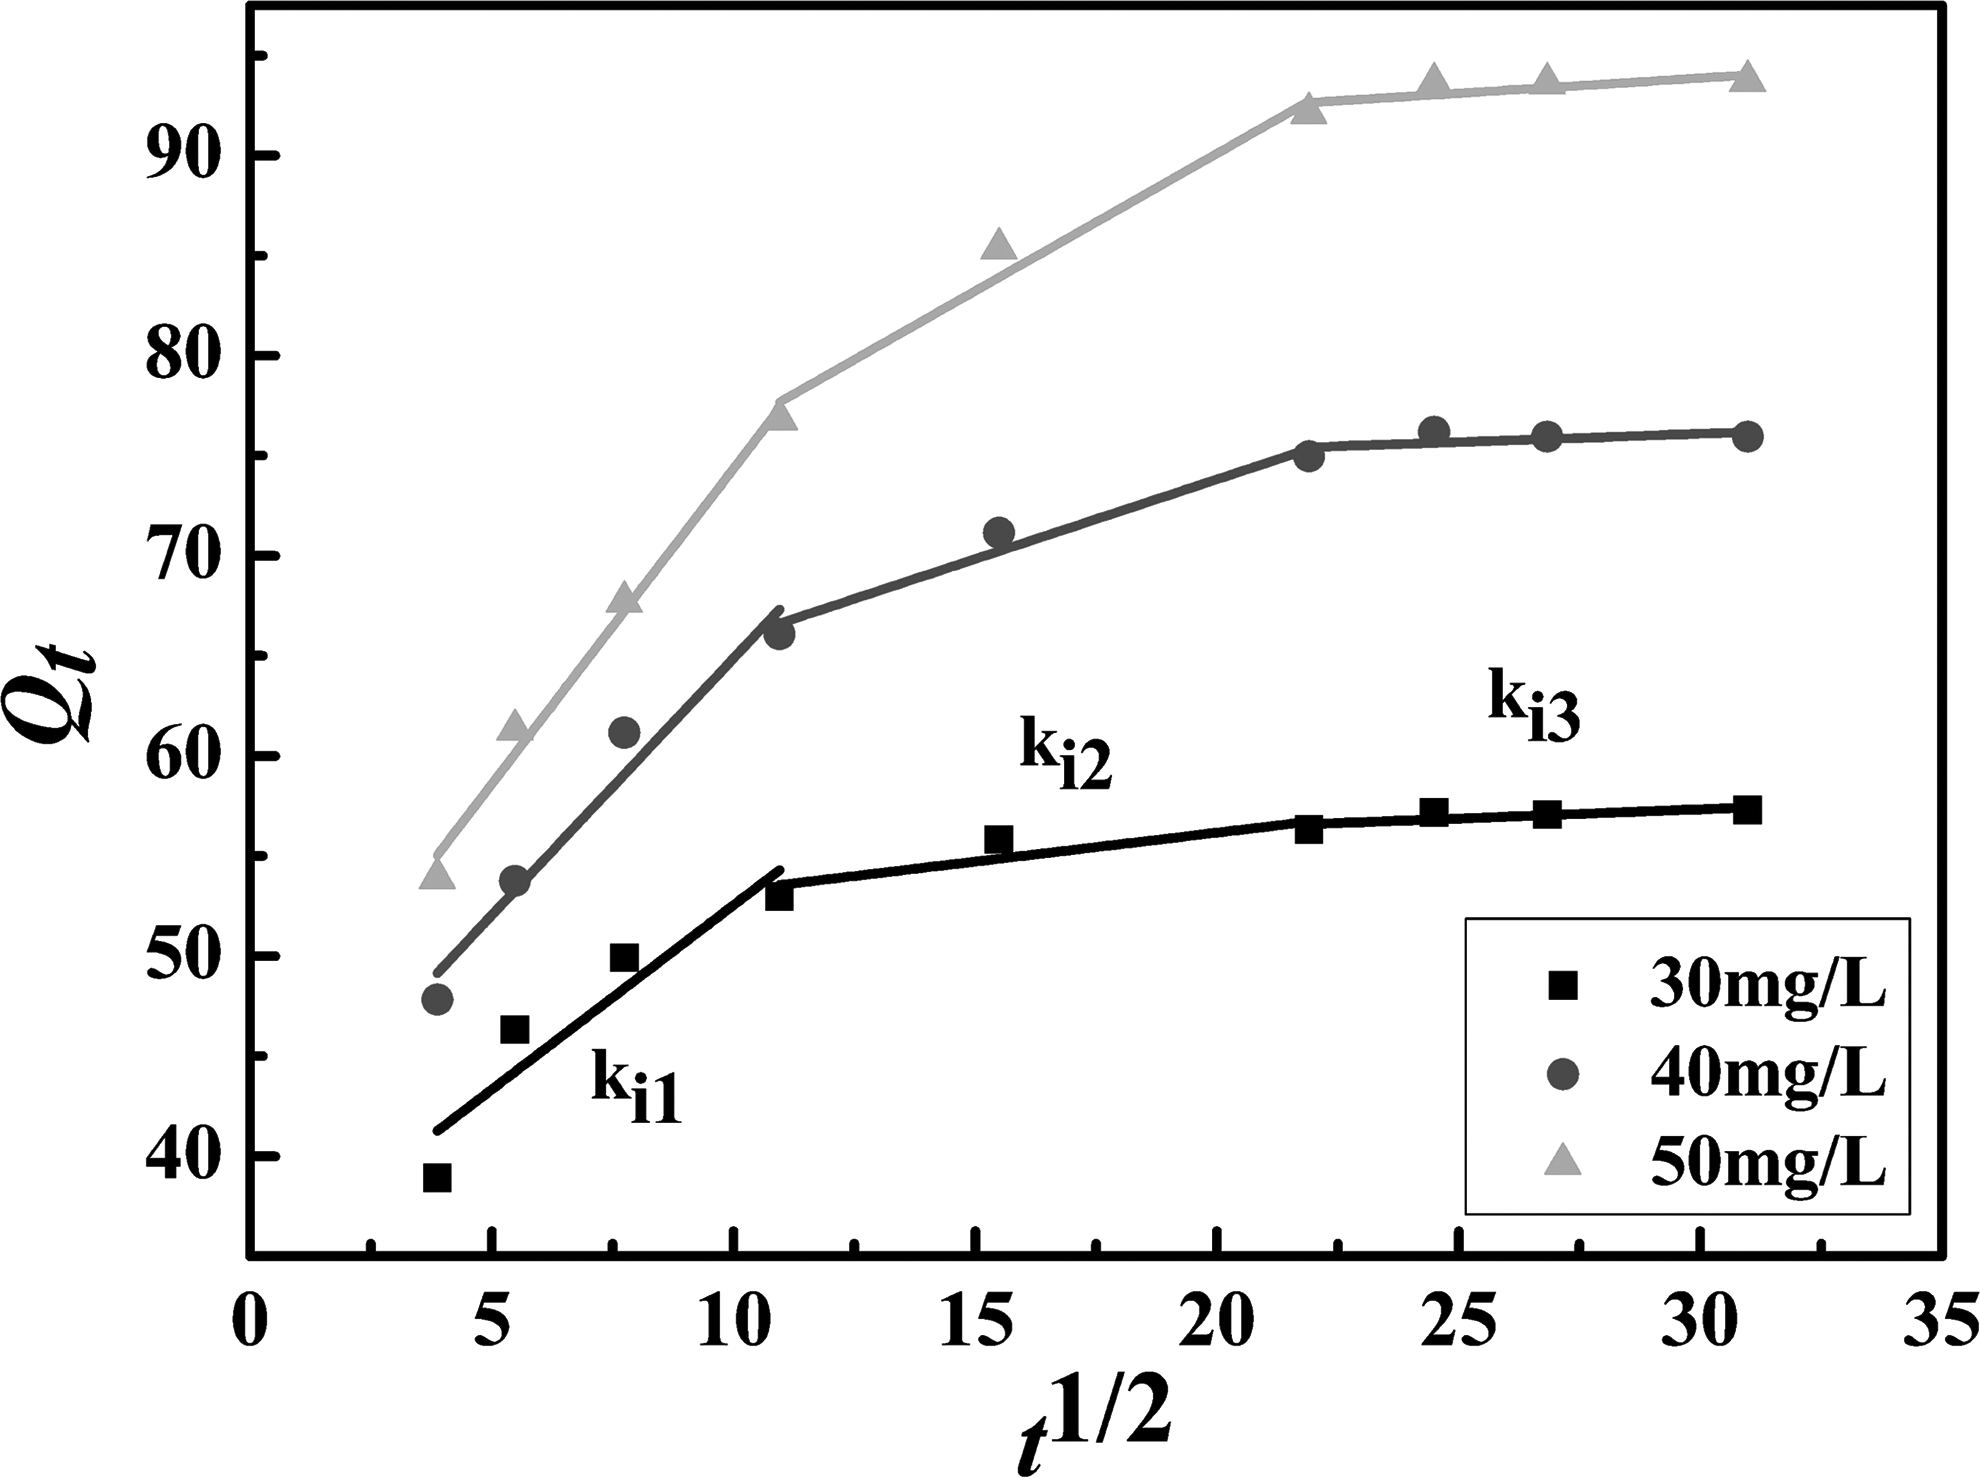
Intraparticle diffusion model of Ag(I) adsorption on Fe3O4/GO-NH2 nanocomposites (T: 298 K, pH: 5.0).
Adsorption isotherm
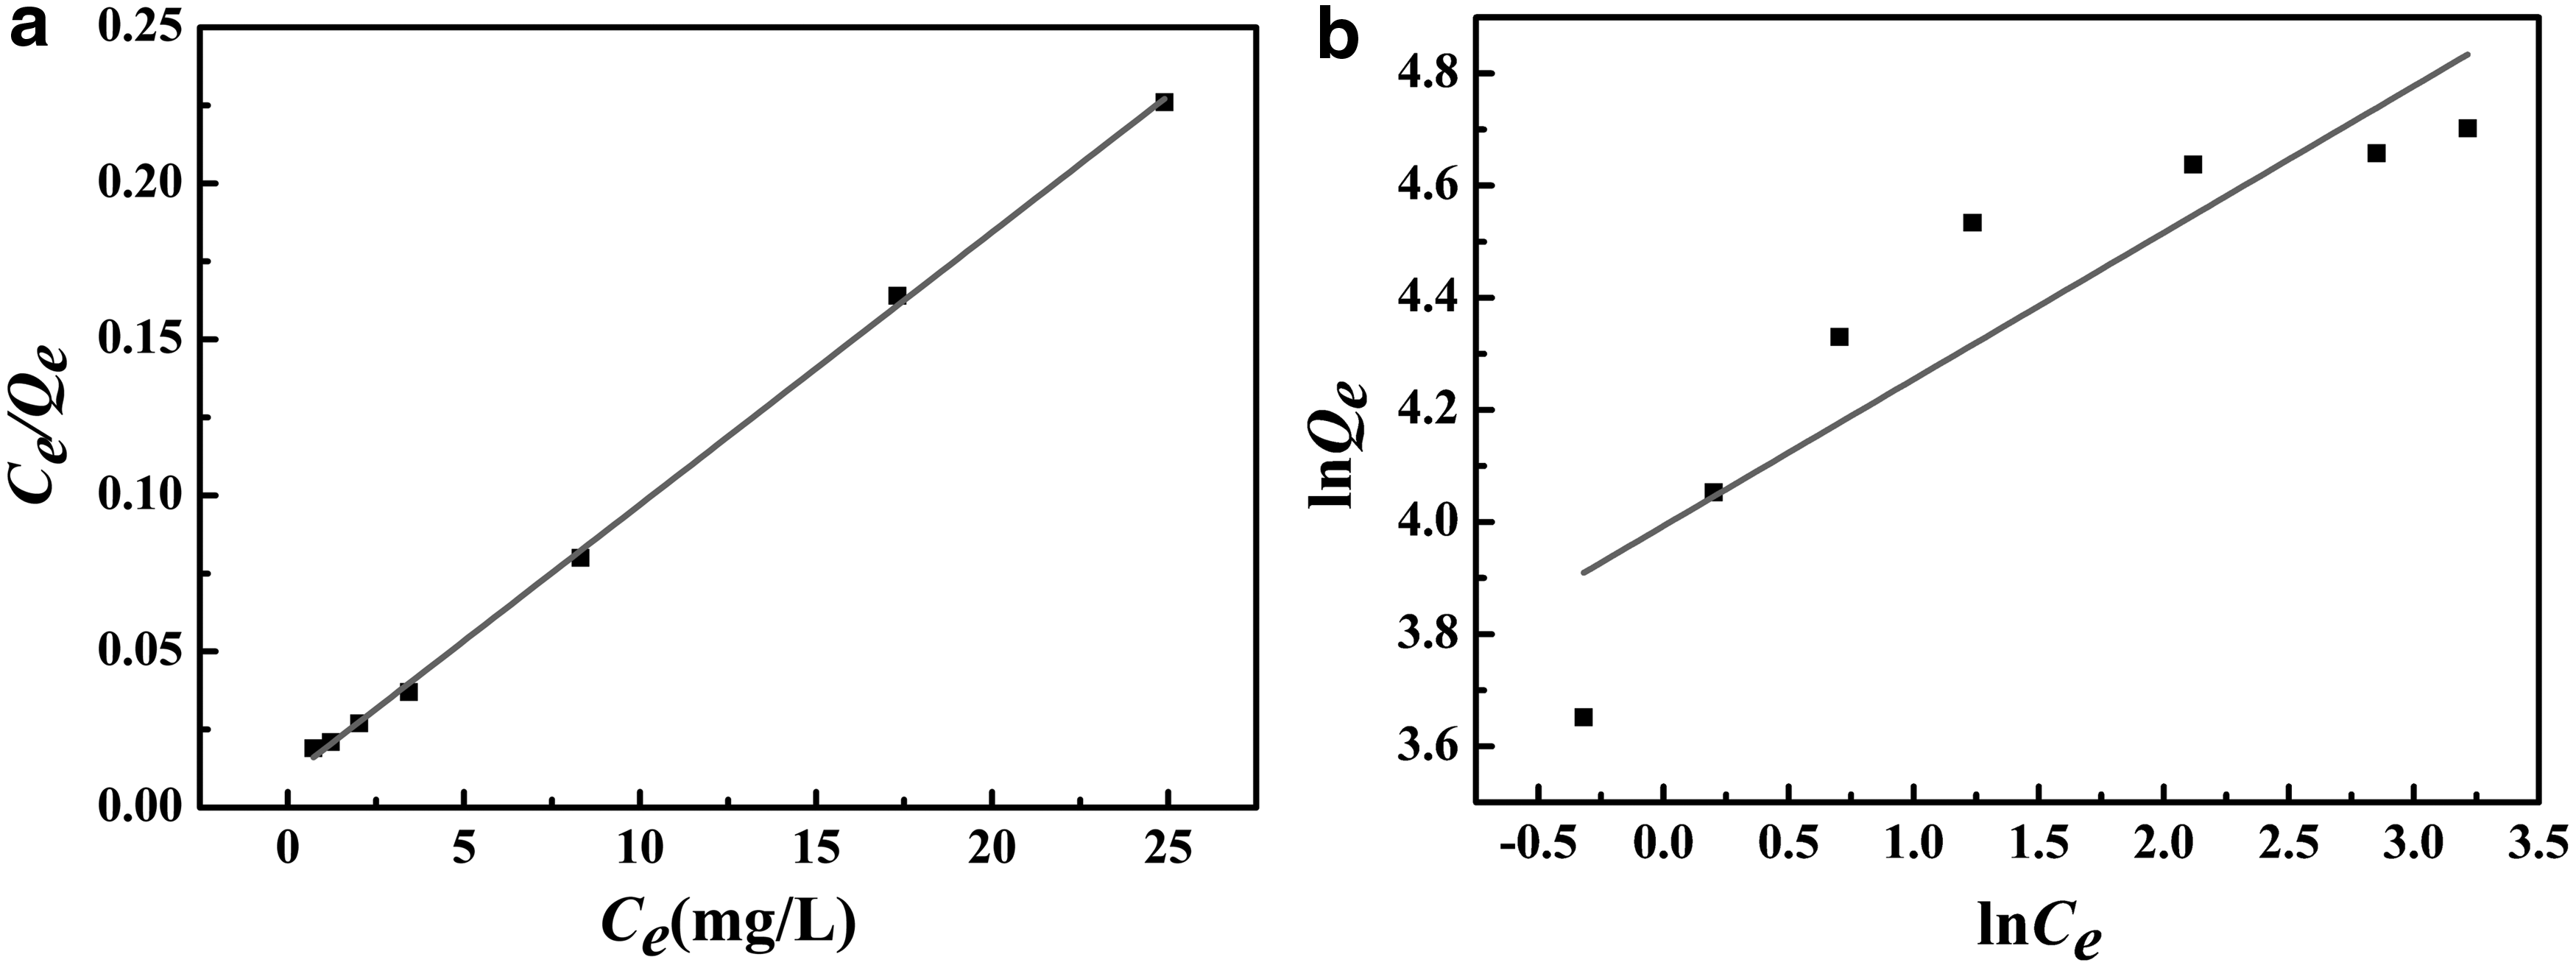
To further investigate the adsorption system, the experimental data were analyzed using two well-known isothermal adsorption models as follows: Langmuir model and Freundlich model. Twenty-five milligrams of Fe3O4/GO-NH2 nanocomposites was mixed with 50 mL solution containing different concentrations of Ag(I), the pH was 5.0, and the temperature was 298 K. The Langmuir model [Eq. (5)] and Freundlich model [Eq. (6)] were expressed as follows:
where Qe is the equilibrium adsorption capacity (mg/g), Qmax is the maximum adsorption capacity (mg/g), Ce is the concentration of remaining Ag(I) in solution at equilibrium time (mg/L), KL is Langmuir constant (L/mg), and KF (mg/g) and n are Freundlich constants.
Figure 13 shows the quantitative relationship between Ag(I) concentration and the adsorption isotherm models. At the same time, the calculated correlation coefficients and some of the constants are listed in Table 3. From Table 3, we can see that the value of correlation coefficient R2 calculated for the Langmuir model (R2 = 0.9990) was much higher compared with the Freundlich model (R2 = 0.7764), demonstrating that the adsorption of Ag(I) onto Fe3O4/GO-NH2 nanocomposites can be mainly considered as a monolayer adsorption process. The maximum adsorption capacity of Fe3O4/GO-NH2 nanocomposites for Ag(I) calculated by Langmuir isotherm model (Qmax) was 114.94 mg/g, which is close to the experimental results (114.90 mg/g). In addition, the maximum adsorption capacity of Fe3O4/GO-NH2 nanocomposites for Ag(I) was higher than some Qmax values of other adsorbents reported by literature (Table 4).
Langmuir model
Adsorption thermodynamics
Adsorption thermodynamics was performed using 25 mg adsorbent in 50 mL 50 mg/L Ag(I) solution at different temperatures (278, 288, 298, 308, and 318 K), with a contact time of 10 h. The thermodynamic parameters were used to study the nature of the adsorption. The thermodynamic parameters, including the Gibbs free energy (ΔG0), enthalpy (ΔH0), and entropy (ΔS0), were calculated by the equations as follows (Bai et al., 2015):
where Ci is the concentration of initial Ag(I) in aqueous solution (mg/L), and C is the concentration of absorbed Ag(I) in aqueous solution at equilibrium time (mg/L).
The straight lines in Fig. 14 are obtained by fitting lnKC to 1/T, the slope of the straight line is
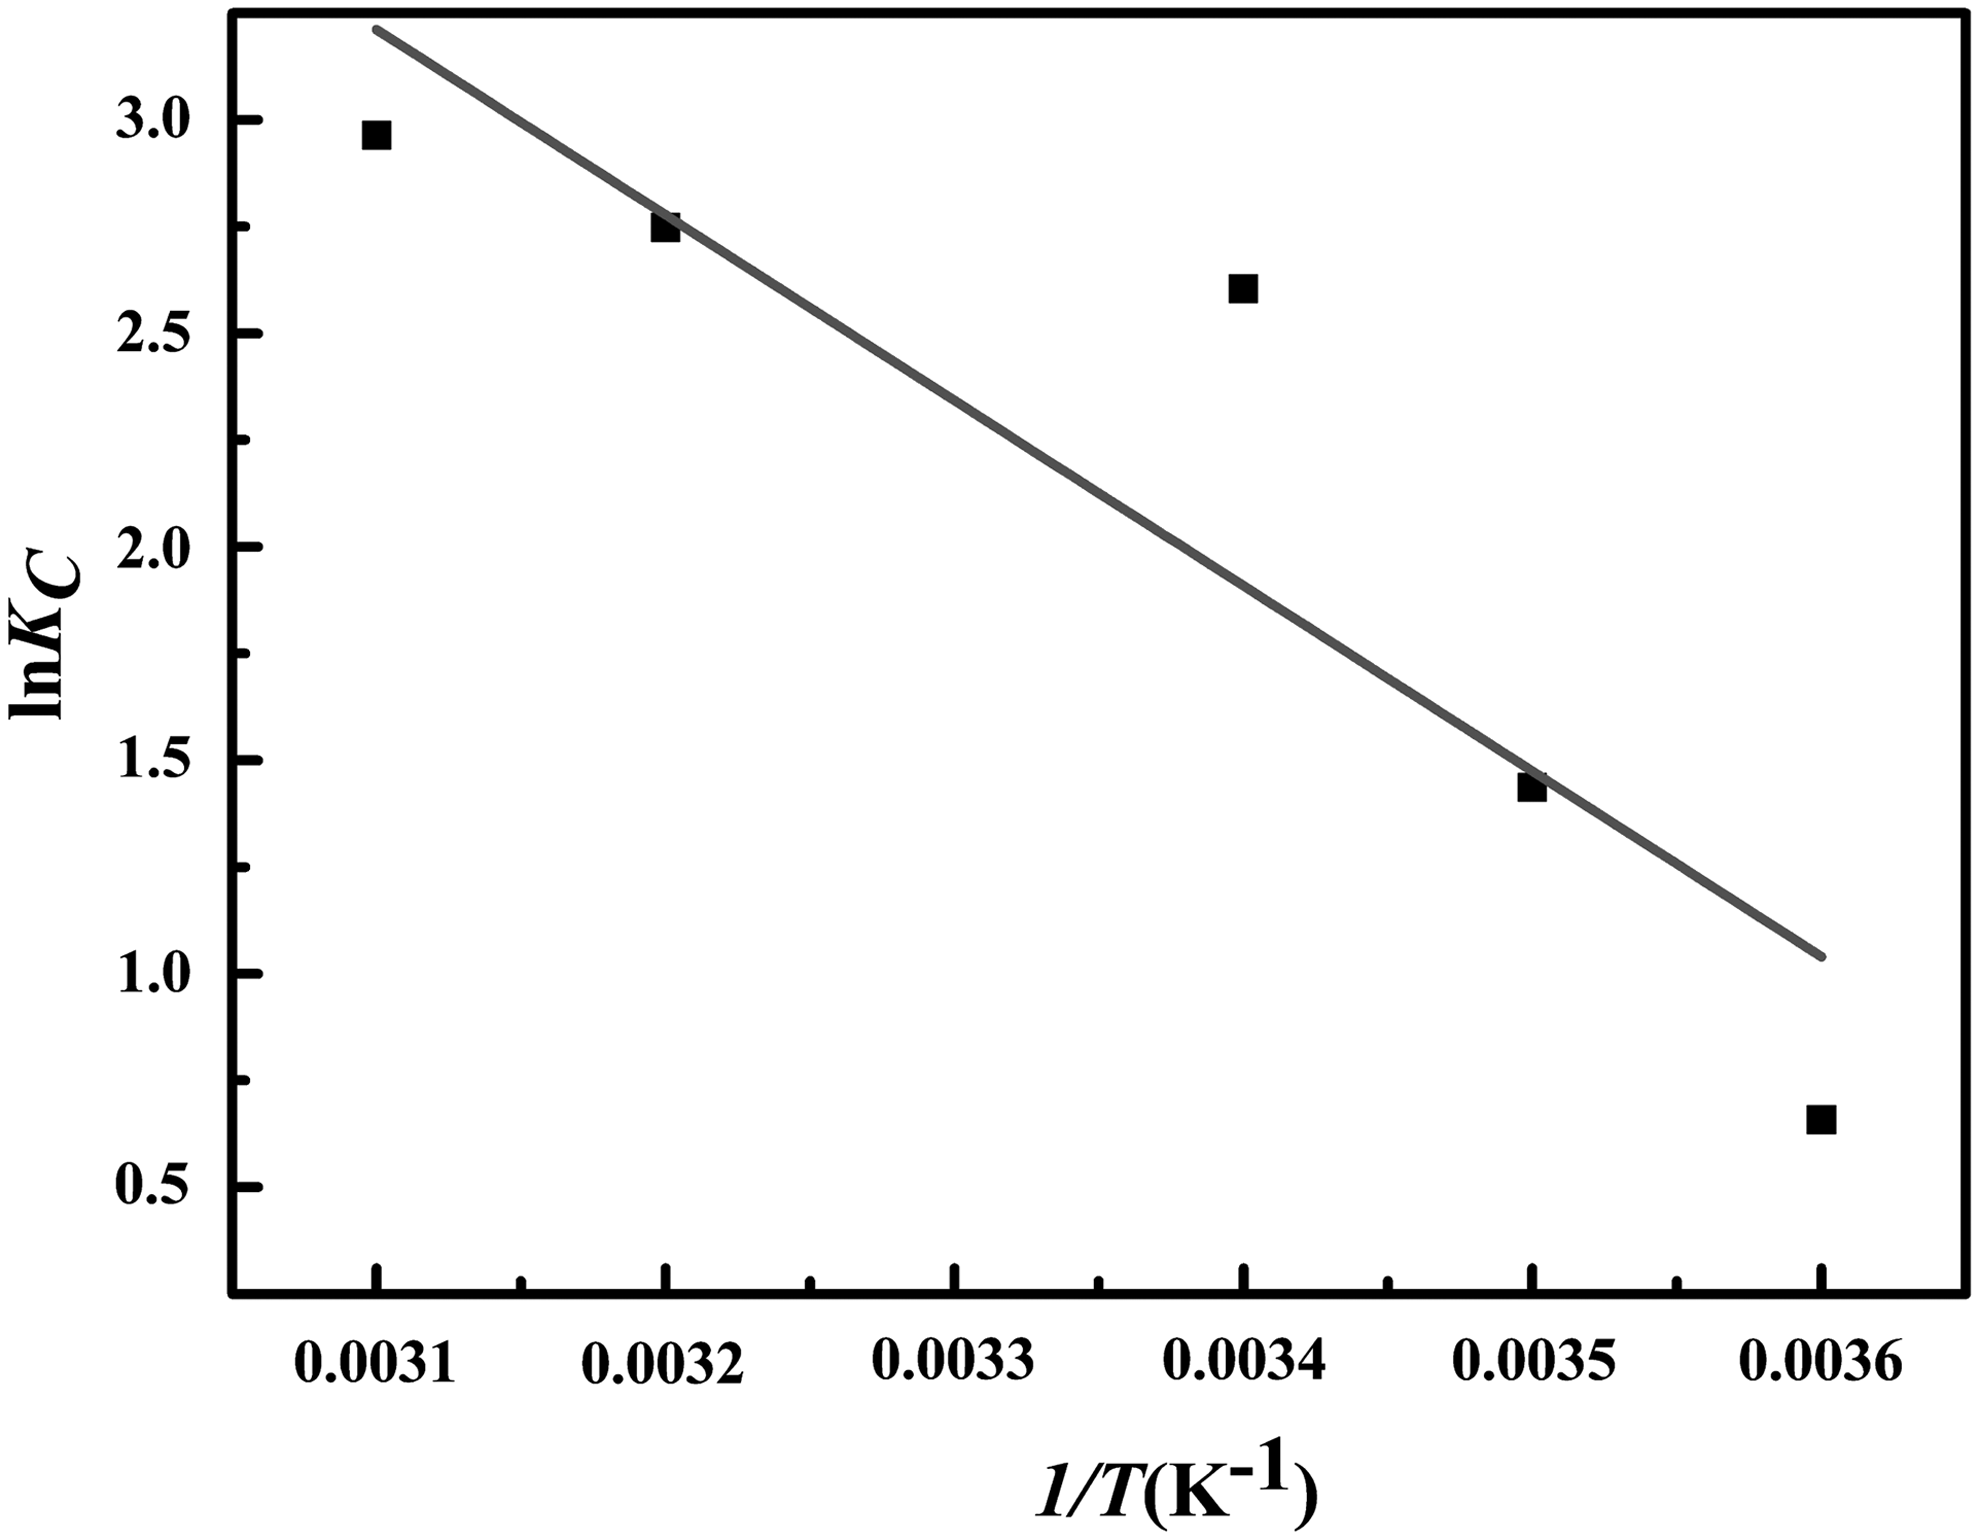
Relationship of lnKC and 1/T in the adsorption of Ag(I) on Fe3O4/GO-NH2 nanocomposites (C0: 50 mg/L, pH: 5.0, t: 10 h).
Conclusions
In summary, Fe3O4/GO-NH2 nanocomposites were successfully prepared. Ag(I) was reduced to silver in the process of the adsorption by Fe3O4/GO-NH2 nanocomposites. The maximum adsorption capacity of Fe3O4/GO-NH2 nanocomposites to Ag(I) was 114.90 mg/g. The adsorption process of Fe3O4/GO-NH2 nanocomposites for Ag(I) followed the pseudo-second-order kinetics, indicating that the adsorption process was mainly chemical adsorption. Equilibrium data were described well with the Langmuir isotherm model, demonstrating that the adsorption process can be mainly considered as a monolayer adsorption process. In addition, the adsorption of Ag(I) on Fe3O4/GO-NH2 nanocomposites was of spontaneity, endothermic, and a higher degree of freedom in the solid–liquid interface during the process of adsorption. Therefore, the method used for fabrication of Fe3O4/GO-NH2 nanocomposites could have possible industrial capability for large-scale nanocomposite production and actual use of this material as water decontaminant.
Footnotes
Acknowledgments
This work was supported by the National Natural Science Foundation of China (51403091) and the Postdoctoral Science Foundation of China (2015M572616).
Author Disclosure Statement
No competing financial interests exist.