
Abstract
Abstract
The Landsat 8 Operational Land Imager (OLI) was investigated for its performance in monitoring dynamic riverine surface water turbidity. China's Hanjiang River, the largest tributary of the Yangtze River, was used as a case study. Field surveys conducted between April 2013 and January 2014 show a wide range of turbidity (15.8–130.2 nephelometric turbidity units). A practical exponential retrieval algorithm used in conjunction with OLI bands on Landsat 8 was developed to assess compatibility between satellite remote sensing reflectance and in situ measured data. Results obtained for the study area accurately match in situ data at most stations (R2 > 0.90) for the validation phase. It was found that Landsat 8 OLI imagery can be used to estimate turbidity in inland riverine systems when a suitable retrieval algorithm is applied. In addition, algal blooms in the riverine system can be detected by OLI imagery.
Introduction
T
Well-established algorithms for recurrent ocean sensor monitoring of turbidity exist, employing reflectance in the blue and green color regions of oceans (Gordon and Franz, 2008; Neukermans et al., 2012). However, these algorithms may not be appropriate for inland water systems such as rivers due to differing optical properties of sea water bodies (Le et al., 2011; Yacobi et al., 2011; Li et al., 2012). Although some ocean color sensors possess short revisit times with high spectral resolution and sensitivity, which makes them suitable for studies of some inland water bodies such as large lakes or reservoirs (Shi et al., 2014, 2015; Zhang et al., 2016a), their spatial resolution is typically too coarse to adequately investigate riverine features, making them unsuitable for monitoring water quality variations in these systems (Ghabavati et al., 2008; Onderka and Pekárová, 2008; Yu et al., 2012).
Landsat sensors, such as the Landsat 5 (Thematic Mapper) and Landsat 7 (Enhanced Thematic Mapper Plus), may have longer revisit times and lower spectral and radiometric resolution than ocean-specific instruments, but possess higher spatial resolution. Accordingly, those sensors have been used for inland water studies (Vincent et al., 2004; Ma et al., Onderka and Pekárová, 2008; Kuster, 2012).
After the retirement of Landsat 5, the failure of Landsat 6, and limitations with Landsat 7, the Landsat 8 satellite was launched on February 11, 2013, and operations began on May 30 of the same year. With its nine bands, Landsat 8 imagery provides sufficient spatial resolution, in which features such as islands within rivers and bridges spanning rivers can be easily distinguished as highly reflective structures before a dark background (Vanhellemont and Ruddick, 2014). Compared with previous Landsat missions, Landsat 8 also offers higher signal-to-noise ratios. This is primarily the result of longer integration times associated with the push broom scanner as well as improved quantization (NASA, 2016; USGS, 2016). Because of inclusion of the Operational Land Imager (OLI), Landsat 8 has the potential to become the first Landsat sensor with the radiometric resolution necessary for retrieval of chlorophyll and suspended material constituents in oceans and lakes (Gerace et al., 2013; Pahlevan and Schott, 2013; Wu et al., 2015; Zhang et al., 2016b). However, few studies have applied Landsat 8 images to retrieve riverine water quality parameters.
Rapid economic development and anthropogenic activity in and around Hanjiang River have increased ecological pressure on its water quality, which is of great environmental importance to Hubei Province (Liu and Yu, 1992; Wang et al., 2004; Guo et al., 2014). In addition, the Danjiangkou Dam, which is on the upstream of the Hanjiang River and was originally constructed in 1958, has since been raised, and the Danjiangkou Reservoir, created by the construction of Danjiangkou Dam, has been used as part of the South-to-North Water Diversion Project (SNWDP) since 2014. Research has shown the probability that algal blooms will increase in the mid-downstream region of the Hanjiang River after completion of the SNWDP (Xie et al., 2004).
Therefore, comprehensive monitoring is needed to address changes in water quality in this area. Accordingly, the objectives of this study are to apply and evaluate the use of readily available imagery from Landsat 8 together with published literature to assess water turbidity changes in the inland riverine system.
Study Area and Data Processing
Study area
The Hanjiang River (historically called the Hanshui River) is a major tributary of the Yangtze River and has a total length of 1,577 km. The river originates in the mountainous region of southwestern Shaanxi and flows eastward across the southern expanse of the province. The Qin Mountains are north of the mouth of the river. Further north is the Wei River, the largest tributary of the Yellow River, which forms the southern boundary of the Ordos Loop. The Daba Mountains to the south of the river act as a natural boundary that separates Shaanxi Province from Sichuan Province and Chongqing City. The river flows southeastward through Hubei Province, connecting with the Yangtze River at Wuhan, the provincial capital.
In the study area (Fig. 1), the main cities along the Hanjiang River are Qianjiang City (population 1.1 million) to the west and Xiantao City (population 1.2 million) to the east. Both cities are located in the mid-downstream region of Hanjiang River. The area belongs to the subtropical monsoon climate zone, with mild climate characterized by four distinct seasons, abundant rainfall, a long (256 days) frost-free period, 2002.6 annual average sunshine hours, and an average annual temperature of 16.3°C. The division into seasons is based on an average temperature below 10°C during winter, a temperature above 22°C during summer, and temperatures between 10°C and 22°C during spring and autumn. Spring lasts from roughly mid-March to mid-May (about 70 days), summer from late May to mid-September (about 120 days), autumn from late September to mid-November (about 65 days), and winter from late November to early March (about 110 days). In the study area, the southern part of the Hanjiang River is characterized by industrial installations, including auto part, pharmaceutical, chemical, electronic, and nonwoven fabric factories, while the northern part of the river is mainly characterized by aquaculture and farming.
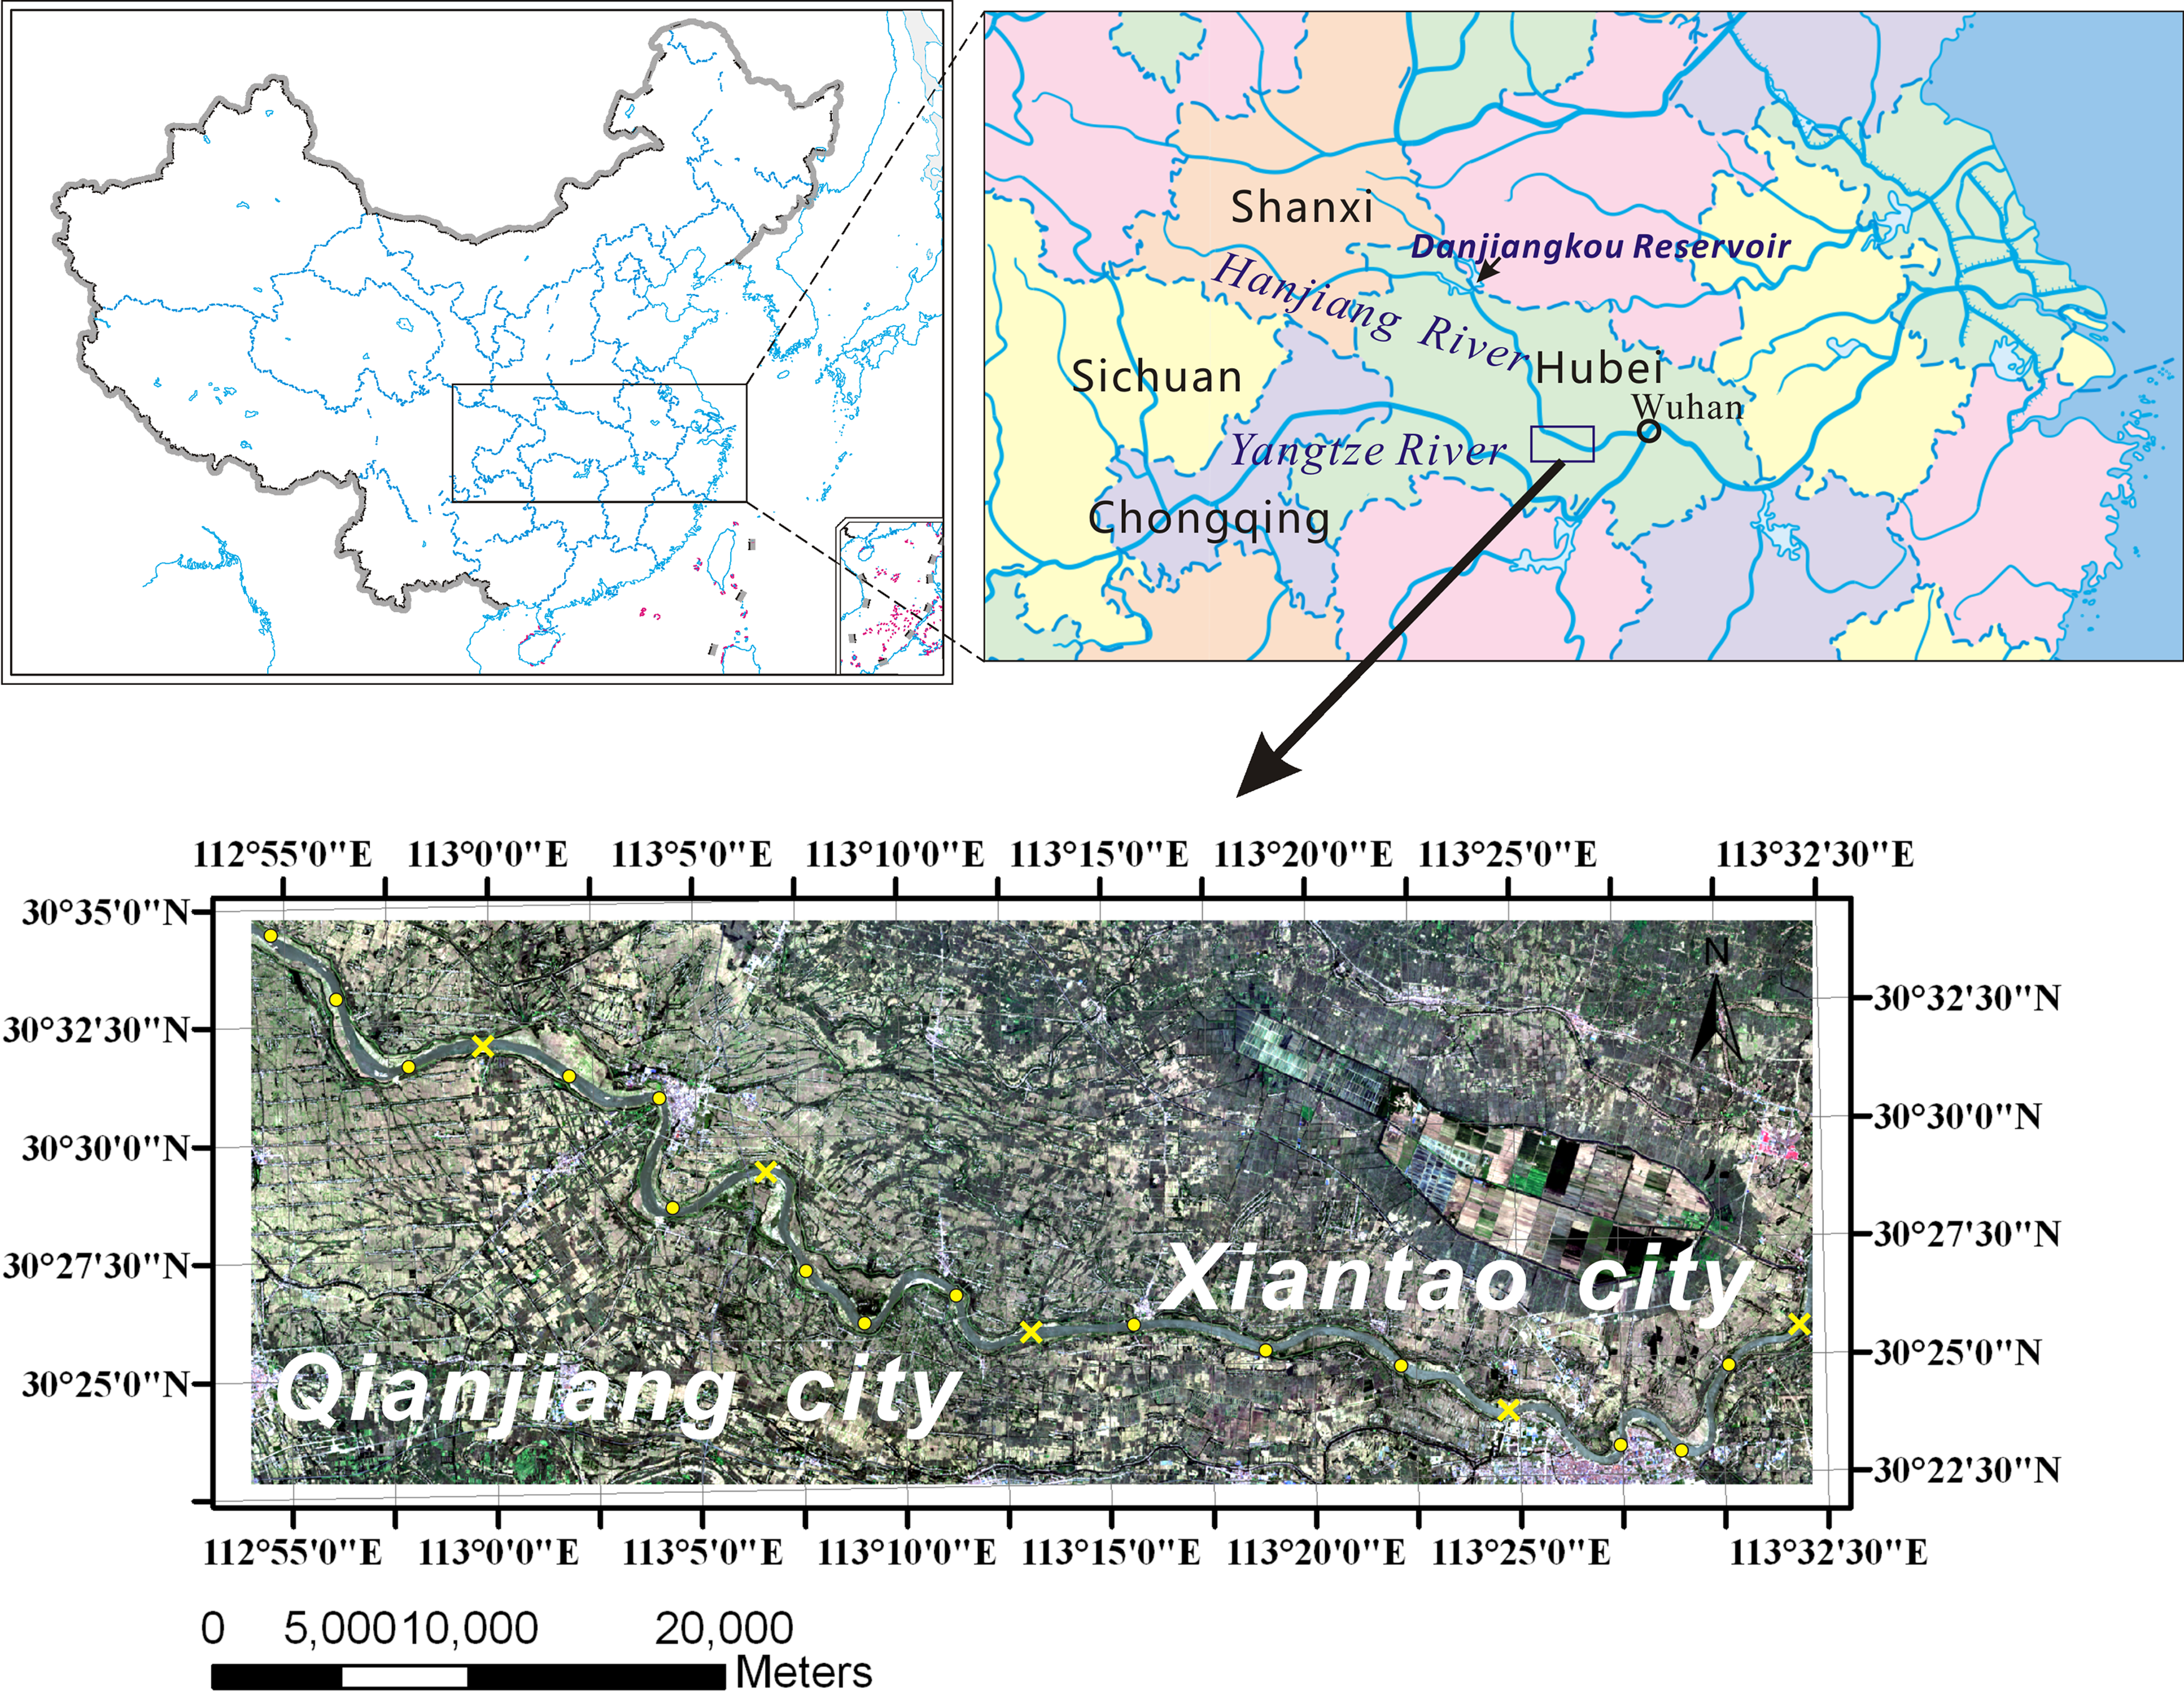
Mosaic map made with Landsat 8 image (Red: 630–680 nm, Green: 525–600 nm, Blue: 450–515 nm) collected on June 13, 2013, showing the study area and location of Hanjiang River in China. Yellow points represent the data of 15 samples for modeling of each image. Yellow cross represents the data of 5 samples for validation of each image.
Field survey data
Four field surveys were conducted in the study area between April 2013 and January 2014. Twenty water samples were collected during each survey, including 15 samples for modeling and 5 samples for validation (the position of each sample is provided in Fig. 1). In total, 80 water samples for surface turbidity were collected. At each station, the distance between two adjacent data collection sites was 2–3 km. Surface water turbidity was measured in situ using a 2100P Hach Turbidimeter (Hach Company, Loveland, Colorado), and the longitudes and latitudes for each sampling location were obtained using a Global Positioning System receiver (Garmin Ltd., Lenexa, KS). Description of measured turbidity is provided in Table 1 and Fig. 2.

Distribution of measured turbidity in this study (Total data of 80 samples).
NTU, nephelometric turbidity units.
Remote sensing data
The OLI instrument on Landsat 8 is a nine-band push broom scanner with a swath width of 185 km, eight channels at 30-m spatial resolution, and one panchromatic channel at 15-m spatial resolution. Five good-quality Level 1T OLI images were obtained from the U.S. Geological Survey (USGS) website (http://earthexplorer.usgs gov). The images covering the area downstream of the Hanjiang River were examined in detail (Table 2). With reference to some published literatures (Shi et al., 2015; Zhang et al., 2016b), turbidity was investigated using OLI band 1 (433–453 nm, which was not featured on previous Landsat satellites), band 2 (450–515 nm), band 3 (525–600 nm), band 4 (630–680 nm), and band 5 (845–885 nm).
OLI, Operational Land Imager.
Data preprocessing of OLI imagery
Standard Landsat 8 OLI images consist of quantized, calibrated, and scaled digital numbers (DNs) representing multispectral image data, which are delivered in 16-bit unsigned integer format. The DN values were rescaled to the top-of-atmosphere (TOA) reflectance using the equation provided by the USGS (http://landsat.usgs.gov Landsat8_Using_Product.php).
The TOA reflectance is a linear sum of various contributions, including molecules (Rayleigh scattering), aerosols (Rayleigh–aerosol interactions), and water (Wang et al., 2007). An atmospheric correction is used to derive water-leaving reflectance by removing atmosphere and water surface effects from TOA reflectance. Shortwave infrared (SWIR) bands have much stronger water absorption than near-infrared bands, thus the black water assumption for atmospheric correction is generally valid in the SWIR region, even for very turbid waters (Wang et al., 2007). Therefore, assuming the water-leaving reflectance at the SWIR bands is zero, a simplified method was employed to estimate the water-leaving reflectance of Landsat 8 OLI visible and infrared bands by removing the total atmosphere and water surface effects using Equation (1):
where Rrs(
Topographic maps at a scale of 1:50,000 were used to register the atmospherically corrected image to Beijing 54/Gauss–Kruger projection using first-order polynomial and nearest-neighbor resampling methods, and the root mean square error (RMSE) of positional accuracy was within half a pixel. The projected image was reprojected to WGS 84/UTM, and land areas and small water bodies were removed using a binary mask created from unsupervised classification of images.
Formulation of retrieval algorithm
Landsat 8 OLI band satellite Rrs(
Several studies have shown that single bands or band combinations from Landsat series imagery can be used in turbidity or suspended matter mapping for inland water systems (Onderka and Pekárová, 2008; Wu et al., 2015). To obtain the optimal retrieval algorithm, descriptive statistics of turbidity measurements and their corresponding Landsat 8 OLI image band 1–5 values were analyzed with the support of SPSS software (IBM. Co., Armonk) to formulate settings. The coefficient of determination (R2) and RMSE of all calibrated models were compared with select ten regression models with sufficient goodness of fit for estimating turbidity (Table 3).
R2, coefficient of determination used for retrieval and measured values obtained from the established database; RMSE, root mean square error.
For each calibrated Landsat 8-based turbidity retrieval model, the coefficient of determination (R2) between the validation data and estimated turbidity, as well as the RMSE, mean absolute error (MAE), and mean absolute percentage error (MAPE), was calculated to assess the performance of the best, stable, Landsat 8-based turbidity model.
Table 4 provides model error comparisons derived during the validation phase. Tables 3 and 4 show that the tenth model outperformed the others both in establishment and validation. Taking this into account, the optimal algorithm that produced the highest determination coefficient is as follows:
where X is the combination factor of Rrs at band 1, band 2, and band 3, obtained from the Landsat 8 OLI. The coefficient of determination (R2) is 0.92 for the establishment phase and 0.93 for the validation phase (Fig. 3). An F-test showed that both establishment and validation are significant below 0.01.
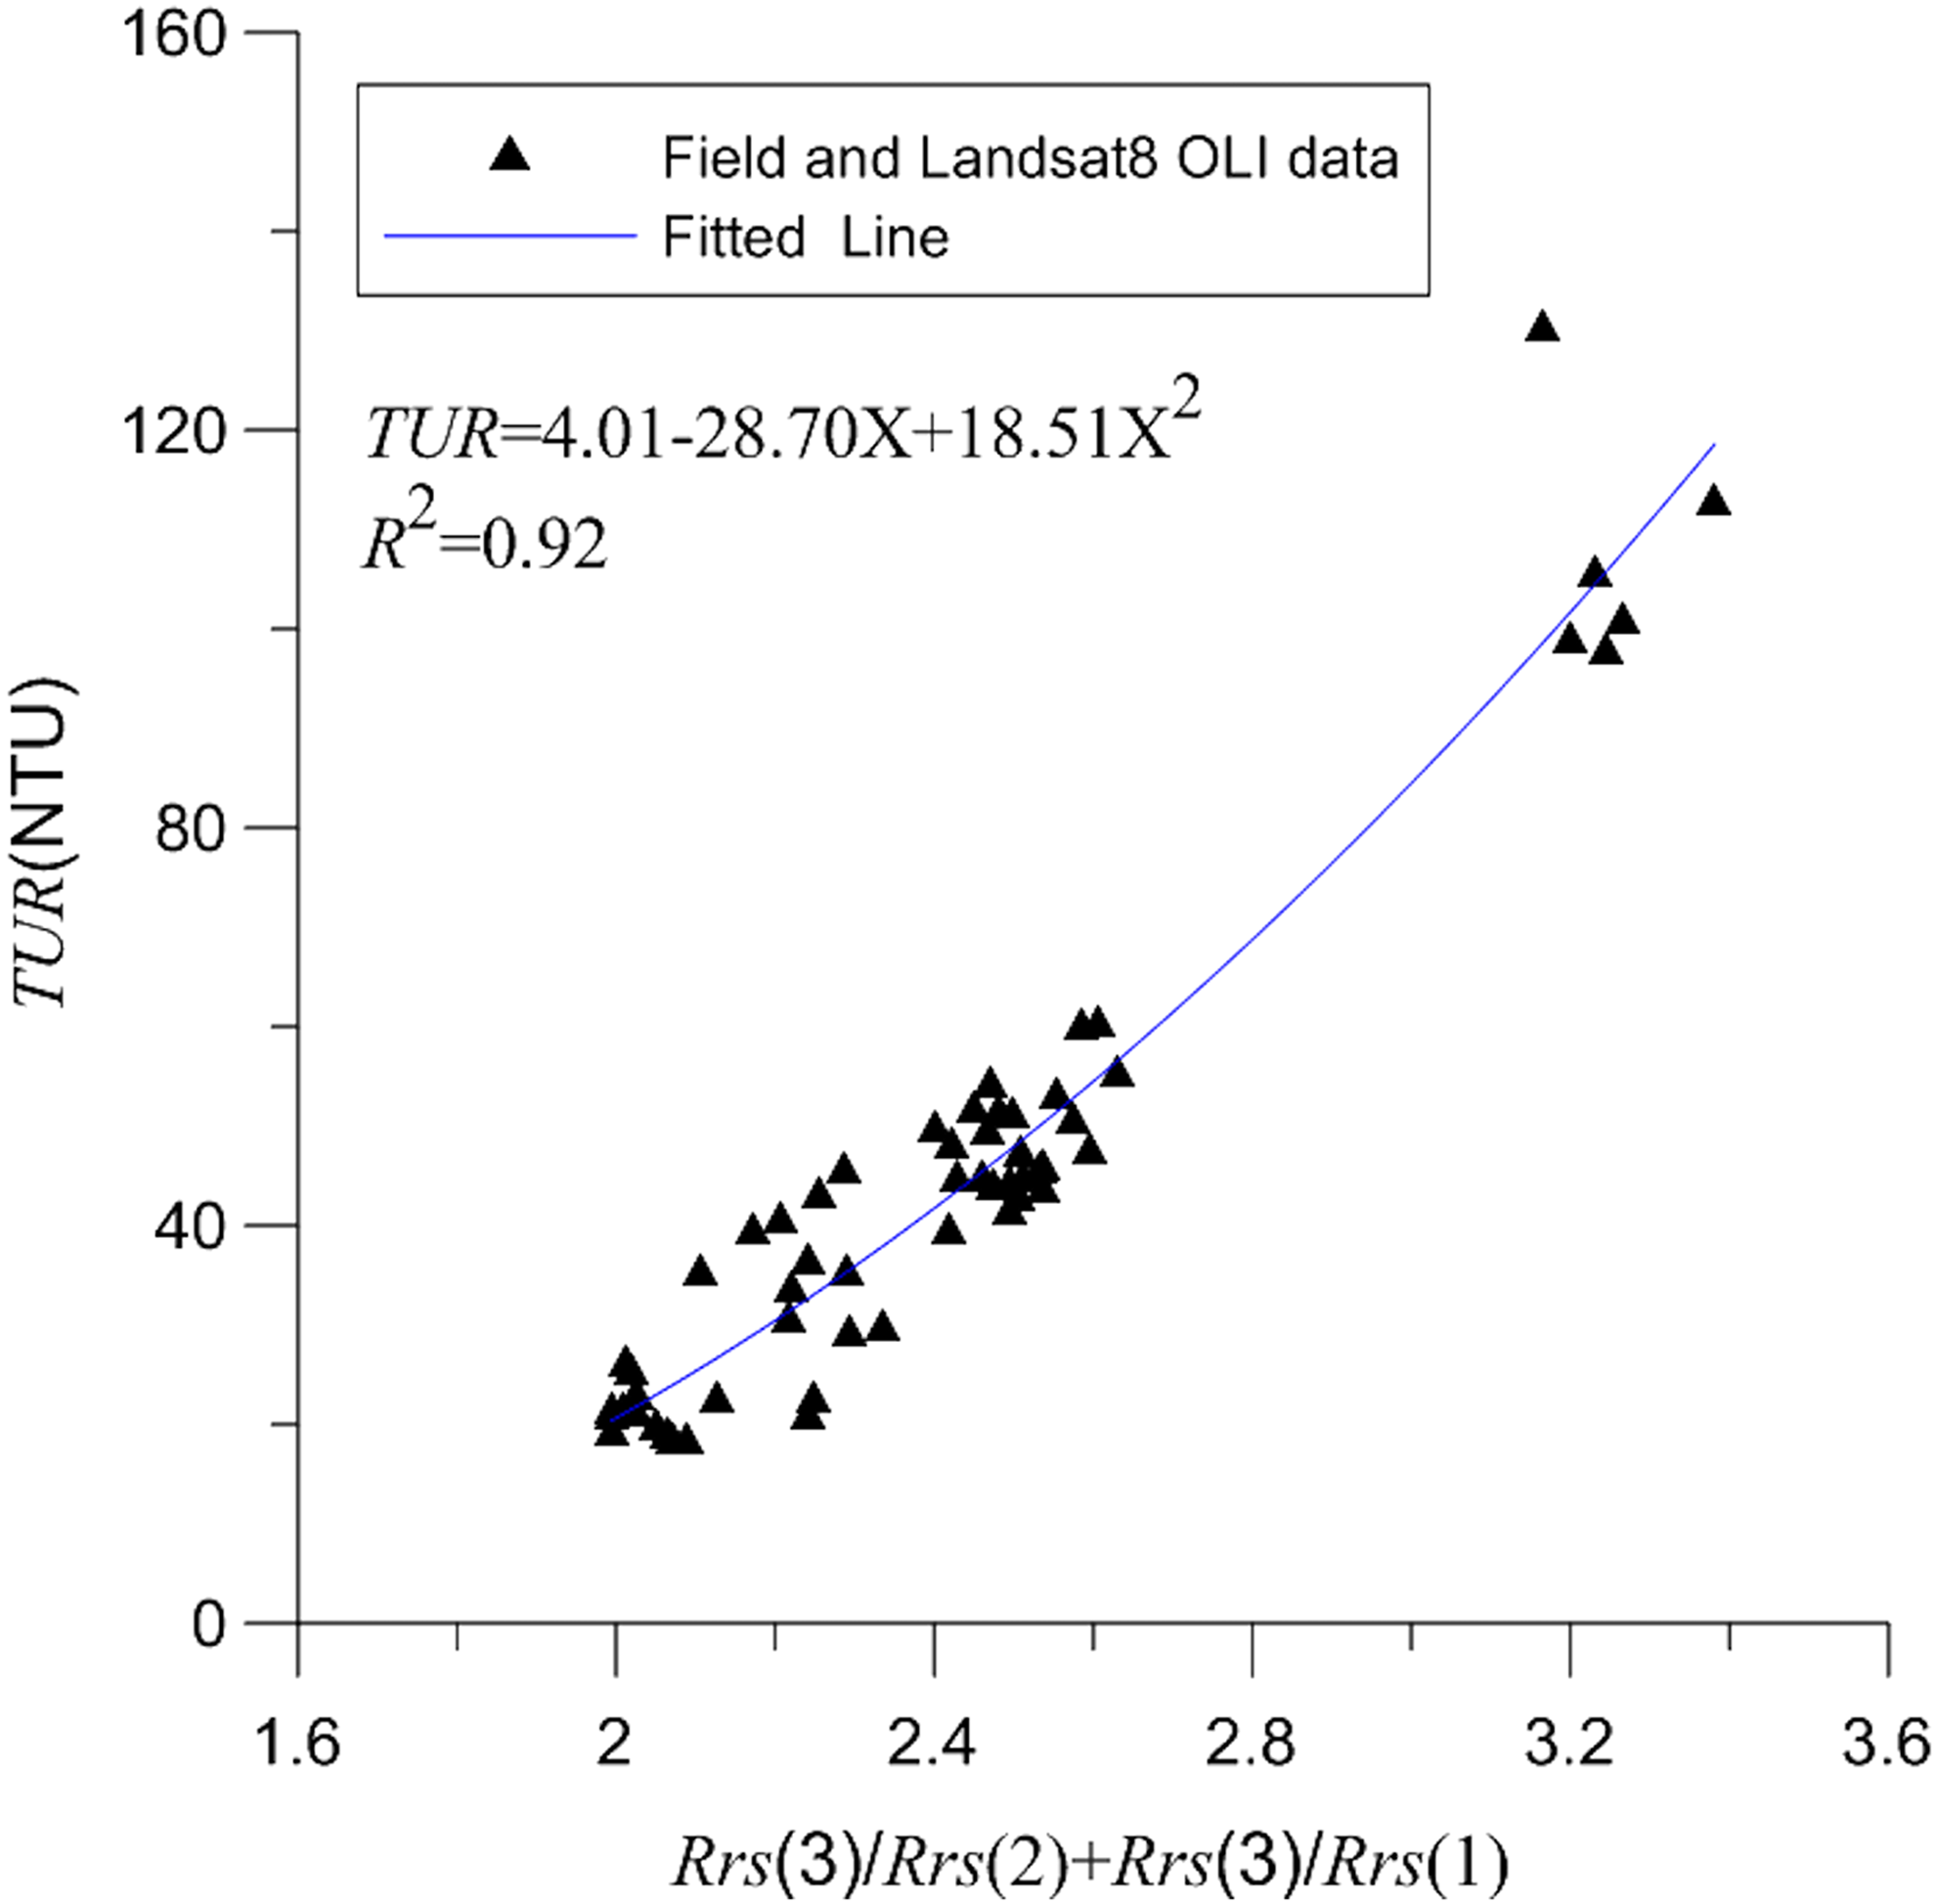
Scatter plot and coefficient of determination between Tur and the combination factor of X consisting of Rrs at bands 1, 2, and 3 of Landsat 8 OLI. OLI, Operational Land Imager.
MAE, mean absolute error; MAPE, mean absolute percentage error.
The measured and estimated turbidity data are distributed along a 1:1 line (Fig. 4), indicating that the statistical model can be used to estimate turbidity in the study area of the Hanjiang River. In addition, the MAE, RMSE, and MAPE of the validation data are 6.03 nephelometric turbidity units (NTU), 7.36 NTU, and 18.96%, respectively.

Estimated turbidity from statistical model (10th) plotted against measured turbidity for the validation data set.
Results
The most stable of Landsat 8-based turbidity retrieval model from formulation set was applied to Landsat 8 OLI images taken on April 26, June 13, and November 20, 2013, and January 23, 2014, to retrieve the spatial distribution of turbidity in the Hanjiang River (Fig. 5).
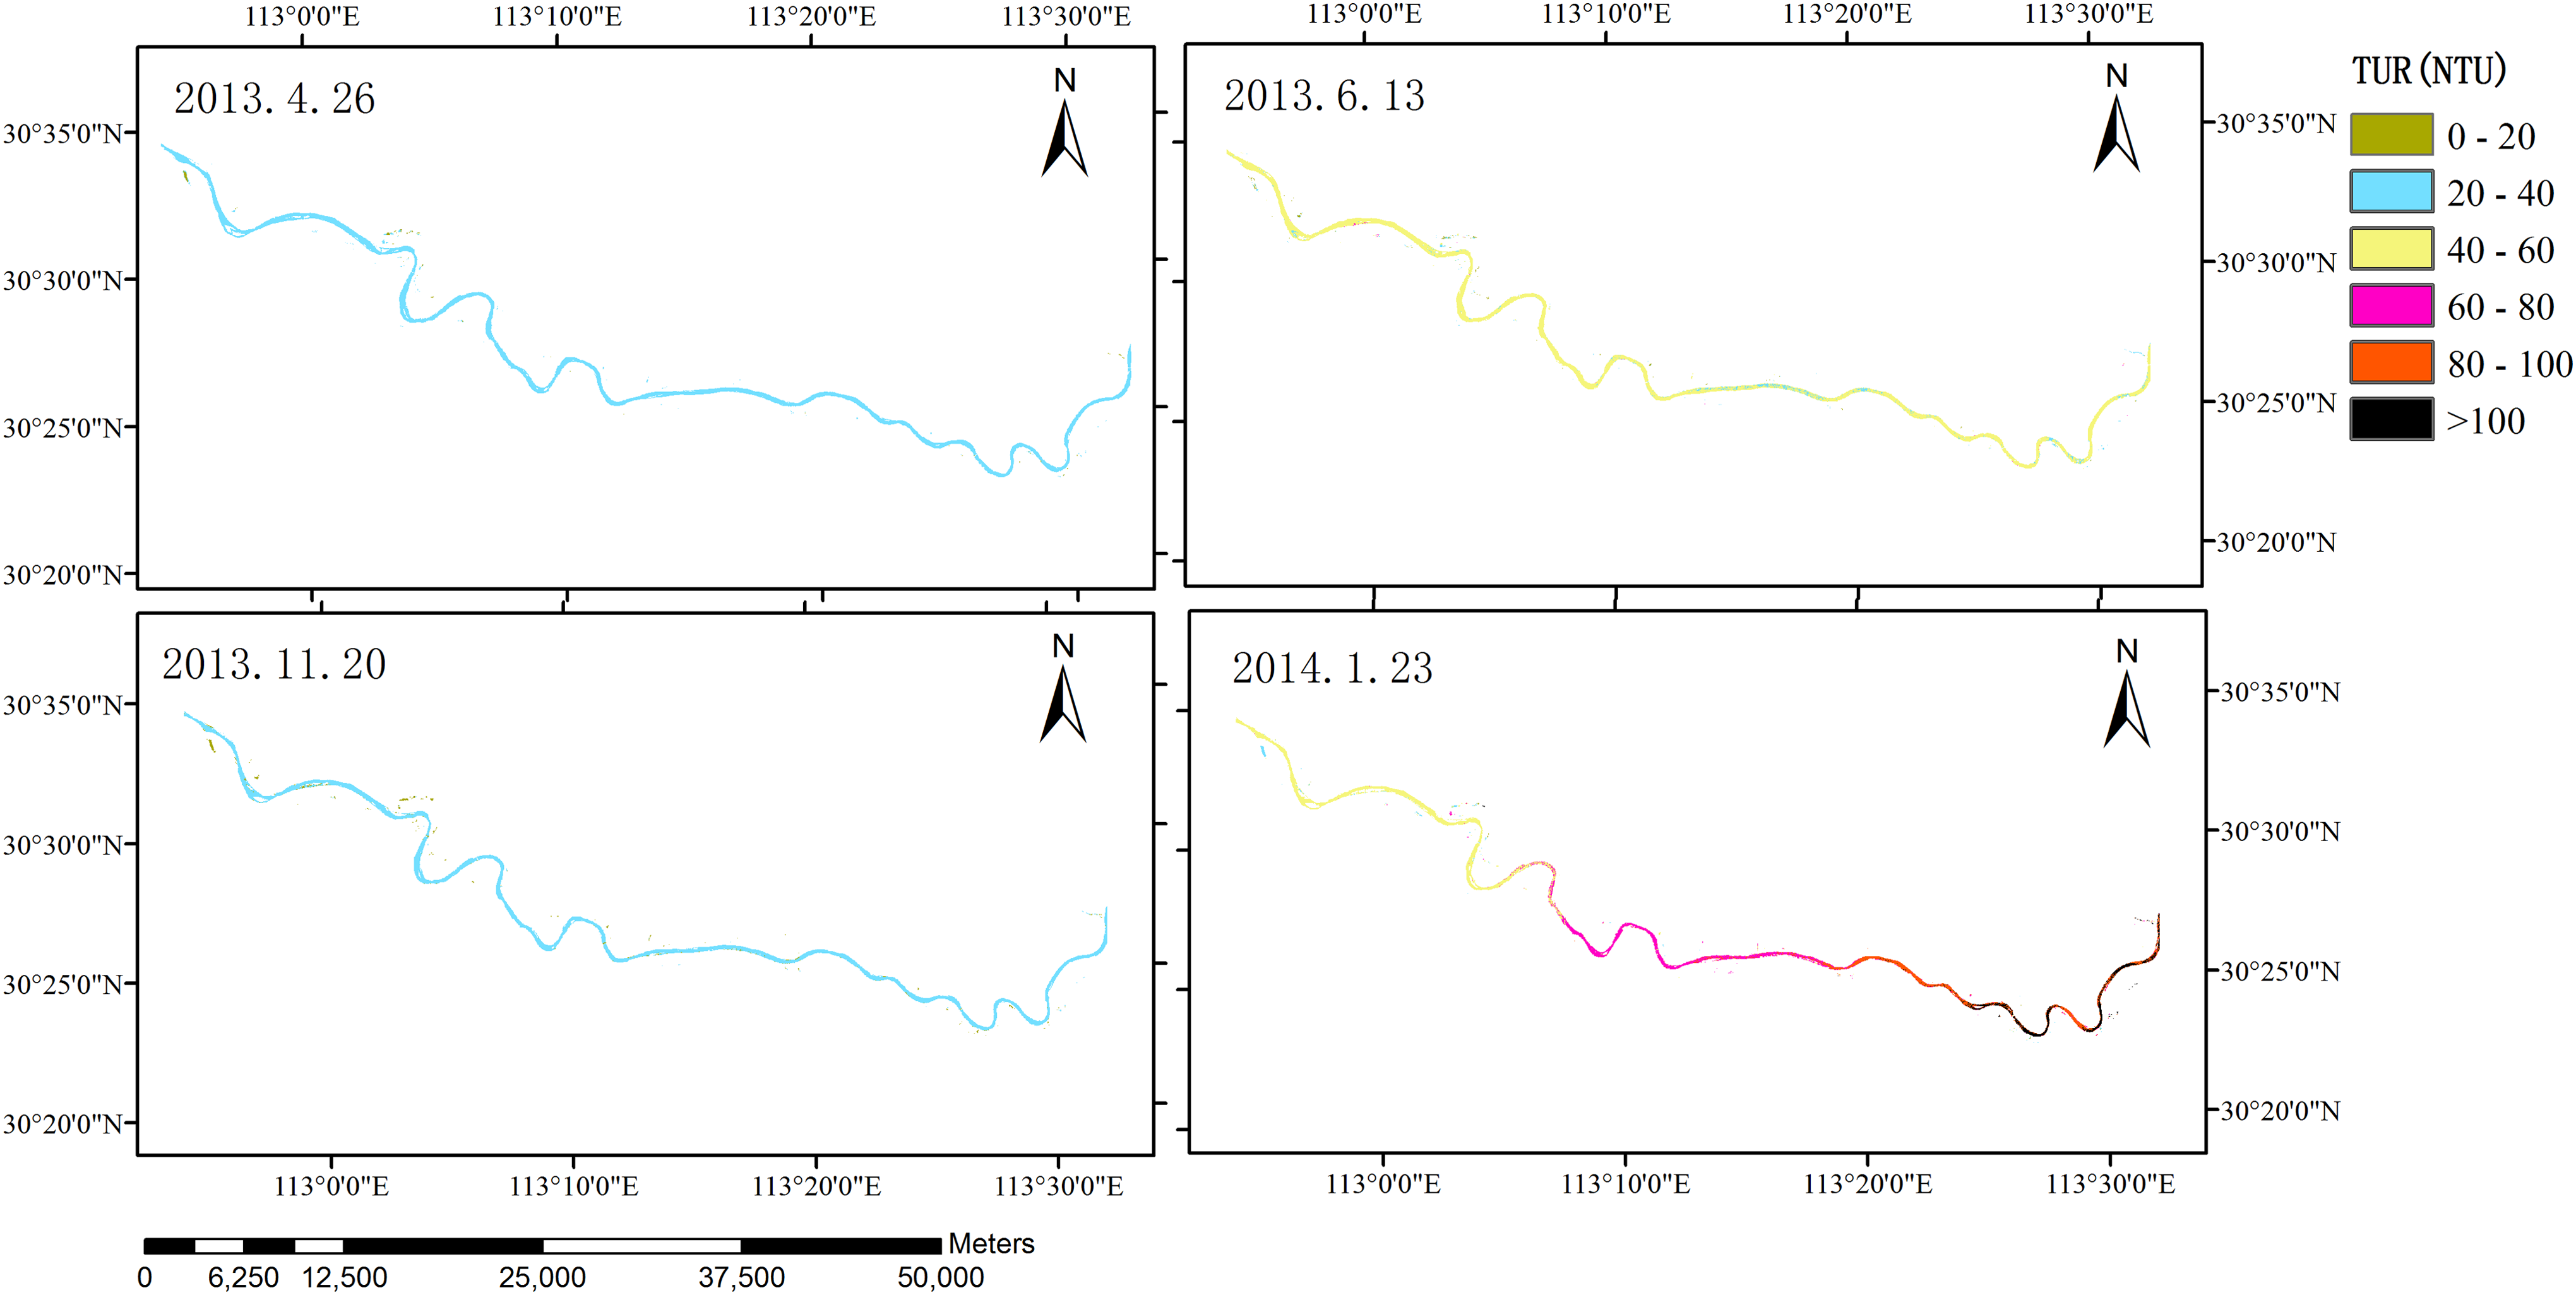
Turbidity distribution estimated from first four Landsat 8 OLI images.
The distribution frequency and descriptive statistics of derived turbidity from the four images were calculated (Table 5 and Fig. 6). The turbidity on April 26, 2013, ranged from 13.8 to 42.7 NTU with a mean of 35.6 NTU. On June 13, 2013, turbidity ranged from 35.6 to 65.5 NTU with a mean of 53.2 NTU. On November 20, 2013, turbidity ranged from 12.8 to 29.9 NTU with a mean of 25.3 NTU. On January 23, 2014, turbidity ranged from 45.1 to 150.6 NTU with a mean of 80.7 NTU. To analyze distribution of the results from different stations, turbidity acquired from OLI imagery was compared with in situ data (Table 1). Tables 3 and 4 and Figs. 3 and 4 show that the turbidity retrieved from the selected statistical model closely matches in situ data for most of the study area.
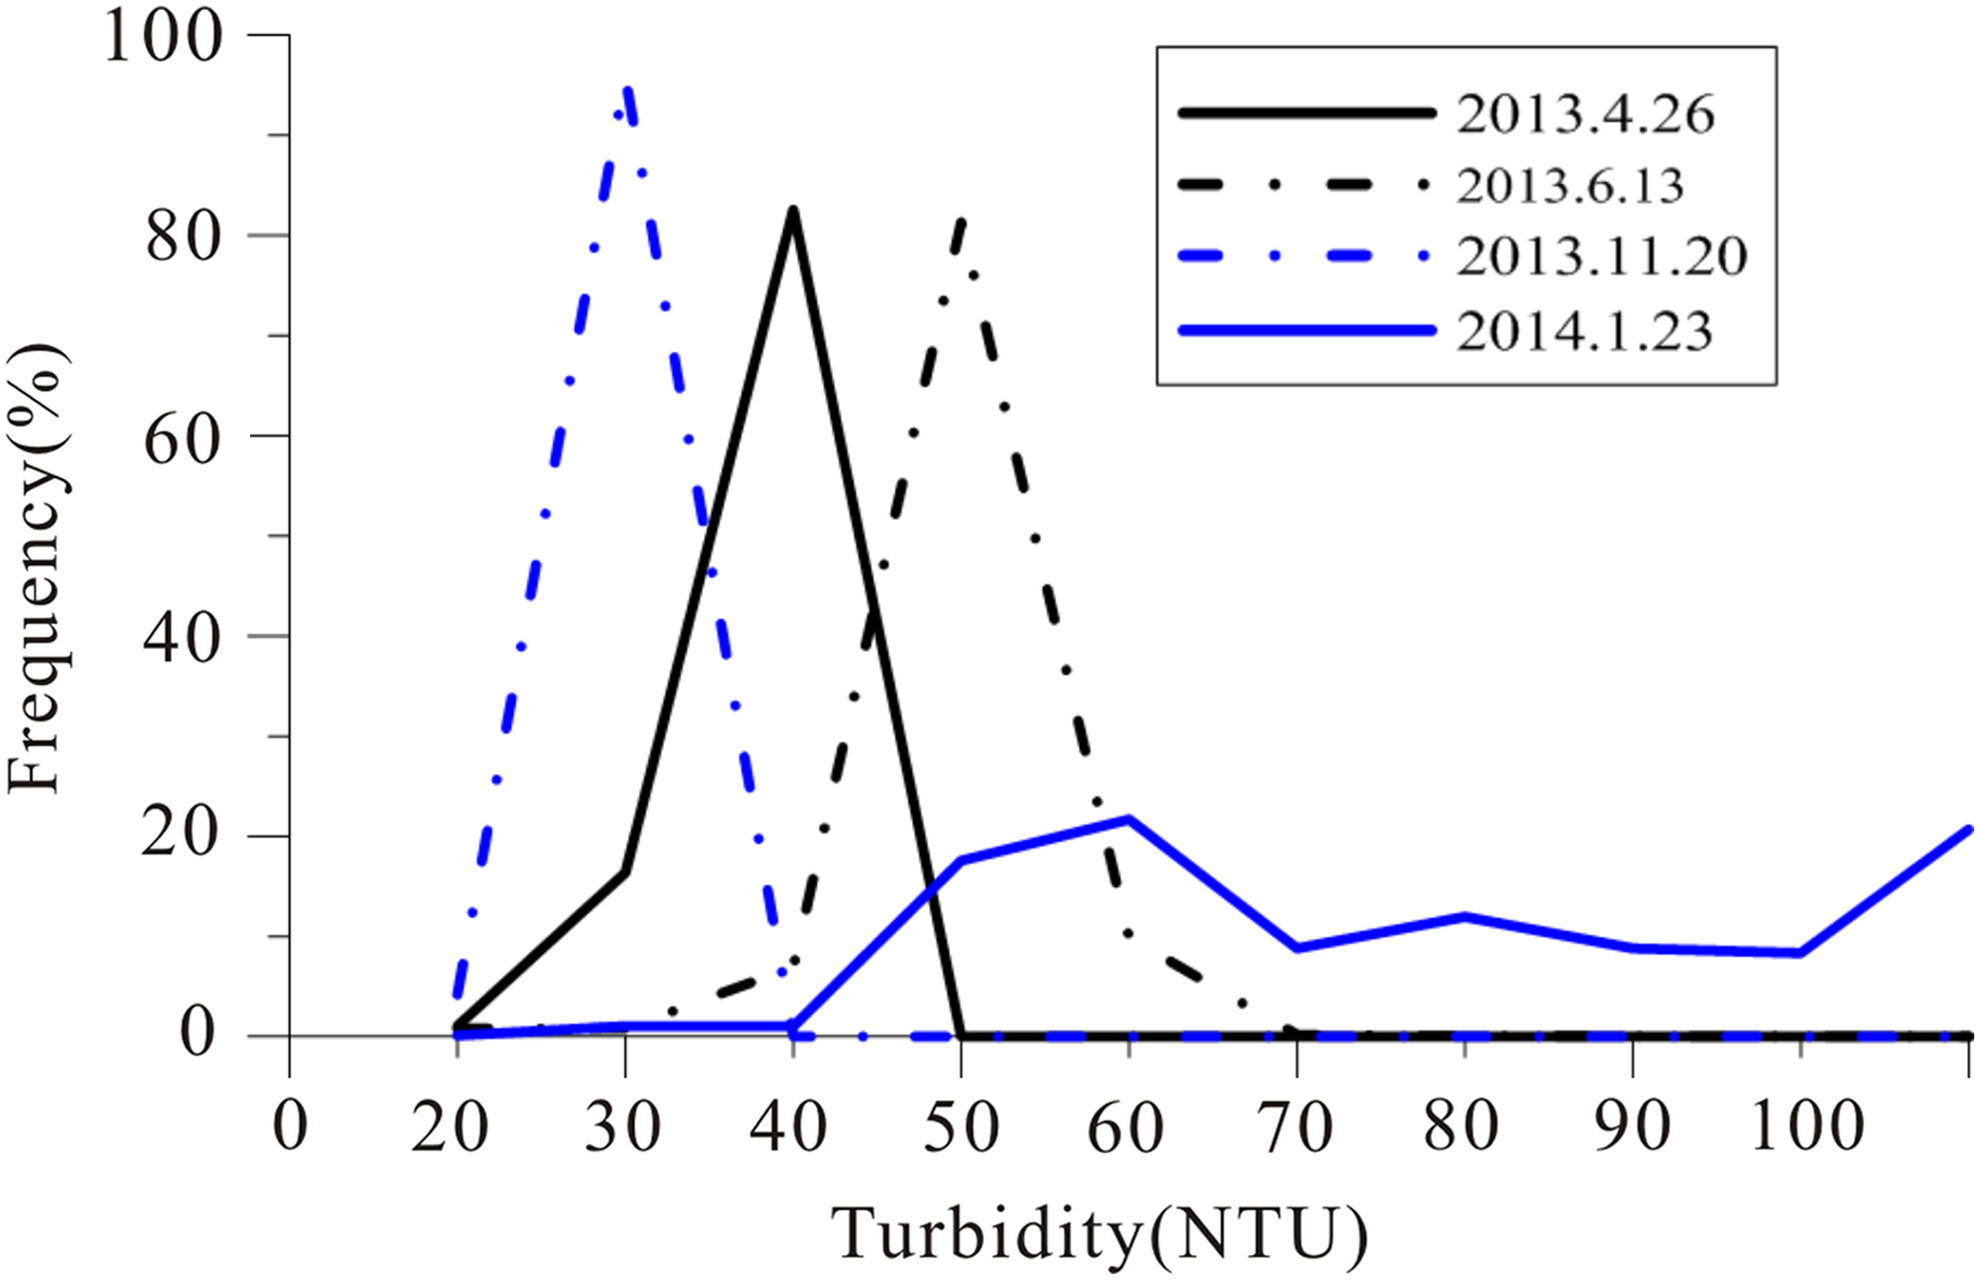
Frequency distribution of turbidity in first four images from April 2013 to January 2014 estimated from Landsat 8 OLI images with the selected statistical model.
Discussion
Spatiotemporal patterns of turbidity distribution
Tables 1 and 5 and Figs. 5 and 6 indicate a region of high turbidity (about 80–150 NTU) on January 23, 2014, in the middle and downstream regions of the study area near Xiantao City. One cause of this turbidity is the intense dredging activity observed at Hanjiang River during our data collection campaigns, which resuspended sediments and increased turbidity values in the dredging region and downstream of that region. Another possible cause could be that the water level was low and flow was very weak on January 23, 2014. Table 6 provides real-time hydrological data from the Xiantao Hanjiang River Hydrological Observation station located on the south bank of the river in Xiantao City. Since the water's environmental capacity in downstream Hanjiang would decrease with a reduction in water flow and a drop of the water level (Wang et al., 2004; Xie et al., 2004; Li et al., 2007), the river would be more sensitive to pollutants from sources (such as chemical and medical facilities) in or around Xiantao City. These could lead to high turbidity distributions in the region. Unfortunately, no water environmental parameters (such as chemical oxygen demand, dissolved oxygen, and total phosphorus) other than turbidity are available for that day.
Applicability of OLI for turbid water
The Hanjiang River plays an important role for local economical and social development as well as ecological conservation in Central China. However, like many rivers around the world, it is facing the threat of water quality degradation due to the impacts of global climate change and regional and local human activities (Wang et al., 2013). In particular, the Danjiangkou Reservoir, upstream of Hanjiang River (Fig. 1), has been used as part of the SNWDP since December 2014. Even before completion of the diversion project, spring algal blooms have occurred downstream of the Hanjiang River (Wang et al., 2004, 2007). To assess whether water pollutants such as algal blooms have increased as hydrological conditions of the Hanjiang River have changed since the beginning of SNWDP water transfer, we used the retrieval model to investigate the turbidity distribution for spring of 2016 (the exact date is March 1, 2016).
Figure 7 shows a region of much higher turbidity (above 300 NTU) on March 1, 2016, near Xiantao City. News media (Changjiang Times, 2016) described an algal bloom in this area during spring of 2016. The water quality monitoring results from the Environmental Monitoring Center of Hubei Province show that the pH of the river water was weakly alkaline (8.8–9.13) and dissolved oxygen was supersaturated (13.47–14.44 mg/L), which is in accordance with the physical and chemical characteristics of the early stage of an algal bloom.
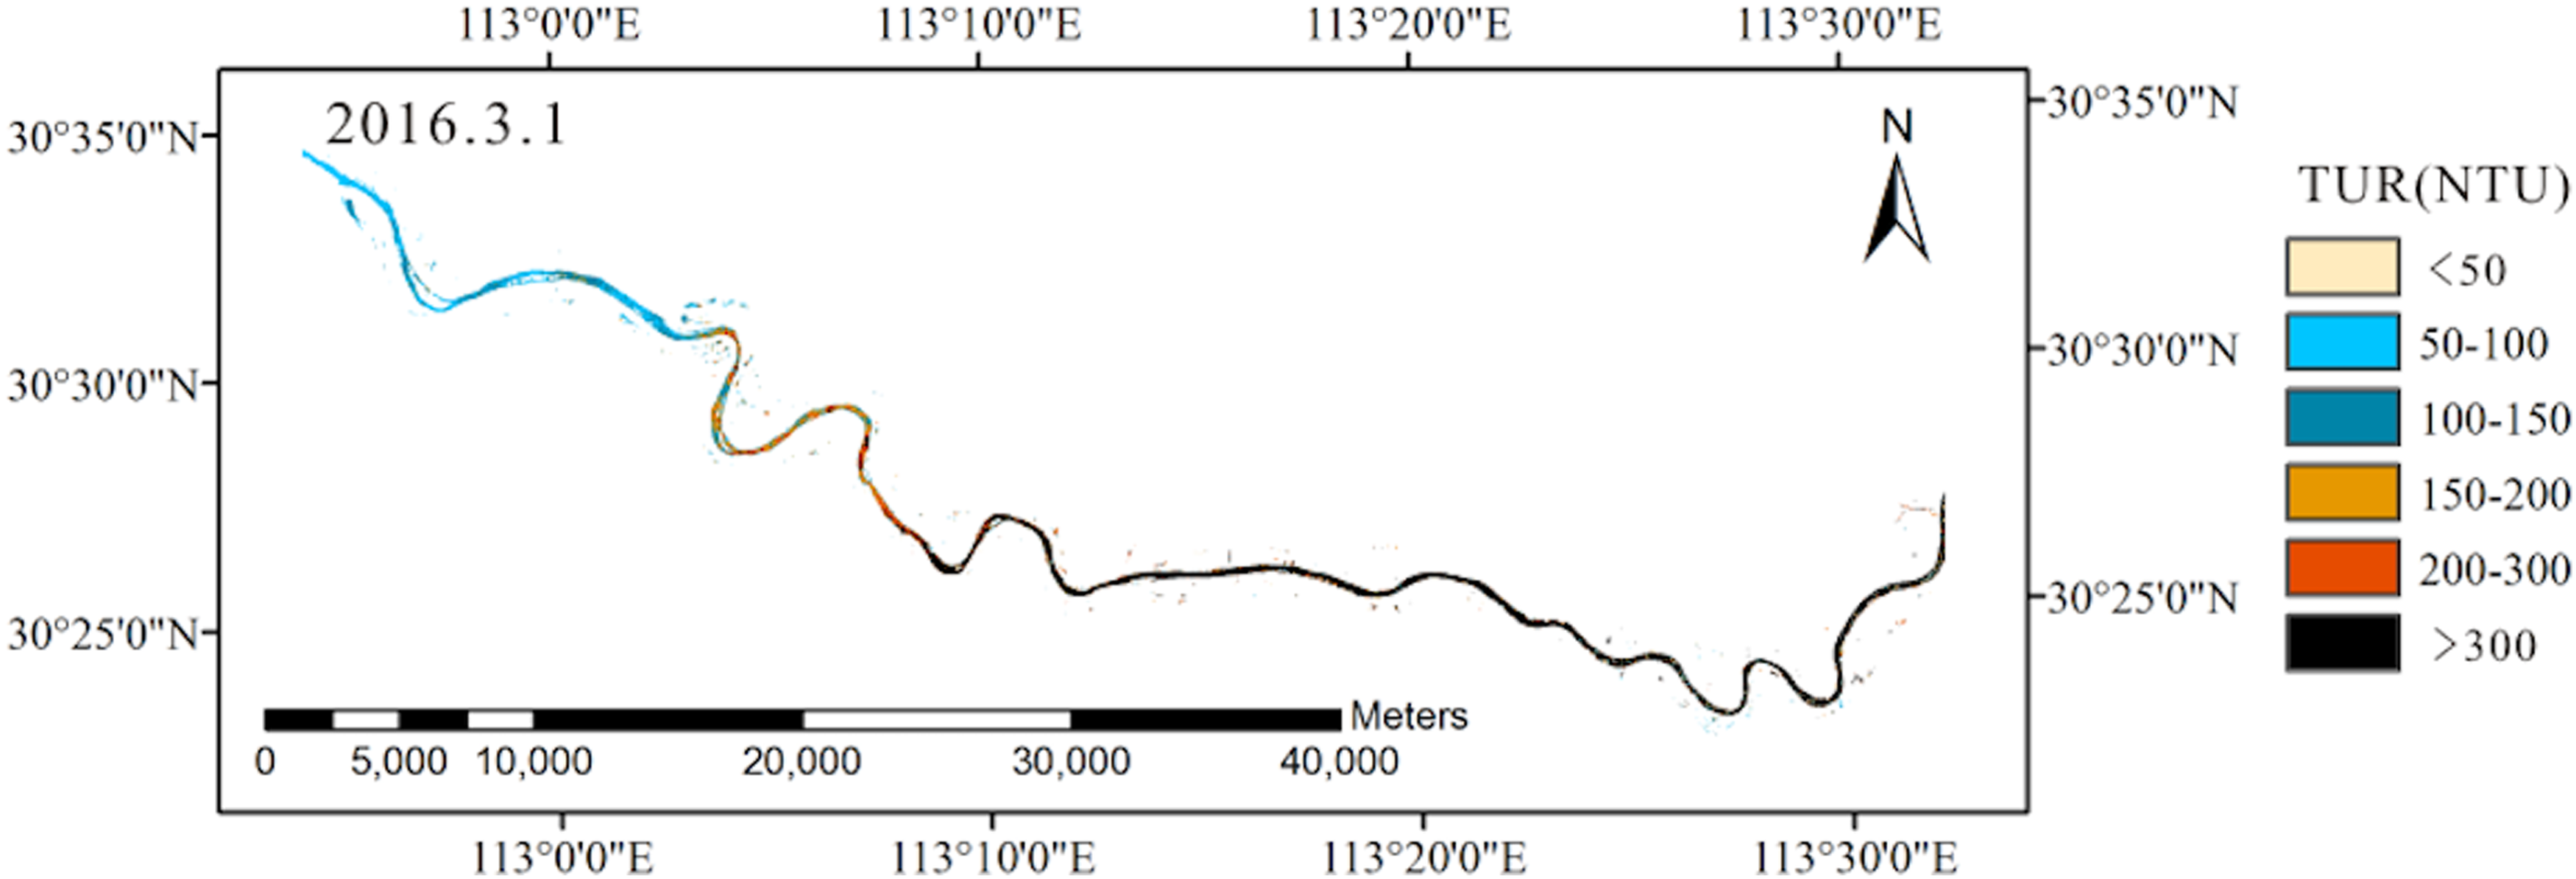
Turbidity distribution estimated from the Landsat 8 OLI image on March 1, 2016.
When water transfer by the SNWDP in the upstream area of the Hanjiang River began at the end of 2014, the water level decreased in mid- and downstream areas, resulting in a water level of only 23.41 m and very low flow rate (533 m3/s) on March 1, 2016, in Xiantao City. In combination with high water temperatures, the physical conditions for an algal outbreak in Hanjiang River were met, causing high water turbidity (Wang et al., 2004, 2013; Xie et al., 2004). This example shows that Landsat 8 images can be used for water quality monitoring of riverine systems.
In addition, long-term spatiotemporal information of water quality parameters should be obtained by ground measurements and remote sensing observations (such as by the Landsat series) to better understand the physical and chemical characteristics of water bodies and analyze the driving factors for increased turbidity, leading to better protection of the Hanjiang River ecosystem.
Potential problems with statistical models
Normally, concurrence between satellite overpass times and field sampling is important for developing remote sensing-based turbidity retrieval models, especially for very dynamic water bodies. However, in our study, this factor was less important because there was a time delay of less than 3 h between the satellite overpass and field sampling during each field campaign, no rainfall or wind, and no significant change of water level during that period.
One Landsat 8 OLI image pixel covers a 30 × 30 m square or 15 × 15 m area, while its corresponding turbidity value is generally derived from a water sample collected at a certain location. Due to this scale gap between the image pixel and turbidity measurement, it is generally assumed that turbidity values within a pixel are homogeneous when developing the retrieval model. However, such an assumption is not always valid for the study area because of dredging activities or localized water pollution.
Since no well-performing atmospheric algorithm for inland waters has been developed for Landsat 8 OLI images (Wu et al., 2015), a simple method was employed to calculate the water-leaving reflectance of Landsat 8 OLI visible and infrared bands in this study, which might affect model development to some extent. Several methods have been applied to atmospherically correct MODIS images for estimating the water quality parameters of case II waters–atmospheric algorithms (Xie et al., 2004; Li et al., 2007); however, no unified atmospheric algorithm presently exists (Gordon, 1997). It would be interesting to assess the performance of these atmospheric algorithms for Landsat 8 OLI images to improve water quality retrieval in future studies. Regrettably, because the in situ spectral reflection of water was not measured in our field survey, and the Landsat Surface Reflectance–L8OLI/TIRS product is not available from the USGS for the study area, the validation of derived reflection could not be implemented in this study.
The statistical models developed in this study are empirical because of the absence of a strict theoretical foundation and because of different optical properties of different water bodies or even at different time periods (Wu et al., 2015), which means that they cannot be applied directly to other water bodies. Another problem is the gap between the two clusters (<60 NTU and >100 NTU) of in situ data (Fig. 2). This may cause overfitting during model calibration. Unfortunately, no additional field surveys were conducted after February 2014 because the project had ended.
Expectations of Landsat 8 OLI
Landsat satellites have been widely used to estimate water quality parameters of inland waters (Kenier and Yan, 1998; Ko et al., 2015). The latest Landsat satellite, Landsat 8 with OLI sensor, has the potential to extend more than 40 years of existing water quality estimations from Landsat satellites (Vasanthavigar et al., 2011; Hong et al., 2015). We expect that more robust semianalytical or statistical models will be developed for Landsat 8 images to build regional or universal models for water quality estimations of inland waters.
Conclusions
Field surveys downstream of the Hanjiang River were conducted to measure turbidity between April 2013 and January 2014. The objectives of this study were to investigate turbidity characteristics downstream of the Hanjiang River and to evaluate whether Landsat 8 OLI data could be used to monitor river water quality. The turbidity range downstream of the Hanjiang River was retrieved from Landsat 8 OLI data by employing atmospheric correction and formulating a retrieval model. Distribution trends in turbidity for the study area are consistent with field investigation results.
Results from this study show the advantages of using Landsat 8 OLI for inland riverine applications. High spatial resolution (30 m) resolves small-scale turbidity features that may otherwise go undetected, making the study of high patchiness related to suspended sediments in river systems viable.
Additional studies should be carried out to validate our findings and to obtain more accurate estimates of the spatial distribution of water quality parameters in the Hanjiang River after commencement of the SNWDP.
Footnotes
Acknowledgments
This work was jointly funded by the CRSRIO pen Research Program (Grant No. CKWV2016401/KY), the National Natural Science Foundation of China (Grant No. 41301098), the Science and Technology Service Network Initiative of Chinese Academy of Sciences (Grant No. KFJ-STS-ZDTP-011), and the Major Projects of Technological Innovation in Hubei Province (Grant No. 2016ACA168). The authors would like to thank the USGS for the Landsat 8 OLI data as well as the Bureau of Hydrology and Water Resources of Hubei Province for sharing hydrological data. The authors would also like to thank Feng Ling, Xiaodong Li, and LiHui Wang for their participation in the field sample collection and manuscript revision and the anonymous reviewers for their valuable comments and constructive suggestions that helped improve this article. The authors would like to thank Editage (![]() ) for English language editing.
) for English language editing.
Author Disclosure Statement
No competing financial interests exist.