
Abstract
Abstract
Decision makers express a strong need for reliable information on future climate changes to develop with the best mitigation and adaptation strategies to address impacts. These decisions are based on future climate projections that are simulated by using different Representative Concentration Pathways (RCPs), General Circulation Models (GCMs), and downscaling techniques to obtain high-resolution Regional Climate Models. RCPs defined by the Intergovernmental Panel on Climate Change entail a certain combination of the underlying driving forces behind climate and land use/land cover changes, which leads to different anthropogenic Greenhouse Gases concentration trajectories. Projections of global and regional climate change should also take into account relevant sources of uncertainty and stakeholders' risk attitudes when defining climate polices.
The goal of this article is to improve regional climate projections by their prioritized aggregation through the ordered weighted averaging (OWA) operator. The aggregated projection is achieved by considering the similarity of the projections obtained by combining different GCMs, RCPs, and downscaling techniques. Relative weights of different projections to be aggregated by the OWA operator are obtained by regular increasing monotone fuzzy quantifiers, which enables modeling the stakeholders' risk attitudes. The methodology provides a robust decision-making tool to evaluate performance of future climate projections and to design sustainable policies under uncertainty and risk tolerance, which has been successfully applied to a real-case study.
Introduction
C
The decision-making process that is used to design mitigation and adaptation strategies is hindered by the complex interactions among the driving forces of the climate change, ranging from natural causes, energy use, lifestyle, and climate policies, to demographic, technological, socioeconomic, and environmental developments. A large number of methodologies have been developed to deal with decision-making processes in environmental problems (e.g., Llopis-Albert and Palacios-Marqués, 2016).
Assessment of the impacts of climate change relies on future climate projections that are obtained by using different Representative Concentration Pathways (RCPs), General Circulation Models (GCMs), and downscaling techniques for obtaining high-resolution Regional Climate Models (RCMs). RCPs as adopted by the Intergovernmental Panel on Climate Change (IPCC) in its fifth Assessment Report (AR5) entail diverse driving forces behind anthropogenic Greenhouse Gases (GHGs) concentration trajectories (IPCC, 2014). Furthermore, this article establishes that humans through the GHGs trends are the main cause of current global warming.
The projections of global and regional climate change are hampered by the large existing uncertainties, which range from low confidence in climate variable observations, the underlying driving forces of climate and land use/land cover (LULC) changes, possible future climate change scenarios and anthropogenic impacts, GCMs assumptions and limitations, spatial resolutions, and initial conditions to downscaling techniques to obtain regional projections (Wang et al., 2004). These uncertainties are translated into regional projections, which lead to dissimilar results and are occasionally opposite to each other. Therefore, the IPCC (2014) recommends in climate change studies the use of stochastic approaches, that is, the use of an ensemble of projections (e.g., Andersson et al., 2006) or a combination of those projections through different weighting methods (e.g., Gay and Estrada, 2010). Stochastic approaches are highly used to deal with many environmental problems, such as groundwater flow and mass transport (e.g., Llopis-Albert et al., 2015), saltwater intrusion (e.g., Llopis-Albert et al., 2016), and hydro-economic models (e.g., Llopis-Albert et al., 2014).
As a rule of thumb, regional projections are key to understanding the climate change, but a methodology to deal with uncertainties and risk tolerance is advisable.
This article is intended to improve regional climate projections by their prioritized aggregation by means of the ordered weighted averaging (OWA) operator. The heterogeneous and uncertain future climate projections (simulated by using a variety of GCMs, RCPs, and downscaling techniques) are aggregated in accordance with their similarity, where the relative weights of the projections are obtained by regular increasing monotone (RIM) fuzzy quantifiers. In this way, the methodology also allows reducing uncertainty and modeling the risk tolerance when defining climate polices, that is, the optimism/pessimism degrees of decision makers. The procedure has been successfully applied to future regional projections for mainland Spain by using the data provided by the State Meteorological Agency of Spain (AEMET, 2017).
The rest of the article is organized as follows. The Methodology section presents the methodology based on the prioritized OWA operator; the Application to a Case Study section shows an application to a case study; and the Conclusions section concludes the article.
Methodology
Overview
We have selected OWA operators (Yager, 1988) to aggregate the future regional projections for analyzing the climate change because of its capability to encompass a range of operators from minimum to maximum, including several averaging aggregation operations such as the arithmetic mean. In the aggregation of fuzzy sets, several fuzzy numbers are combined to produce a single fuzzy number (Klir and Yuan, 1995). This combination can be performed by intersection, minimum, product (i.e., fuzzy t-norms or disjunctive quantifiers) and union, maximum, summation (i.e., s-norms or conjunctive quantifiers). In addition, there are other well-known operators for aggregation, such as arithmetic, geometric, and harmonic means. A review on the development of aggregation operators can be found in Yu (2015).
OWA operators (Yager, 1988; Yager et al., 2011) and prioritized multi-criteria decision-making problems have been widely tackled in the literature (e.g., Yu et al., 2012). The OWA operator has been extended under a wide range of frameworks, including probabilities (Merigó, 2010), distance measures (Merigó and Casanovas, 2011), linguistic information (Merigó and Gil-Lafuente, 2013), moving averages (Merigó and Yager, 2013), and continuous operators (Zhou et al., 2016). Wei and Tang (2012) developed generalized prioritized aggregation operators. Chen et al. (2014) developed a weakly prioritized measure for multi-criteria decision making, and Yu et al. (2013) developed a measure with preference relations. In fuzzy environments, Verma and Sharma (2016) designed prioritized operators with triangular fuzzy numbers, Ye (2014) considered trapezoidal intuitionistic fuzzy sets, Chen (2014) used interval-valued intuitionistic fuzzy sets, and Dong and Wan (2016) focused on triangular intuitionistic fuzzy numbers. Some other authors have used hesitant fuzzy sets in the aggregation process (e.g., Jin et al., 2016). In addition, other authors have considered other environments with interval numbers (Ran and Wei, 2015) and linguistic information (Zhao et al., 2014).
However, this technique has been scarcely applied to climate change. Rahmani and Zarghami (2013) developed a new approach to combine climate change projections by using OWA operators.
The methodology entails three main steps. First, based on the future regional climate projections provided by AEMET, the similarity of a specific projection (obtained by using certain GCM, RCP, and downscaling techniques) is determined by comparing it with other projections that are obtained by using other GCMs and/or downscaling techniques. Second, the methodology finds the total similarity through OWA operators considering different stakeholders' risk tolerance. Third, it averages the regional climate projections based on their total similarity, thus minimizing uncertainty.
Another advantage of the OWA operator is that since the similarity of regionals projections depends on stakeholders' risk attitudes, a sensitivity analysis can be carried out based on their preferences.
Comparison of future regional projections
Regional projections obtained with different GCMs and downscaling techniques lead to a wide range of uncertainties. They show dissimilar results and occasionally opposite to each other, which hinders their direct use by policy-makers.
This problem can be diminished by finding the weak projections and reducing their effects in averaging. To measure the weakness, the unlikeness measure
where
To facilitate the analysis, a conversion between the unlikeness measure to similarity and a normalization of values to be within the interval [0, 1] is carried out (Rahmani and Zarghami, 2013):
where
Aggregation of future regional projections by OWA operators
Aggregation of the similarity measures for all stations is carried out by OWA operators, which is a well-known technique that is used to deal with uncertain and complex environments in multi-person and multi-criteria problems. The methodology aims at considering stakeholders' risk preferences when defining climate polices, and at minimizing the existing uncertainties. The risk tolerance defines the optimism/pessimism degrees of decision makers, that is, if they are willing to accept risk or, conversely, they are risk averse. Climate change is a global challenge that can only be effectively addressed through a global effort. The stakeholders involved in the decision-making process for defining climate policies may cover the governments and governmental agencies, experts, and opinion formers in climate change, civil society, nongovernmental organizations, mass-media, economic sectors, and the IPCC. The risk attitude or optimism degree of the decision makers can be collected through public government information, meetings, surveys, polls, conferences, workshops, round tables, personal interviews, debate forums, expert panels, and mass-media information. The priority of a regional projection is ranked through its total similarity measures considering all stations,
where
Two characterizing measures called orness measure and dispersion measure associated with the weighting vector
with
It characterizes the degree to which the aggregation is similar to an or operator. When
The weight distribution for a given
where
In this study, we use a fuzzy linguistic quantifier (Q) to obtain the weights, such as an RIM quantifier (Yager, 2009):
The quantifier is defined as
This is because the RIM function is bounded by two linguistic quantifiers: “there exists”
For
In addition, the OWA operator has some important properties, that is, monotonicity, commutativity, and boundary (e.g., Wang et al., 2014). Furthermore, note that many other aggregation operators could also be considered in the analysis (Yager et al., 2011).
Average of regional projections based on total similarity
A simple additive weighting is used to average the regional projections based on their total similarity. The weight for each projected variable,
where m is the number of regional projections and
As a result, the average projection of a certain variable
Application to a Case Study
Spain is a country located in southwestern Europe and occupying about 85 percent of the Iberian Peninsula. It has an area of 504,030 km2, of which 499,542 km2 is land and 5,240 km2 is water. Spain is the second largest country in Western Europe and with an average altitude of 650 m, it is the third highest country in Europe. It lies between latitudes 36° and 44° N, and between longitudes 19° W and 5° E, and its Atlantic coast is 710 km long.
The climate of Spain varies across the country and presents three main climatic zones, based on the geographical situation and orographic conditions. The Mediterranean climate is characterized by dry and warm summers and cool to mild and wet winters. The oceanic climate is located in the northern part of the country, especially in the regions of Basque Country, Asturias, Cantabria, and Galicia. The semiarid climate is located in the southeastern part of the country, especially in the region of Murcia and in the Ebro valley. In contrast to the Mediterranean climate, the dry season continues beyond the end of summer.
We use regional projections for mainland Spain as provided by the State Meteorological Agency of Spain (AEMET, 2017). These projections are obtained by following the guidelines of the fifth Assessment Report (AR5) of the IPCC (2014). This study uses a set of 42 future regional projections encompassing 24 GCMs, 3 RPC scenarios, and 2 downscaling techniques. These regional climate projections are obtained for the 21st century and comprise the variables precipitation (using 2,321 weather stations), and maximum and minimum temperature (using 374 weather stations).
All GCMs models used to obtain regional projections are from CMIP5 Project (Coupled Model Intercomparison Project Phase 5) and within the framework of the AR5-IPCC. They provide daily information for the variables precipitation, and maximum and minimum temperature (AEMET, 2017). The AR5 (IPCC, 2014) defines four new scenarios in comparison with the AR4 and the ENSEMBLES (Stream 1 y Stream 2) project (IPCC, 2007). On the one hand, the ENSEMBLES project generated a collection of regionalized climate change projections based on a set of global models, regional models, and emission scenarios. These projections were generated under the emission scenarios named as SRES (Special Report Emissions Scenarios), which cover four possible emission scenarios: high emissions (A2), average emissions (A1B), low emissions (B1), and a scenario of aggressive mitigation to avoid the possibility of exceeding 2°C of global warming (E1) with regard to preindustrial levels (Van der Linden and Mitchell, 2009).
On the other hand, the four new emission scenarios provided by the AR5, called RCPs, are considered as plausible scenarios depending on different GHGs concentration trajectories. The four RCPs (i.e., RCP 2.6, RCP 4.5, RCP 6, and RCP 8.5) entail a different range of radiative forcing values in the year 2100 relative to preindustrial values (+2.6, +4.5, +6.0, and +8.5 W/m2, respectively). An important difference of the new RCPs regarding the emission scenarios used in the AR4 is that the latter did not contemplate the effects of possible policies or international agreements with the aim of mitigating emissions. Instead, they represent potential socioeconomic developments without restrictions on emissions. On the contrary, some of the new RCPs consider the effects of policies to limit climate change over the 21st century. Each RCP has an associated high spatial resolution database of emissions of pollutants (classified by sector), emissions and concentrations of GHGs and LULC changes until the year 2100, based on a combination of models of different complexity of atmospheric chemistry and the carbon cycle. As a result, this is translated into a different range of radiative forcing values.
RCP 2.6 entails an extremely low scenario that reflects aggressive GHGs reduction and sequestration efforts. RCP 4.5 implies a low scenario in which GHGs emissions stabilize by midcentury and fall sharply thereafter. RCP 6.0 assumes a medium scenario in which GHGs emissions increase gradually until stabilizing in the final decades of the 21st century. Finally, RCP 8.5 postulates increasing GHGs emissions until the end of the 21st century, that is, atmospheric CO2 concentrations are more than triple by 2100 relative to preindustrial levels.
Downscaling techniques to obtain high-resolution RCMs from the GCMs are based on statistical downscaling methods [such as linear regression or synoptic analogue methods, for example, Wilby et al., (2002) and Wilby and Dawson, (2004)] or dynamical downscaling methods (e.g., Wang et al., 2014). On the one hand, statistical downscaling methods provide results at any scale, down to station-level information, are computationally inexpensive and efficient, and require a low volume of data inputs. The main disadvantages are that they assume that the derived relationships do not change as the climate is perturbed, require a sufficient amount of good quality of observational data to produce reliable projections, and cannot explicitly describe the physical processes affecting the climate change. On the other hand, dynamic downscaling methods provide 20–50 km grid cell information, including information at sites with no observational data, that is, they are not constrained to historical records. The main advantage is that they are physically based but are more complex and with a high computational cost and volume of data inputs (Murphy, 1999). Both approaches provide good results in terms of reproducing the observed variability of the local climate variables, but the lower computational cost of statistical downscaling has led to their greater use.
In addition, a review of downscaling methods for climate change projections with regard to advantages, disadvantages, outputs, requirements, and applications can be found in Trzaska and Schnarr (2014).
Further information about the generation of regional scenarios of climate change for Spain can be found in Brunet et al. (2009) and Morata-Gasca (2014).
Figures 1 and 2 show the changes for different climatic variables and for an ensemble of future climate regional projections in comparison with the historical data for the period 1981–2010 (AEMET, 2017). Figure 1 presents these changes for the annual average maximum and minimum temperature during the 21st century, whereas Fig. 2 depicts these changes for precipitation. As aforementioned, the changes of the climatic variables are obtained by using a set of 42 future regional climate projections encompassing 24 GCMs, 3 RPC scenarios, and 2 downscaling techniques. Figures 1 and 2 present future reginal projections that are obtained by using a specific GCM, RPC, and downscaling technique. Therefore, the future projections show a wide range of climatic variable changes. Temperature changes may differ by several degrees centigrade from one future projection to another, and the differences regarding the precipitation changes are also important. The largest differences are mainly due to the underlying assumptions of each GCM considered. The GCM with lower emission scenarios and implementing policies or international agreements with the aim of mitigating emissions lead to lower changes in the climatic variables and vice versa. The same can be enunciated for the different RCPs: Those with higher radiative forcing values lead to higher changes of the climatic variables, and conversely, for lower values. The downscaling techniques used in the future regional projections lead to less important but non-negligible differences. It is worth mentioning that results strongly depend on how many projections based on each GCM, RCP, or downscaling technique are used for obtaining the aggregated projections. Then, if more future projections with higher RCP values are used, the aggregated projection would be biased toward the higher values and vice versa. However, the aggregate projection with risk acceptance (
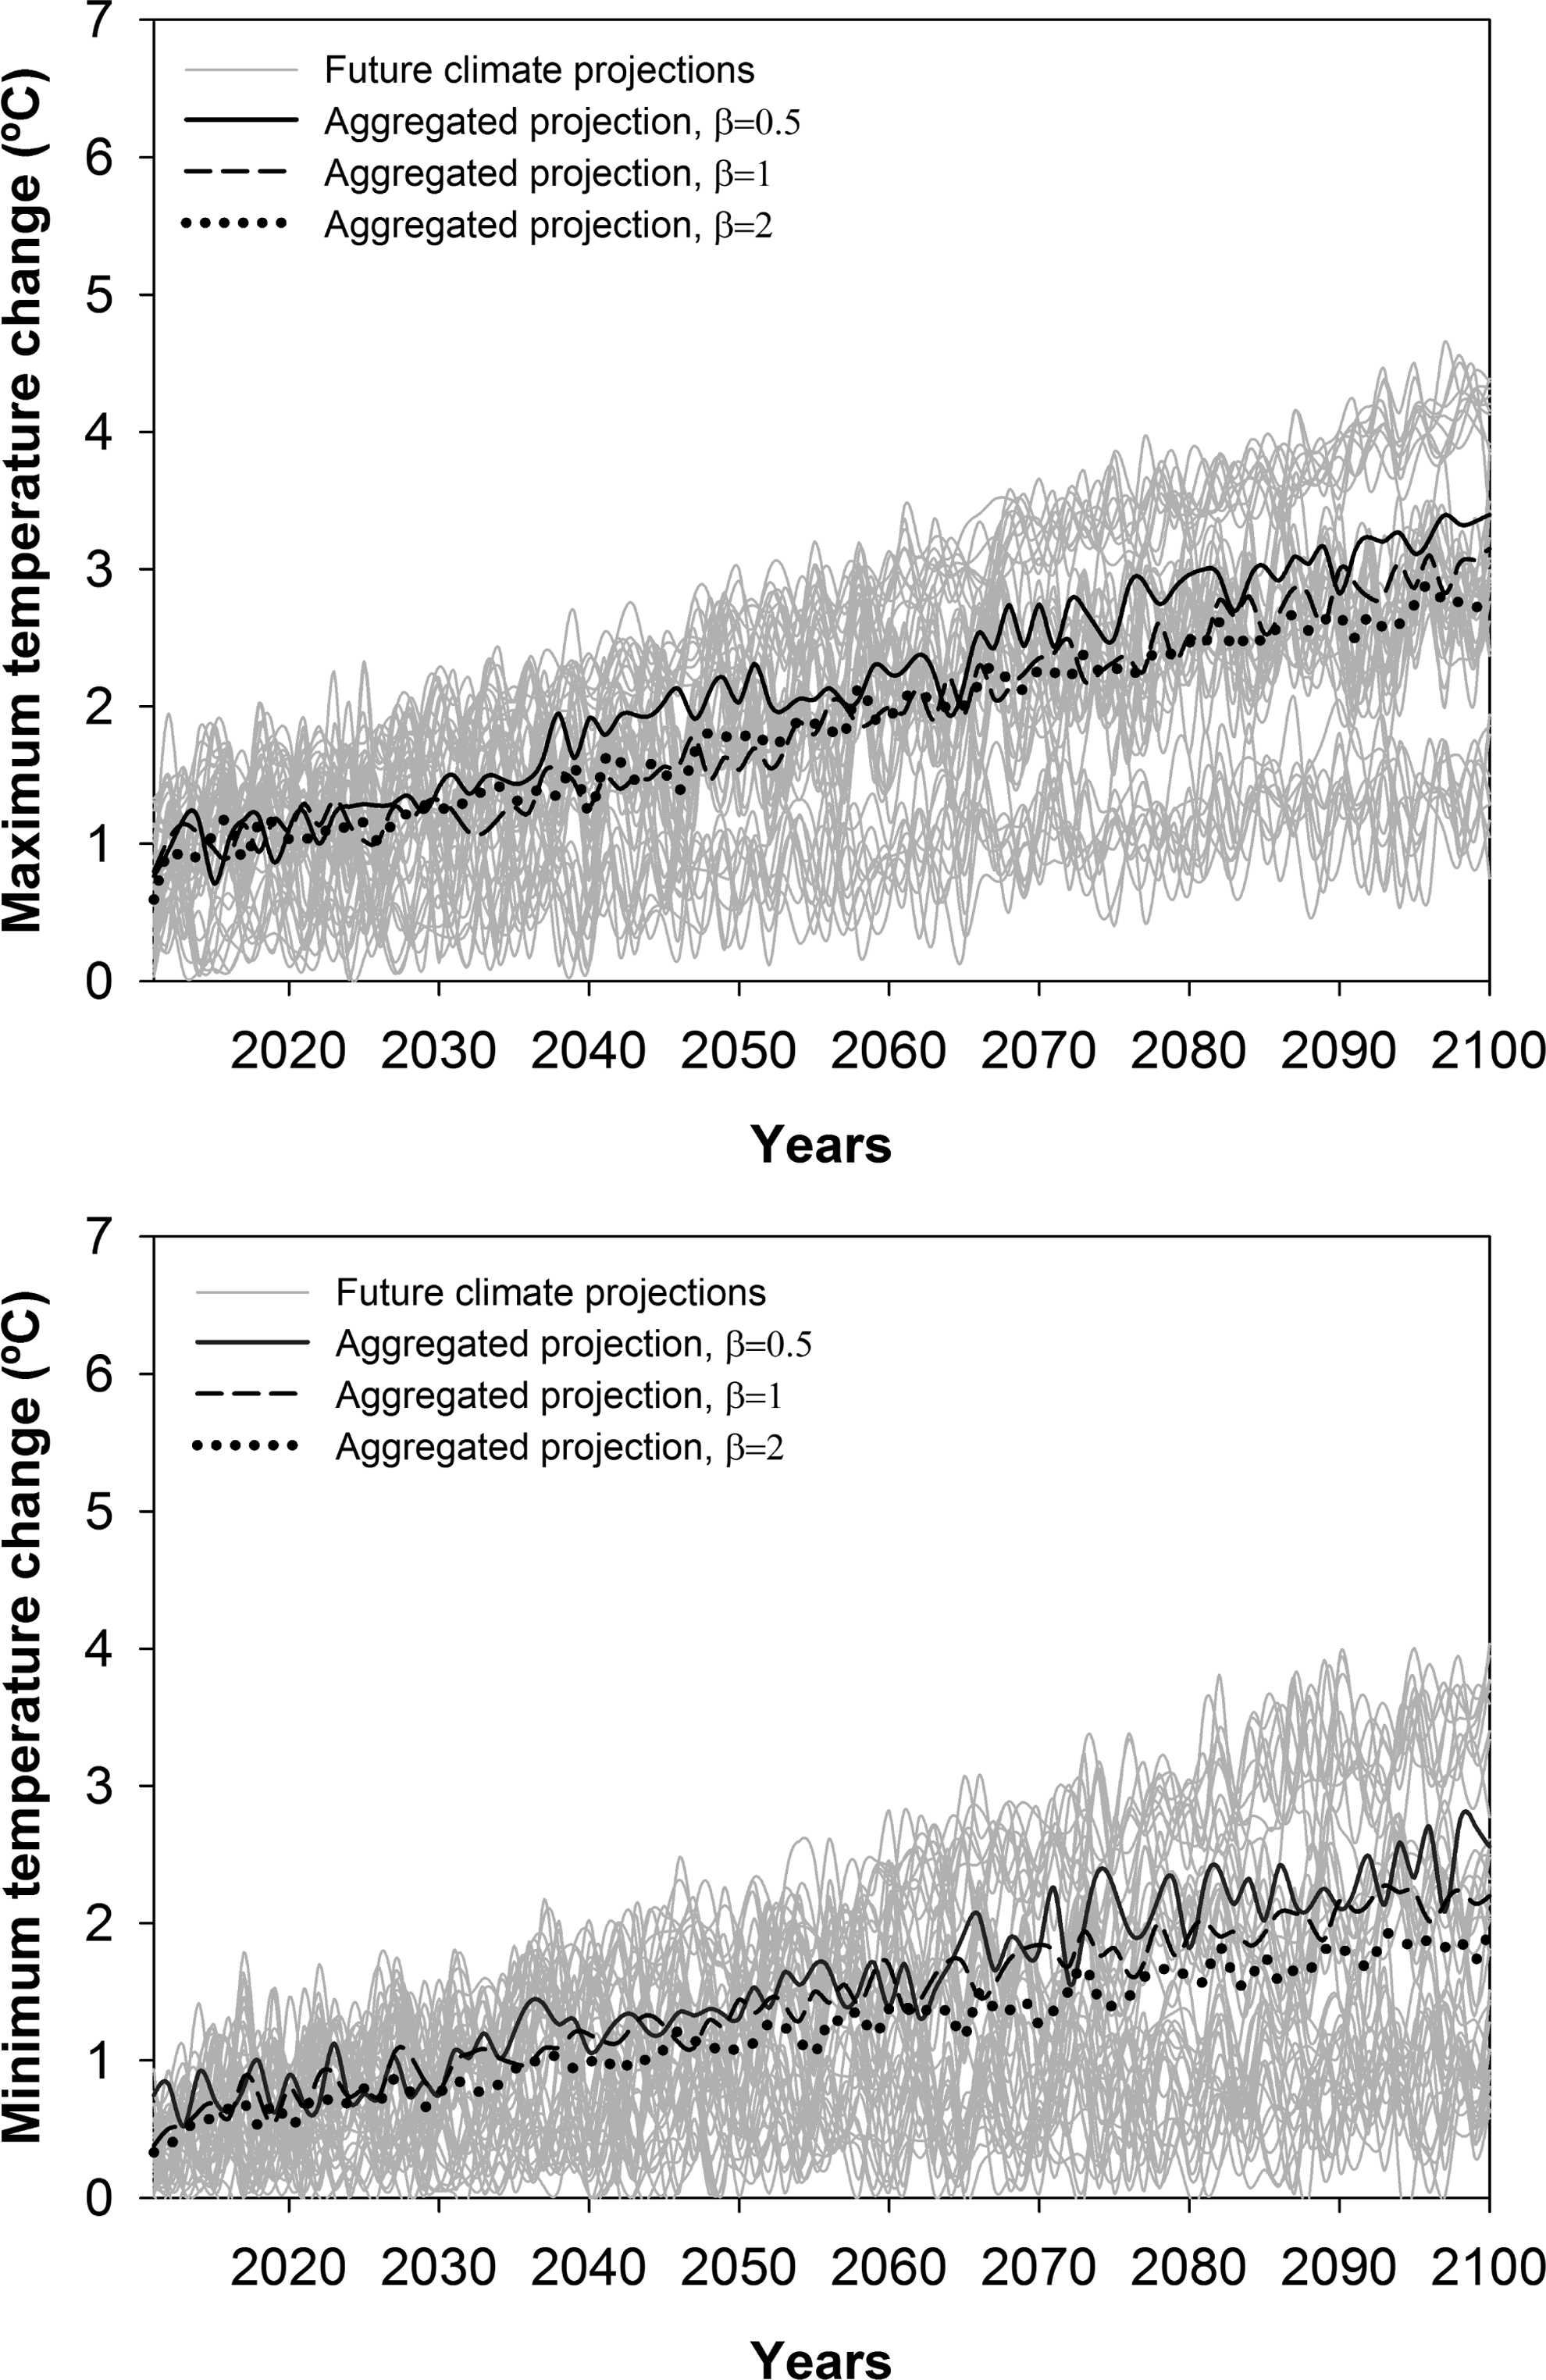
Annual maximum and minimum temperature change (°C) for an ensemble of future climate regional projections and aggregated projections with different stakeholders' risk attitude (β) obtained for mainland Spain and the 21st century (i.e., period 2011–2100).
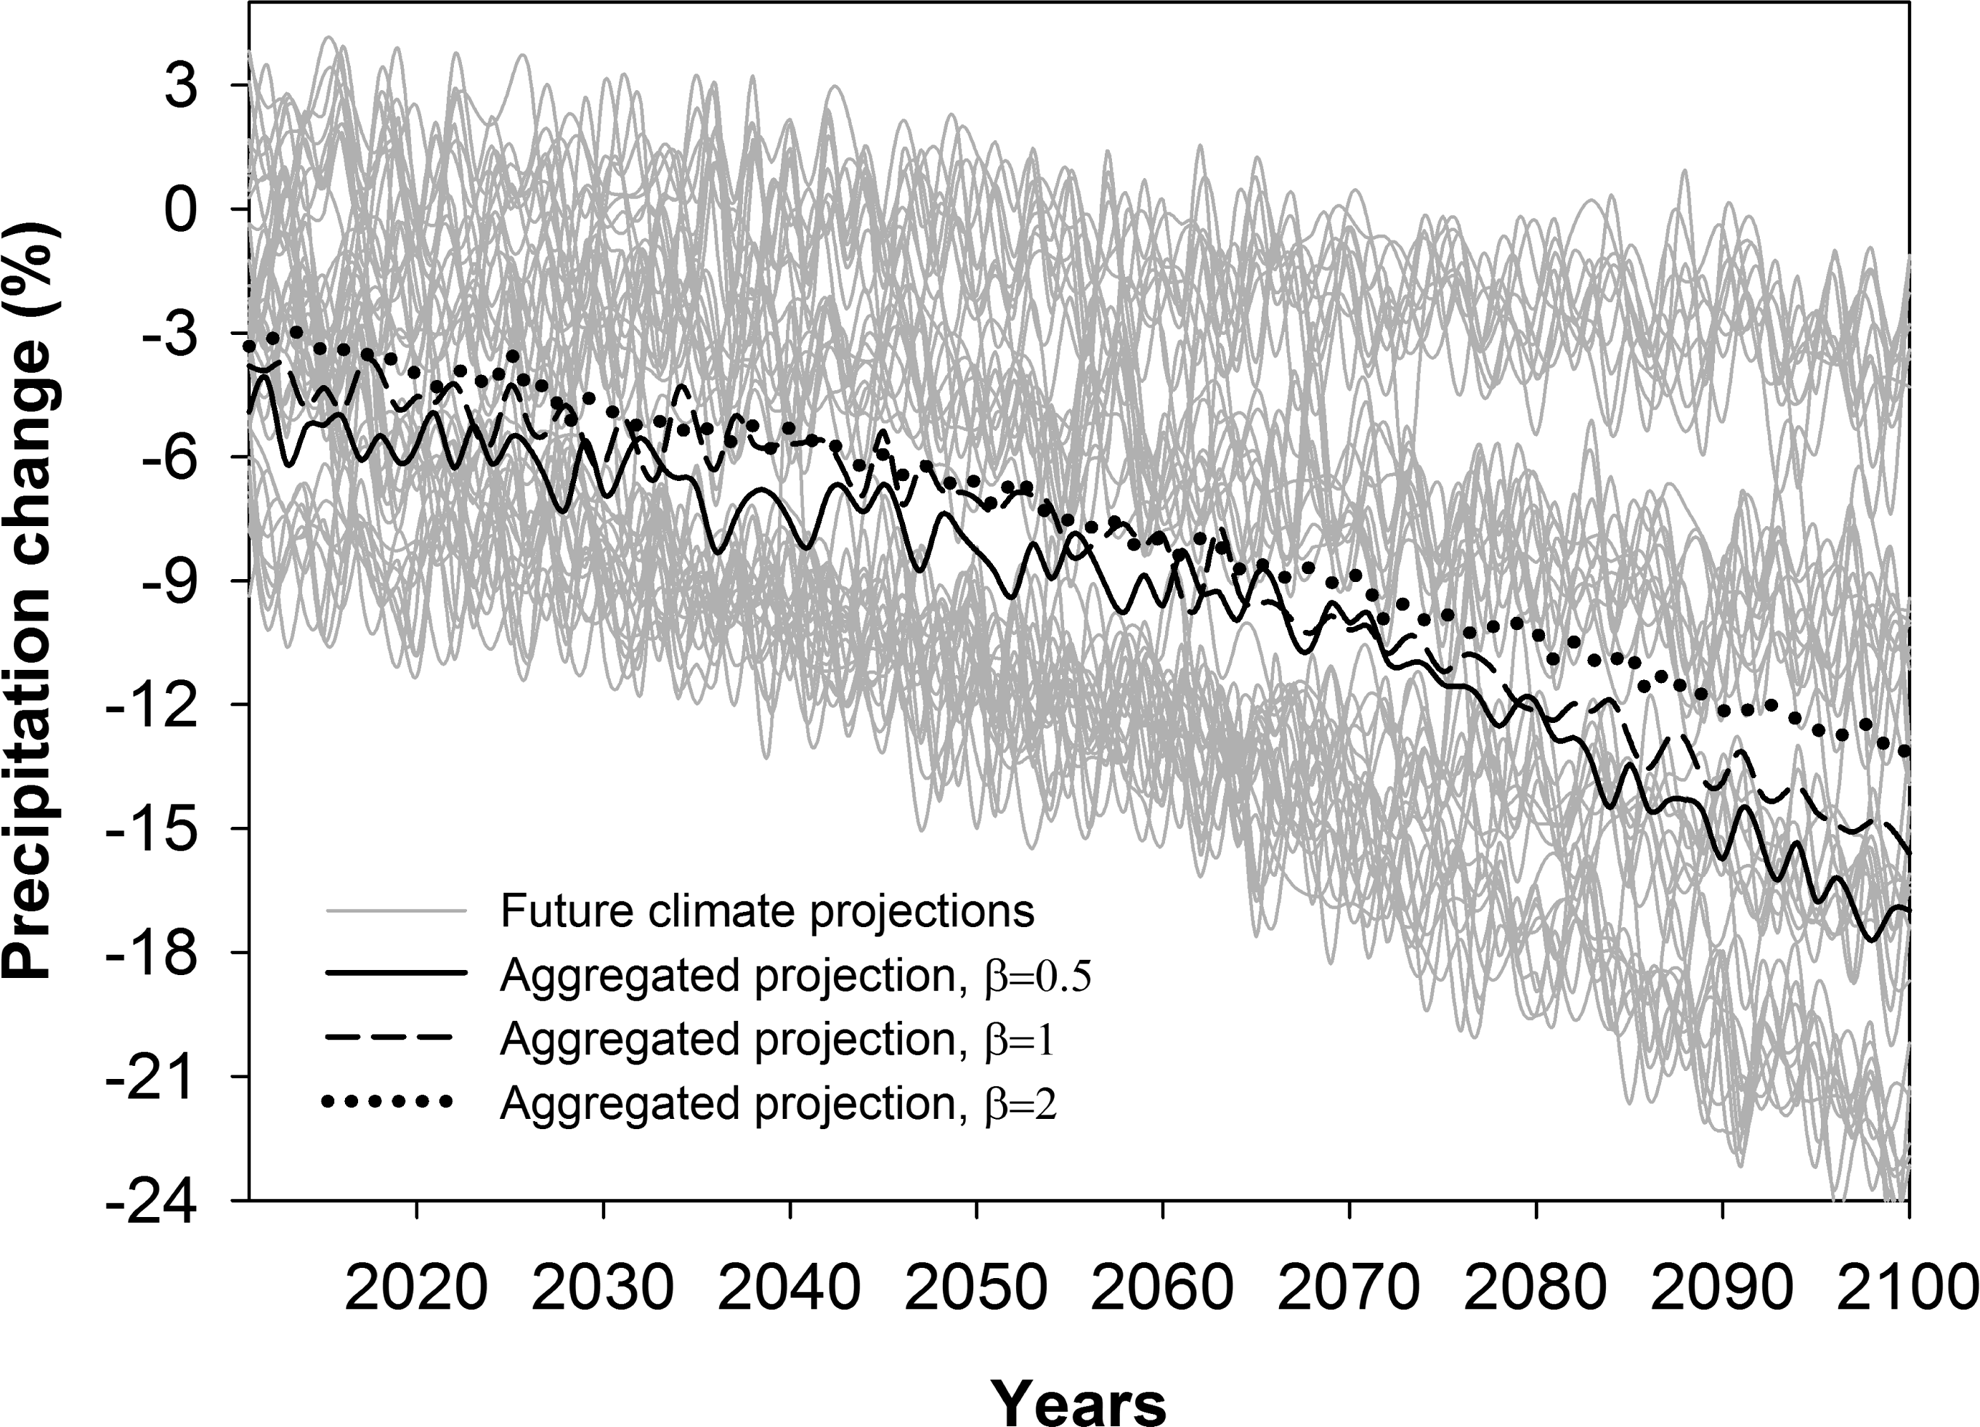
Annual precipitation change (%) for an ensemble of future climate regional projections and aggregated projections with different stakeholders' risk attitude (β) obtained for mainland Spain and the 21st century (i.e., period 2011–2100).
The proposed methodology is applied to properly tackle those large uncertainties while considering different degrees of optimism of decision makers. In this sense, these figures also show the changes of the aggregated future regional projections, obtained using prioritized OWA operators, for different stakeholders' risk tolerances. That is, since the similarity of regional projections obtained by using OWA operators depends on stakeholders' risk preferences, a sensitivity analysis has been performed by using three different values of risk tolerance, specifically, for
Results show that there is also a growing trend of the annual minimum temperature change, with increasing values for the set of future projections and the aggregated projections of around 1–4°C at the end of the 21st century (Fig. 1). This increase is greater in the southern peninsular and during the summer months, whereas the days of frost decrease and the percentage of warm nights increases. Similar results regarding the aggregated projections can be drawn, that is, higher risk tolerance leads to higher temperature changes and variations between successive years.
The percentage change in precipitations is on a downward trend for the aggregated projections, with reductions ranging from 3% to 23% at the end of the 21st century (Fig. 2). In general, a downward trend in precipitations is observed throughout the peninsular area, although it is lower in the northern half of the peninsula. The number of rainy days decreases, and the duration of dry periods tends to be longer, which would increase the risk of droughts, especially in summer and the southern half peninsula. That is, the seasonal cycles are more noticeable.
Again, results show that for stakeholders' risk acceptance (
Finally, these results are in line with those obtained by other authors, which show that there will be a more intense heat in the summer months, together with increases in the intensity and frequency of heat waves over southern Europe and the Mediterranean and a decrease in precipitation (e.g., Fischer and Schär, 2010; Morata-Gasca, 2014).
Conclusions
Long-term climate change projections may provide a wide range of possible outcomes. The selection of climate policies based on these projections should take into account relevant sources of uncertainties and stakeholders' risk attitudes. Furthermore, studies of climate change rarely yield consensus among stakeholders because of their different perceptions about the expected impacts and preferences about the adopted policies.
We have presented a methodology that makes use of prioritized OWA operators to provide an effective way to address stakeholders' risk attitudes and preferences regarding the measures to be undertaken. The methodology also allows minimizing the uncertainties associated to GCMs, RCPs, and downscaling techniques, which are translated into future regional projections. These projections are combined by considering their similarity in such a way that the relative weights of the different projections are obtained by RIM fuzzy quantifiers. The methodology provides a robust and an effective decision-making tool to design sustainable climate policies under uncertainty and risk tolerance. Furthermore, it has been successfully applied to evaluate the climate change in Spain. The future aggregated regional projections have shown that global warming is observed with a growing trend in maximum and minimum average temperatures and a downward trend in precipitations over the 21st century and throughout the peninsular area.
Footnotes
Author Disclosure Statement
No competing financial interests exist.