
Abstract
Abstract
Flue gas desulfurization (FGD) technologies have been applied worldwide in power plants to achieve regulatory standards for the emission of SO2. However, commercial methods in practice require increased costs for disposal of the FGD residuals or by-products. An electromembrane reactor for recycling and resource recovery of FGD residuals was proposed in this study. On the basis of previous work, a mathematical model was developed to describe the mass balance of proposed electromembrane reactor by originally introducing the dimensionless groups, which can help in understanding the mechanism of electrochemical processes and in removing barriers against scaling up a lab-scale chemical unit to a commercial size. On the other hand, results of numerical simulation agreed well with the experimental data, which verified the capability of the developed model for mass transfer. With the help of dimensionless groups, analysis of the model revealed that current density, flow pattern, and initial concentration of acid and base are key parameters in the process of optimization, coinciding with the experimental results. In addition to these findings, the control step in mass transfer can be estimated by analyzing the value of dimensionless parameters, and an appropriate solution for optimization can be further clarified by the dependence of Sh on Re, Sc, and some dimensionless quantities. If this technology is integrated into an existing FGD facility, money-consuming chemical processes could be transferred into a renewable resource and clean energy conversion process.
Introduction
A
Generally, commercial methods in practice to remove SO2 from flue gas include wet FGD [e.g., lime and limestone wet FGD systems (Frandsen et al., 2001; Biswas, 2005)], which is the most commonly used (90%) (Tzouvalas et al., 2004), semidry FGD [e.g., a powder-particle spouted bed (Ma et al., 2000; Xu et al., 2000)], and dry FGD [e.g., a circulating dry scrubber (Neathery, 1996) and in-duct dry sorbent injection processes (Gutiérrez Ortiz and Ollero, 2001; Stouffer et al., 2005)]. However, these technologies, with their removal efficiency ranging from 50% to 98%, require additional equipment, greater operating expenses, and increased costs for landfill disposal of the FGD residuals or by-products (Chou et al., 2005).
One of the most representative FGD residual is FGD gypsum, which is a waste material in the form of sludge or powdered sulfate and sulfite produced in high amounts through the wet FGD process in power stations and heating plants. Up to now, the FGD residuals from wet FGD are mostly used to produce gypsum plasterboards only (Tesárek et al., 2007), whereas the rest are deposited by landfills, reused in manufacturing cements or prefabricated building materials (Telesca et al., 2013), and in producing ammonium sulfate fertilizer (Chou et al., 2005). Although FGD gypsum can be partially utilized, most FGD residuals, including FGD gypsum, are quite difficult to be transported and disposed for high viscosity at low shear rates, resulting in plugging; whereas thixotropicity makes land disposal somewhat complicated (Goodwin, 1978).
Some researchers working on investigating novel materials or processes for use in FGD found some absorbents with high removable efficiencies and presented new processes that were able to recycle the absorbents. Among them, NaOH can be used as a desulfurizing adsorbent in the FGD process for its high reactivity of SO2, higher efficiency and operation stability, but its high maintenance and operating cost leads to the holdback of this technology for the reason that NaOH cannot be totally recovered and its final product in the FGD process is sulfate, which has no value for recycling as a desulfurizing adsorbent (Kohl and Nielsen, 1997; Liu et al., 1997; Dzhonova-Atanasova et al., 2013).
Thus, it is potentially prospective that the financial burdens caused by the costs for disposal of the FGD residuals can be greatly reduced if successful large-scale commercial utilization of the FGD residuals is developed.
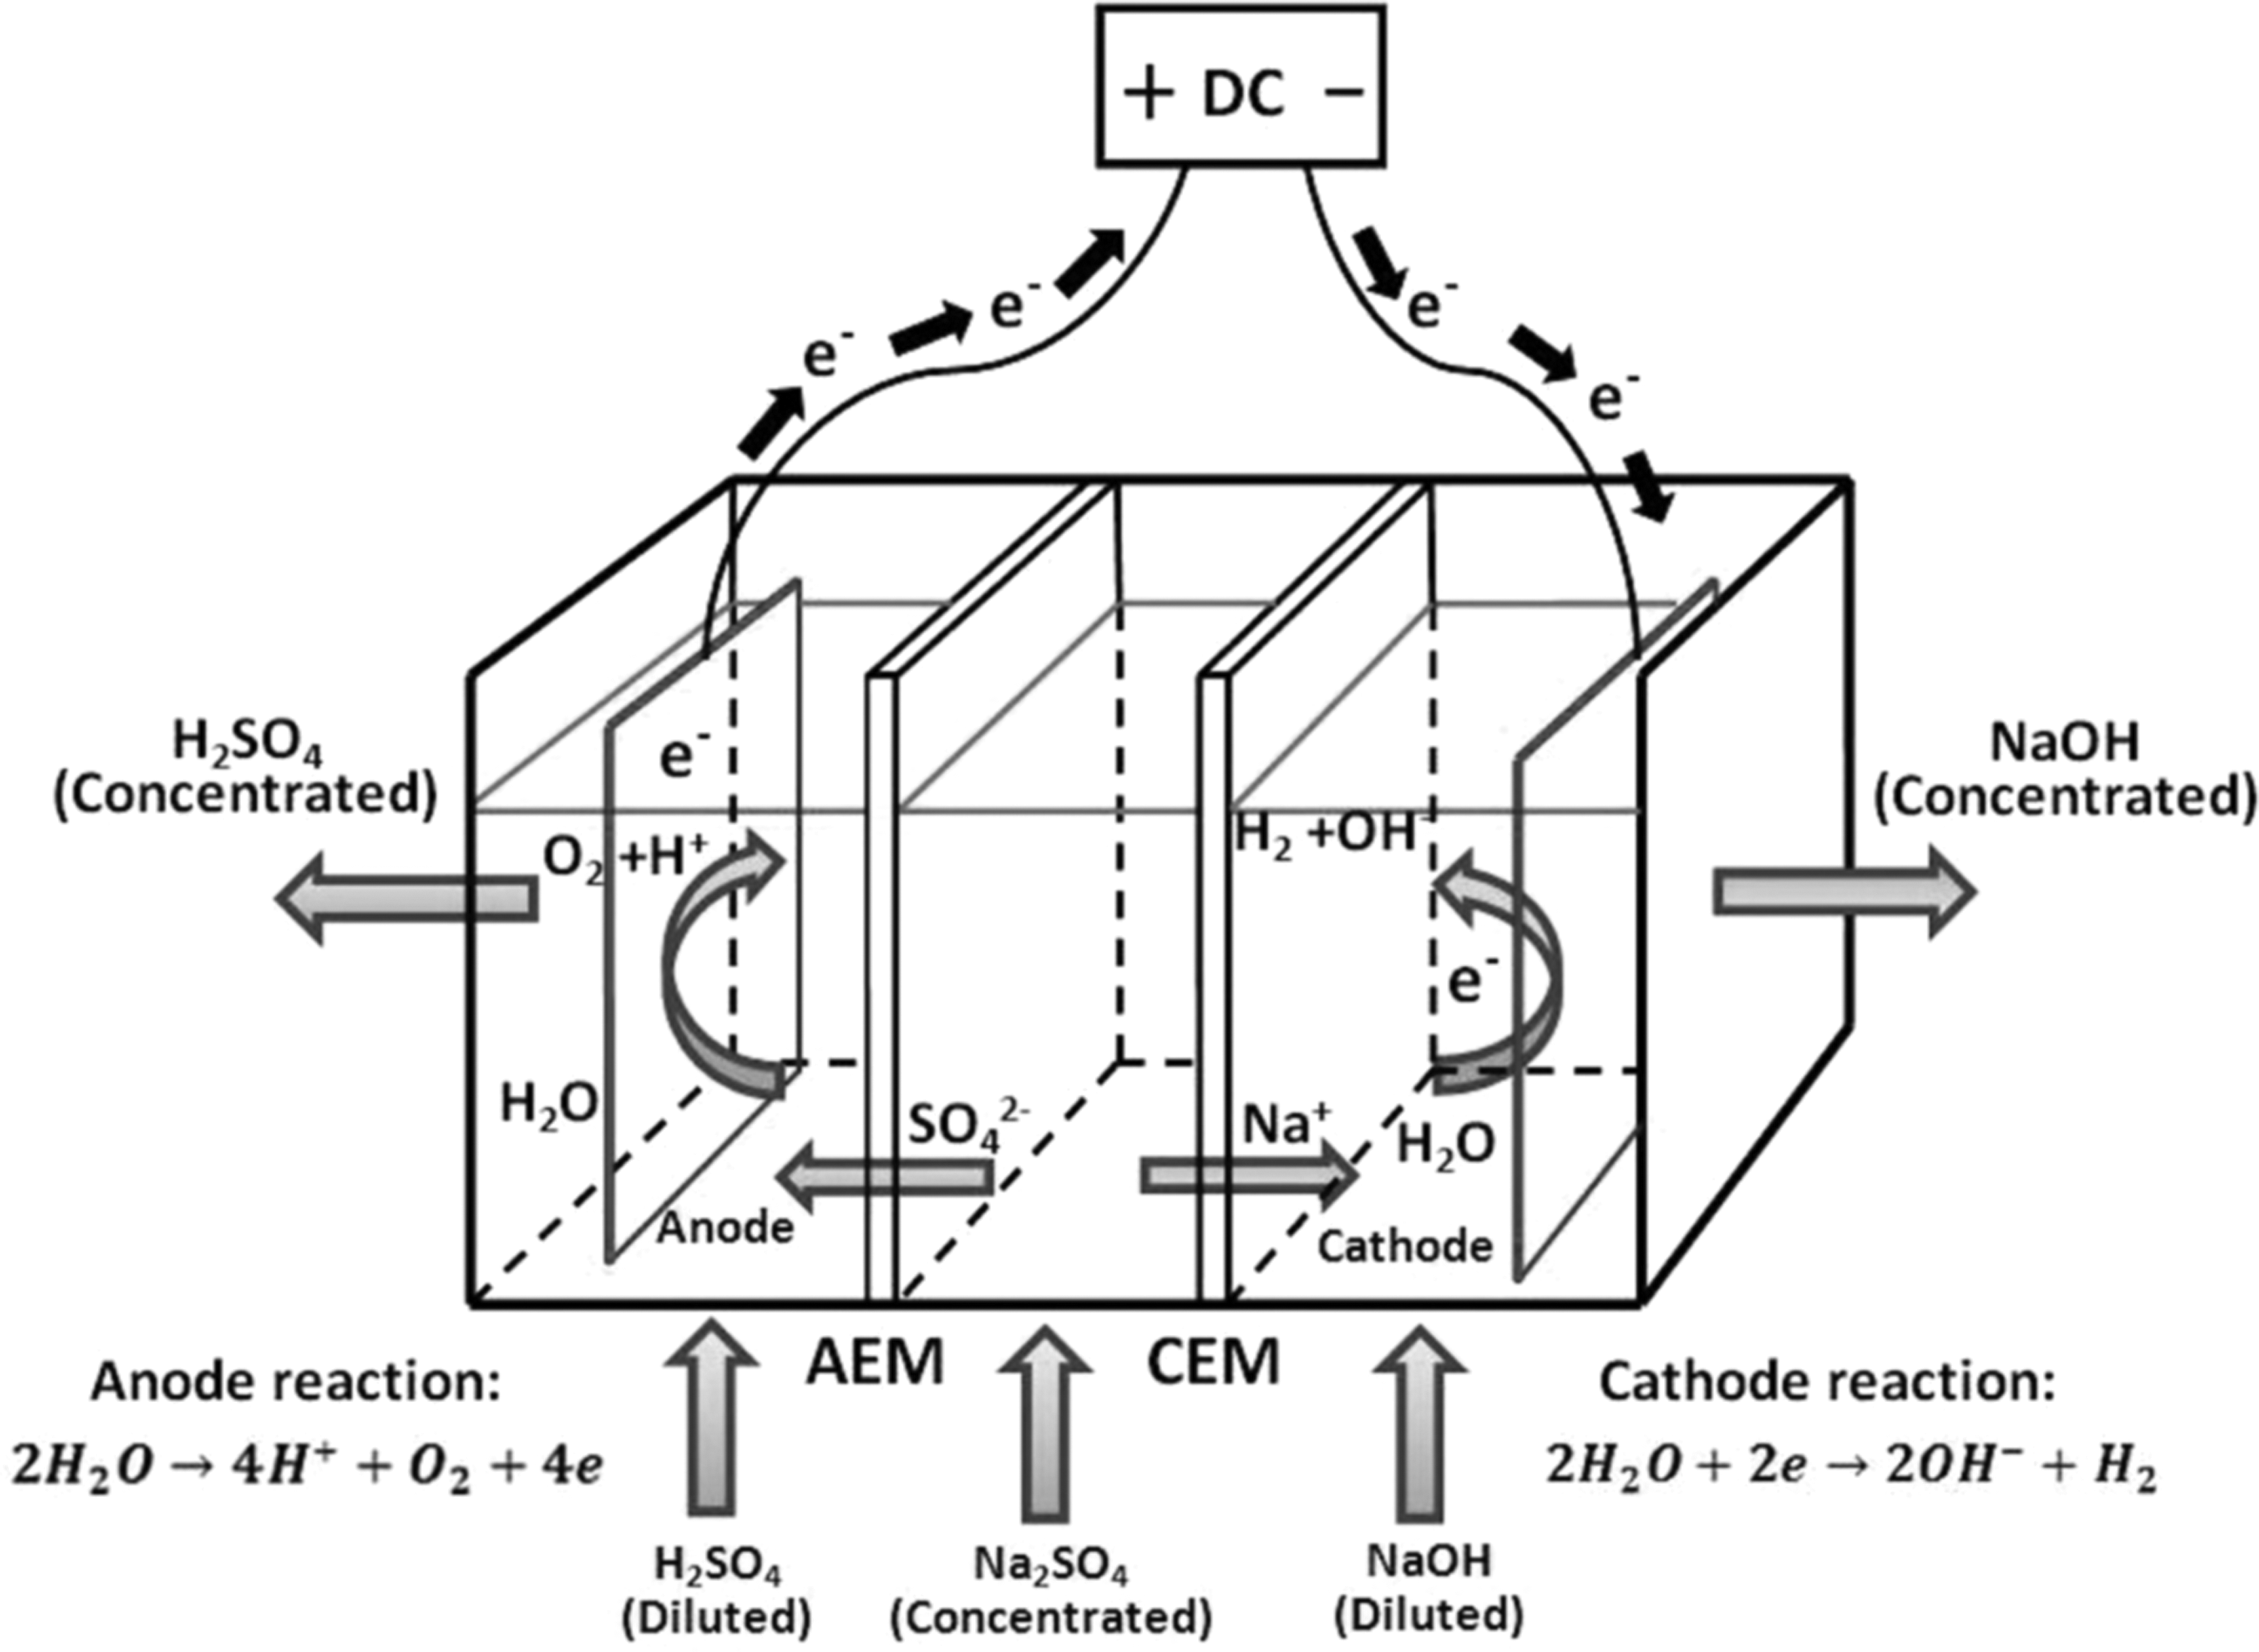
In this article, a novel method for hydrogen production and for regeneration of NaOH as the desulfurizing adsorbent from the FGD residuals produced in the process of wet FGD is presented. As shown in Fig. 1, the sodium hydroxide is regenerated by using the electrochemical method in the proposed three-compartment electromembrane reactor, which can be driven by the free surplus or low-cost valley electricity from the existing electrical power grid; the regenerated NaOH is sequentially recycled as a desulfurizing adsorbent in the wet FGD process; and the hydrogen is simultaneously produced at the cathode by water electrolysis using alkaline electrolyte (NaOH) obtained from the adsorbent regeneration step. Sulfuric acid is produced as a by-product in the anode chamber, which recovers sulfur from the flue gas.
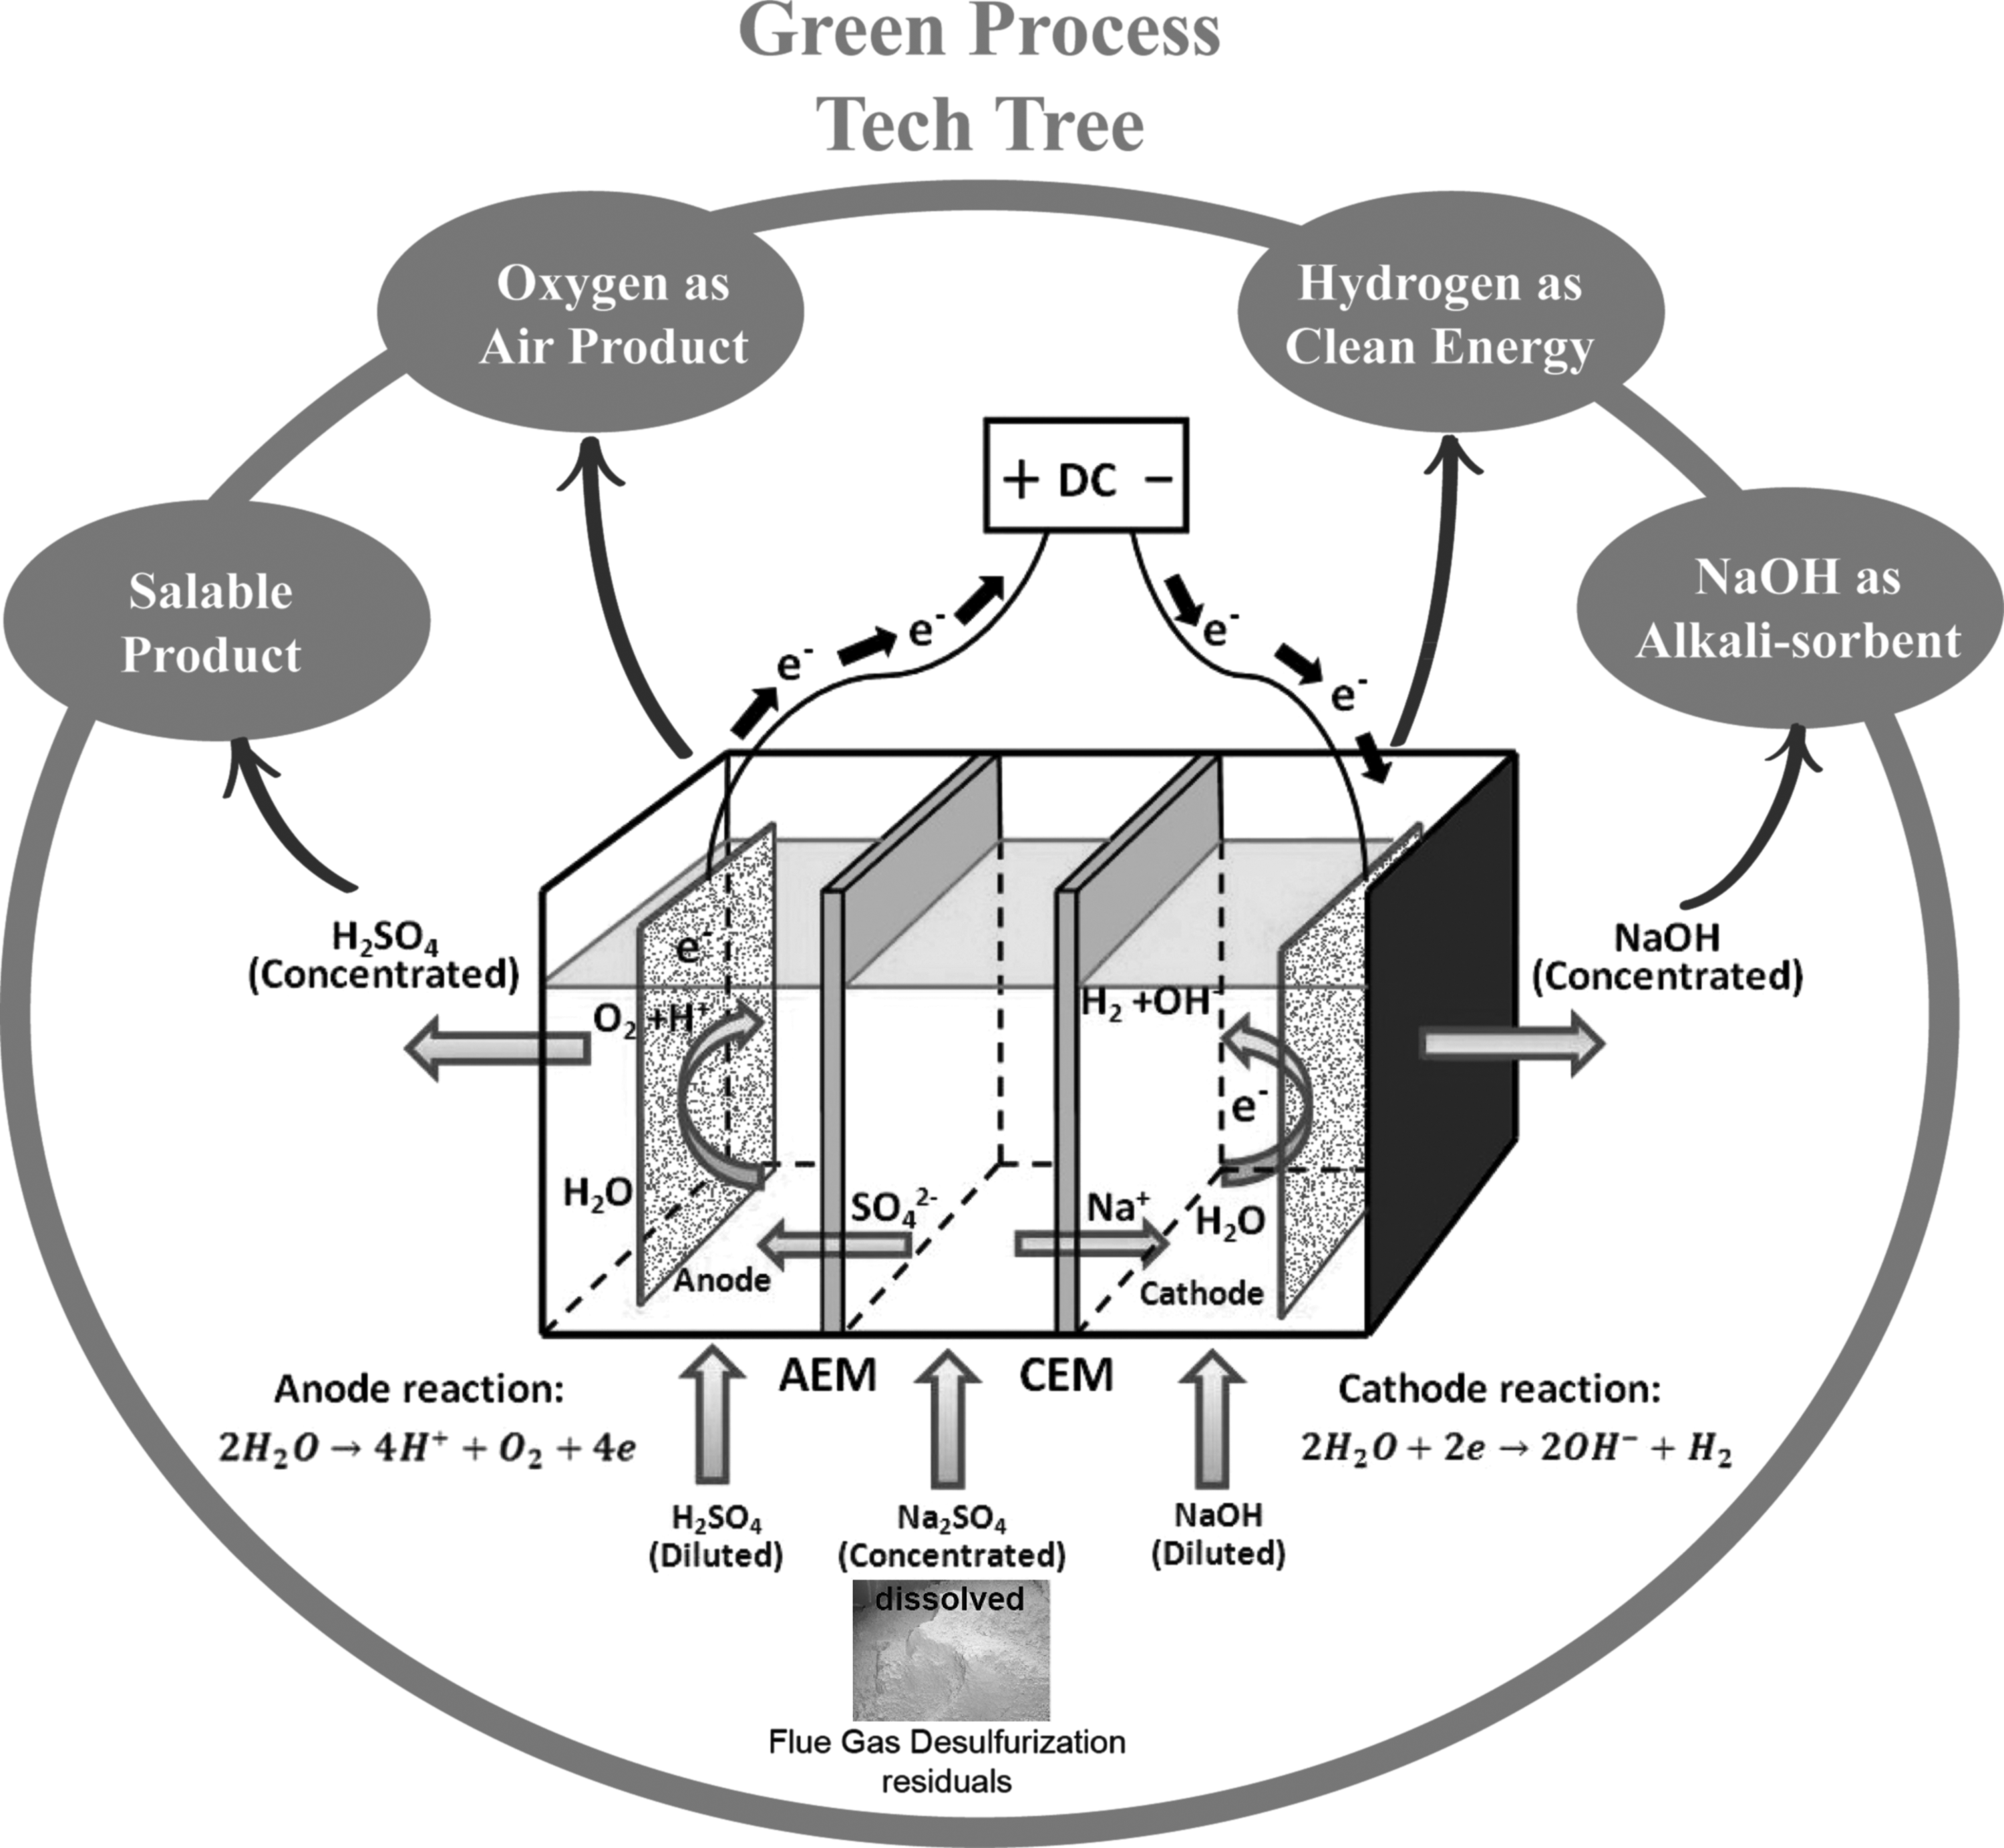
Schematic diagram of a three-compartment electromembrane reactor process for recycling and resource recovery of flue gas desulfurization residuals.
This process depicts an alternative way to address the thorny issue of the waste disposal resulting from the FGD residuals for recycling and resource recovery without secondary pollution. Meanwhile, oxygen produced on the anode can be collected as an air product.
In previous work, a simple mass transfer model was developed to improve the proposed electromembrane reactor performance and to optimize the operating parameters with the help of experiments (Yang et al., 2014). On the basis of this model, an extended multi-physics model was proposed and validated for a wide range of operating parameters by comparing with the analytical solutions and experimental data, which verified the capability of the model, allowed for a better understanding of the mechanisms, and provided an appropriate solution for a better designing of the reactor on lab scale (Yang et al., 2016).
However, mass transfer and chemical processes are scale independent. These processes behave differently on a lab scale and a large scale (in a commercial size). Generally, dimensional analysis as a basic concept understanding why existing industrial facilities do not perform properly, discovering the causes of these difficulties, and providing solutions is familiar to every chemical engineer in scaling up a lab-scale chemical unit to a commercial size.
Therefore, in this study, a mathematical model was developed based on the proposed static characteristics of the electromembrane reactor, and the dimensionless parameter groups were originally introduced into the developed model to understand the mechanism of the electrochemical processes and to remove barriers against scaling up a lab-scale chemical unit to a commercial size. The numerical solutions were obtained by Wolfram Mathematica® 8 (Wolfram Research) and MS Excel (Microsoft Corporation), and the capability of the developed model, flow pattern, and some scale-up considerations were subsequently discussed.
System Description
The main body of the electrolyzer was divided into three compartments by a cation-exchange membrane (CEM) (JCM-II; Wuxi Jianyi Co., China) and an anion-exchange membrane (AEM) (JAM-II; Wuxi, Jianyi Co., China). The cathode was made of titanium, whereas the anode was a Ti-based dimensionally stable anode (Ti-IrO2). The analysis of the FGD residuals indicates that the residuals contain more than 80% Na2SO4 and about 10% Na2SO3 by weight. Before being pumped into the middle chamber of the electromembrane reactor, the aqueous solution of the dissolved FGD residuals was introduced into the primary brine treatment system to remove the most impurities, including the insoluble components. Then, the Na+ and SO42−/SO32− in the middle compartment migrated through the CEM and AEM, respectively, when the electrolyzer was charged at a constant current density.
The hydrogen and oxygen evolution reactions are the main electrochemical reactions occurring on the cathode and anode, respectively, as shown in Equations (1) and (2). The overall reaction, shown in Equation (3), is the electrolysis of water.
In this study, all reagents were purchased from the Shanghai Chemical Reagent Co. (China) and were reagent grade or better. Deionized water was used throughout the experiments to prepare the sample solutions. The concentrations of sodium hydroxide and sulfuric acid were determined by acid-base neutralization titration by using standard acid (0.1 mol/L HCl) and base (0.1 mol/L NaOH) with phenolphthalein as an indicator. All the experiments were conducted three times to check the reproducibility of the results, and the match between successive experiments was within ±5%.
Model Equations
General assumptions
In this study, for simplicity, the electrochemical separation process and ionic fluxes in the designed electromembrane reactor were assumed to occur in a one-dimensional column along the x-axis. The most important physicochemical processes taking place in the electromembrane reactor can be divided into the zones shown in Fig. 2. Additional assumptions included the following:
(1) The diffusion boundary layers (DBLs) adjacent to the membranes were uniform and static; (2) The bulk solution in the compartment was completely mixed such that the concentration at any position of the electrolyte in this zone was similar; (3) The fluid flow in the compartment was incompressible between the two fixed parallel plates; (4) The aqueous solution of dissolved FGD residuals was assumed to be the solution of Na2SO4 in the middle compartment; (5) The distribution of current and pressure was uniform; and (6) No solution leaked through the membranes.
The most important physicochemical processes taking place in the electromembrane reactor.
Material balance
Alkali-sorbent (NaOH) regeneration, hydrogen production, and sulfur recovery process occurring in the proposed electromembrane reactor were operated in a batch mode with continuous recycling via three peristaltic pumps. Therefore, the material balance in this three-compartment electromembrane reactor can be expressed by the following equations:
where Va, Vc, and Vmid indicate the volume of anode chamber, cathode chamber, and middle chamber, respectively; Ci is the concentration of species i in the corresponding chamber of the electromembrane reactor, in which the superscripts a, c, and mid refer to anode chamber, cathode chamber, and middle chamber, respectively; Ni is the ionic flux of species i [“+”: cations and “−”: anions in Equations (4) and (5), which is the contrary in Equation (6)]; Am, Aa, and Ac indicate the effective area of the ion-exchange membrane, anode, and cathode, respectively; and
According to Equations (1) and (2), the theoretical molar production rate of hydrogen and oxygen evolution reactions can be described as follows:
where η (%) is the current efficiency of the product, F (96,485 C/mol) is the Faraday number, and i (A/m2) is the current density.
Mass transfer
The Nernst–Planck equation with electroneutrality conditions can be used to describe the flux of a certain mobile ionic species in the electrolyte solution:
where i = 1, 2, 3, and 4, which refer to ions of Na+, OH−, H+, and
The total current density, i, at any location in electrolyte solution comprises contributions from all species.
Generally, the ion transport through the membrane can also be expressed in the form of the Nernst–Planck equation as follows:
where
The integral/effective transport number (Ti), which is a function of membrane properties and depends on different contributions to the transfer such as migration, diffusion, and convection, can be used for describing the ion transport through the membrane (Nikonenko et al., 2010). It can be considered an adequate parameter, although it is true that it does not fully reflect the actual condition in the membrane. Therefore, the ionic flux through the membrane can be expressed in the following form:
Theoretically, the value of Ti can be any number, but the sum of Ti for all ionic species in the transport through the membrane must be equal to one. In a binary electrolyte solution, the transport number of an ionic species in the membrane can be expressed by the individual diffusion coefficient
Generally, commercial ion-exchange membranes are highly permselective to counterions. Because the diffusion coefficient of electrolytes in the membrane is 10 to 103 times lower than that in solution (Nikonenko et al., 2014), the contribution of diffusion in the membrane is generally low whereas the migration is the main term in Equation (12). Therefore, according to Equation (14), Ti of the counterion is only few lower than 1 because the concentration of co-ion in the membrane is much lower than that of the counterion. Incorporating the transport number (Ti) of counterions in the membrane and neglecting the convection term, the mass balance at the membrane/aqueous solution interface can be described through the equality of incoming and outgoing ionic flux as follows:
In Equation (15), the ionic flux of species i contributed by migration in solution can be written as Equation (16) (Bard and Faulkner, 2001):
where ti is the transport number of species i in aqueous solution. Inserting Equation (16) into Equation (15), the concentration gradient of species i at the membrane/aqueous solution interface can be expressed in the following equation.
Electrochemical reactions kinetics
In this study, the hydrogen evolution reaction (HER) and oxygen evolution reaction (OER) are the main electrochemical reactions occurring at the electrodes. The widely accepted mechanism of HERs consists of the following three steps (Bocutti et al., 2000; Birry and Lasia, 2004):
where M represents the active site of the metal on the electrode surface and MHads is the hydrogen absorbed on the electrode surface. In these three steps mentioned in Equation (18–20), the Volmer-Heyrovsky (V-H) reaction sequences are the possible mechanism (Sheng et al., 2010).
As for OERs, the mechanism is relatively more complicated than HERs, which depends on the oxide composition and the potential range. The generally accepted mechanism of OERs in acidic solution (Faria et al., 1996; Hu et al., 2004) is as follows:
where S is the active site on the anode oxide surface and
The rate of electrode reactions mainly depends on the nature of the electrode, pre-treatment of the electrode surface, and the composition of the electrolyte solution that is close to the surface of electrodes (Zeng and Zhang, 2010). Generally, it can be characterized by the current density. The electrode kinetics is an efficient tool that is used to establish the relationship between the current density and the surface overpotential and the composition of the electrolyte adjacent to the electrode surface. With the help of the Tafel equation, the overvoltage due to the electrochemical activation of the cathode and the anode in the proposed electrochemical reactor can be estimated by the following two equations, respectively (Hammoudi et al., 2012):
where ic,o is the exchange current density of the cathode, which is related to the nature of the electrode materials; θ and θe indicate the coverage and equilibrium coverage of absorbed Hads, respectively; α and β are the symmetry factors;
Dimensionless groups characterizing the developed model
According to the equations of material balance [Equations (4–6)] and mass transfer [Equations (9–17)], the mass balance in the proposed three-compartment electromembrane reactor process can be rewritten as the following equations:
Cathode chamber for Na+:
Anode chamber for
Middle chamber (i = 1, 4):
Reservoir of NaOH solution:
Reservoir of H2SO4 solution:
Reservoir of middle chamber:
where the subscripts in and s refer to the feed concentration of species i in the corresponding compartment and the concentration of species i at the surface of the ion-exchange membrane, respectively; ti,m is the transport number of species i in the membrane; δm is the average thickness of the ion-exchange membrane; Q (m3/s) is the feed flow rate of the solution; and VR is the volume of the reservoir.
Concentrations at the membrane surfaces mentioned earlier can be deduced from Equation (17) as follows:
where δ is the thickness of DBL in which diffusion and migration are the two main drivers of ionic mass transport in the current direction (Tanaka, 2004).
Dimensional analysis using dimensionless groups provides a powerful method for reducing the number of variables in electrochemical processes. For mass transfer under forced convection, at least three dimensionless parameters can be introduced in designed equation for scale-up of the electrochemical reactor. Those are Sherwood number, Sh, which represents the ratio of convective to diffusive mass transport; the Reynolds number, Re, which is defined as the ratio of inertial forces to viscous forces, and is used to characterize different flow regimes within a similar fluid, such as laminar or turbulent flow; and the Schmidt number, Sc, which is defined as the ratio of momentum diffusivity (viscosity) and mass diffusivity, and is used to characterize fluid flows in which there are simultaneous momentum and mass diffusion convection processes.
Sherwood number can be experimentally calculated by measuring the limiting current density and using the following equation:
where D is the diffusion coefficient of electrolyte solution, km is the mass transfer coefficient, h is the gap of flow channel, ze is the stoichiometric coefficient of the electrons consumed in an electrochemical reaction, and C∞ is the concentration in bulk solution. In dimensional analysis, Sherwood number can be further defined as a function of the Reynolds number, Schmidt number, and the system geometry (Isaacson and Sonin, 1976).
where ρ and μ are the fluid density and viscosity, respectively; l is the length of the current-carrying area (usually the length of electrode) in the flow direction; and w is the flow velocity in the channels. The fluid density can be empirically calculated by the following equations (And and Cooper, 2004):
where
On the other hand, the following equation has been found to be capable of adequately evaluating the viscosity of different solutes in aqueous solution (Laliberté, 2007):
where v1 to v6 are dimensionless empirical constants whose values of different solutes are listed in Table 2 as follows:
For laminar and turbulent flow patterns, the Sherwood number can be defined by Equations (44–46) based on the empirical correlations of Sh, Re, and Sc (Isaacson and Sonin, 1976; Ratkovich et al., 2011).
Therefore, the mass balance of the three-compartment electromembrane reactor can be rewritten as the following equations by introducing dimensionless groups (shown in Table 3):
Based on the developed model, the entire numerical solution and computational calculations with different operating parameters can be performed by Wolfram Mathematica 8 (Wolfram Research) and MS Excel (Microsoft Corporation). Table 4 shows the values of the model parameters involved in the computer prediction.
And, M.L., and Cooper, W.E. (2004). Model for calculating the density of aqueous electrolyte solutions. ChemInform 35, 1141.
Fidaleo, M., and Moresi, M. (2010). Application of the Nernst–Planck approach to model the electrodialytic recovery of disodium itaconate. J. Memb. Sci. 349, 393.
Huguet, P. (2005). The crossed interdiffusion of sodium nitrate and sulfate through an anion exchange membrane, as studied by Raman spectroscopy. New J. Chem. 29, 955.
Laliberté, M. (2007). Model for calculating the viscosity of aqueous solutions. J. Chem. Eng. Data. 52, 321.
Pawlowski, S., Sistat, P., Crespo, J.G., and Velizarov, S. (2014). Mass transfer in reverse electrodialysis: Flow entrance effects and diffusion boundary layer thickness. J. Memb. Sci. 471, 72.
Rakib, M., Moçotéguy, P., Viers, P., Petit, E., and Durand, G. (1999). Behaviour of Nafion® 350 membrane in sodium sulfate electrochemical splitting: Continuous process modelling and pilot scale tests. J. Appl. Electrochem. 29, 1439.
Ray, P., Shahi, V.K., Pathak, T.V., and Ramachandraiah, G. (1999). Transport phenomenon as a function of counter and co-ions in solution: Chronopotentiometric behavior of anion exchange membrane in different aqueous electrolyte solutions. J. Memb. Sci. 160, 243.
Weingaertner, H., Price, W.E., Edge, A.V.J., and Mills, R. (1993). Transport measurements in aqueous sodium sulfate: Evidence for like-ion pairs in concentrated solutions. J. Phys. Chem. 97, 6289.
Results and Discussion
Capability for mass transfer
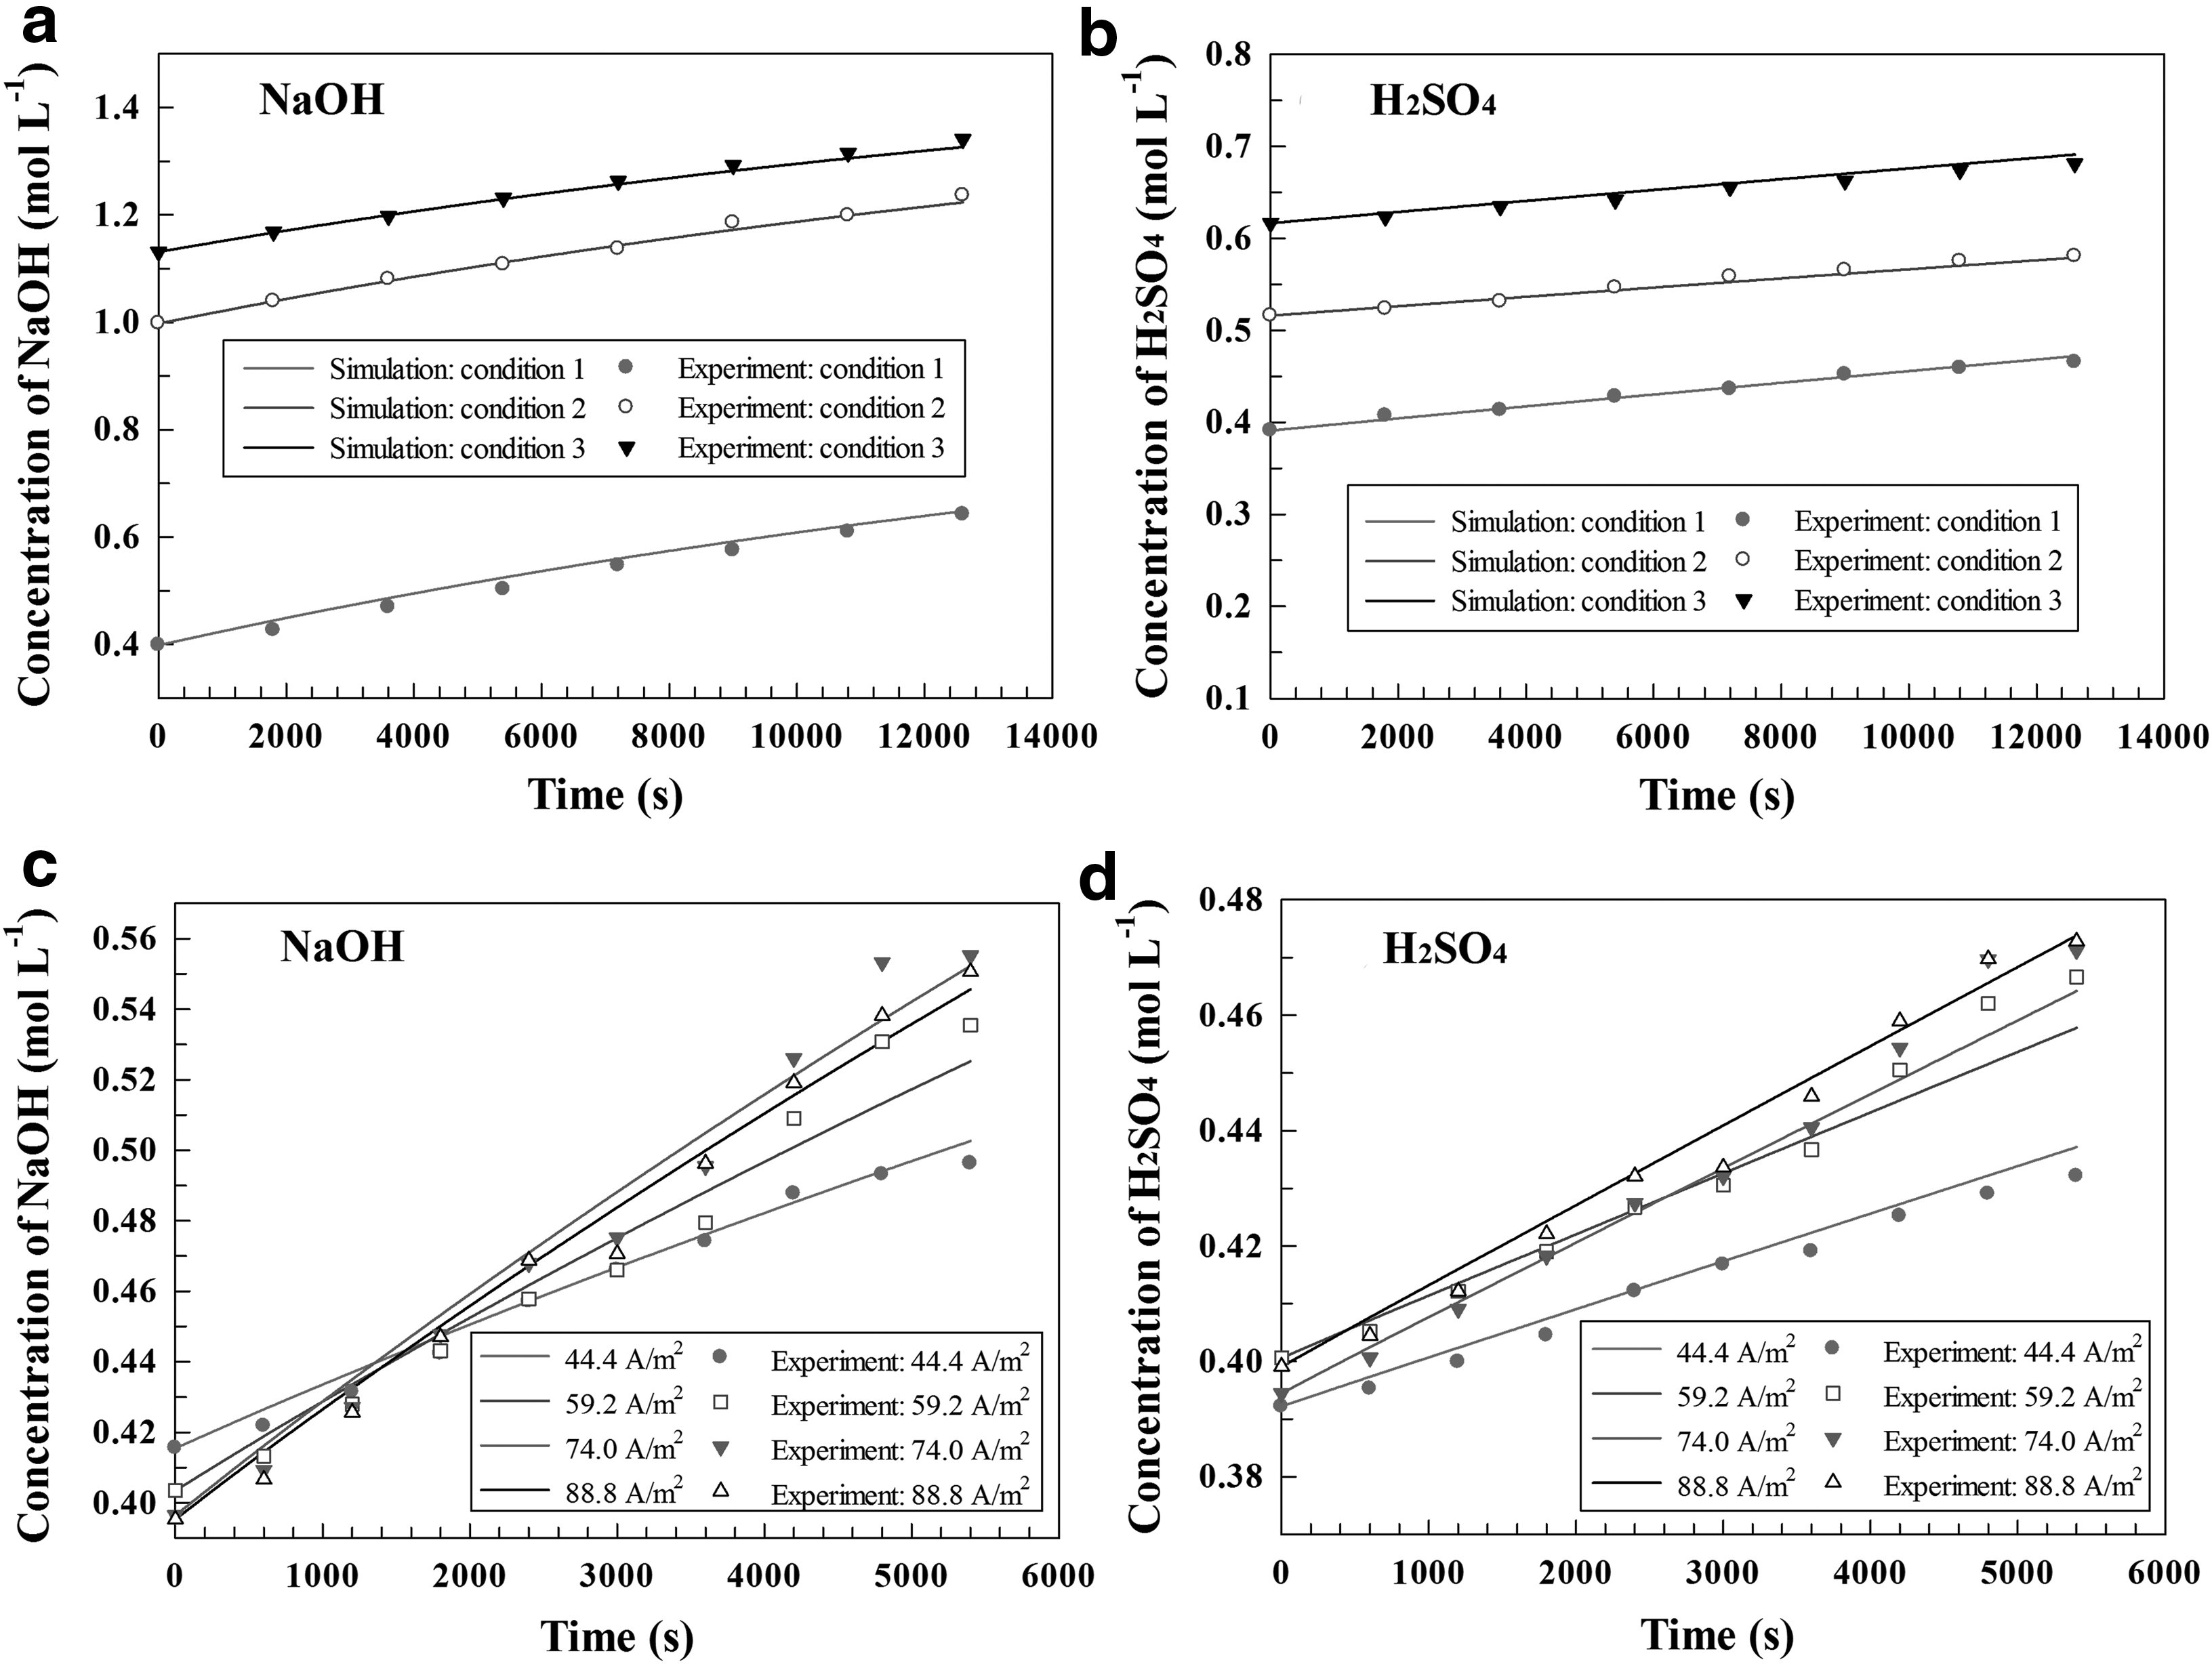
Figure 3 shows the numerical simulation results of the outlet concentrations of NaOH and H2SO4 with different feed concentrations and current densities applied by a direct current power.
Outlet concentration profiles of NaOH
The average thickness of DBL was assumed to be ∼2 mm (Pérez-Herranz et al., 2000). In Fig. 3a and b, sodium hydroxide and sulfuric acid solution with different initial concentrations were introduced into the cathode and anode chamber, respectively. The reactor was operated in a batch mode by continuous recycling via three peristaltic pumps, in which case the feed flow rate was 12.12 L/s and the current density was 74.0 A/m2. The initial concentration of Na2SO4 solution in the middle chamber was ∼1.40 mol/L in Fig. 3a and 0.70 mol/L in Fig. 3b, respectively. In Fig. 3c and d, the initial concentrations of acid and base solution were ∼0.40 mol/L in both, whereas the initial concentration of Na2SO4 solution in the middle chamber was about 1.0 mol/L. The other operating parameters were the same as those in Fig. 3a and b.
These findings indicated that the outlet concentrations of both acid and base increased with the increasing of time, and all the numerical simulation results agreed well with the experimental data, which verified the capability of the developed model for mass transfer.
Generally, the overall potential for a single electrochemical cell with membranes is the sum of the theoretical equilibrium potential of the electrochemical reaction, overpotentials on the anode and the cathode, and voltage losses across the membranes and electrolyte solution. As long as the setup of an electromembrane reactor is decided, the increases of the overpotentials of the electrodes are usually small whereas the voltage drops in electrolyte and membranes are apparent (Yang et al., 2015). Water is a poor conductor of electricity. Therefore, in practice, the introduction of a dilute solution of acid and base into the anode and cathode chambers, respectively, is an effective way to improve the performance of the proposed electromembrane reactor.
Effect of flow pattern
As shown in Fig. 3c and d, the slope of a plot of NaOH concentration or H2SO4 concentration at a given time (
According to Equations (7) and (8), the rate of hydrogen/oxygen production is controlled by current density, which means that a higher rate of an electrochemical reaction requires a higher current density, at the expense of more bubbles. The consequence of bubble formation in a huge amount is an increase of the resistance in electrolytes, a drop in current efficiency, and instability in the system performance. That is the reason why the net addition of NaOH outlet concentration decreased at an excessively high current density, as observed in Fig. 3c.
An effective approach that is adopted to reduce the resistances caused by bubble formation involves mechanically circulating the bulk solution, which can accelerate the detachment of the bubbles in the chambers. Therefore, besides the current density, flow pattern/fluid flow rate is a key parameter for optimizing the performance of the designed electromembrane reactor.
Figure 4a and b shows the simulation results of the concentration ratio between the outlet concentration and the initial feed concentration with different values of the Reynold numbers. The Schmidt number was estimated to be ∼1,832 calculated by Equation (40). In Fig. 4a, the concentration ratio increased with an increase in the value of Reynold number, but the growth was not apparently remarkable in the zone of high Reynold number, which indicated that the mass transfer may slow down. In Fig. 4b, it is apparent that the concentration ratio of acid concentration decreased when the Reynold number was equal to 800, theoretically indicating that an excessively high feed fluid flow rate had a negative effect on the performance of the reactor when the geometry of the reactor was determined, even though mechanical circulation can accelerate the detachment of bubbles as mentioned earlier.
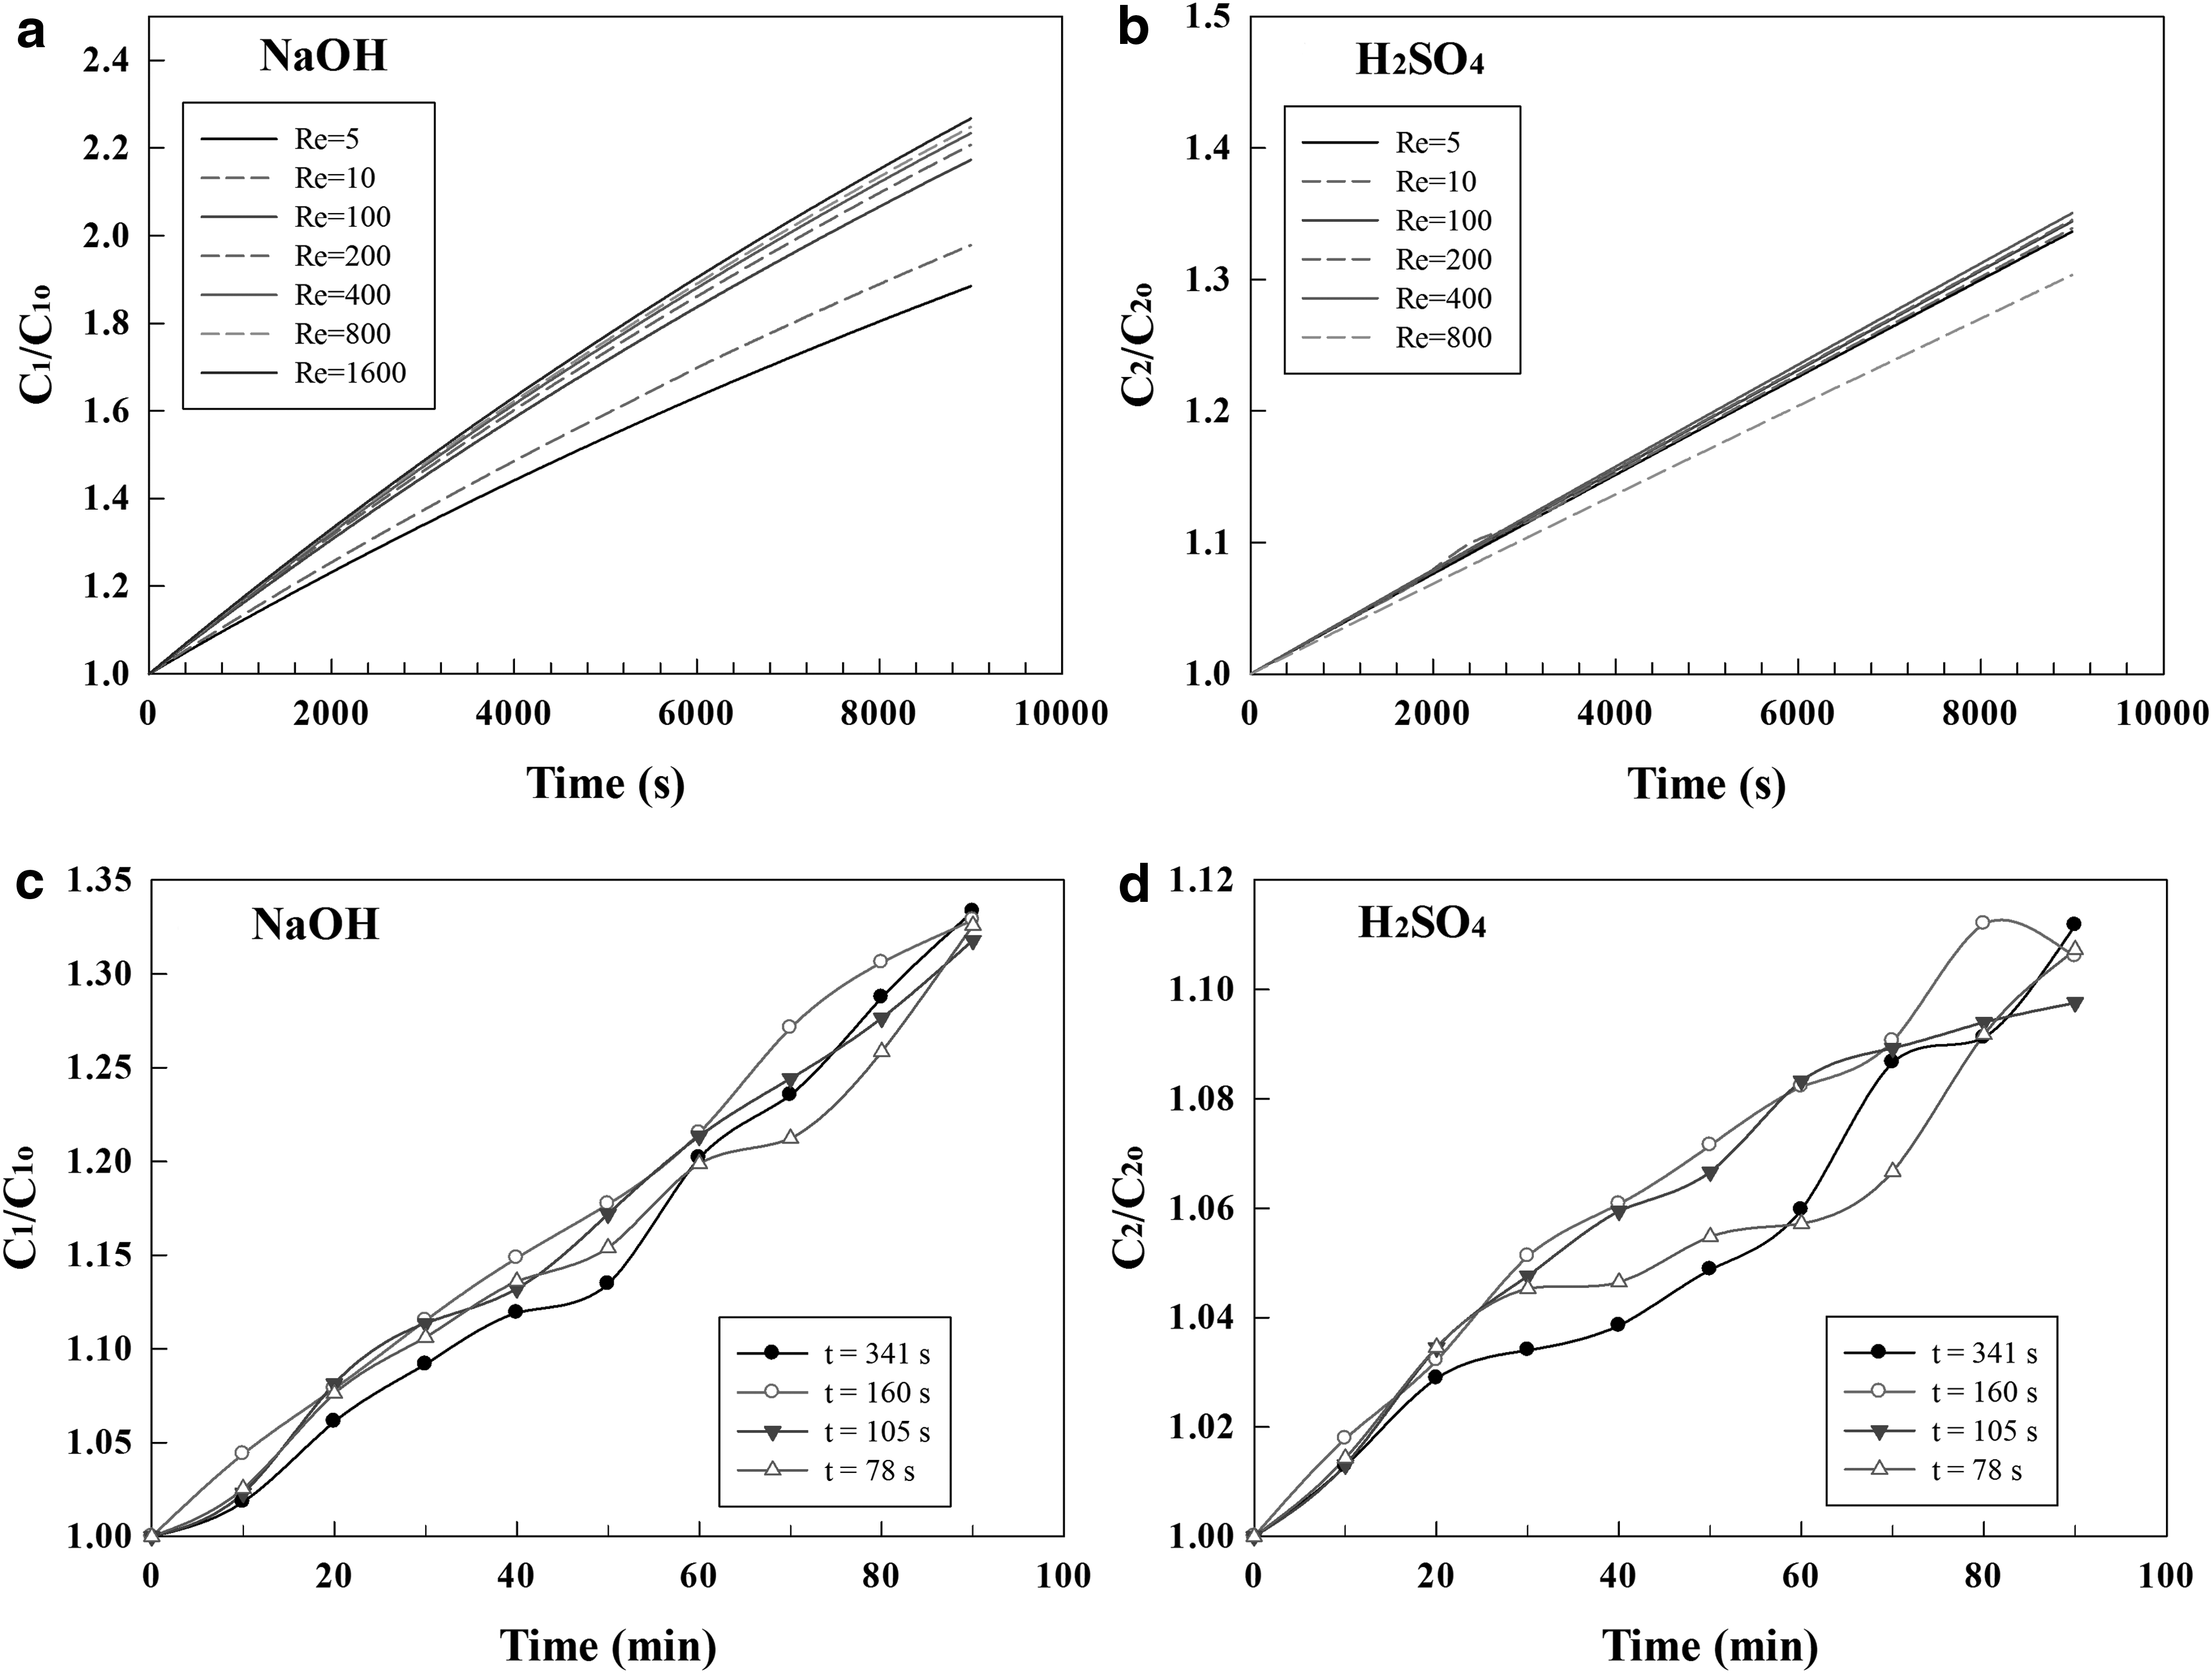
The experimental data show a similar tendency compared with the results of the numerical calculations, as shown in Fig. 4c and d. The findings indicate that concentration ratios of both NaOH and H2SO4 are higher at the feed flow rate of 12.12 L/s (retention time 160 s) and 18.48 L/s (retention time 105 s) than those at the feed flow rate of 5.70 L/s (retention time 341 s) and 24.84 L/s (retention time 78 s) most of the time. The mechanism of this tendency might be that the thickness of the boundary layer will achieve a critical value with the increase in the mechanically circulating rate, in which case the mass transport number will not be changed significantly when a feed flow rate is above this critical value (Barragán and Ruíz-Bauzá, 1998).
Slightly different from the simulation results, the oscillating behavior of the experimental data points in Fig. 4c and d is seen to be not only the experimental uncertainty but also the influence of bubble formation, which is of a stochastic nature and time dependent in a small partial area with gas-evolving electrodes. In addition, for simplicity, the DBLs adjacent to the membranes were assumed to be uniform and static in the general assumptions, although the DBL thickness can be considered a random variable. Theoretically, the average value of the DBL thickness can be estimated by Lévêque's equation (Kim et al., 2012).
where Do is the electrolyte diffusion coefficient at infinite dilution.
Figure 5 shows the results of the DBL thickness with different values of the Reynold numbers calculated by Equation (47). These results verify that the average DBL thickness may exist as a threshold value in a turbulent region (Re >2,000) whereas the DBL thickness changes significantly in the laminar region (Re <2,000). Because a highly turbulent region at an excessive feed flow rate will result in an apparent barrier of mass transfer along the x-axis, hence an appropriate feed flow rate is important for optimizing the performance of the reactor.
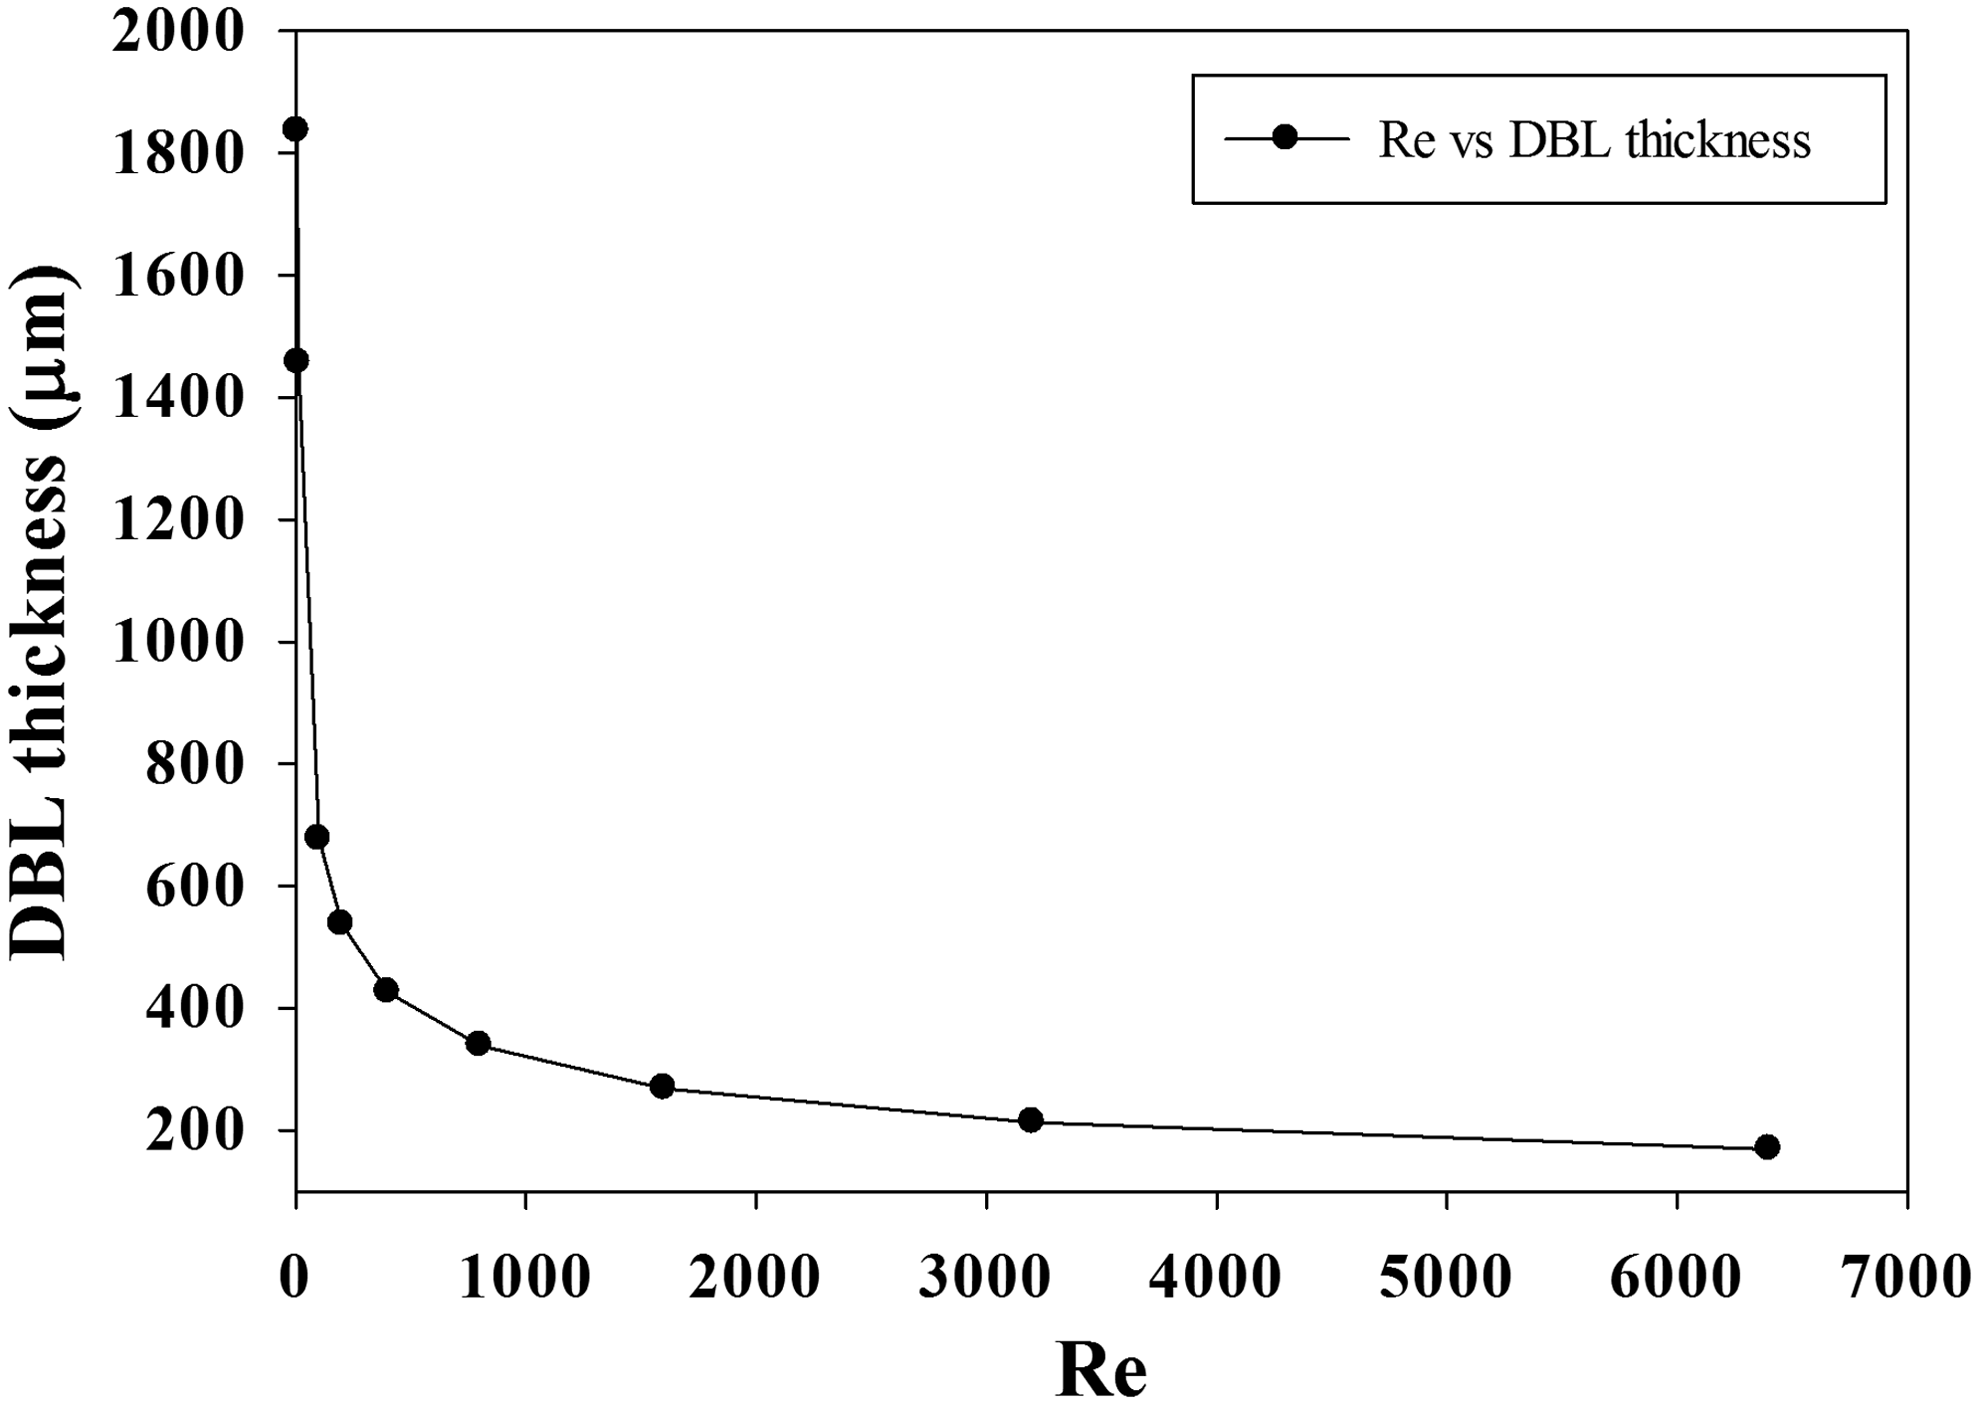
The theoretical average thickness of diffusion boundary layer close to the CEM with different values of the Reynold number. CEM, cation-exchange membrane.
Basic principles of scale-up
Figure 6 shows the results of numerical calculations of Re, Sc, and Sh in the cathode chamber for regenerating the alkali sorbent (NaOH) by equation sequences from (39) to (46) mentioned earlier. In Fig. 6a, the Reynold number increased with the increasing of feed fluid flow rate in all batches, which means that flow pattern has a strong influence on the Reynolds number, in which case convection may dominate the ionic mass transfer at a high fluid flow rate. In addition, the value of the Reynolds number exhibited a decreased tendency with the increasing of the concentration of NaOH in the cathode chamber whereas the value of Schmidt number exhibited a totally opposite tendency as shown in Fig. 6b.

Results of numerical calculations of Re
According to the definitions of Re and Sc by Equations (39–40) in the section of dimensionless groups characterizing the developed model, the viscosity diffusion rate will be dominant compared with mass diffusivity in the high Schmidt number region, which leads to a decrease of Re because of the enhancement of the viscous forces. Similarly, in the high Sherwood number region as shown in Fig. 6c, the convective mass transfer may hold a dominant position whereas the diffusive mass transfer may occupy an initiative in the low Sherwood number region. Meanwhile, a high initial concentration of NaOH also means the decrease of the concentration gradient across the membrane on the basis of the Nernst–Plauck equation, which has an adverse effect on mass transfer.
In general, the dependence of Sh on Re, Sc, and some dimensionless quantities can be expressed in the form of a power series, as shown in Equation (48) (Pak et al., 2001):
where
Equation (48) can be used as the design equation for the scale-up of the electrochemical reactor to maintain the same hydrodynamics and for defining the geometry of the reactor. Therefore, engineers can determine the control step by estimating the value of Re and Sc, and by employing an appropriate solution for optimizing the performance of the reactor. In summary, introducing the dilute solution of acid and base with an appropriate initial concentration into the corresponding compartment, applying an appropriate current, and recycling at a medium feed flow rate may improve the performance of the reactor with the help of the developed model and dimensionless groups.
Conclusions
In this work, a three-compartment electromembrane reactor process for recycling and resource recovery of FGD residuals was proposed, and a model for mass transfer was developed based on the Nernst–Plaunck equation. Assisting by introducing dimensionless parameters into the developed model, current density, flow pattern, and the initial concentration of acid and base are the key parameters in the process of optimization.
With the help of these dimensionless groups, the analysis of the model revealed that: (1) introduction of a dilute solution of acid and base into the corresponding compartment is an effective way to improve the performance of the reactor; (2) excessively high current density may lead to a decrease of the net addition of NaOH outlet concentration; (3) the average DBL thickness may exist as a threshold value in the turbulent region whereas the DBL thickness changes significantly in the laminar region; (4) being highly turbulent at an excessive feed flow rate will result in an apparent barrier of mass transfer; (5) the control step in mass transfer can be estimated by analyzing the value of dimensionless parameters; and (6) an appropriate solution for optimization and scaling-up can be clarified by the dependence of Sh on Re, Sc, and some dimensionless quantities.
If this technology is integrated into an existing FGD facility, the money-consuming chemical process could be transferred into a renewable resource and clean energy conversion process.
Footnotes
Acknowledgments
This research is based on work supported by the National Natural Science Foundation of China (Project No. 21277045), the Key Projects in the National Science & Technology Pillar Program during the 12th Five-year Plan (No. 2011BAZ01960), the Shanghai Leading Academic Discipline Project (Project Number: B506), and the Fundamental Research Funds for the Central Universities. Any opinions, findings, conclusions, or recommendations expressed in this publication are those of the authors and do not necessarily reflect the view of the supporting organizations.
Author Disclosure Statement
No competing financial interests exist.