
Abstract
Abstract
It was observed in previous studies that optical dissolved oxygen (DO) sensors were measuring values up to 1 mg O2/L in anoxic mixed liquor samples containing nitrite (NO2−). Based on these observations of false DO measurements it was hypothesized that NO2−, N2O, or NO were interfering with the DO sensors. A variety of DO probes were tested for interference while measuring NO2−, N2O, and NO. It was concluded that NO causes a positive inference with some models of optical DO probes. In bench-scale denitrification tests, 25 mg/L of NO2− led to the production of enough NO to cause a DO sensor reading of 1 mgO2/L. These findings are important for any wastewater treatment process that is utilizing online DO measurements in the presence of NO such as shortcut nitrogen removal processes.
Introduction
N
N2O and NO can be measured by Clark-type electrochemical sensors, in which a sensing anode and a reference electrode are placed in an internal electrolyte, which is contained in a gas-permeable membrane (Schreiber et al., 2008). Oxygen interference is eliminated in the N2O sensor through the inclusion of an oxygen-reducing guard cathode (Andersen et al., 2001). There are two main types of DO sensors available for liquid phase measurements: Electrochemical sensors (galvanic or polarographic) and optical sensors with luminescent or fluorescent techniques. Galvanic and polarographic cells operate through the use of an anode and a cathode contained in an electrolyte and isolated from the process medium by an oxygen-permeable membrane (Lee and Tsao, 1979). All optical DO probes operate under the same principle, which is the interaction of molecular oxygen with a fluorescing compound. Oxygen quenches fluorescence, which can be measured and related to the concentration of DO present via the Stern-Volmer equations. The sensor can either measure the fluorescence intensity or the excited state lifetime of the fluorophore (McDonagh et al., 2001).
It was observed in bench scale denitrification rate tests that optical DO probes were registering high readings even though no oxygen was being supplied to the reactor. This was occurring with mixed liquor samples from a full-scale nitrite shunt process and from the B-stage of a pilot-scale Adsorption/Bio-Oxidation (A/B) process. The spike in DO probe readings corresponded to the addition of NO2− at the beginning of the batch test. This led to the hypothesis that nitrite itself or an intermediate in the denitrification pathway was creating a positive interference with the DO sensor reading. Personal communications by the authors revealed that it is common to observe false DO readings during anoxic denitrification tests but the mechanism has never been studied. The objectives of this study were to determine which intermediate (NO2−, N2O, or NO) was interfering with the DO probe readings, to demonstrate that the interference occurs at levels of NO2− that are relevant to wastewater treatment processes, and to test a variety of DO sensors for interference.
Materials and Methods
Probe calibration
All DO probes were calibrated in water saturated air before measurements. When applicable a two point calibration was performed using a sodium sulfite solution to prepare a zero DO solution. To calibrate the nitric oxide and nitrous oxide sensors, a standard stock solution of nitric oxide or nitrous oxide saturated water was prepared. To prepare the nitric oxide stock solution nitric oxide gas (99.9%, Airgas) was bubbled through two washing bottles in series filled with 5 M NaOH. A septum bottle was filled with 10 mL of DI water. The output of the second washing bottle led to the septum vial, piercing the septum with a long needle attached to a diffuser. Nitric oxide was flushed through the setup for 10 min. To make the nitrous oxide stock solution nitrous oxide gas (99.99%, Airgas) was bubbled through a diffuser into a beaker of DI water. The temperature of the saturated solution was measured and was used to calculate the concentration of nitric or nitrous oxide in the saturated solution. The sensor was placed in a covered glass beaker. The beaker was sparged with nitrogen gas (99.999%, Airgas) for 5 min to remove oxygen. A syringe was used to withdraw the stock solution. A three point calibration was performed by spiking two known concentrations of NO or N2O plus a zero point. The range of the calibration matched the manufacturer's recommended range of each sensor, which was 0–42 μg/L-N for NO and 0–14 mg/L-N for N2O.
Tests in mixed liquor
Sample A was 8 L of return activated sludge collected from a full-scale plant performing nitrite shunt. The sample initially contained negligible concentrations of NO2− and NO3−. At the start of the test, acetate was dosed to an initial concentration of 400 mgCOD/L. Nitrite was dosed at the start of the test to target 25 mgN/L. Once NO2− was depleted, NO3− was dosed to a target concentration of 15 mgN/L to obtain the specific nitrite and nitrate removal rates. During the testing, a stand mixer provided adequate mixing to both reactors. The mixing speed was adjusted so that the liquid was adequately mixed while avoiding the creation of a vortex that could entrain air into the liquid. The liquid surface was covered with a floating Styrofoam sheet to further limit the surface transfer of oxygen. Approximately every 20 min over the duration of the test, a 15 mL aliquot was removed, filtered, and analyzed for NO3−-N, NO2−-N, and NH4+-N. DO was monitored using a Hach LDO 101 probe.
Sample B was 4 L of mixed liquor collected from the B-stage of a pilot-scale A/B process operating at 20°C, hydraulic retention time of 4 h, and solids retention time of ∼10 days. In this test nitrite and acetate were spiked in the sample while monitoring NO and N2O along with DO measurements from the probes listed in Table 1. When the DO concentration reached below 0.10 mg/L the reactor was spiked with ∼25 mg N/L of sodium nitrite and 150 mg COD/L as sodium acetate. The reactor was operated for 2.25 h and samples were collected at 10 or 15 min intervals. After 2 h nitrogen gas was bubbled into the reactor to strip nitric and nitrous oxide and then aerated to compare DO probe readings. All collected samples were filtered through 1.5 μm glass fiber filters and analyzed for NO3−-N, NO2−-N, NH4+-N, and sCOD. The reactor was continuously mixed through use of a magnetic stir plate. Temperature was controlled by submersion in a water bath to 20°C. The reactor was covered to prevent oxygen transfer. The pH stayed between 6.7 and 7.5.
Test in tap water
In this test nitric oxide and nitrous oxide gas were added to tap water to measure the effect of the pure gas on the DO probe measurements. The probes listed in Table 1 were placed in a 5 L covered reactor with 4 L of tap water. The reactor was continuously mixed by a magnetic stir plate. Temperature was controlled by submersion in a water bath to 20°C. First nitric oxide gas (99.9%, Airgas) was bubbled into the reactor through a diffuser. Then nitrogen gas (99.999%, Airgas) was bubbled through a diffuser to strip the nitric oxide gas. This was repeated again and then nitrous oxide gas (99.99%, Airgas) was bubbled through a diffuser and then stripped using nitrogen gas. The reactor was then aerated to compare DO probe readings in the presence of oxygen.
Results and Discussion
DO probe interference during denitrification tests
During the denitrification test for Sample A, it appears that the DO readings were affected during the presence of nitrite. Figure 1 shows the decreasing nitrite concentration from time 0 to ∼240 min and the measured DO response. The probe showed significant DO values over this period despite the reactor not being aerated. Also, the DO readings trend with the NO2− measurement. During this period the LDO probe was removed several times, washed, and placed in sodium sulfite solution. Each time, the DO would drop rapidly to about 0.1 mg/L. But when the probe was returned to the reactor it exhibited the unexpected high DO response. It is also clear from Fig. 1 that the presence of NO3− does not impact the DO measurement.
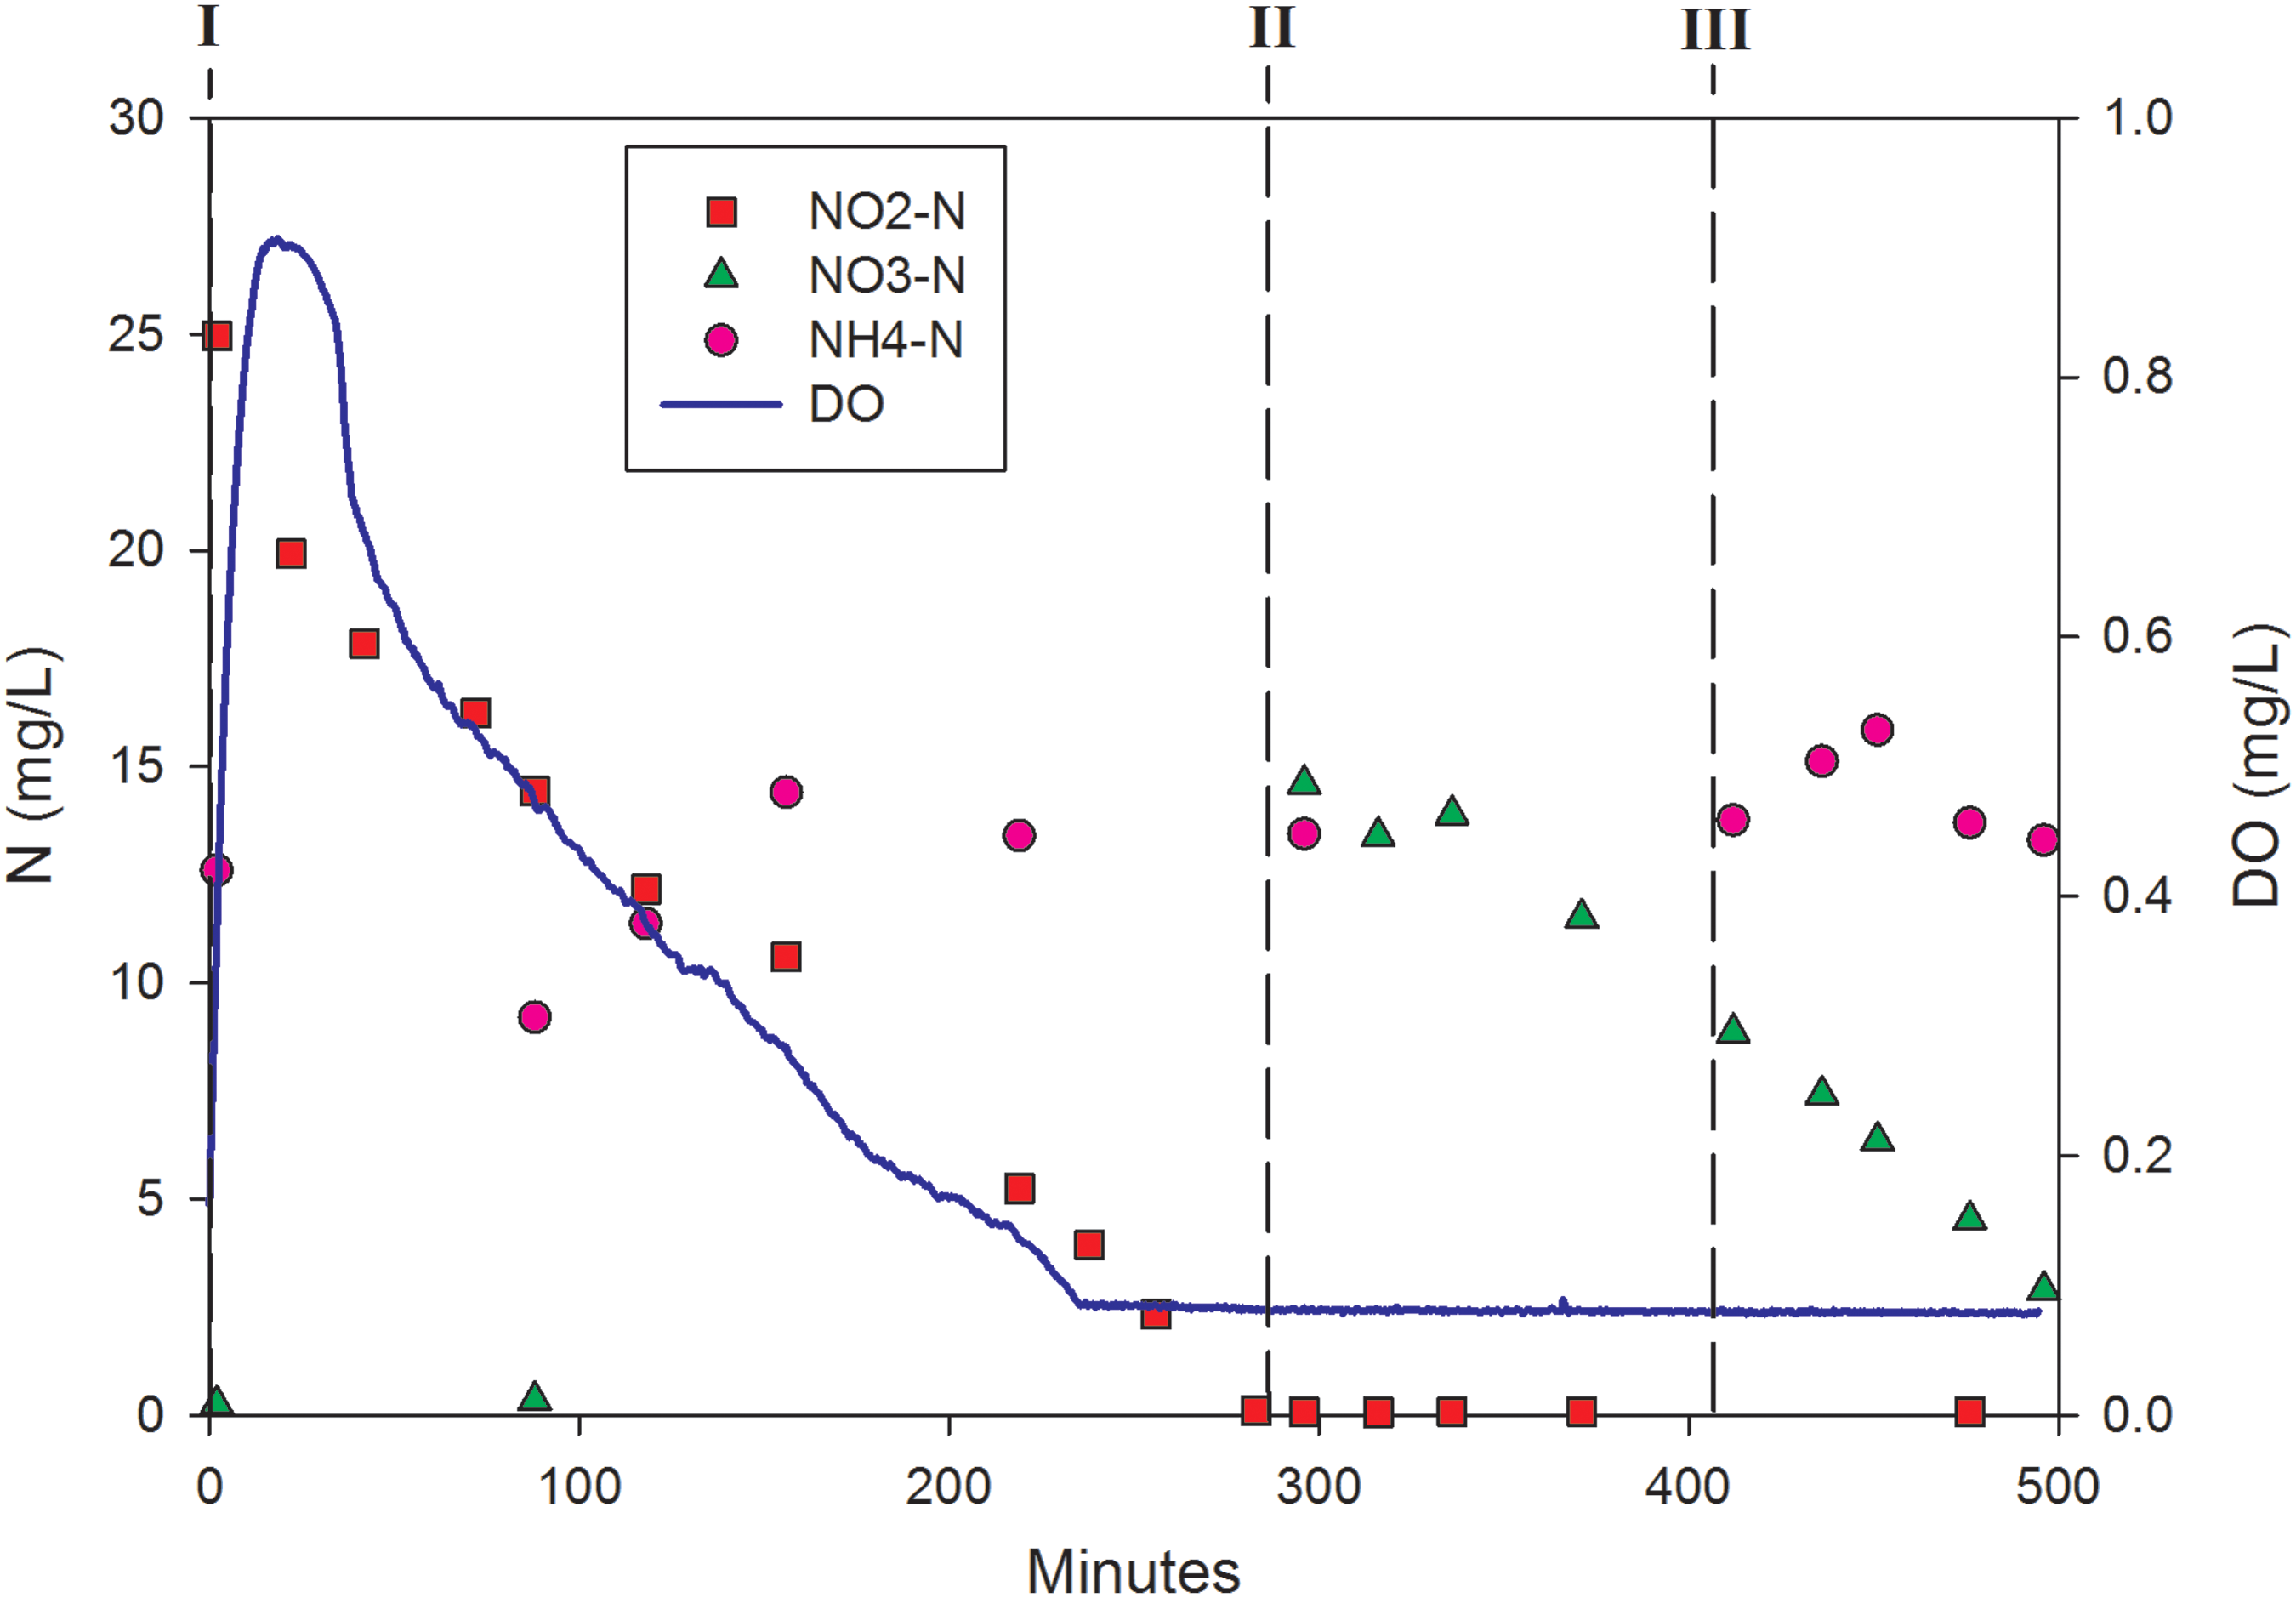
Sample A denitrification test nitrogen measurements and DO sensor output. At the beginning of Phase I (time = 0) 25 mg/L NO2−-N and 400 mg COD/L of sodium acetate was dosed. At the beginning of Phase II once NO2− was depleted, 15 mg/L NO3−-N was dosed. At the beginning of Phase III 200 mg COD/L of sodium acetate was dosed. There was no aeration during this test. DO was monitored using a Hach LDO 101 probe. DO, dissolved oxygen.
During the denitrification test for Sample B, the NO and N2O concentrations were measured by online sensors in addition to DO sensor readings. The initial spike of nitrite to the reactor caused an immediate increase in liquid phase NO concentration followed by a slower increase in N2O concentration (Fig. 2a). It should be noted that the NO concentration was outside of the range of the calibration (0–42 μg/L-N). However, the important observation is the presence of NO and its effect on the DO sensor. The increase in NO concentration corresponds to an increase in the DO readings of the Hach LDO and YSI FDO probes (Fig. 2a). When nitrogen gas was sparged in the reactor, the NO was stripped and the DO readings decreased as the NO concentration decreased. NO3− levels were decreasing in the reactor during the duration of the test, however, NO2− and NO were staying constant and N2O was increasing (Fig. 2a, b), so it can be assumed that the denitrification pathway was stopping at N2O and partial denitrification was occurring (Schulthess et al., 1995). At the end of the test, oxygen was provided to the reactor to demonstrate that all of the probes were functioning properly and DO readings were approximately in agreement. Although both NO and N2O are listed by the manufacturer as interfering with the YSI membrane DO probe, the YSI membrane probe did not exhibit the same interference as the Hach LDO and YSI FDO probes. This observation is not necessarily true for all membrane DO probes. Surprisingly, the Insite probe did not respond to the high levels of NO even though it uses fluorescent technology similar to the YSI FDO and Hach LDO, which did respond to NO. While the cause of this discrepancy is unknown, some potential explanations are differences in quenching compounds, selectivity of covering membranes, or types of host matrices. Further studies will need to take place to understand, and potentially eliminate, the cause of the interference.

DO probe interference in tap water with NO and N2O gas present
The DO readings during the denitrification test appeared to be trending with NO, however, there was also N2O present, so an experiment was performed in tap water with just NO or N2O gas present to demonstrate that NO is the interfering gas and not N2O. From the results of the test in tap water, it is clear that spikes in the DO readings of the Hach LDO and YSI DO probes occurred with the addition of NO gas and not with the addition of N2O gas (Fig. 3). The NO gas also appears to register slightly on the N2O probe. Again the Insite fluorescent probe and YSI membrane probe were not affected by the presence of NO.
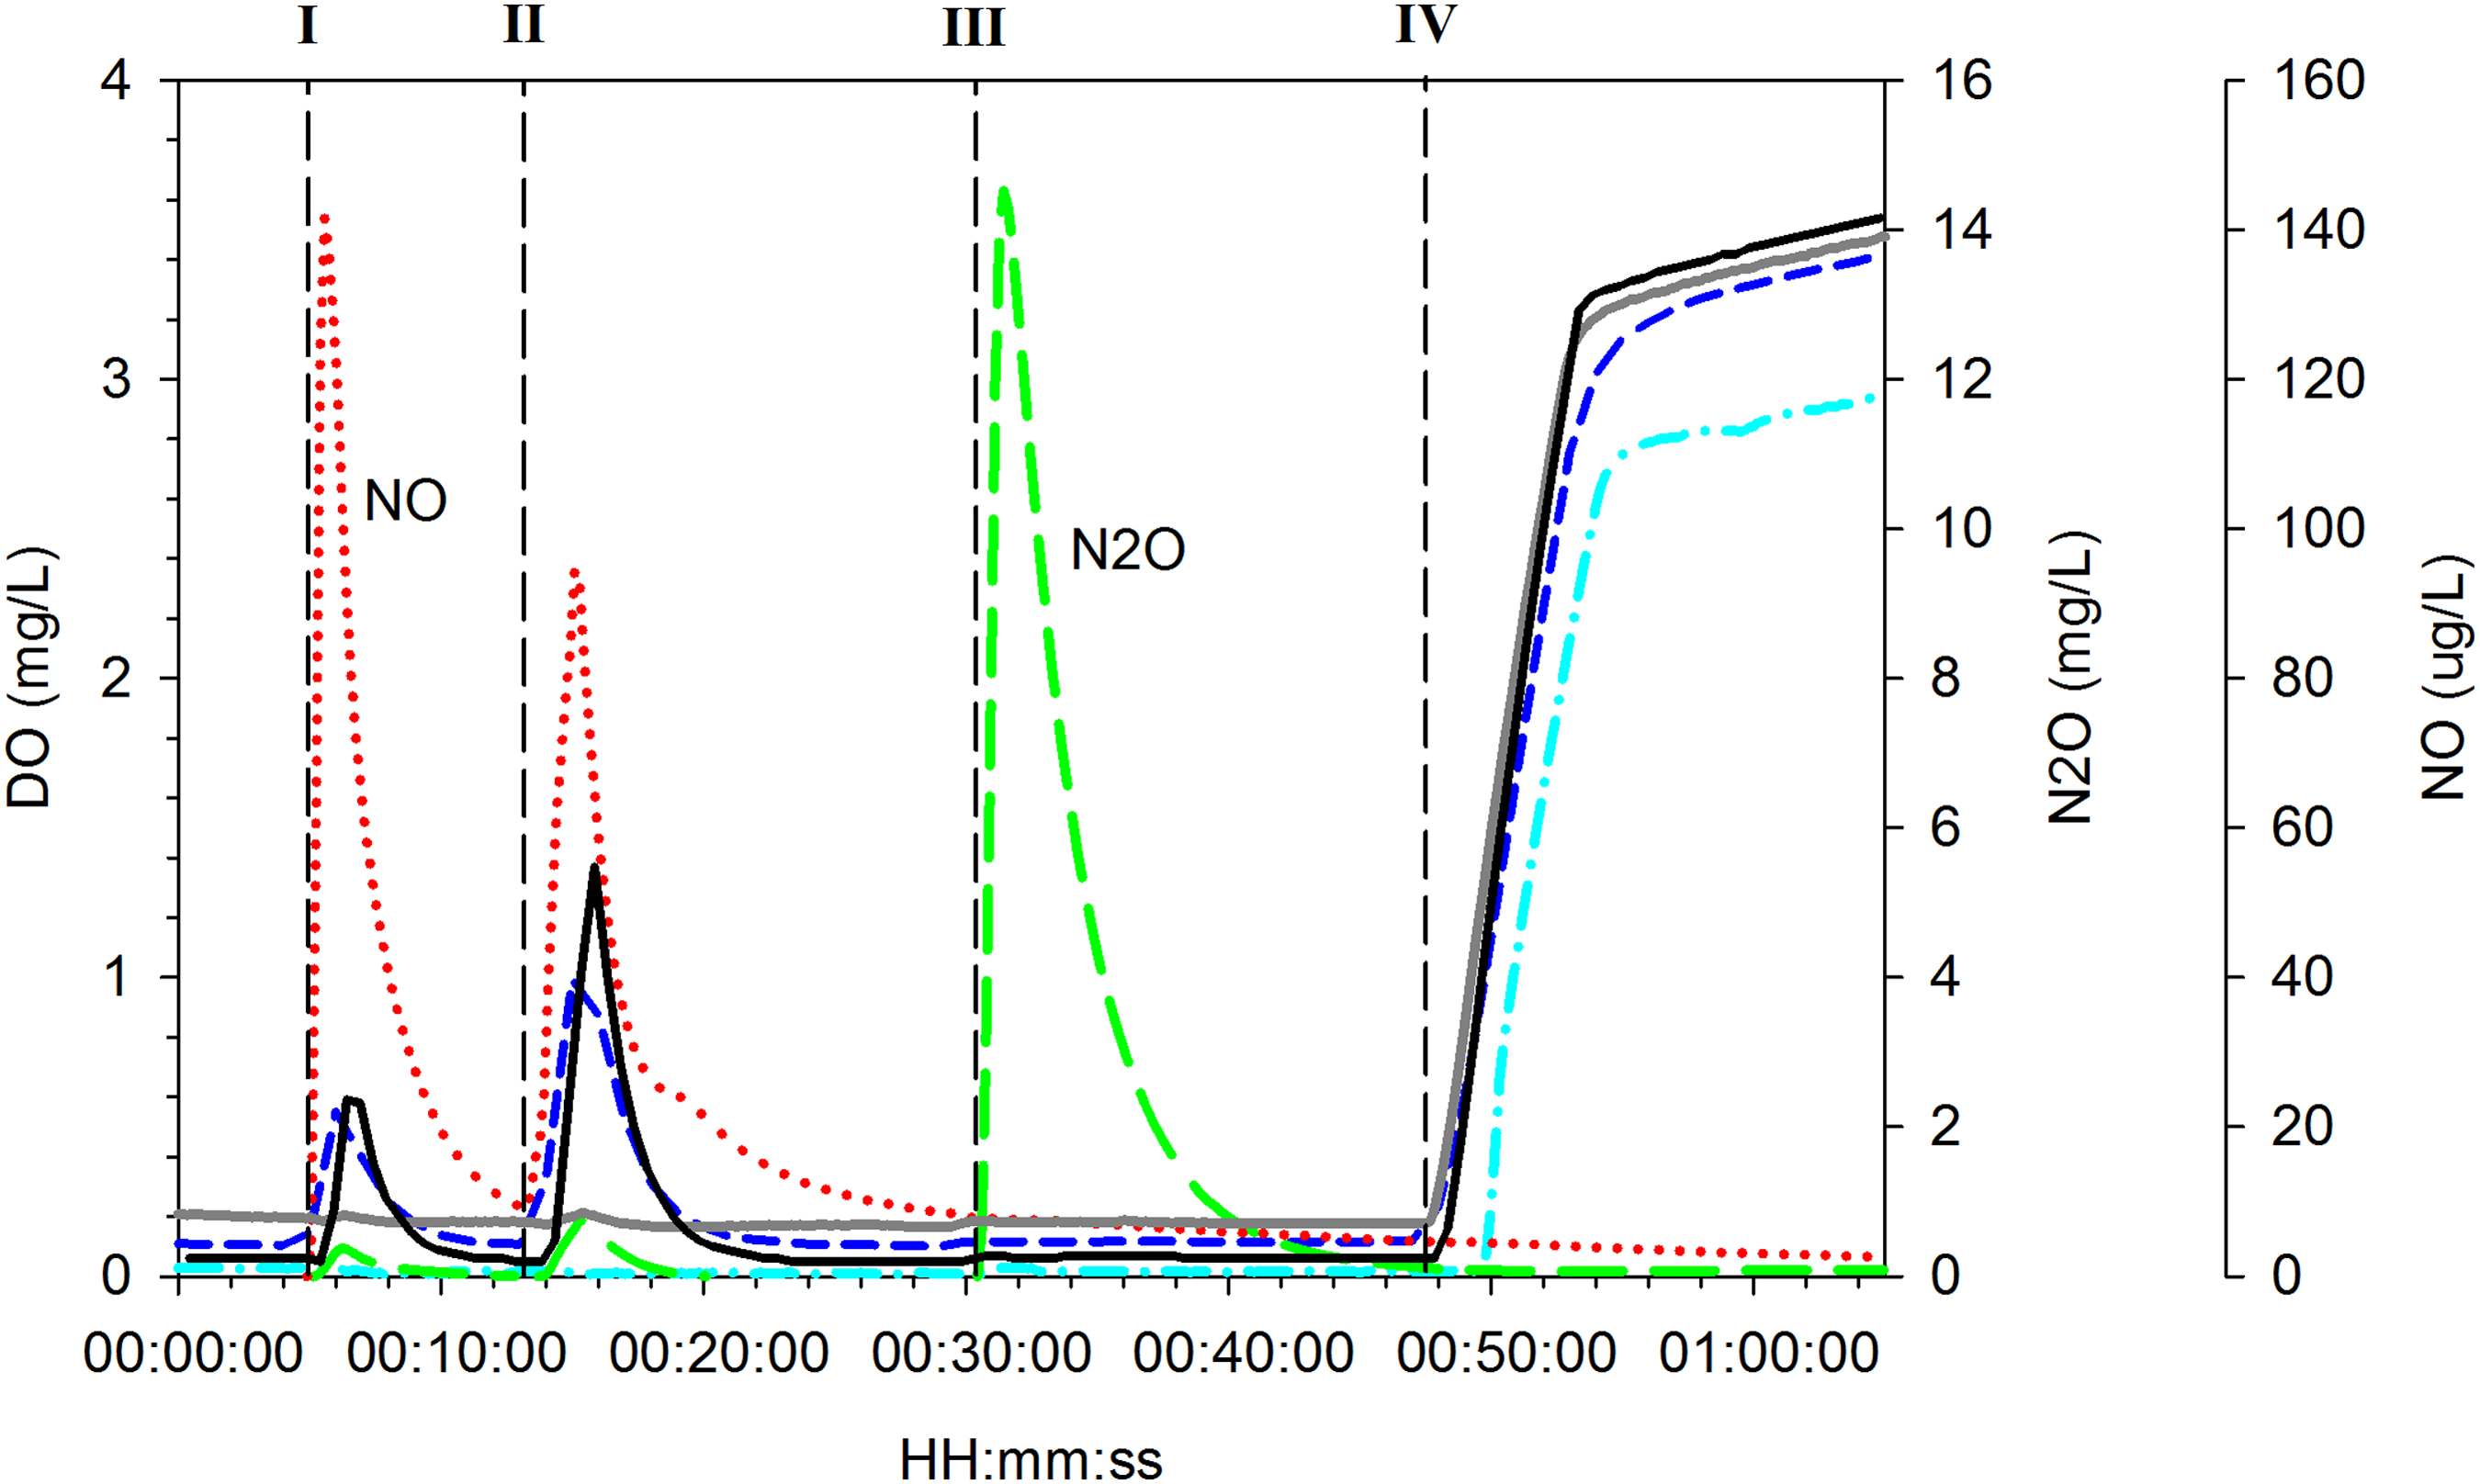
Test in tap water DO, NO, and N2O sensor outputs. NO (red, dotted), N2O (green, long dash), Insite DO (cyan, dash dot), YSI DO (blue, short dash), YSI membrane (gray, solid), Hach LDO (black, solid). Phases I and II: Spike of NO gas followed by stripping of NO using N2 gas. Phase III: Spike of N2O gas followed by stripping of N2O using N2 gas. Phase IV: Sparging air.
Significance of NO interference on DO measurements in biological nitrogen removal processes
When performing bench-scale denitrification tests, it is important to maintain a completely anoxic sample. If nitric oxide in the sample is causing a falsely high DO reading, the researcher performing the test may come to the incorrect conclusion that either oxygen is getting into the sample, or the DO sensor needs to be replaced. Nitrite concentrations above 25 mg/L (concentration used in this study) are common in sidestream shortcut nitrogen removal processes (Wett and Rauch, 2003; Lackner et al., 2014), and thus DO probe interference may be a concern for full-scale shortcut nitrogen removal processes. In mainstream shortcut nitrogen processes NO2− levels would not be as high, however, if operating at low DO (0.2–0.5 mg/L) NO production could potentially have a large effect on DO measurement.
In addition to denitrification bench tests, this phenomenon has also been observed in sidestream shortcut nitrogen removal processes (Wett and Rauch, 2003). The interference with the DO probe was assumed to be associated with high levels of nitrite but the exact mechanism was unknown.
In the study by Wett and Rauch (2003), it was observed in a full-scale intermittently aerated sidestream sequencing batch reactor performing nitrite shunt that DO probe readings appear to read artificially high immediately after aeration stops (Fig. 4). This is when NO production would be expected to increase due to transient anoxia and average NO2− concentrations of 100 mgN/L (Wett and Rauch, 2003). According to the authors, the increase in DO concentration in the absence of aeration around 1,100 min was explained as “oxygen sensor was interfered by high NOx-level during the anoxic settling period” (Wett and Rauch, 2003). A YSI membrane type DO probe was used in this study. In light of data from the present study it seems most likely that the production of NO was the cause of the false DO measurement.
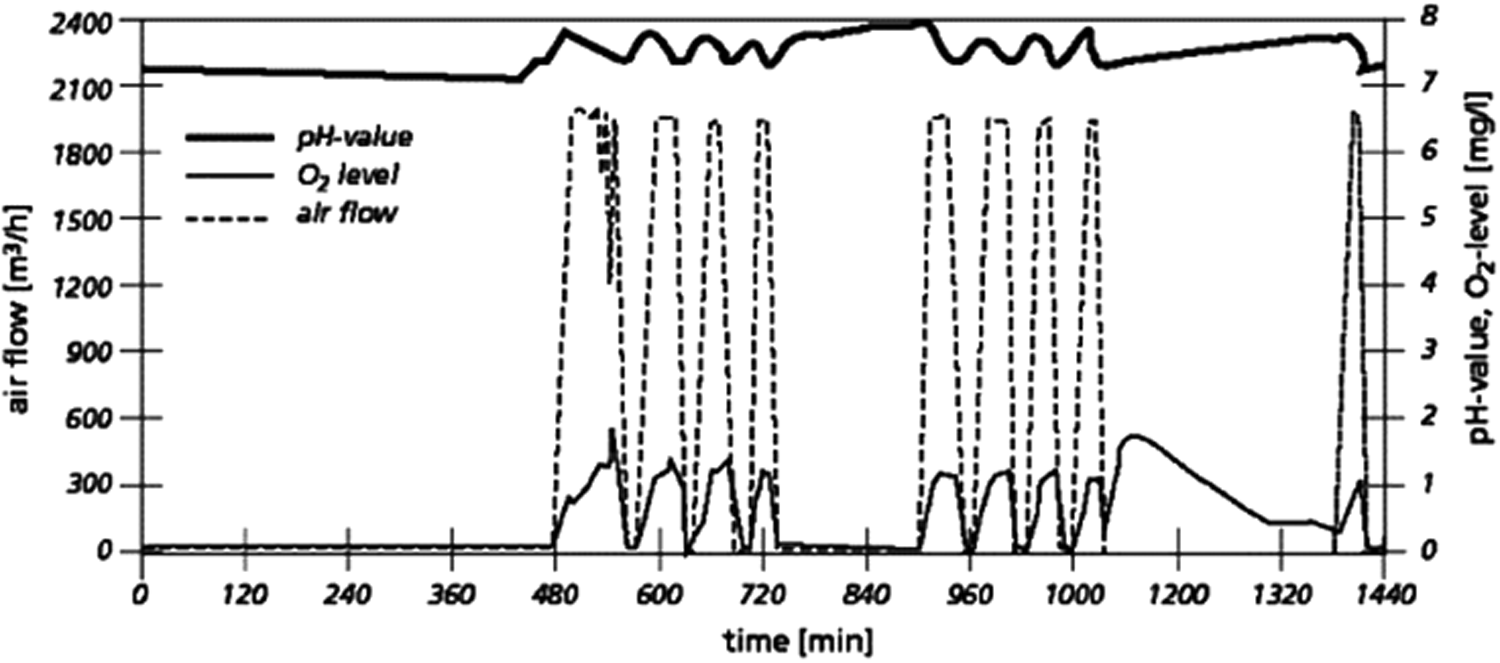
pH, DO concentration, and airflow in a sidestream shortcut nitrogen sequencing batch reactor (SBR). Republished with permission from Wett and Rauch (2003).
This study and Wett and Rauch (2003) are two examples of DO probe interference in biological nutrient removal processes but there could be other applications in which this interference is occurring such as low DO nitrite shunt processes. Since shortcut nitrogen processes are becoming more popular and DO probes are crucial to process control, it is critical that any inferences associated with NO2− accumulation are understood.
Conclusions
Based on previous studies, it was determined that NO2− accumulation was causing optical DO probes to measure unrealistically high values. This study proves that this interference exists with some optical DO probes but not all. It was also demonstrated that NO2− is not directly causing the interference but rather NO is responsible for causing the false DO measurements. The amount of NO produced by NO2− concentration of 25 mg/L was enough to cause some DO sensors to read as high as 1 mg/L, even though there was no oxygen present in the sample. This NO2− concentration could reasonably be produced in sidestream shortcut nitrogen processes, demonstrating that nitric oxide interference of DO sensor readings is a concern in full-scale processes as well as in bench scale denitrification tests. This phenomenon is not exclusive to the wastewater treatment field and would occur in any aqueous sample when NO is present. Future studies should include quantifying the relationship between NO concentration and DO interference, and determining the mechanism of the interference.
Footnotes
Author Disclosure Statement
No competing financial interests exist.