
Abstract
Abstract
This article presents the development of a composite adsorbent based on chitosan (Cs) and nano-activated carbon (NAC). Potential application of Cs-NAC beads for acetaminophen (ACT) elimination from aqueous solution was also studied. In the present study, NAC coalesced with Cs to form composite adsorbents, which were obtained by using the extrusion-dripping technique. Effects of adsorbent preparation conditions were investigated. Results revealed that the best preparation parameters were as follows: (1) a Cs concentration of 1.75% (w/v) employing 70% (w/w) of NAC in the form of beads; (2) a dripping flowrate of 2 mL/min; and (3) a dripping distance of greater than 9 cm, to achieve 81% of ACT removal. Field emission scanning electron microscope, X-ray diffraction, Fourier transform infrared spectrometer, zeta potential, and Raman spectroscopy were used to determine the morphology of the prepared beads. Results revealed that the prepared adsorbents were able to remove ACT effectively. Encapsulating NAC with Cs stabilizes the material and reduces the amount of NAC used without compromising its performance. Developing NAC and Cs biocomposites (Cs-NAC) in beads form could overcome the disadvantages of both the Cs and the NAC by enhancing their adsorption performance. Until now, there are no available reports on the preparation of Cs-NAC biocomposites for ACT removal, and the effects of the beading parameters on the preparation of this bio-nanocomposite.
Introduction
P
Among the analgesic drugs available, acetaminophen (ACT), also commonly known as paracetamol, is a widely consumed medicine for fever reduction and pain relief, with or without medical prescription (De Laurentiis et al., 2014). It is reported that 58–68% of ACT is excreted from the body after consumption. Therefore, its concentration in wastewater and water resources could also be higher. The presence of ACT at high concentrations can lead to gastrointestinal disease, liver failure, and hepatotoxicity (Mashayekh-Salehi and Moussavi, 2015).
Among all tertiary treatment methods for organic compounds, adsorption is one of the most effective methods due to its rapidity, low cost, simple design and operation, convenience, and ability to screen out toxic contaminants (Vakili et al., 2014a). Recently, more attention is paid to the development of low-cost materials as adsorbents for water purification.
Natural polymers and their derivatives have received considerable attention for removing pollutants from water (Alves and Mano, 2008). This is because natural polymers are abundant, cheap, nontoxic, and biodegradable. Chitosan (Cs), as a cationic and hydrophilic biopolymer, is the second most abundant naturally available polymer after cellulose. Cs and its derivatives have been reported as effective adsorbents for removing different pollutants from wastewater (Crini, 2008). However, Cs suffers from some drawbacks, such as insufficient mechanical properties, soluble in acid, low surface area, low porosity, and low thermal resistance, which limits the performance of this material in the adsorption process (Vakili et al., 2014b). Therefore, Cs must be combined with other materials to improve its performance and stability.
Activated carbon (AC) has been extensively reported to have excellent adsorption properties, and it has been widely used to adsorb different pollutants (Rafatullah et al., 2013). AC is also known as a potent adsorbent for pharmaceuticals because it contains tiny pores with a large internal surface (between 300 and 4,000 m2/g), which makes it ideal for adsorption (Mashayekh-Salehi and Moussavi, 2015; Sun et al., 2016). Increasing the surface area of AC by reducing its size to nano scale could lead to better performance by this adsorbent. However, there are several disadvantages in the direct use of nano-activated carbon (NAC) in water treatments. One of such disadvantages of using NAC is having fine particles that could easily disperse in water.
Using NAC by itself not only can cause additional water pollution but also could hinder the final separation of the adsorbent (Vakili et al., 2014a). Thus, encapsulating NAC with another green adsorbent could be an effective technique to stabilize the material, as well as to reduce the amount of NAC used without compromising its performance. Developing NAC and Cs biocomposites (Cs-NAC) in beads form could overcome the disadvantages of both the Cs and the NAC by enhancing their adsorption performance.
Extrusion dripping is one of the simplest and most common methods for preparing beads. This method provides favorable granular flow that creates consistent beads, in size and shape (Lee et al., 2013). In general, beading conditions can affect the adsorption properties of the beads. Several studies have focused on the effects of beading conditions, such as the size, shape, and hardness of the particles (Chan et al., 2011; Islam et al., 2013). Thus far, there are no available reports on the preparation of Cs-NAC biocomposites for pharmaceutical (specifically ACT) removal, and the effects of the beading parameters on the preparation of this bio-nanocomposite.
The present study was also focused on the performance of the Cs-NAC beads for ACT adsorption. In this study, the Cs-NAC beads were prepared through the extrusion-dripping method. The beads were prepared at different conditions by varying the concentrations of Cs and NAC, the extrusion-dripping flowrate, and the distance from the dipping tip to the solution surface. The Cs-NAC beads were characterized by using the Fourier transform infrared spectrometer (FTIR), the field emission scanning electron microscope (FESEM), zeta potential, X-ray diffraction (XRD), Raman spectroscopy, and adsorption studies.
Materials and Methods
Chemicals
ACT (analytical standard, MW: 151.169 g/mol), medium-molecular-weight Cs (75–85% deacetylation, MW: 190,000–310,000), and sodium hydroxide (NaOH) were purchased from Sigma Aldrich Ltd. NAC was obtained from US Research Nanomaterials, Inc. (NAC, particle size <100 nm with a bamboo source). Acetic acid (98%), acetonitrile (high-performance liquid chromatography [HPLC] grade), and formic acid (98%) were provided by Merck. All the materials used in the experiments were of analytical grade.
Preparation of Cs-NAC beads
Cs-NAC beads were prepared by using different amounts of Cs powder (0.75, 1.0, 1.5, 1.75, 2, 2.125, 2.25, 2.5, and 3 g), which were dissolved in 100 mL solution of 1% (v/v) acetic acid at room temperature (25°C ± 2°C). Afterward, different amounts of NAC (20–70% [w/w]) were added into the Cs solution, and they were stirred for 5 h to achieve a homogenous mixture. The solution was left overnight to release the bubbles. Then, the Cs-NAC solution was extruded vertically into a 500 mL solution of 2 M NaOH by using a syringe pump (New Era syringe pump, model NE-300), and a 10 mL syringe with a flat-end needle sized 23G.
The flowrate of the syringe pump was varied from 0.5 to 2.5 mL/min, and the distance of the needle from the surface of the solution was changed from 2.5 to 30 cm. The formed beads were washed several times with distilled water to remove NaOH until a constant pH was achieved (Auta and Hameed, 2012). Then, the Cs-NAC beads were oven-dried for 5 h at 70°C.
Adsorption study
One gram of the prepared beads was mixed with 100 mL of ACT solution, with an initial concentration of 200 ppm. This mixture was agitated on an orbital shaker at 150 rpm, and 0.5 mL of this mixture was taken at every 1 h interval, up to a maximum of 24 h (the sampling was stopped at earlier points when equilibrium was achieved). This was followed by filtering and analyzing by using HPLC (Agilent 1200 Infinity Series) for the accurate determination of ACT residue in each sample.
For the HPLC analysis, a C18 column (Eclipse XDB-C18, 5 μm, 4.6 × 150 mm) that was connected to the Chemstation software was employed. Two different sets of mobile phase solutions, A (0.1% [v/v] formic acid in deionized water) and B (0.1% [v/v] formic acid in acetonitrile), were used at a ratio setting of 25% mobile phase A, and 75% mobile phase B. Another solution was prepared by using 60% acetonitrile and 40% pure water for column washing. Samples were filtered by using membrane filters with 0.2–0.4 μm pore size before placing the vials to be injected by the auto sampler. To read the data accurately, a calibration curve was constructed by using standard samples with known concentrations.
Characterization of Cs-NAC beads
An FTIR (Thermo Scientific Nicolet iS10) was used to analyze the functional groups that were present on the surface of the adsorbents, and to determine the chemical interactions between the ACT and Cs-NAC beads. FESEM (Hitachi SU8010) was used to determine the surface morphology of the samples. The particle size and surface charge of the samples were determined by using the Malvern Zetasizer (model Zen3600). XRD patterns were collected by using a Bruker D8 Discover X-ray diffractometer. Raman spectroscopy was conducted by using the Horiba Jobin Yvon Raman spectrometer with visible argon ion, 514 nm wavelength, and 50 mW of power. Raman spectra assisted the detection and compared the changes in the chemical structures of the samples.
Results and Discussion
Effect of Cs concentration
Figure 1 shows the effect of Cs concentration (w/v) on the formation of Cs-NAC beads. It was observed that less than 1.0% (w/v) Cs could not form beads, whereby no solid form was obtained. By increasing Cs concentration up to 2.0% (w/v), the beads became firmer, and they became more spherical in shape. Nevertheless, a further increase in Cs concentration led to tear-shaped and tailed beads. The formation of the tail can be attributed to the higher viscosity, which caused the adhesive effect. By increasing the Cs concentration, intermolecular entanglement also increased (El-Hafian et al., 2010). Therefore, higher concentrations of Cs were found to be impractical for forming proper beads. The beads formed long, noodle-shaped strings, which could hardly be separated from the dripping point. Thus, the beads were not usable for further experiments.

Effect of Cs concentration (w/v) on bead formation. Cs, chitosan.
It was observed that at a Cs concentration of 2.0% (w/v), the most spherical beads were formed. Thus, the Cs concentrations in the resulting beads were kept within the range of 1–2.125% (w/v) for further experiments (Fig. 1). Based on the microscope measurements, the size of the dried beads varied from 0.8 to 1.8 mm.
To get more accurate and reliable measurements for each set of beads, 10 randomly selected beads were measured, and the average values were reported. The standard deviation for each set of beads was calculated, and the maximum deviation was found to be at 5% for beads with 1% (w/v) Cs. The smallest deviation of 0.5% was observed for beads with 1.75% (w/v) Cs. The high deviation from the standard, as observed when using the 1% Cs, can be attributed to the uneven structure of the beads due to low Cs concentration. In the 2.125% and 2.25% beads, the higher concentration of Cs has led to elongated beads, which caused more deviations in their length. Meanwhile, the deviation in the width of the beads was much smaller due to the size of the dripping needle.
Figure 2 shows the effect of Cs concentration on the ACT adsorption behaviors of the prepared adsorbents. NAC concentration, flowrate, and needle distance were kept constant at 50% (w/w), 1.5 mL/min, and 14 cm, respectively. These values were selected to be approximately in the center of the ranges studied to reduce the effect of parameter interactions at the extreme points. The Cs concentration was varied between 1.0% and 2.125% (w/v), and a control of pure Cs was also included. It was observed that the amount of ACT uptake by pure Cs was insignificant and negligible at all conditions. This highlights the importance of presenting NAC to this composite.
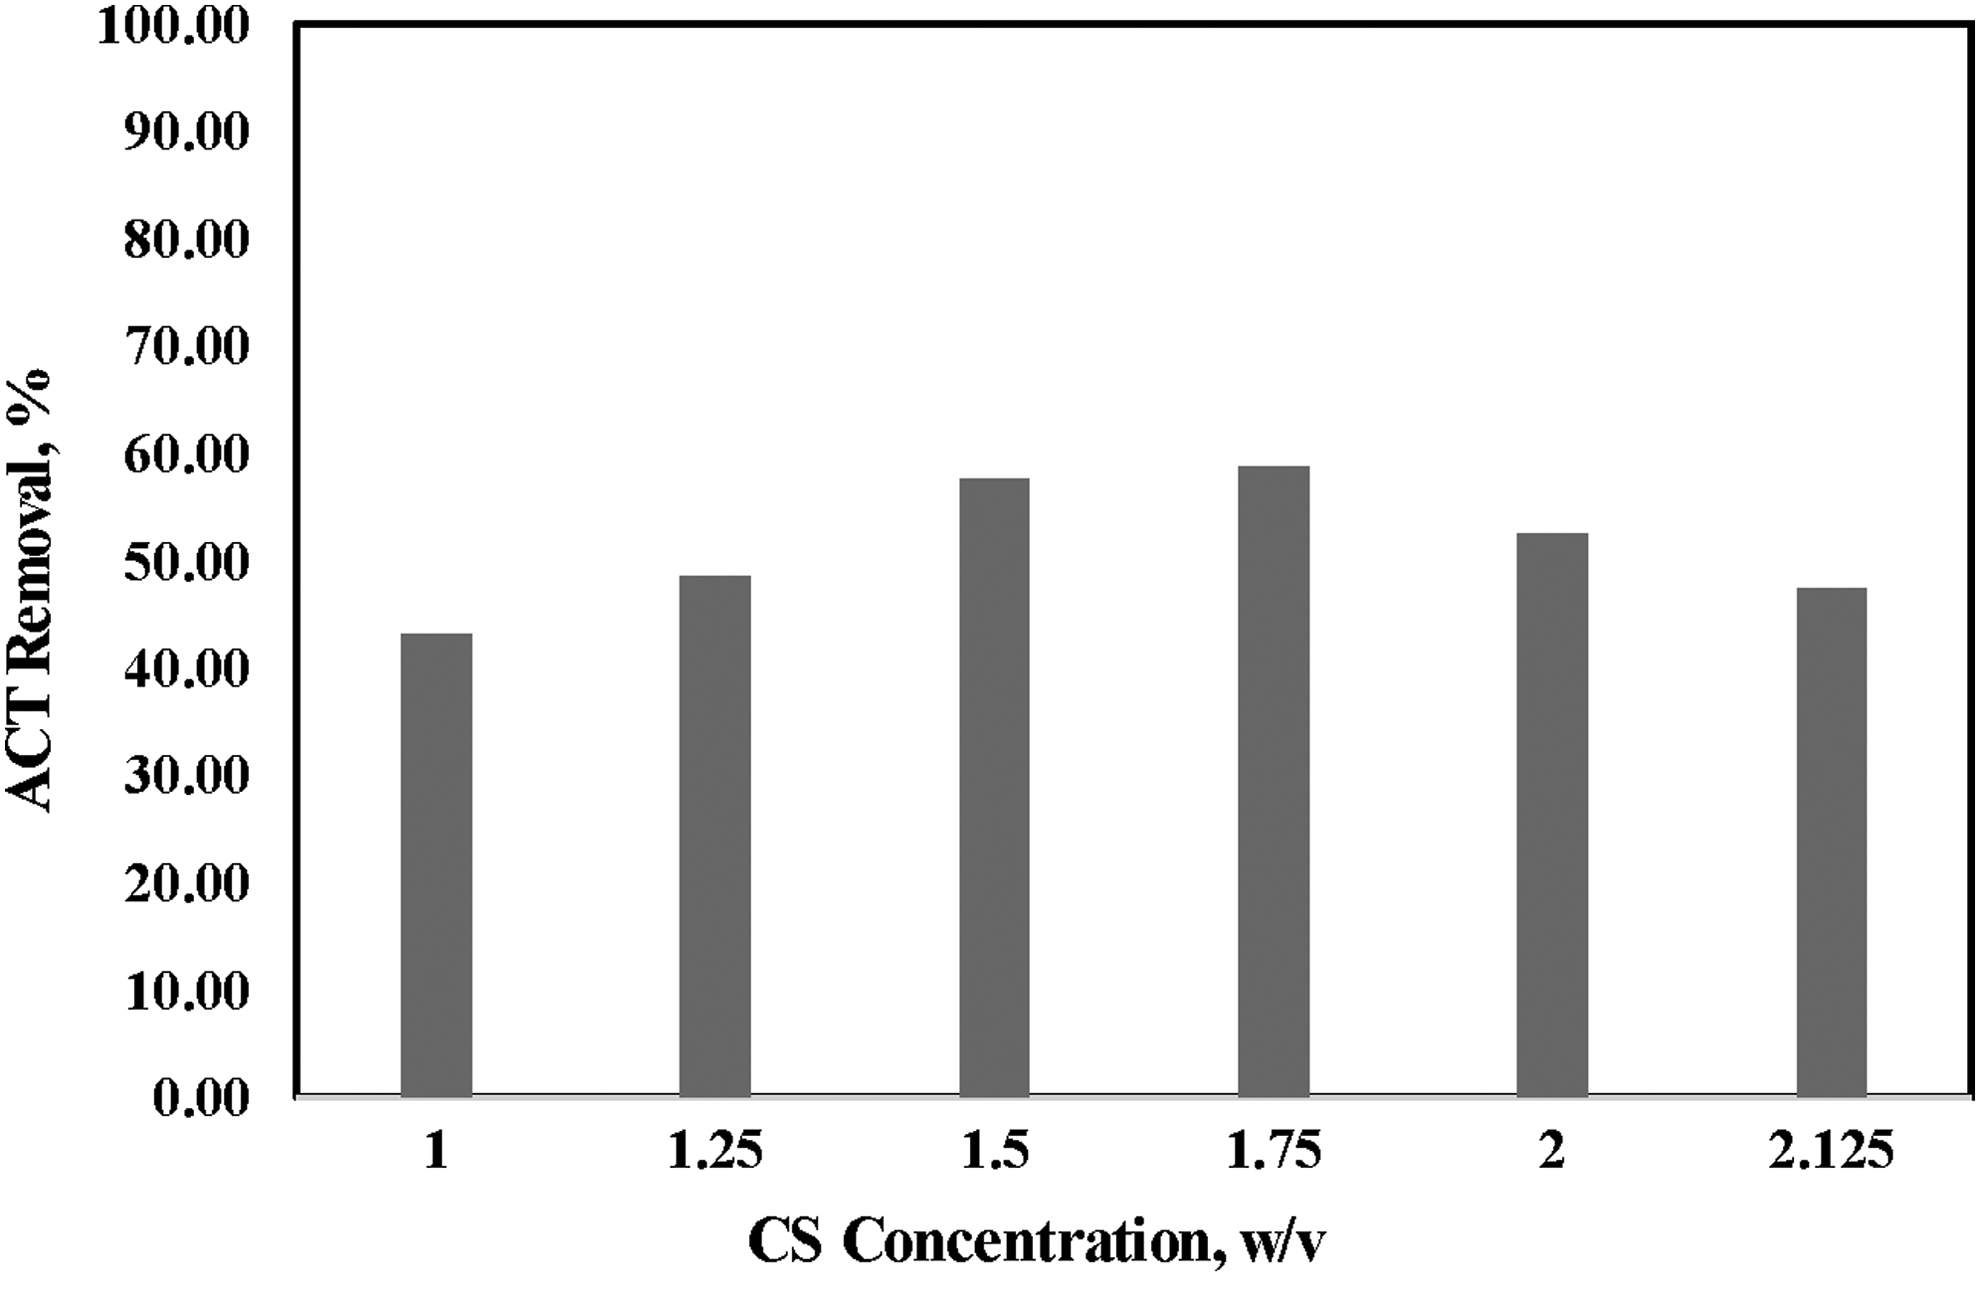
Effect of Cs concentration on acetaminophen removal (50% w/w NAC, 1.5 mL/min flowrate, and 14 cm needle distance). NAC, nano-activated carbon.
Initially, an increase in ACT uptake was observed when the Cs concentration was increased from 1.0% to 1.75% (w/v), showing an increased removal percentage from 43.13% to 58.73%. By further increasing the Cs concentration, the ACT uptake showed a decline. The lowest uptake was recorded at 1% (w/v) of Cs concentration. This could be attributed to the irregular shapes of the beads that failed to form a strong adherence to the NAC particles. By increasing the Cs concentration, the beads became more regular in shape, which was found to be more favorable for the adsorption process. This can be attributed to the fact that at low Cs concentrations, polymerization of the beads became ineffective, and a less viscose gel was formed, as shown in Fig. 1.
This gel could easily block the active sites available on the NAC, and it hindered the contact between ACT and the adsorbing sites. When Cs concentration and, consequently, its viscosity was increased in the solution, relatively strong walls of microparticles were formed on interaction with the nanocarbon (Ko et al., 2002). This observation showed that the Cs in the biocomposite played an important role in the adsorption process by providing better access to the NAC sites inside the beads. Therefore, thickness and porosity can be controlled by varying the polymer concentration (Ghaee et al., 2010).
Studies have shown that higher concentrations of Cs would result in smoother surfaces for the beads (Mahasawat et al., 2017). There would also be more adsorption sites for the molecules on a smooth spherical surface (Vo and Papavassiliou, 2016). Hence, the spherical 1.75% and the 2% beads were able to adsorb higher percentages of ACT. Furthermore, when the Cs concentration was increased, more intermolecular entanglement was observed among the compounds within the beads. Thus, the movement of the individual chains was constrained due to the amplified extent of entanglement, resulting in a significant change in the porous network (Hwang and Shin, 2000; El-Hafian et al., 2010). Consequently, the ACT molecules that penetrated into the pores of the Cs-NAC beads were adsorbed onto the functional groups on the external surface, thus leading to constriction or complete blockage of the pores. This limitation could be intensified by the increase in Cs concentration, which would eventually reduce the accessibility of ACT molecules to the available active sites (Guibal et al., 2005).
Increasing the concentration of Cs may have influenced the size (as seen in Fig. 1), and the porosity of the beads, and finally, reduced the adsorption capacity (Zhao et al., 2007). A higher Cs dosage in the mixture would lead to agglomeration in the NAC cavities, and it would make it less potent for ACT removal (Li et al., 2011). In addition, a higher Cs concentration in the beads would reduce their number, thus decrease the interaction between the beads and the ACT solution, and, eventually, decrease the removal percentage (Chattopadhyay and Inamdar, 2011). Studies have also confirmed that by increasing the Cs concentration, the viscosity of the Cs solution would also increase (El hafian et al., 2010).
Chattopadhyay and Inamdar (2011) reported that when Cs is added into a solvent, the solvent would gradually diffuse into the polymer aggregates, thus leading to the swelling of the polymer. As the swelling continues, segments of the polymer would loosen out. When the molecules in a solid polymer remain entangled, polymer molecules would diffuse during dissolution as bunches of entangled molecules. Even when all the chain segments of a polymer molecule in a solution are fully solvated, the molecules do not reposition themselves into straight chains, but rather in a coiled form. These coils or aggregates provide resistance for the flow of molecules and, therefore, impart viscosity.
Singh and Kumari (2012) stated that the viscosity would increase due to the entanglement of the long polymer chains. In this study, it was observed that the viscosity had increased linearly with the increasing concentration of Cs. This resulted in the reduction of the ACT uptake when the Cs concentration was increased to more than 1.75% (w/v).
Effect of NAC concentration
Figure 3 shows the effect of NAC concentration, which was varied between 0% (w/w) and 70% (w/w) of NAC, on ACT removal behavior. During the preparation of the beads, the Cs concentration was kept constant at 1.75% (w/v), with a flowrate of 2 mL/min, and 14 cm of needle distance. The use of 80% of NAC for preparing the beads was ineffective, and it led to a collapse in the structure of the beads. This was because when the NAC dosage was higher than 70%, the beads failed to maintain a solid configuration.
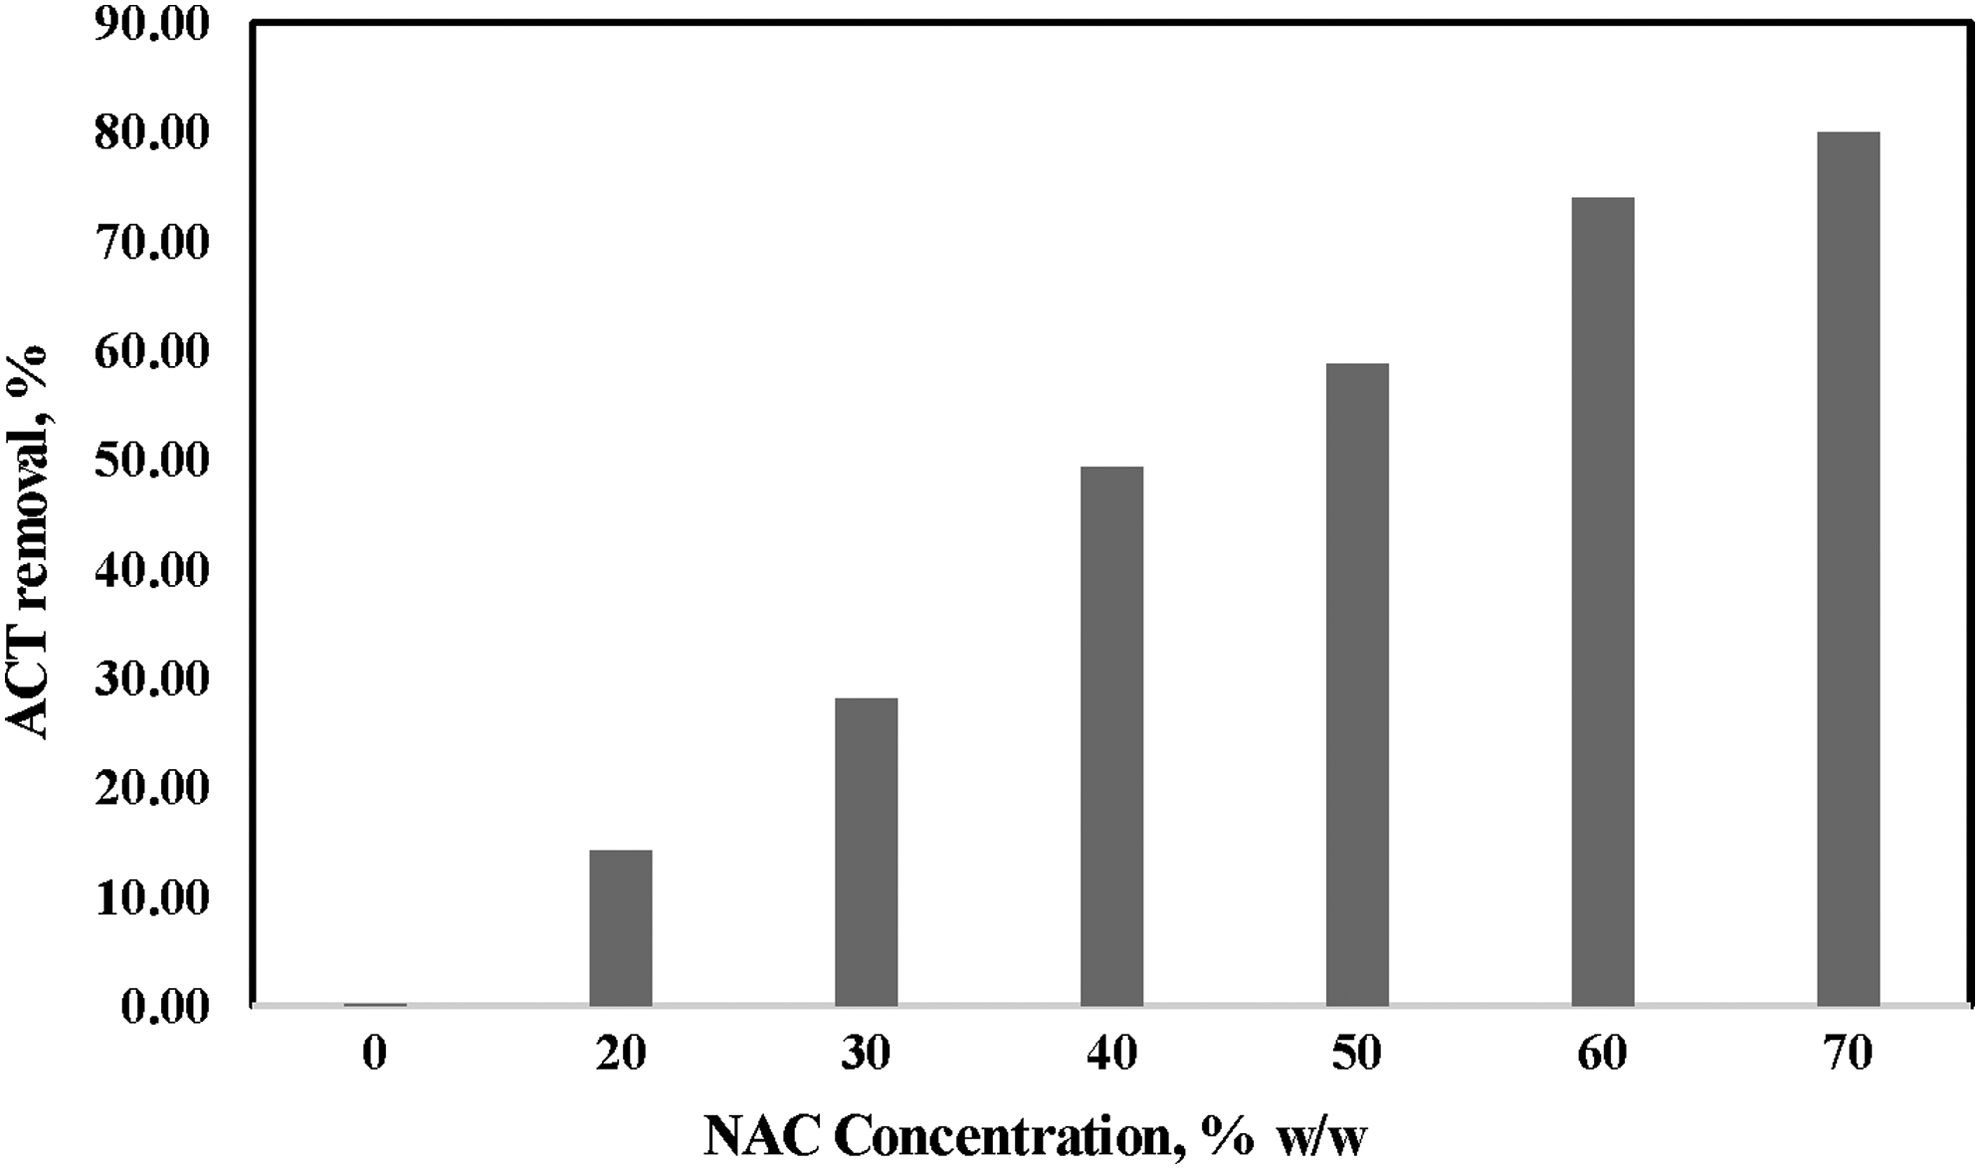
Effect of ratio of NAC on acetaminophen removal (1.75% Cs with 1.5 mL/min flow rate and 14 cm distance).
A lesser amount of Cs in the bead structure has also hindered the accessibility to the interfacial adsorption sites on the Cs polymer matrix, which created poor Cs-based adsorbents (Mahaninia and Wilson, 2017). The breaking-off from the beads can be attributed to the reduced contact between Cs molecules that had decreased the stability of the biocomposites. When these particles were added into the ACT solution, the result was the partial dispersion of the NAC, which formed a black solution. From these results, it was concluded that ACT removal is proportional to the amount of NAC available. This confirms the significant effectiveness of NAC in ACT removal.
The maximum removal of 79.8% was achieved with Cs-NAC beads containing 70% (w/w) NAC. This increase could be directly related to the presence of a higher NAC concentration in the Cs-NAC bead structure. The result was an improved porous network, a higher surface area, and better accessibility to the adsorption sites in the prepared beads. Wu et al. (2002) reported that encapsulating carbon in Cs could enhance the adsorption capacity of the Cs as long as the carbon content was moderate (>40% [w/w]). This finding was in agreement with the findings of this study. However, a higher weight percentage could be achieved with NAC compared with AC.
A series of analyses was conducted to determine whether any of the components had leached into the aqueous solution. Chemical oxygen demand (COD) analysis of the beads was prepared at different Cs concentrations (1–2.25% [w/v]), and NAC analyses (20–80%) were conducted to determine the leaching of components from Cs-NAC beads after 24 h of contact time. The COD value was found to be at 0 mg/L for all compositions of beads, except for beads with 80% of NAC, which was at 53 mg/L. Cs concentrations of less than 1.25% (w/v) and 70% of NAC loading had introduced a COD of 46 mg/L. This was mainly because the structure of the Cs was not strong enough to hold more than 70% of NAC within its polymeric matrix. Therefore, 70% was considered as the optimum dosage of NAC to be utilized with Cs at concentrations higher than 1.5% (w/v).
Effect of injecting flowrate
Figure 4 demonstrates the effect of flowrate of Cs-NAC mixture during the beading process on the removal percentage of ACT, and on the configuration of the beads. Cs concentration, NAC concentration, and needle distance were kept constant at 1.75% (w/v), 70% (w/w), and 14 cm, respectively. The flowrate was varied between 0.5 and 5 mL/min. A continuous flow would have hindered the formation of the beads. The results showed that the ACT uptake had initially increased when the flowrate was increased to 2.0 mL/min, reaching the highest ACT uptake of 80%. This was due to the moderate bead sizes at lower flowrates, which led to the effective penetration of the ACT into the beads. The smaller the flowrate, there was more time for the droplet to form, which led to larger, but more uniformed bead structures (Chang et al., 2009). Statistically, based on the replicates of the data, the standard deviation of the results was within the acceptance range of 5%.
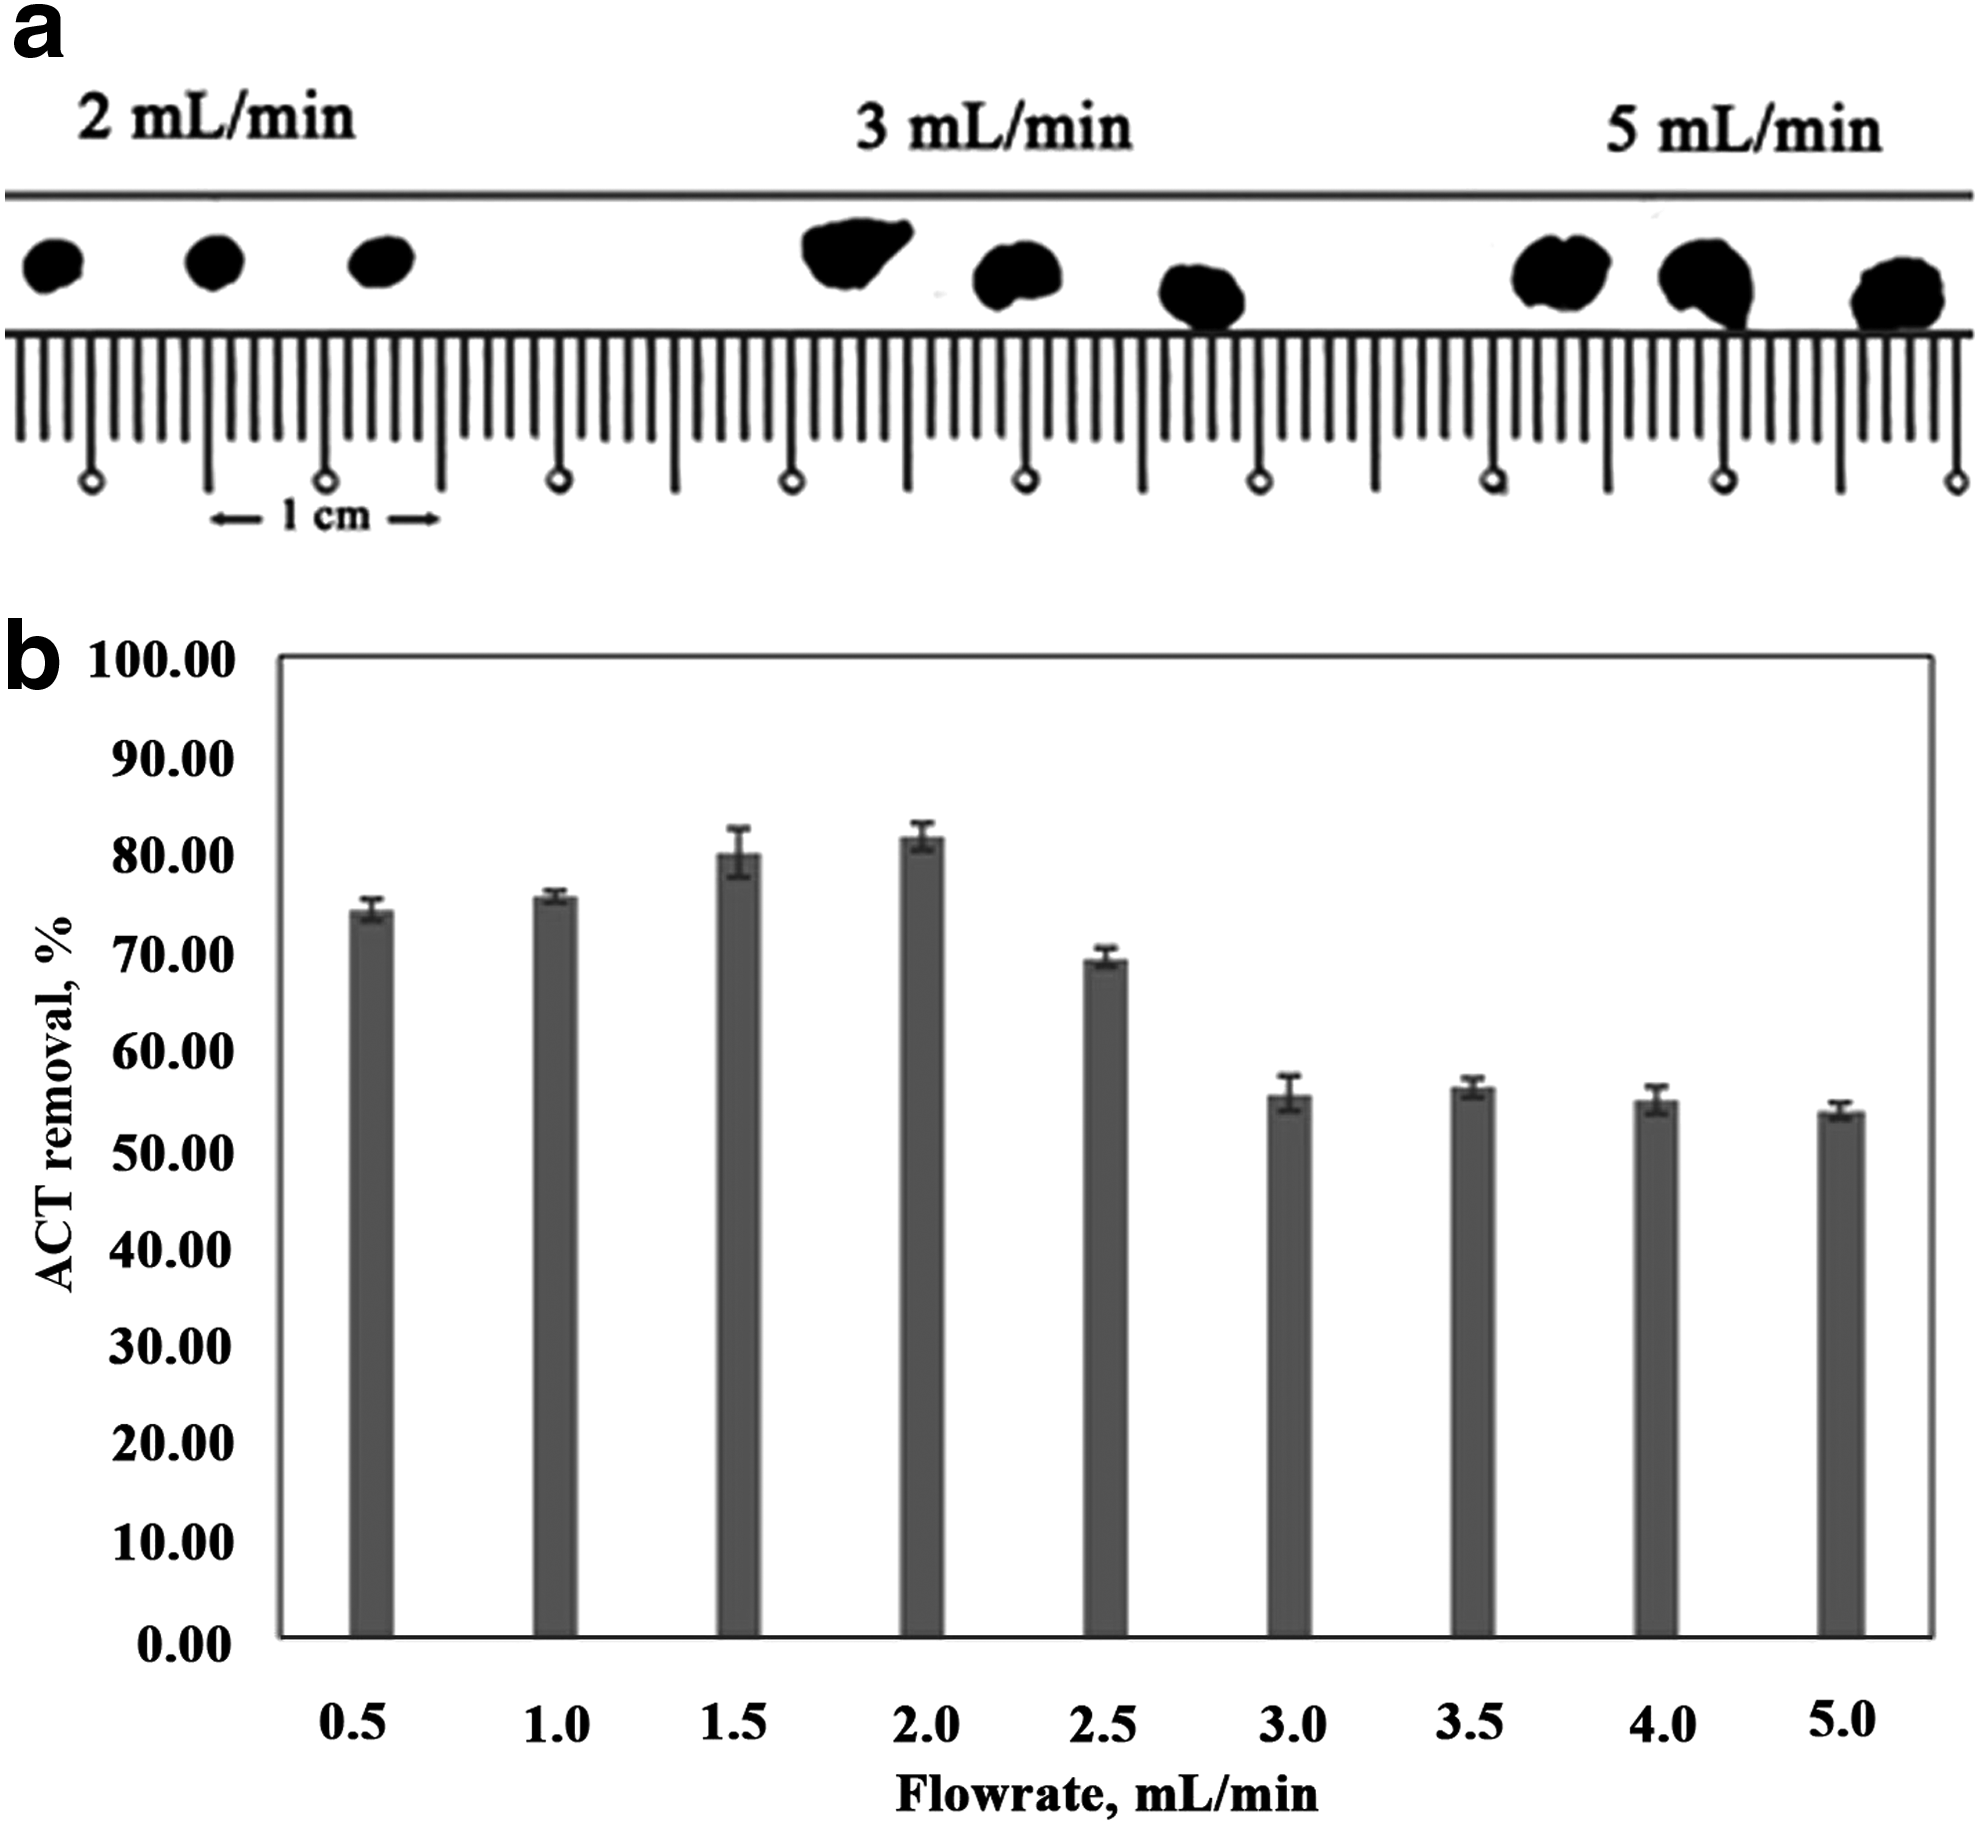
Effect of dripping flowrate on beads prepared by using 1.75% Cs for
Nonetheless, a further increase of the flowrate had caused a significant drop in the uptake of ACT, which was also attributed to the formation of bigger beads, but with irregular shapes. The drop in the percentage of ACT removal plateaued at approximately 55% with a flowrate that was higher than 3 mL/min. The plateau could be because the beads had formed a similar size and shape. As seen in Fig. 4a, when the flowrate was increased, the size of the droplets also increased. However, when the size of the beads was further increased, their number was reduced, and the interaction on their surfaces in the ACT solution was reduced as well. Based on the results of the experiments, when the flowrate was increased, lesser time was needed to produce the beads.
Previous studies reported that uniform droplets are generally produced at low flowrates of the dripping mode (Moon et al., 2014). In this study, the most evenly shaped beads and the size of beads exhibited flowrates that ranged between 1.5 and 2.0 mL/min. If the flowrate exceeded 3 mL/min, the beads would agglomerate, and become bigger in size, and unevenly shaped, which would then reduce the active surface area in the beads. Smaller beads have more active surface areas for adsorption, and when these uniform beads are packed in a column, they favor the hydraulic movement by making it easier and faster. Since the highest percentage of ACT removal was achieved with beads that were produced at a flowrate of 2.0 mL/min, this value was used in subsequent studies for bead preparation.
Effect of distance from dripping tip to the solution
Figure 5a and b presents the microscopic images of Cs-NAC beads formed by using the dripping distance of 3 cm, and farther than 9 cm, respectively. Although the beads have the same concentration of Cs and NAC, the shape and size of these beads do not. Based on the observed results, the dripping solution required ample distance to form proper spherical beads before reaching the alkaline solution underneath. When the dripping distance is short, the incoming beads would merge due to lack of time and space to form individual beads. As shown in Fig. 5a, a low dripping distance led to irregular and bigger size beads, which caused the decreased adsorption percentage shown in Fig. 5c. However, at a distance of more than 9 cm, as seen in Fig. 5b, uniform beads were formed.

Effect of dripping distance (cm) on
Figure 5c shows the effect of dripping distance during bead preparation on ACT removal percentage. The dripping distance was varied between 3 and 30 cm. The lowest ACT removal percentage of 47% was obtained when the dripping distance was at the minimum value (3 cm). By increasing the dripping distance to farther than 9 cm, the beads remained unchanged in shape and size. Moreover, the maximum ACT uptake of approximately 80% was achieved at a dripping distance of 15 cm. Based on the results in Fig. 5c, it can be concluded that after a certain level, the dripping distance did not affect the adsorption capacity of the beads.
On comparing the ACT removal percentages by using beads produced at 9–30 cm dripping distance, the results showed that distance has no apparent impact on the properties of the beads in this study. Similar observations were reported for other polysaccharides, such as pure sodium alginate. Nonetheless, a longer distance could cause flattened surfaces on the beads when they come into contact with the gelation bath (Smrdel et al., 2008). Furthermore, the presence of NAC in the beads would also enhance the mechanical strength of the beads, making them more stable when coming into contact with the surface of the NaOH bath. Previous studies reported that the addition of carbon fibers can reinforce the mechanical strength of the material by hindering the growth of microcracks (Han et al., 2016). The replication of data was statistically reproducible according to the acceptable range of standard deviation within the results.
Characterization of the beads
FESEM and zeta analysis
Figure 6a and b presents the FESEM micrographs of Cs beads. Figure 6b also offers a closer look into the Cs beads, whereby there was no clear porous structure in the pure Cs beads. This explains the ineffectiveness of pure Cs in ACT uptake, as confirmed by the previously discussed results. Figure 6c and d shows NAC powder at two different magnifications. As observed, the NAC structure was filled with pores and cavities in different layers and dimensions. As for the characterization of AC, Alabadi et al. (2015) and Liang et al. (2017) confirmed the presence of abundant pores within the AC morphology. In addition, the average size of 100–500 nm was in agreement with the obtained results from the zetasizer that showed a size distribution of 300 nm.

Field emission scanning electron microscope micrographs of
The multi-layered pores make NAC very penetrable, and nano-sized particles could be detected. The negatively charged NAC (−21 mV) was expected to have the tendency toward resisting ACT molecules with surface charges of approximately −18 mV, based on the zeta potential results. However, the positively charged Cs (+20 mV) overcame the negative charge of NAC in the Cs-NAC biocomposite, which resulted in the beads having a positive surface charge of +1.12 mV. Nevertheless, the larger particle distribution of the Cs-NAC (825 nm), as compared with pure NAC (300 nm), did not compromise the uptake of ACT with a size distribution of 330 nm. It should be noted that all zeta analyses were conducted at neutral pH. Zeta potential results for Cs (+20 mV) (Maciel et al., 2015; Meraz et al., 2016) and NAC (−21 mV) (Yao et al., 2015) were in agreement with findings from other studies as well.
Figure 6e shows the image of Cs-NAC beads before the adsorption, whereas Fig. 6f shows the same beads after ACT adsorption. In Fig. 6e, irregular pores could be observed, with numerous miniature voids in the morphology. The surface of the beads before adsorption was rough with many folds, which could have increased the contact surface area between ACT and the Cs-NAC beads (Li et al., 2016). The surface morphology in both Fig. 6e and f demonstrates a typical, wrinkled polymeric network. Figure 6f also shows that the Cs-NAC beads have a more flat surface with less visible pores after the ACT adsorption. In another adsorption study using Cs beads, Nguyen et al. (2016) reported that the surface structure of the beads would change, where the wrinkles and the rough surface would be replaced by a smoother and an even more structured layer of the adsorbed material.
This finding suggests that a thin layer of the ACT solution has covered the external surface of the beads. A comparison among the FESEM images for the Cs beads, the NAC, and the Cs-NAC beads (in Fig. 6a, c and e, respectively) shows that the particles were uniformly distributed in the porous NAC. In general, the average particle sizes for ACT, Cs, NAC, and Cs-NAC were in agreement with the FESEM images. In addition, the particle size of NAC measured with the zetasizer was slightly higher compared with the FESEM images due to the agglomeration of the nano particles.
X-ray diffraction
Figure 7 shows the XRD image for five different samples, namely: (a) Cs powder, (b) NAC, (c) Cs-NAC beads, (d) ACT, and (e) Cs-NAC beads after the removal of ACT. In Fig. 7, (a) represents Cs powder, which shows a major stretch peak in the XRD pattern, as observed at the 20° angle. It was reported that the degree of crystallinity would often decrease in Cs beads compared with in Cs flakes (Wanjari et al., 2011). According to these results, the crystallinity of Cs powder (a) was 41.2%, whereas the crystallinity of the Cs-NAC beads (c) was 38.1%.

X-ray diffraction pattern for
The pattern in (b) represents NAC, which indicates the amorphous nature of the AC, where no obvious peaks or significant stretches were observed. By turning Cs into beads, its crystallinity was expected to reduce, especially when combined with an amorphous adsorbent, such as NAC (Vakili et al., 2014b). It was also observed that after the adsorption, the Cs-NAC beads became more amorphous compared with pure Cs powder and Cs-NAC beads before adsorption [Fig. 7 at (a) and (c)]. In addition, the crystallinity percentage for the Cs-NAC beads, after the adsorption of ACT, had reached 31.8%.
In Fig. 7, (d) and (e) represent the diffraction patterns for ACT and Cs-NAC beads after the adsorption. Even though ACT has been adsorbed onto the Cs-NAC beads, the crystalline structure of ACT was not observed in (e). This could be due to the low amount of ACT on the surface of the beads, in comparison with the amorphous structure of the beads. The pattern in (e) is more similar to that of the pure Cs powder, as seen in (a). The existence of the crystalline structure in the beads, after the adsorption, can be related to the possibility of a complex formation between the beads' functional groups and the ACT compounds, and it could also be partially attributed to hydration (Zha et al., 2008). Since the main adsorbing agent in the beads was the NAC, it was suggested that the formation of the complex was between ACT and NAC. Therefore, the pattern was more similar to the pattern for Cs powder, rather than to the Cs-NAC beads before the adsorption process, as presented in (c).
Fourier transform infrared spectrometer
Figure 8 presents the FTIR spectrums of: (a) Cs, (b) NAC, (c) Cs-NAC beads, (d) ACT, and (e) Cs-NAC beads after the adsorption of ACT. As seen in this figure, the Cs spectrum [labeled as (a)] has a broad band that ranged between 3,500 and 2,900 cm−1, as a result of the stretching vibration of the primary amine and the OH groups (Vakili et al., 2015). The C-H stretching appeared in the bands between 2,800 and 2,930 cm−1 as part of the structure.

Fourier transform infrared spectrometer graphs for
The peaks at 1,645 cm−1, 1,574 cm−1, and 1,418 cm−1 can be assigned to amide I, NH2 bending vibration, and aliphatic C-H bending vibration, respectively (Vakili et al., 2016). Asymmetric stretching of C-H in CH2 appeared in the band at 1,408 cm−1 and formed two bands of C=O at 1,150 cm−1 and 1,075 cm−1, as seen in the Cs spectrum (Du et al., 2014). The spectrums labeled (b) for NAC, and (c) for Cs-NAC beads did not show any major peaks. The spectrum at (c) shows that since the concentration of NAC was higher than Cs, it resembled that of the NAC spectrum (Rambabu et al., 2015).
The spectrum labeled (d) shows ACT at 98–100% purity; the major bands identified in the spectra are OH and NH groups, with valence vibrations at 3,700–3,000 cm−1. A CH3 asymmetric valence vibration was observed at 2,920 cm−1, followed by carbonyl vibrations at 1,650 cm−1 and 1,610 cm−1, C–NH vibration at 1,559 cm−1, and the aromatic ring vibration at 1,502 cm−1. The other bands on this spectrum can be attributed to NH bending (1,438 cm−1), H3C–C=O stretching (1,368 cm−1), CH3 symmetric (1,326 cm−1), and COH valence (1,225 cm−1) vibrations (Terzyk, 2001).
The visible peak band at 3,300 cm−1, which was due to O–H stretching, was also observed in (e) at 3,244 cm−1. This peak showed a broader band in the beads after the adsorption of ACT. This can be attributed to hydrogen bonding between the hydroxyl groups of ACT inside the beads. The next peak, which was the CH2 surface group, can be seen as more prominent compared with the spectrum for pre-adsorption (c). This may be because CH2 was available both in the ACT and in the beads (Rambabu et al., 2015).
There were no sharp peaks after the 1,400 cm−1 wavelength in the (c) spectrum. However, the functional groups for ACT could be detected in the same wavelength in (e). For instance, the C=C in aromatic ring, and C=O were present between the 1,500 and 1,650 cm−1 wavelengths in the ACT structure (d). The same wavelength in the (e) spectrum was sharper and more significant. Moreover, other bands on the (e) spectrum can be attributed to NH bending (1,440 cm−1), H3C=O stretching (1,374 cm−1), and CH3 (1,325 cm−1), which can be seen in the ACT (d) spectrum as well. The appearance of ACT functional groups in the (e) spectrum, but with less intensity, confirmed the presence of ACT in the beads, which showed the successful adsorption.
Raman spectroscopy
Raman spectroscopy was used for material verification purposes in the Cs-NAC beads both before and after the adsorption of ACT. It was also applied to identify whether ACT has been adsorbed onto the beads after the removal process. Figure 9a shows the spectrum for the Cs-NAC beads before the adsorption, whereas Fig. 9b and c represents the spectrums for ACT and for Cs-NAC beads after ACT removal, respectively. In Fig. 9a, the spectrum represents the peaks in NAC and Cs, which are the building blocks of the beads. The 1,350 and 1,600 cm−1 peaks belong to NAC, and these results are in accordance with the results from previous studies (Sadezky et al., 2005; Byamba-Ochir et al., 2016).
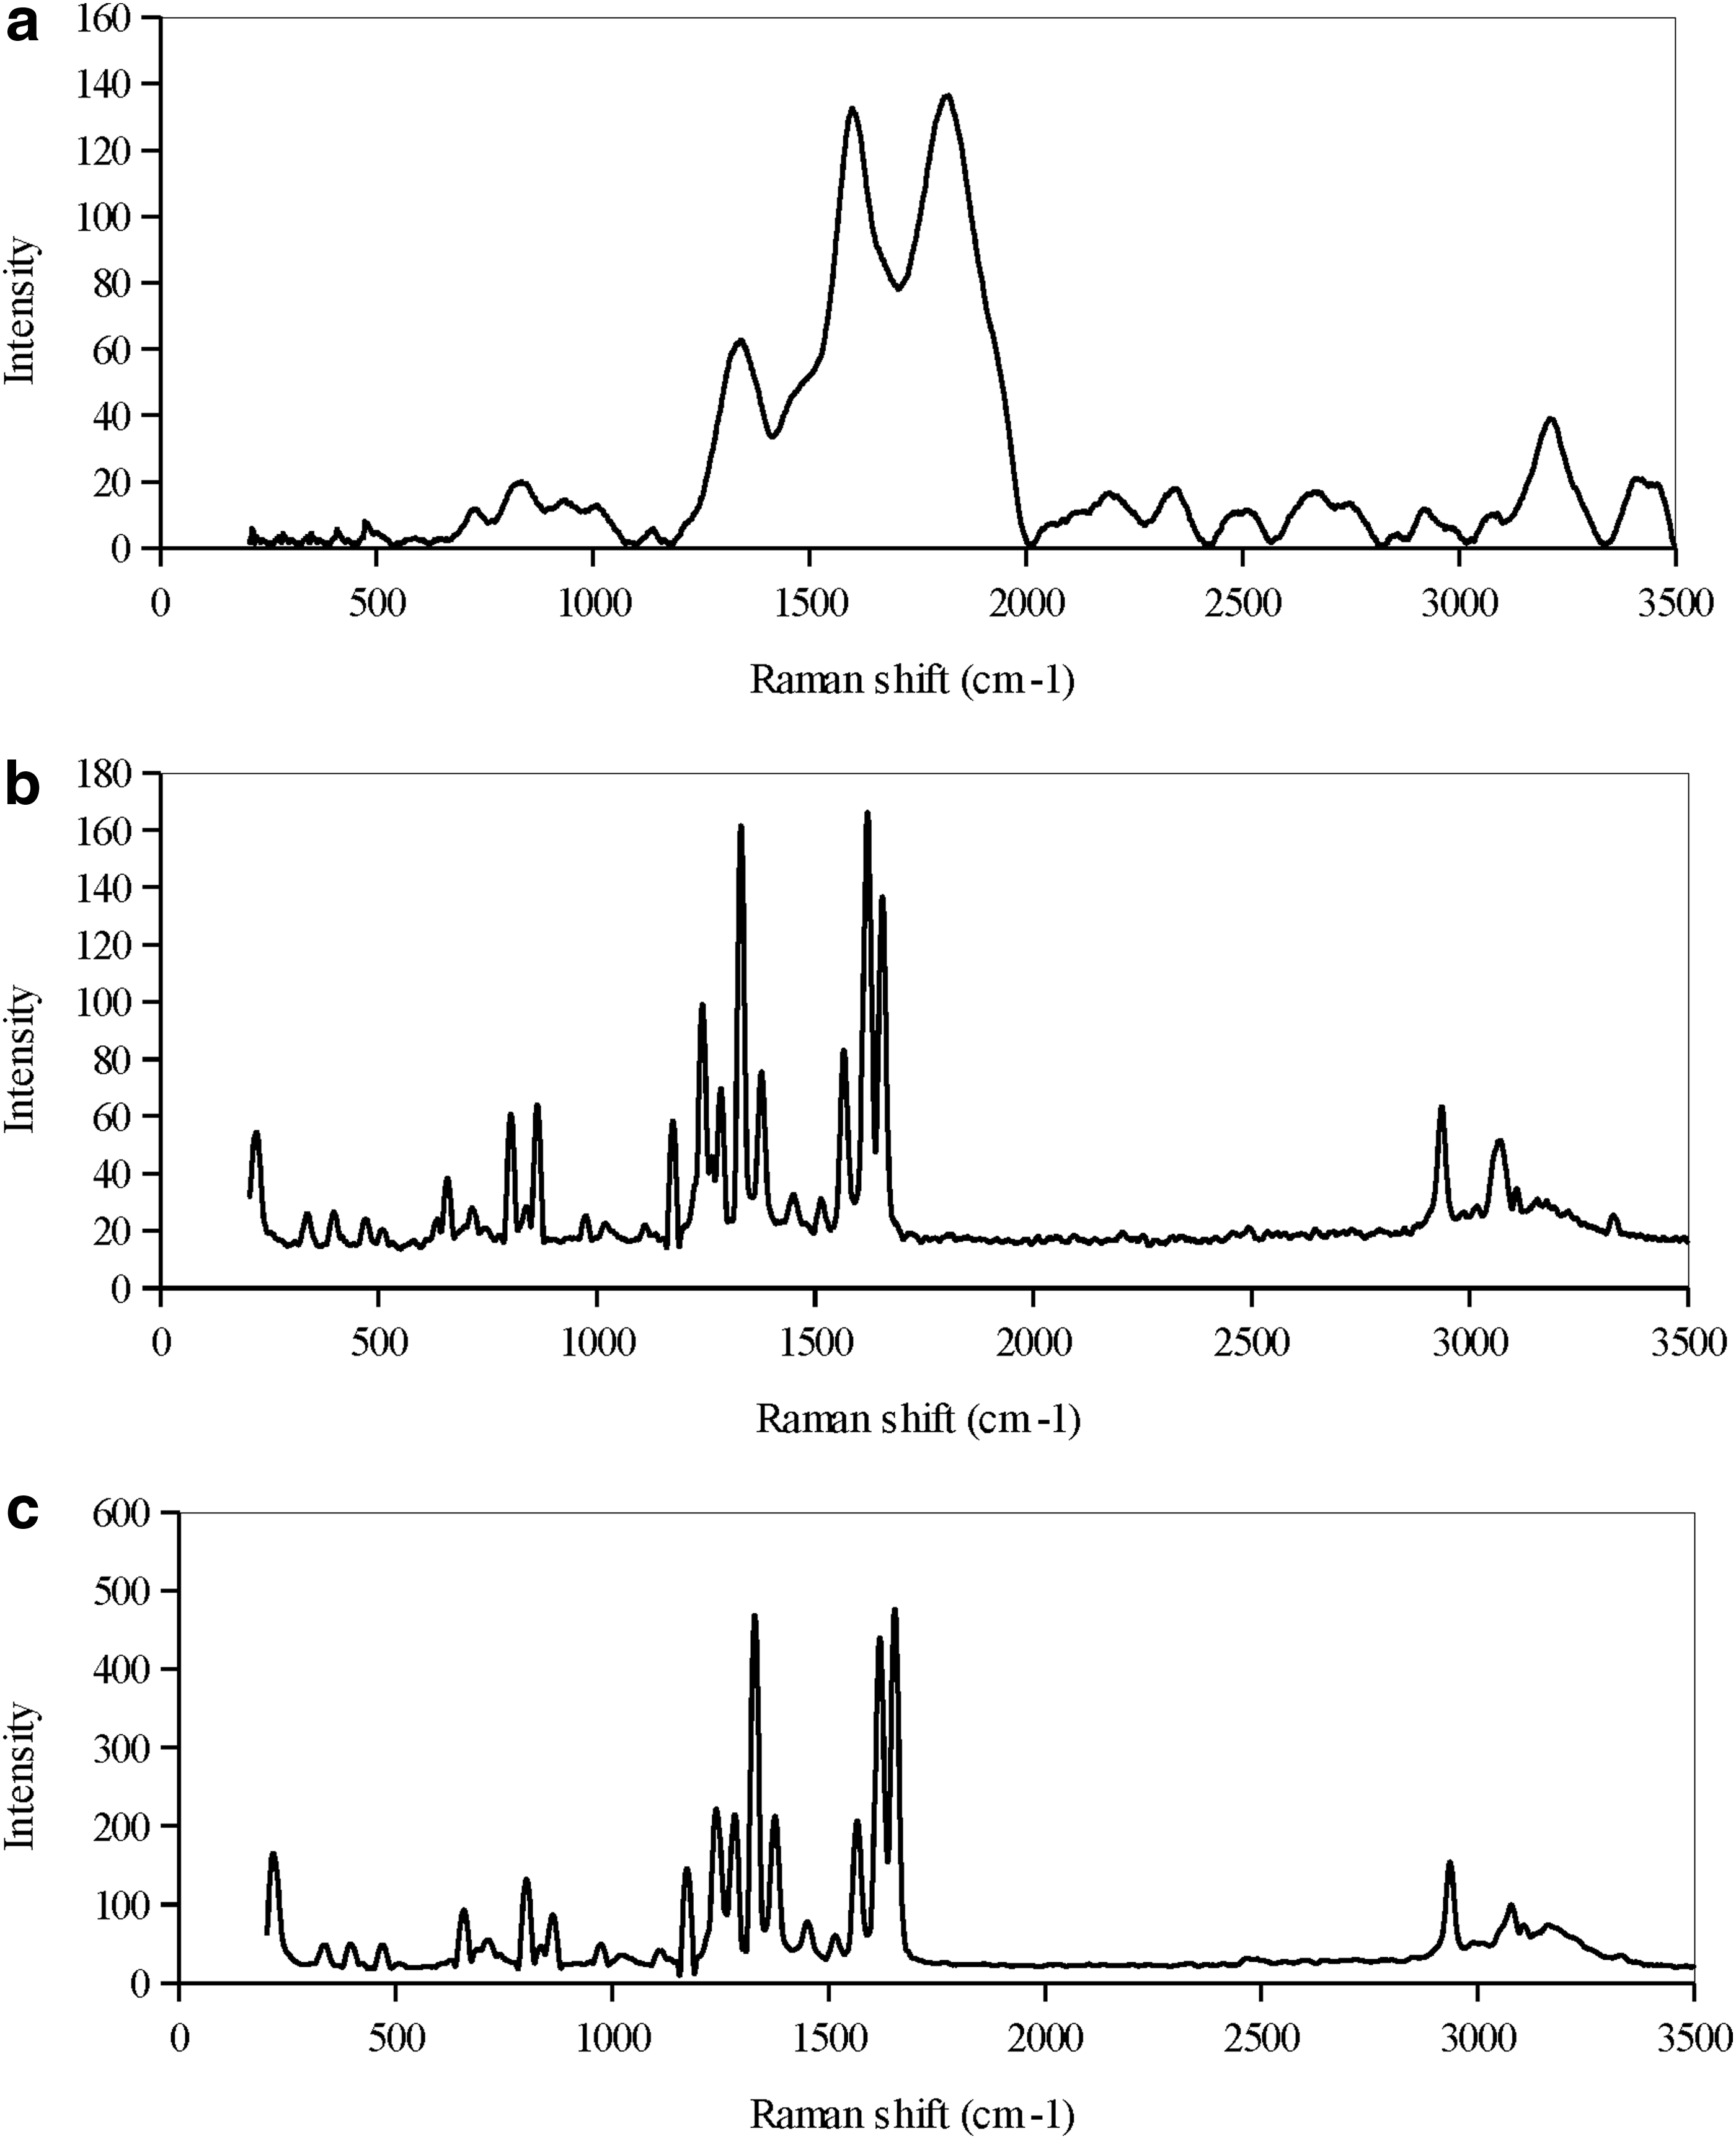
Raman spectroscopy for
Figure 9a shows a spectrum with smaller peaks around 1,000 and 3,150 cm−1, which were related to Cs (Zając et al., 2015). Figure 9b shows the spectrum for ACT, with a few sharp peaks and some weak ones. The spectrum for ACT exhibited characteristic peaks at 850–900, 1,350, and 1,500 cm−1. Strong peaks at 1,350 and at 1,500–1,700 cm−1 fit their relative positions in published spectra for ACT (Kauffman et al., 2008).
Last but not the least, the third spectrum for the Cs-NAC beads after the adsorption can be seen in Fig. 9c. It can be observed that most of the identification peaks for ACT were also visible in this spectrum, by the narrow and intense peaks at 850–100, 1,350, and 1,700 cm−1. The intensity of this spectrum for the Cs-NAC beads after the adsorption has increased compared with in the ACT spectrum, but the Raman shifts were similar for both spectra. A comparison of the spectra for the beads after adsorption with the ACT spectrum confirmed that these peaks almost overlapped, which indicated the presence of ACT in the structure of the Cs-NAC beads after the adsorption.
Conclusion
In this study, a composite adsorbent based on Cs and NAC was developed by using the extrusion-dripping method, and it was applied for ACT removal from water. The effects of Cs concentration, NAC ratio, extrusion-dripping flowrate, and the dripping distance were investigated in this study. The obtained results showed that these parameters have a collective effect on the percentage of ACT removal, but since the increase in NAC ratio can affect the adsorption drastically, it could be assumed that the more effective parameter was the NAC ratio. The optimum conditions for the preparation of Cs-NAC beads were found to be at an initial Cs concentration of 1.75% (w/v), and 70% (w/w) of NAC, whereas the flowrate and needle distance during the dripping process were at 2 mL/min, and 15 cm, respectively, to achieve the maximum ACT removal of 80%.
Based on the FESEM images, Cs particles were uniformly distributed in the porous NAC in the beads. FTIR analysis confirmed the existence of ACT in the structure of the Cs-NAC beads after the adsorption. The XRD patterns show crystalline structures in the beads after the adsorption, which could be attributed to the existence of ACT in the beads, and Raman spectra had also verified the presence of ACT in the beads after the adsorption. This study has confirmed the potential of applying Cs-NAC beads to treat water contaminated with pharmaceuticals of complex structures, ACT in particular. The presence of Cs in the structure of the beads had stabilized the NAC and prevented carbon leaching. It can also affect the formation of the porous network in the bead structure, which proved to be effective for the penetration of ACT molecules into the beads.
Footnotes
Acknowledgments
The authors would like to acknowledge Monash University Malaysia for the support for this project. The authors would also like to acknowledge the Ministry of Education Malaysia (MOE) for providing research funding under the FRGS scheme (Grant No. FRGS/2/2013 TK05/MUSM/03/1).
Author Disclosure Statement
No competing financial interests exist.