
Abstract
Abstract
The air pollution index (API) is commonly used for describing the air quality status. Values of API are evaluated by the maximum value of five pollutants: sulfur dioxide, nitrogen dioxide, carbon monoxide, ozone (O3), and suspended particulate matter (PM10) at a particular hour. Values that exceed the concentration of 100 are considered unhealthy. This study investigates the exceedance of API values and its dominants, using peaks-over-threshold method based on the generalized Pareto distribution (GPD), in three urban areas in Peninsular Malaysia for the period of January 2005 to December 2014. Dependency between unhealthy API and its main dominants has been evaluated by the Pickands dependence function. The GPD has been fit to all variables. The GPD fits well with all variables except O3 in Klang and Malacca. Results obtained showed that PM10 and O3 are the underlying pollutants of unhealthy API values in three highly polluted areas of Peninsular Malaysia. Results of study will help detect sources of air pollution and facilitate development of plans for reducing unhealthy levels of air pollutants.
Introduction
M
Five pollutants contribute in determining the values of API, which are carbon monoxide, sulfur dioxide (SO2), nitrogen dioxide (NO2), ozone (O3), and particulate matter (PM10) (Department of Environment Malaysia, 2013). The air pollutant with the highest concentration will determine the API values shown in Fig. 1 (Department of Environment Malaysia, 2009). Likewise, maximum unhealthy values of the various air pollutants will determine the unhealthy API. This study, therefore, investigates the pollutants that critically impact the unhealthy level of API and then analyzes them using the generalized Pareto distribution (GPD).

Method of evaluation of API in Malaysia (2009). API, air pollution index.
Many studies have referred to the GPD as a useful tool in analyzing the exceedance of air quality data (Mijić et al., 2009). Zhou et al. (2012) utilized the GPD to fit the extreme pollution concentrations of three critical pollutants (PM10, NO2, and SO2) and estimate the return period using the fitted distributions (Zhou et al., 2012). Lu and Fang (2003) used the GPD type I to model the high PM10 concentration and found that the GPD fitted the exceedance of PM10 data (Lu and Fang, 2003). Horowitz and Barakat (1979) revealed that a GPD type I could well fit the O3 extreme data (Horowitz and Barakat, 1979). Masseran et al. (2016) have fitted the GPD distribution with a fixed threshold of 100 to the unhealthy API values in eight urban areas in Peninsular Malaysia and the GPD was found to be well fitted to three cities with a high level of pollution. Thus, this study focuses on those three highly polluted cities in Peninsular Malaysia to investigate the pollutants that have a significant contribution on the values of unhealthy API and then model them using GPD.
A good comprehension of the critical pollutants of unhealthy API will make it easier to detect the sources that badly impact the air quality. Air pollutants are classified into two categories: primary and secondary pollutants. Primary pollutants, such as PM10, are directly released into the atmosphere from sources. Secondary pollutants, such as O3, are shaped in the atmosphere by the interaction of primary pollutants (Daly, 2007). Thus, the sources of primary pollutants are more obvious and easier to be determined than the sources of secondary pollutants. Many sources of air pollution include motor vehicles, power plants, industrial waste incinerators, and the emission of dust from urban construction works and quarries, along with open burning (Dominick et al., 2012). High level of emissions from both anthropogenic and natural sources over long periods increases the concentration of API, just as chemical and physical properties of these pollutants do. Each source contributes in increasing at least one pollutant and hence in enhancing API. For example, the burning of fossil fuels in vehicles, power plants, and several industrial processes produces significant level of particulates (Omidvarborna et al., 2015), with the result being an increased level of API as well. Besides the sources of air pollutants, haze plays a detrimental role in increasing the unhealthy level of API. Many studies referred to PM10 as the primary pollutant compared with other indexes for the air pollution in China (Liu et al., 2015). In Malaysia, the majority of API values are mostly determined by PM10 and hence PM10 is the main dominant of API (Department of Environment Malaysia, 2009; Hayati et al., 2014; Rahman et al., 2015). However, PM10 could not be the critical pollutant of unhealthy level of API. Therefore, this study investigates the pollutants that significantly contribute in determining the value of unhealthy API and later to model the unhealthy API and its critical dominants, using peaks over a threshold (POT) method that has been utilized by Masseran et al. (2016), in the highest polluted cities in peninsular Malaysia.
Study Areas and Data
Kuala Lumpur, Malacca, and Klang are recorded as the highest air-polluted cities in Peninsular Malaysia and, relative to the Malaysian API, the air quality in urban regions of Peninsular Malaysia generally falls within healthy limits (Masseran et al., 2016).These three locations are therefore selected to investigate the critical pollutant influencing the exceedance of API. Figure 2 shows the locations of the three urban areas covered by this study. Among all the cities in Malaysia, Kuala Lumpur is the capital and most populous city in Malaysia. Kuala Lumpur has an area of 243 km2 that is connected with the biggest transport networks and railway lines, and is surrounded by the most industrialized and economically fastest growing city in Malaysia. Its climate is a tropical rainforest (Köppen climate classification Af), which is warm and sunny, besides abundant rainfall, particularly in the northeast monsoon season from October to March. A haze from forest fires of nearby Sumatra is a major source of unhealthy air pollution in the city along with emission from motor vehicles and construction work (MSNBC, 2005).
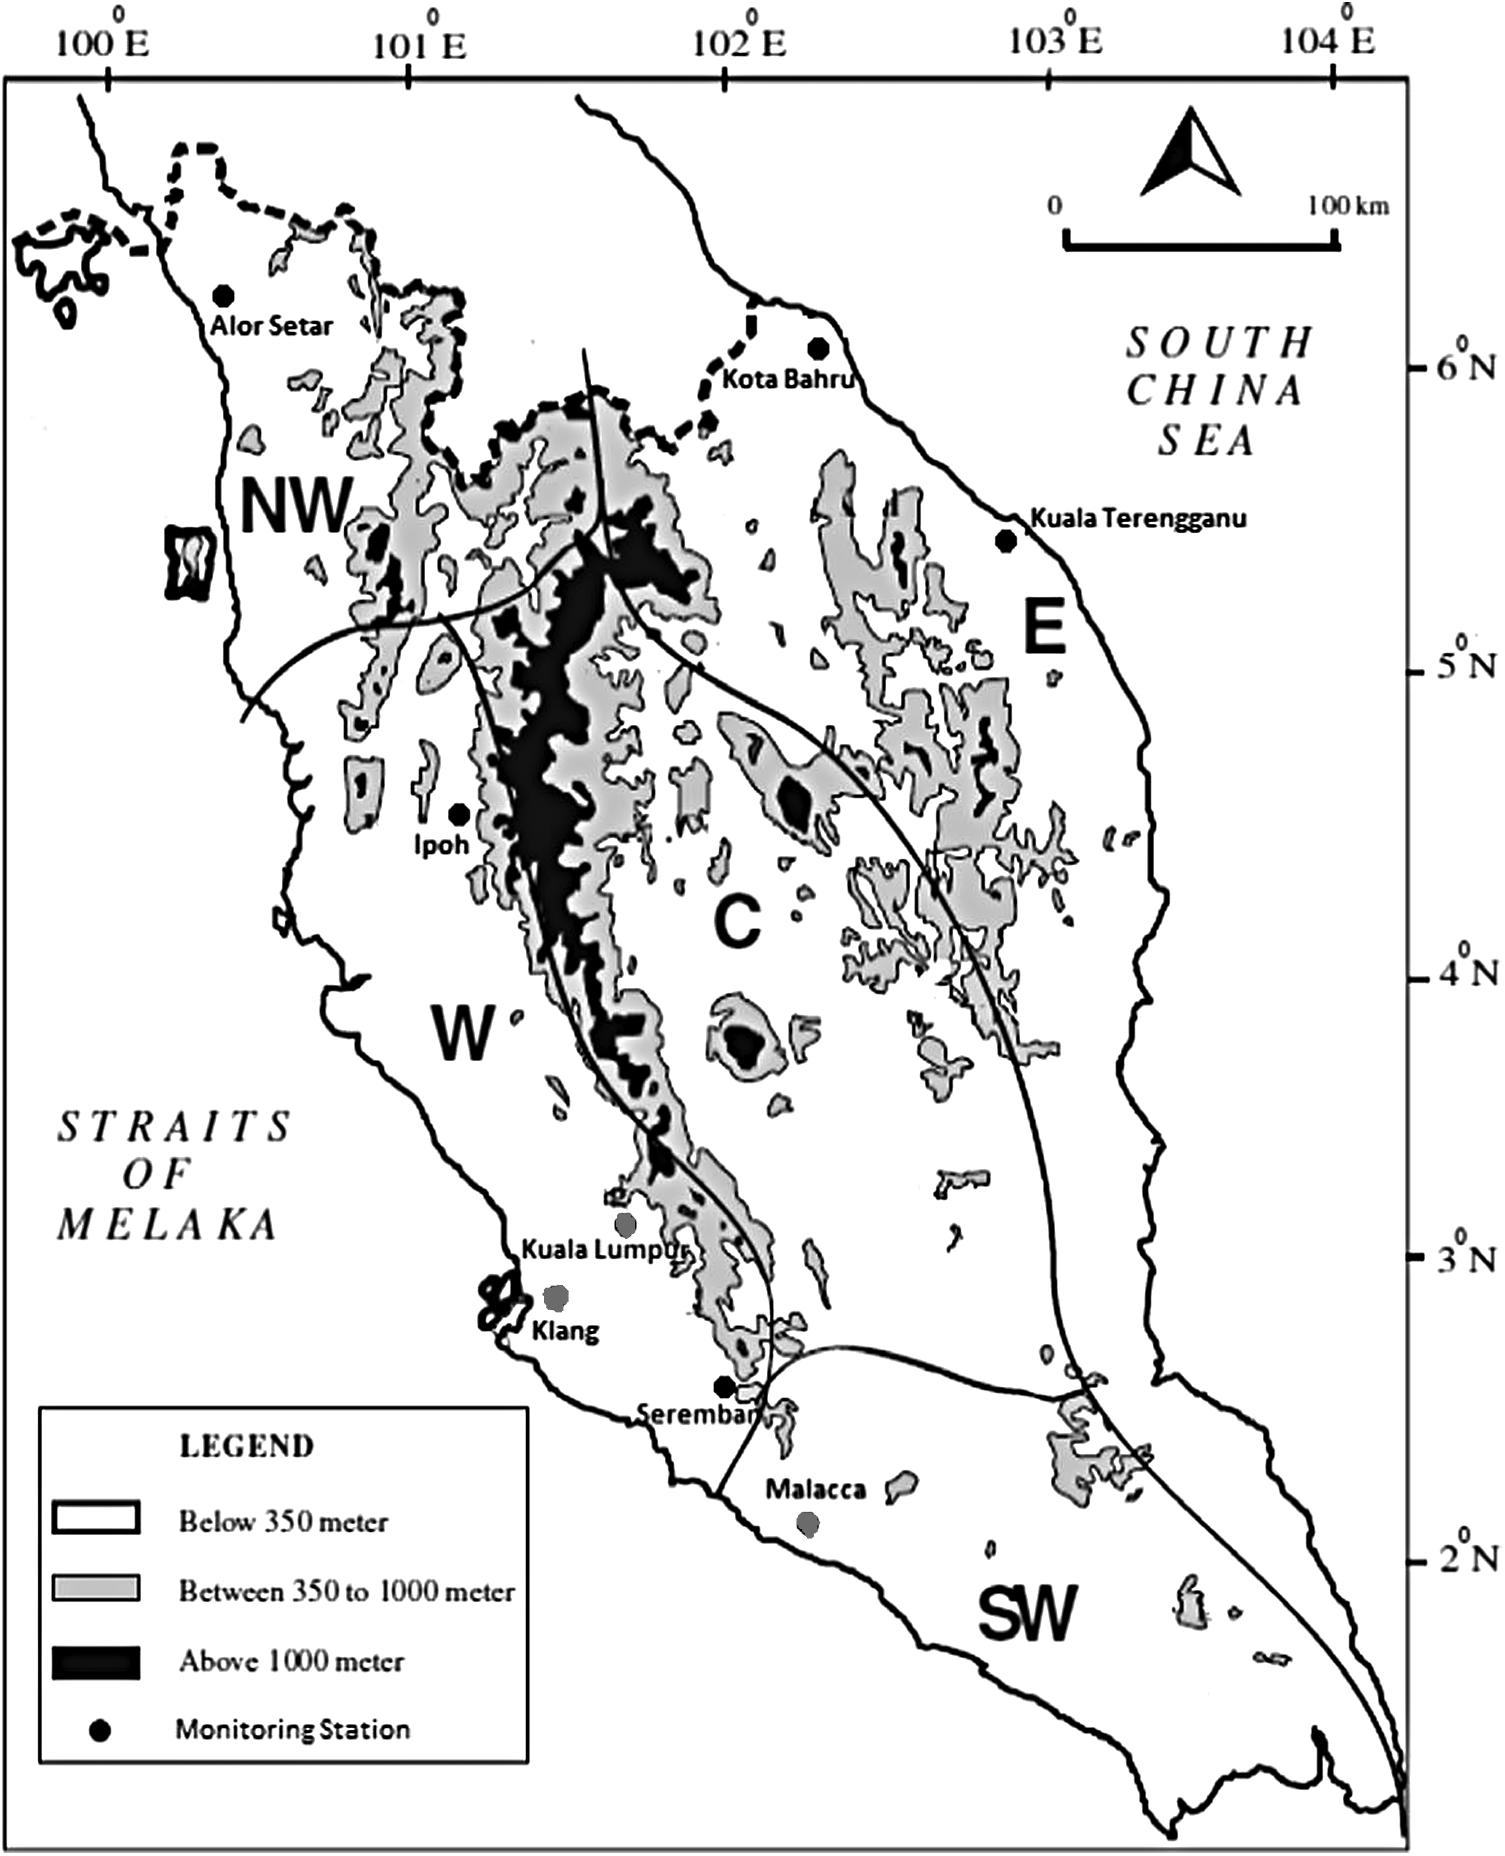
Locations of several air pollution monitoring stations in urban areas of Peninsular Malaysia (Masseran et al., 2016).
Klang City is the second area. It is located at around 32 km to the west of Kuala Lumpur and stretches over an area of 573 km2. Klang is identified as the 13th busiest transshipment port and the 16th busiest container port in the world. Klang is one of the most densely populated and industrialized regions in Malaysia due to a wide range of industries and import and export activities that have been operating in the Port Klang (Gin, 2009; Masseran et al., 2016).
The third location is Malacca City, which is located in the southern region of the Peninsular Malaysia, near the Straits of Malacca. This city is ∼152 km from Kuala Lumpur (Google Maps, 2015). The weather of Malacca is hot and humid during the year with rainfall, and the intensity of rainfall depends on the time of the year (Nieuwolt, 1966); yet, Malacca has no dry season. Malacca is a historical city center that is listed as a UNESCO World Heritage Site since July 8, 2008. For this reason, it is a tourist attraction site as well as an important industrial hub (Melaka and George Town, http://whc.unesco.org/en/list/1223).
Accordingly, due to the increase in air pollution resources, it is essential to evaluate the risk of unhealthy air pollution and its dominants in the most polluted cities in the urban areas of Peninsular Malaysia. The data used in this study include the hourly data for the period from January 1, 2005 to December 31, 2014.
Methods
Peak-over-threshold based on the generalized Pareto model
The unhealthy API data are considered the value that exceeds the threshold value u = 100 (Masseran et al., 2016). Let X refer to the observed data of the API, and F is an unknown distribution function of a random variable X. Thus, the unhealthy API is governed by the distribution function Fu of variable of x above a certain threshold u. Thus, the conditional exceedance density function, Fu, is defined as follows:
As we are interested in the limit of threshold u, let
The exceedance df in Equation (2) gives corresponding knowledge of the exceedance df in Equation (1) (Reiss et al., 2007). In this study, in order to estimate the parameters and describe the distribution of the exceedance values of API above u = 100, the generalized Pareto a distribution function (df) is fitted to the df of Fu.
GPD parameter estimation
The generalized Pareto df is the limiting distribution of normalized excesses over a threshold, as the threshold approaches the endpoint of the variable (Pickands, 1975; Ribatet, 2007). The distribution function,
where x = random variable and x > u,
Based on the value of the shape parameter ( 1. The distribution is GPD type I, if 2. The distribution is GPD type II, if 3. The distribution is an exponential distribution, if
In this study, we employed the maximum likelihood method for estimating the model parameters. The log-likelihood function to be optimized, for
where
Hüsler et al. (2011) estimated the parameter θ in Equation (5) using the following equation:
where
and
where
Pickands dependence function
Plotting the Pickands dependence function is a significant tool for detecting the strength of dependence between API and its main dominants. It is popular to parameterize a bivariate extreme value distribution based on the Pickands representation (Pickands, 1981; Smith et al., 1990), that is, if v is any bivariate extreme value distribution, then parameterization can be given by the following equation:
where z are unit Frechet.
The dependence function is necessarily convex, satisfies
Results and Discussion
Unhealthy API, which is higher than 100, has a negative influence on human life. So, it is useful to investigate the pollutants that impact the API level. Table 1 shows the exceedance proportion of 100 for API and its pollutants. API peaked over the unhealthy level in all locations, which is the highest proportion in Klang with ∼0.02 and the lowest in Malacca with 0.01. Also, there are merely two pollutants in excess of the threshold value in all locations; as shown in Fig. 3, which are O3 and PM10. Thus, O3 and PM10 are the critical dominants of unhealthy level of API and their effects differ in the respective locations. For example, the exceedance of API in Kuala Lumpur is mainly influenced by the exceedance of O3, which has the highest exceedance proportion among pollutants. However, the unhealthy level of API in Klang and Malacca are mainly determined by PM10. Consequently, it is useful to employ statistical analysis to study the characteristics of unhealthy API and its critical dominants in the most polluted urban region in Peninsular Malaysia. The method used in this study is the POT method, which is based on the GPD model.
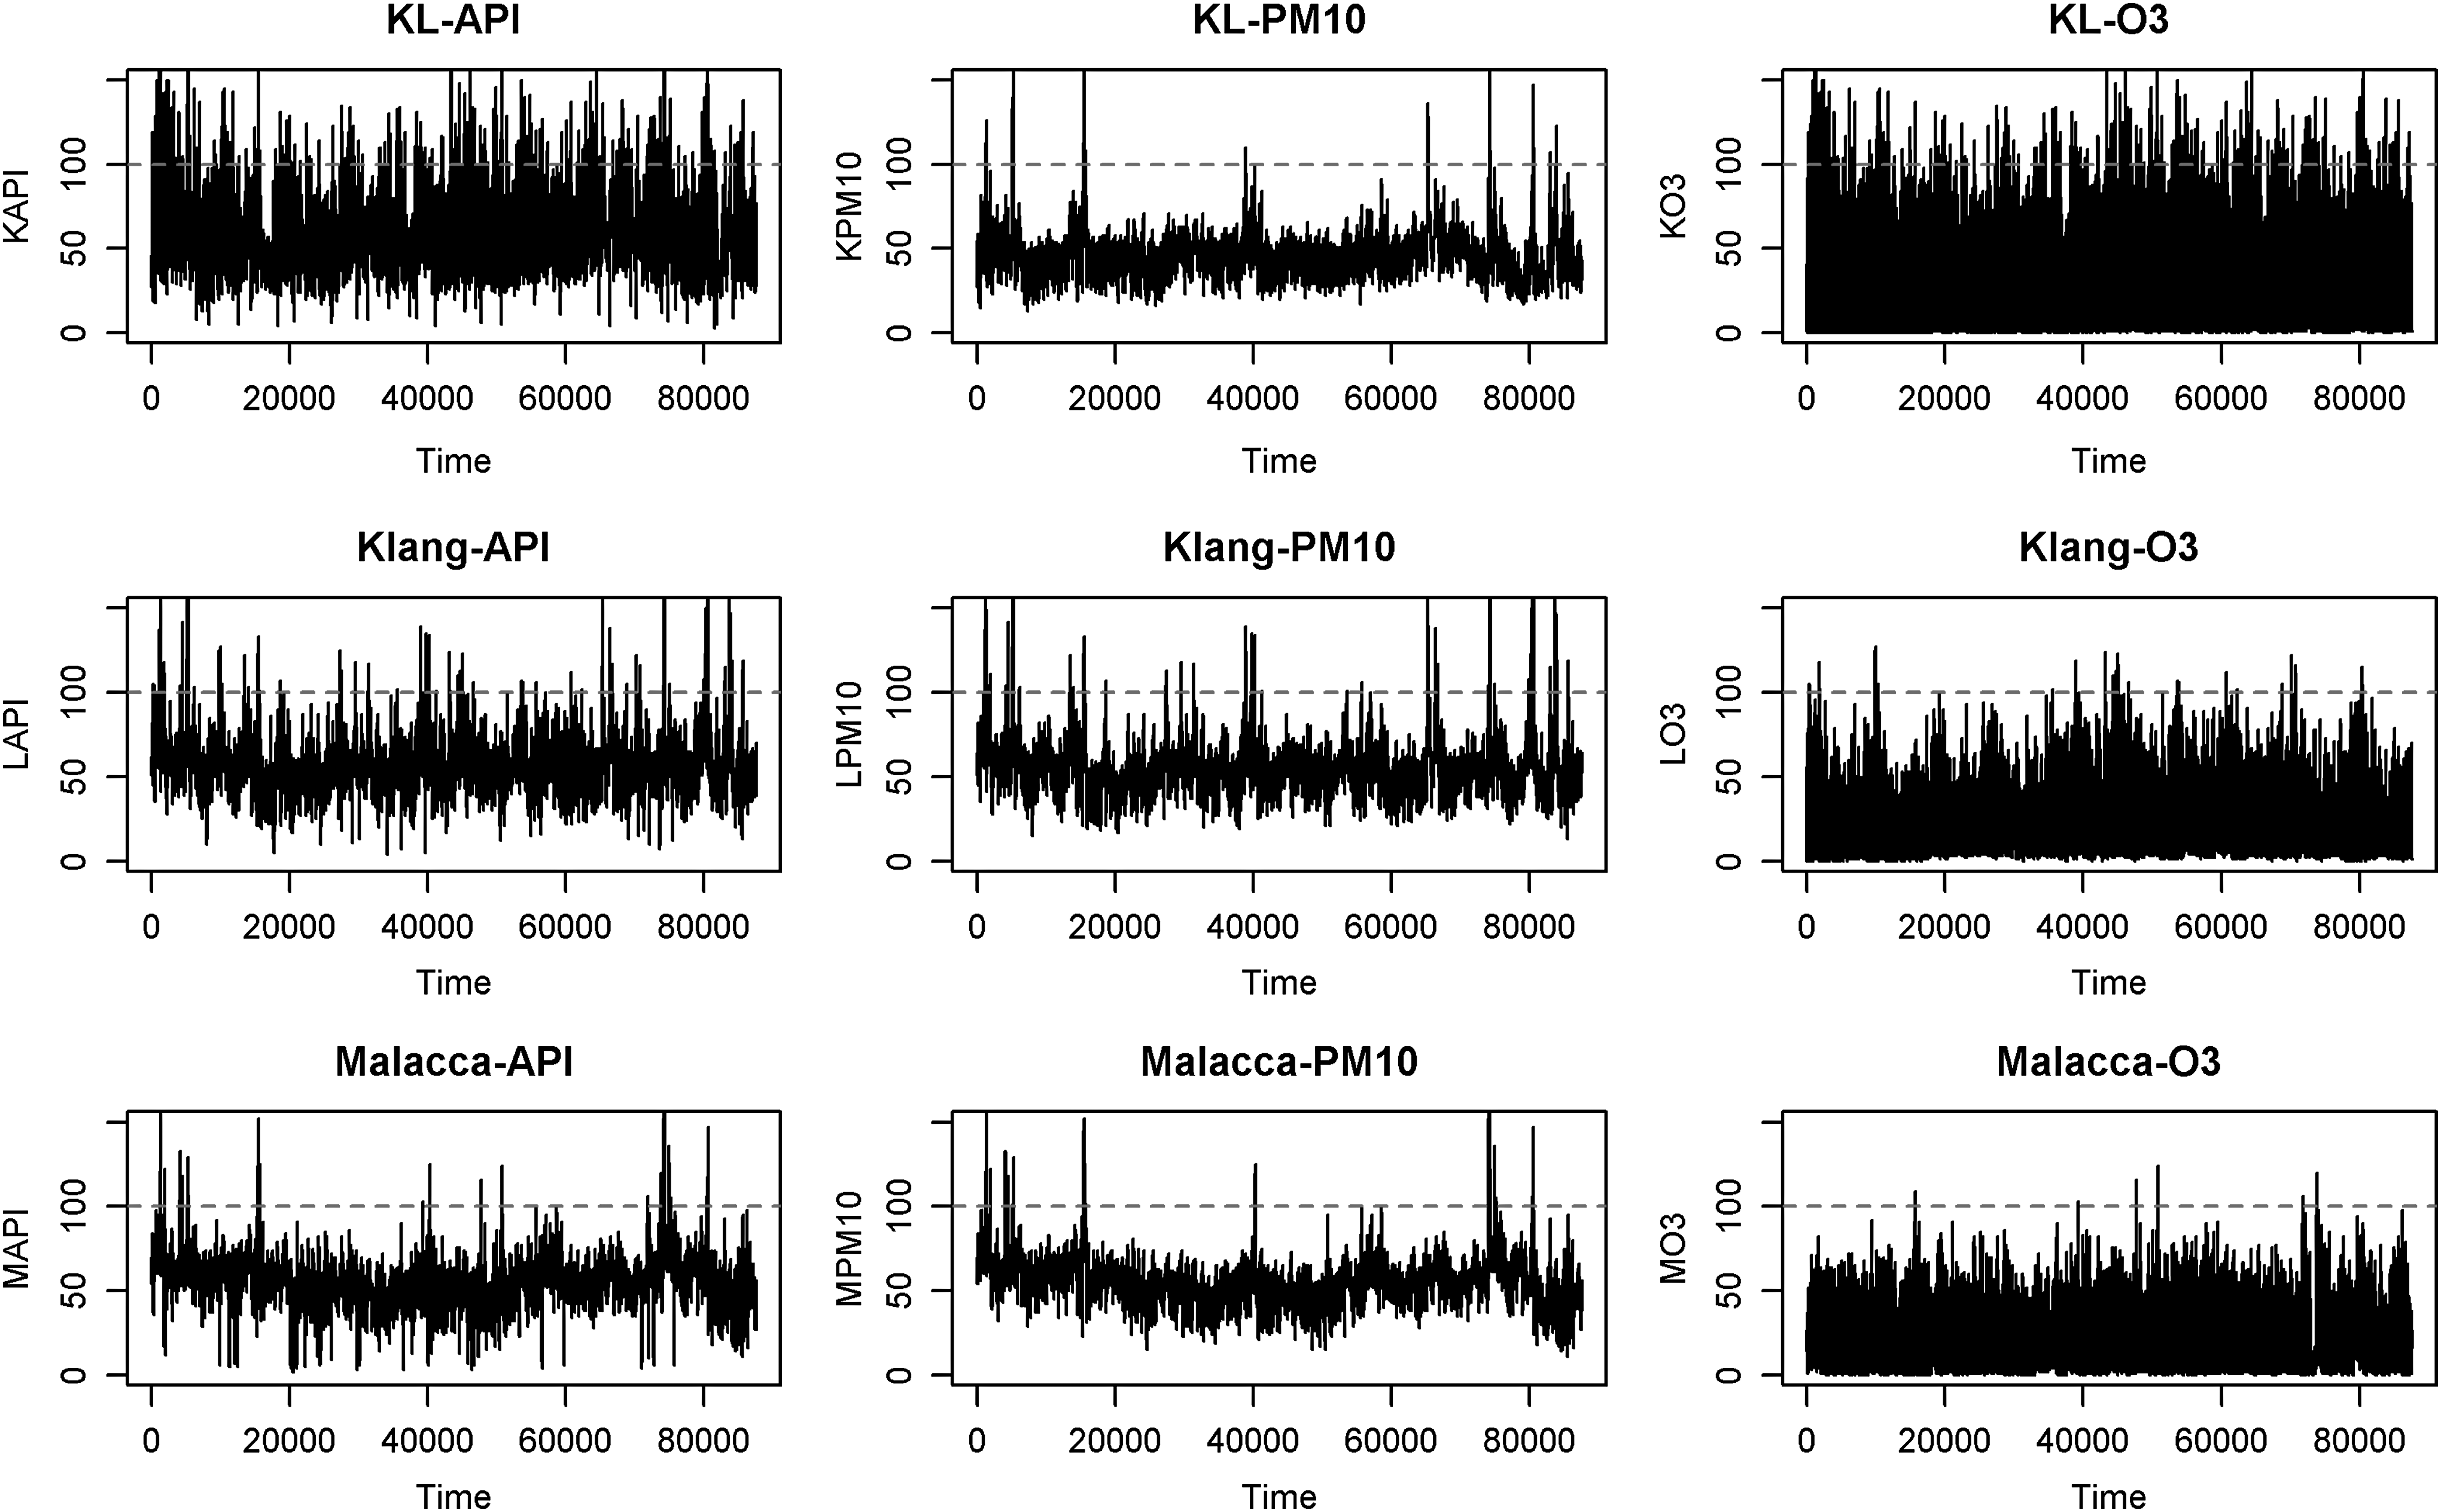
Time series plots for data of API and its dominants with respect to thresholds u = 100. The dashed red line indicates a fixed threshold of 100. Upper row: Kuala Lumpur data; middle row: Klang data; bottom row: Malacca data. Left column: API data; middle column: PM10 data; right column: O3 data. O3, ozone; PM10, particulate matter.
API, air pollution index; CO, carbon monoxide; NO2, nitrogen dioxide, O3, ozone; PM10, particulate matter; SO2, sulfur dioxide.
The threshold is usually selected before fitting, providing the so-called fixed threshold approach. Threshold selection includes balancing bias, variance, and rationality. The threshold has to be adequately high to confirm that the asymptotics underlying the GPD approximation are reliable, hence decreasing the bias. However, the reduced sample size of high thresholds raises the variance of the parameter estimates (Masseran et al., 2016). Also, the threshold choice should be rationally related to the problem under study. If the threshold value is much lower or higher than it should be, the results will be meaningless.
The choice of a good threshold value is quite subjective due to the existence of more than one proper threshold with different inferred tail behaviors (Scarrott and MacDonald, 2012). In this study, the threshold selected is based on unhealthy level of API and its critical dominants, which is more than 100. Thus, the threshold value is fixed, u = 100, and it is needed to test the ability of threshold to offer a valid POT analysis with respect to the data. If the threshold value u = 100 is high with a few exceedance events, the POT analysis is unlikely to provide informative results. However, if the threshold value u = 100 is found to be low, then a lot of data will be considered an exceedance event. So, the POT analysis will also be biased. Therefore, the mean residual life (MRL) plot is utilized to test the suitability of the threshold (u = 100). The MRL can be conducted by plotting a threshold u against the mean of the excess over the threshold (
Thus, for providing an adequate POT analysis based on the GPD model, the MRL function in Equation (11) should be linear in u, which is given by
where
Figure 4 shows the MRL plot for the API values and its main dominants in several urban areas of Peninsular Malaysia. It is seen from the MRL plots that the area of Kuala Lumpur shows linear properties for API and its main dominants with respect to the threshold value u = 100. However, the MRL plots display linear properties for API and one of its dominants (PM10) in the other locations. Thus, the POT analysis could be suitable for evaluating the exceedance of API for all areas, while it may be appropriate for some pollutants that have a high exceedance proportion.
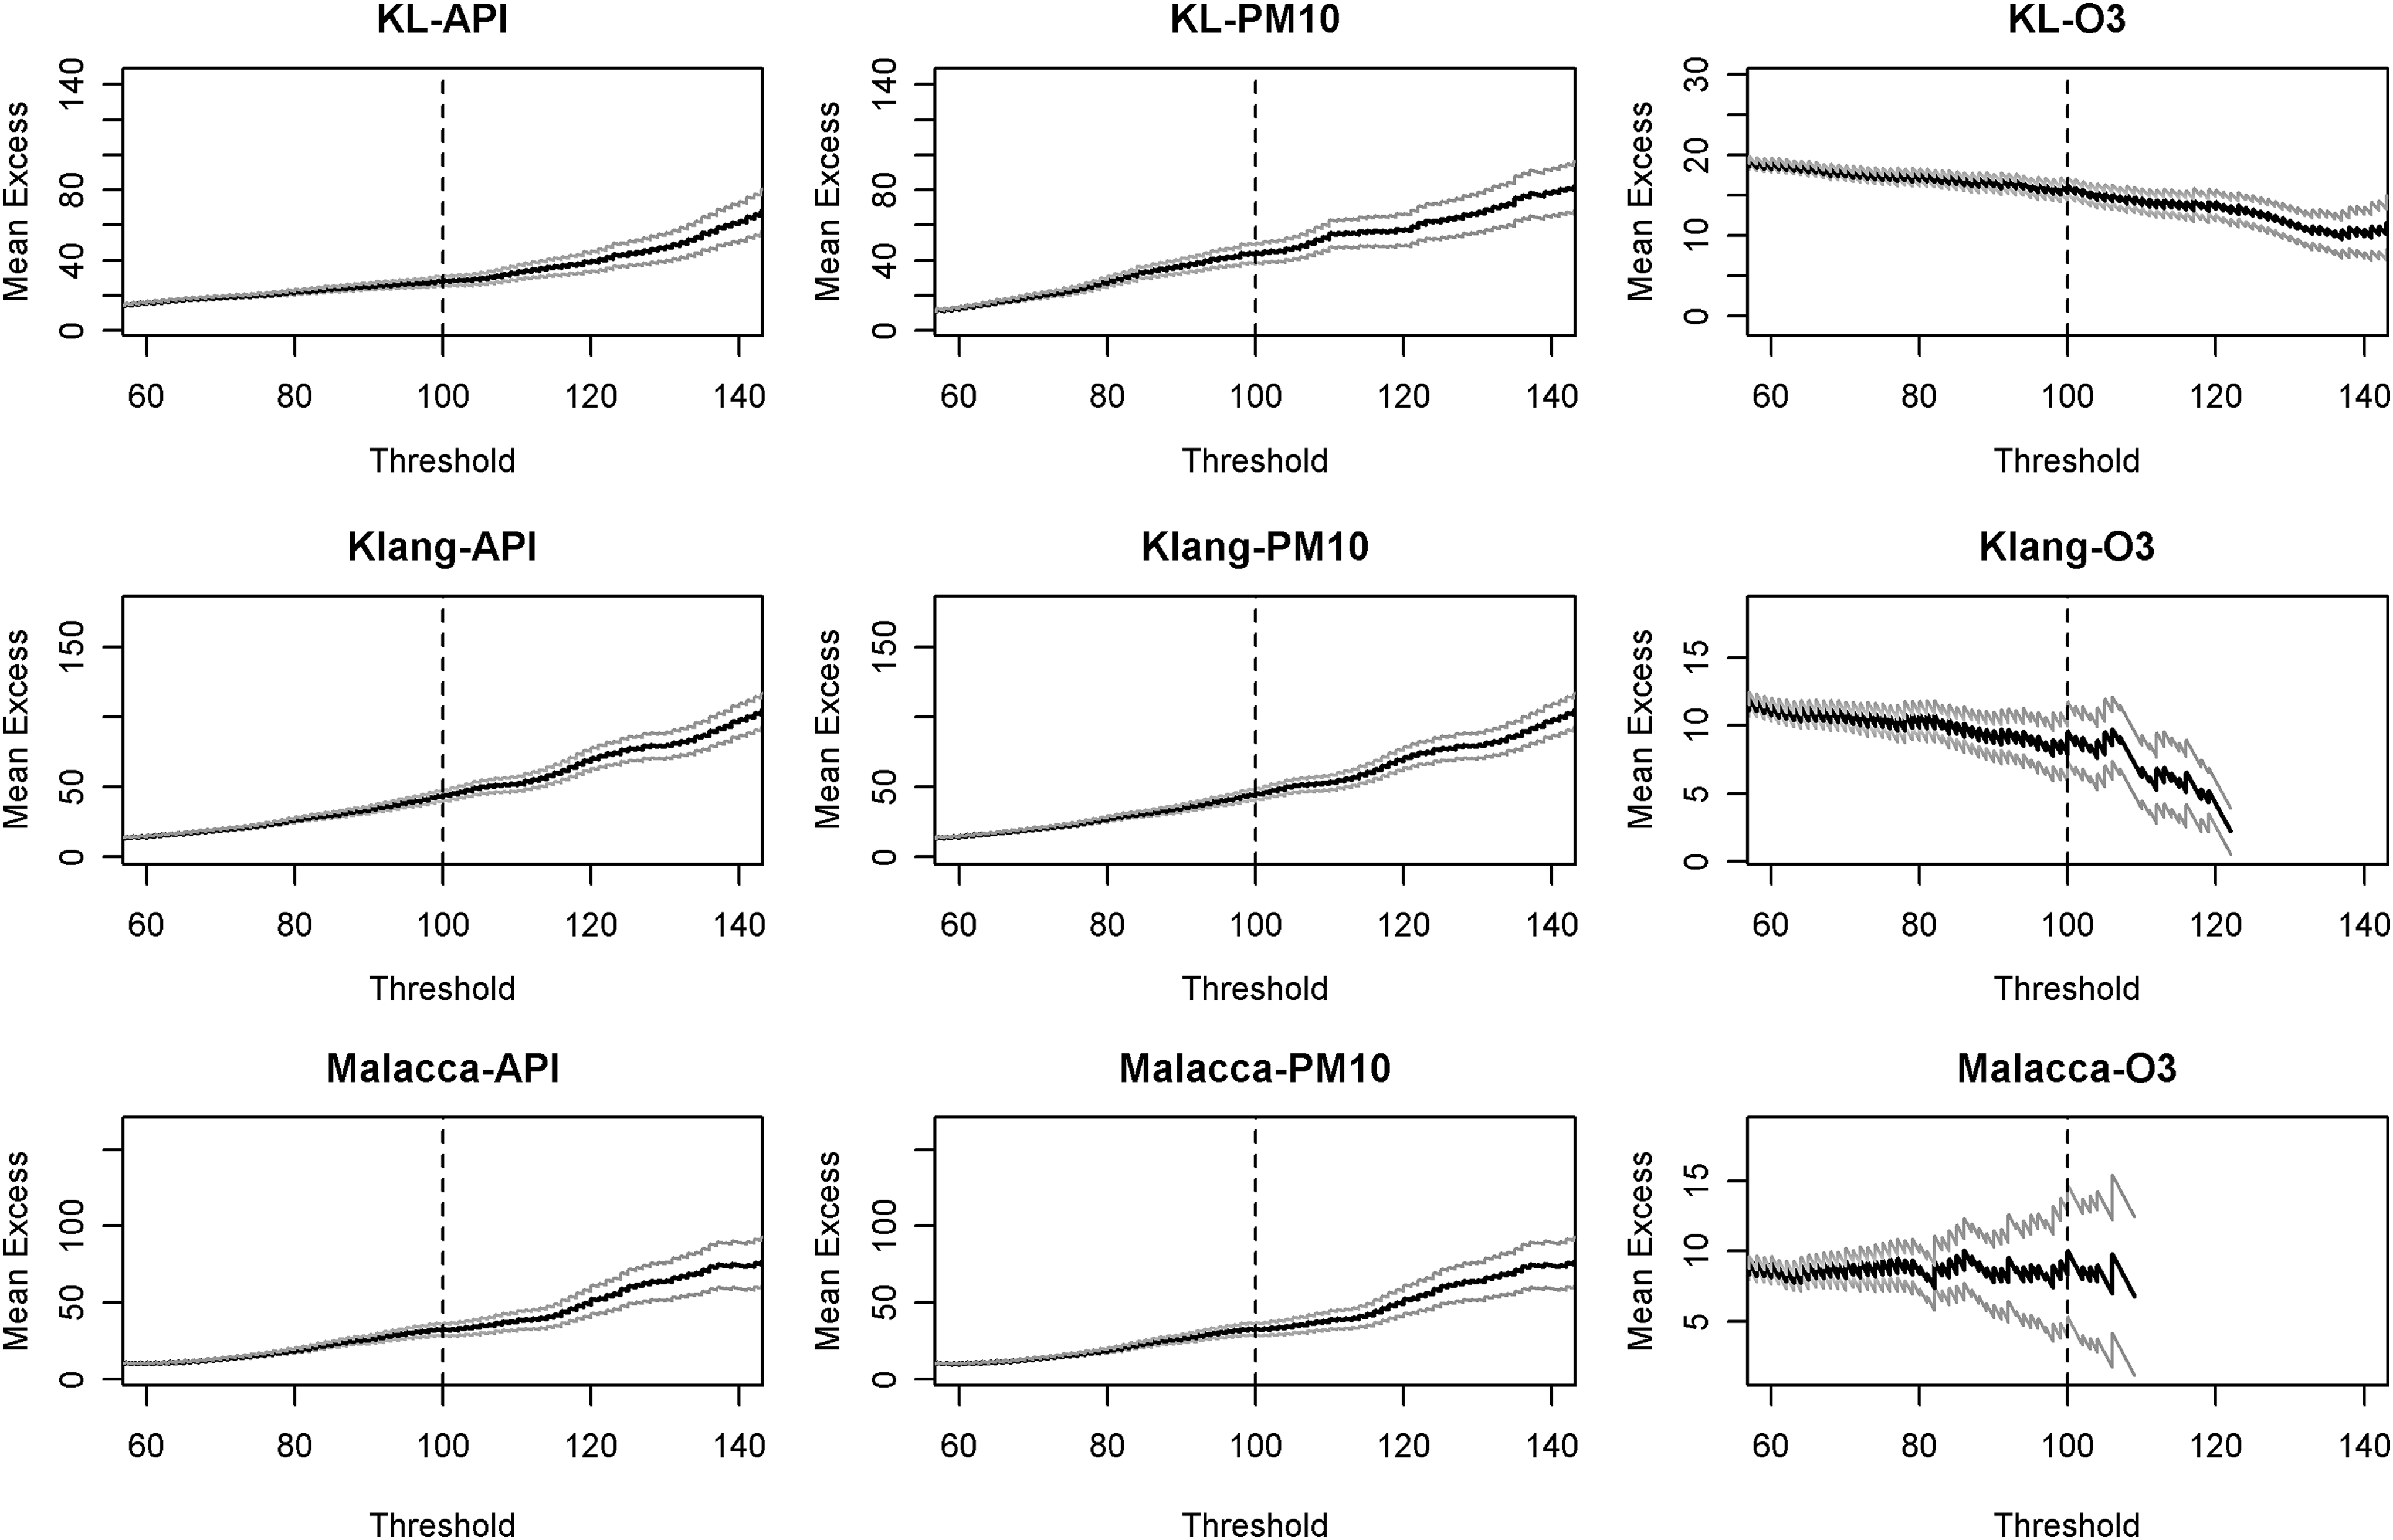
Threshold selection using the mean residual life plot for the unhealthy API and its dominants' data from each monitoring station. The dashed red line indicates a fixed threshold of 100. Upper row: Kuala Lumpur data; middle row: Klang data; bottom row: Malacca data. Left column: API data; middle column: PM10 data; right column: O3 data.
Figure 5 shows the results of the fitted GPD for unhealthy API and its dominants (PM10 and O3) in Kuala Lumpur, Malacca, and Klang. It was found that the GPD does not fit well with O3 in Klang and Malacca due to small numbers of exceedance of threshold value (u = 100). However, the GPD is a good fitting model for unhealthy API and its dominants (O3 and PM10) in KL, and for the exceedance of API and its main pollutant (PM10) in Klang and Malacca. Moreover, Fig. 6 displays the probability plot, which shows that the GPD is able to provide a good approximate model for the data of unhealthy API and its critical dominants in Kuala Lumpur, Klang, and Malaca. Also, the exceedance of API is determined by the exceedance of its critical dominants. For example, the unhealthy API values in Klang and Malacca depend mainly on the exceedance of PM10, while the unhealthy API in KL is determent by both pollutants (PM10 and O3). Thus, the Pickands dependence function is utilized to detect the strength of dependence between unhealthy API and its dominants as shown in Fig. 7. The dependency of API in Klang and Malacca with its critical dominant (PM10) is close to perfect; thus, PM10 is essentially the underlying cause of unhealthy API in both locations. However, both dominants (PM10 and O3) contribute in determining the exceedance of API in KL.
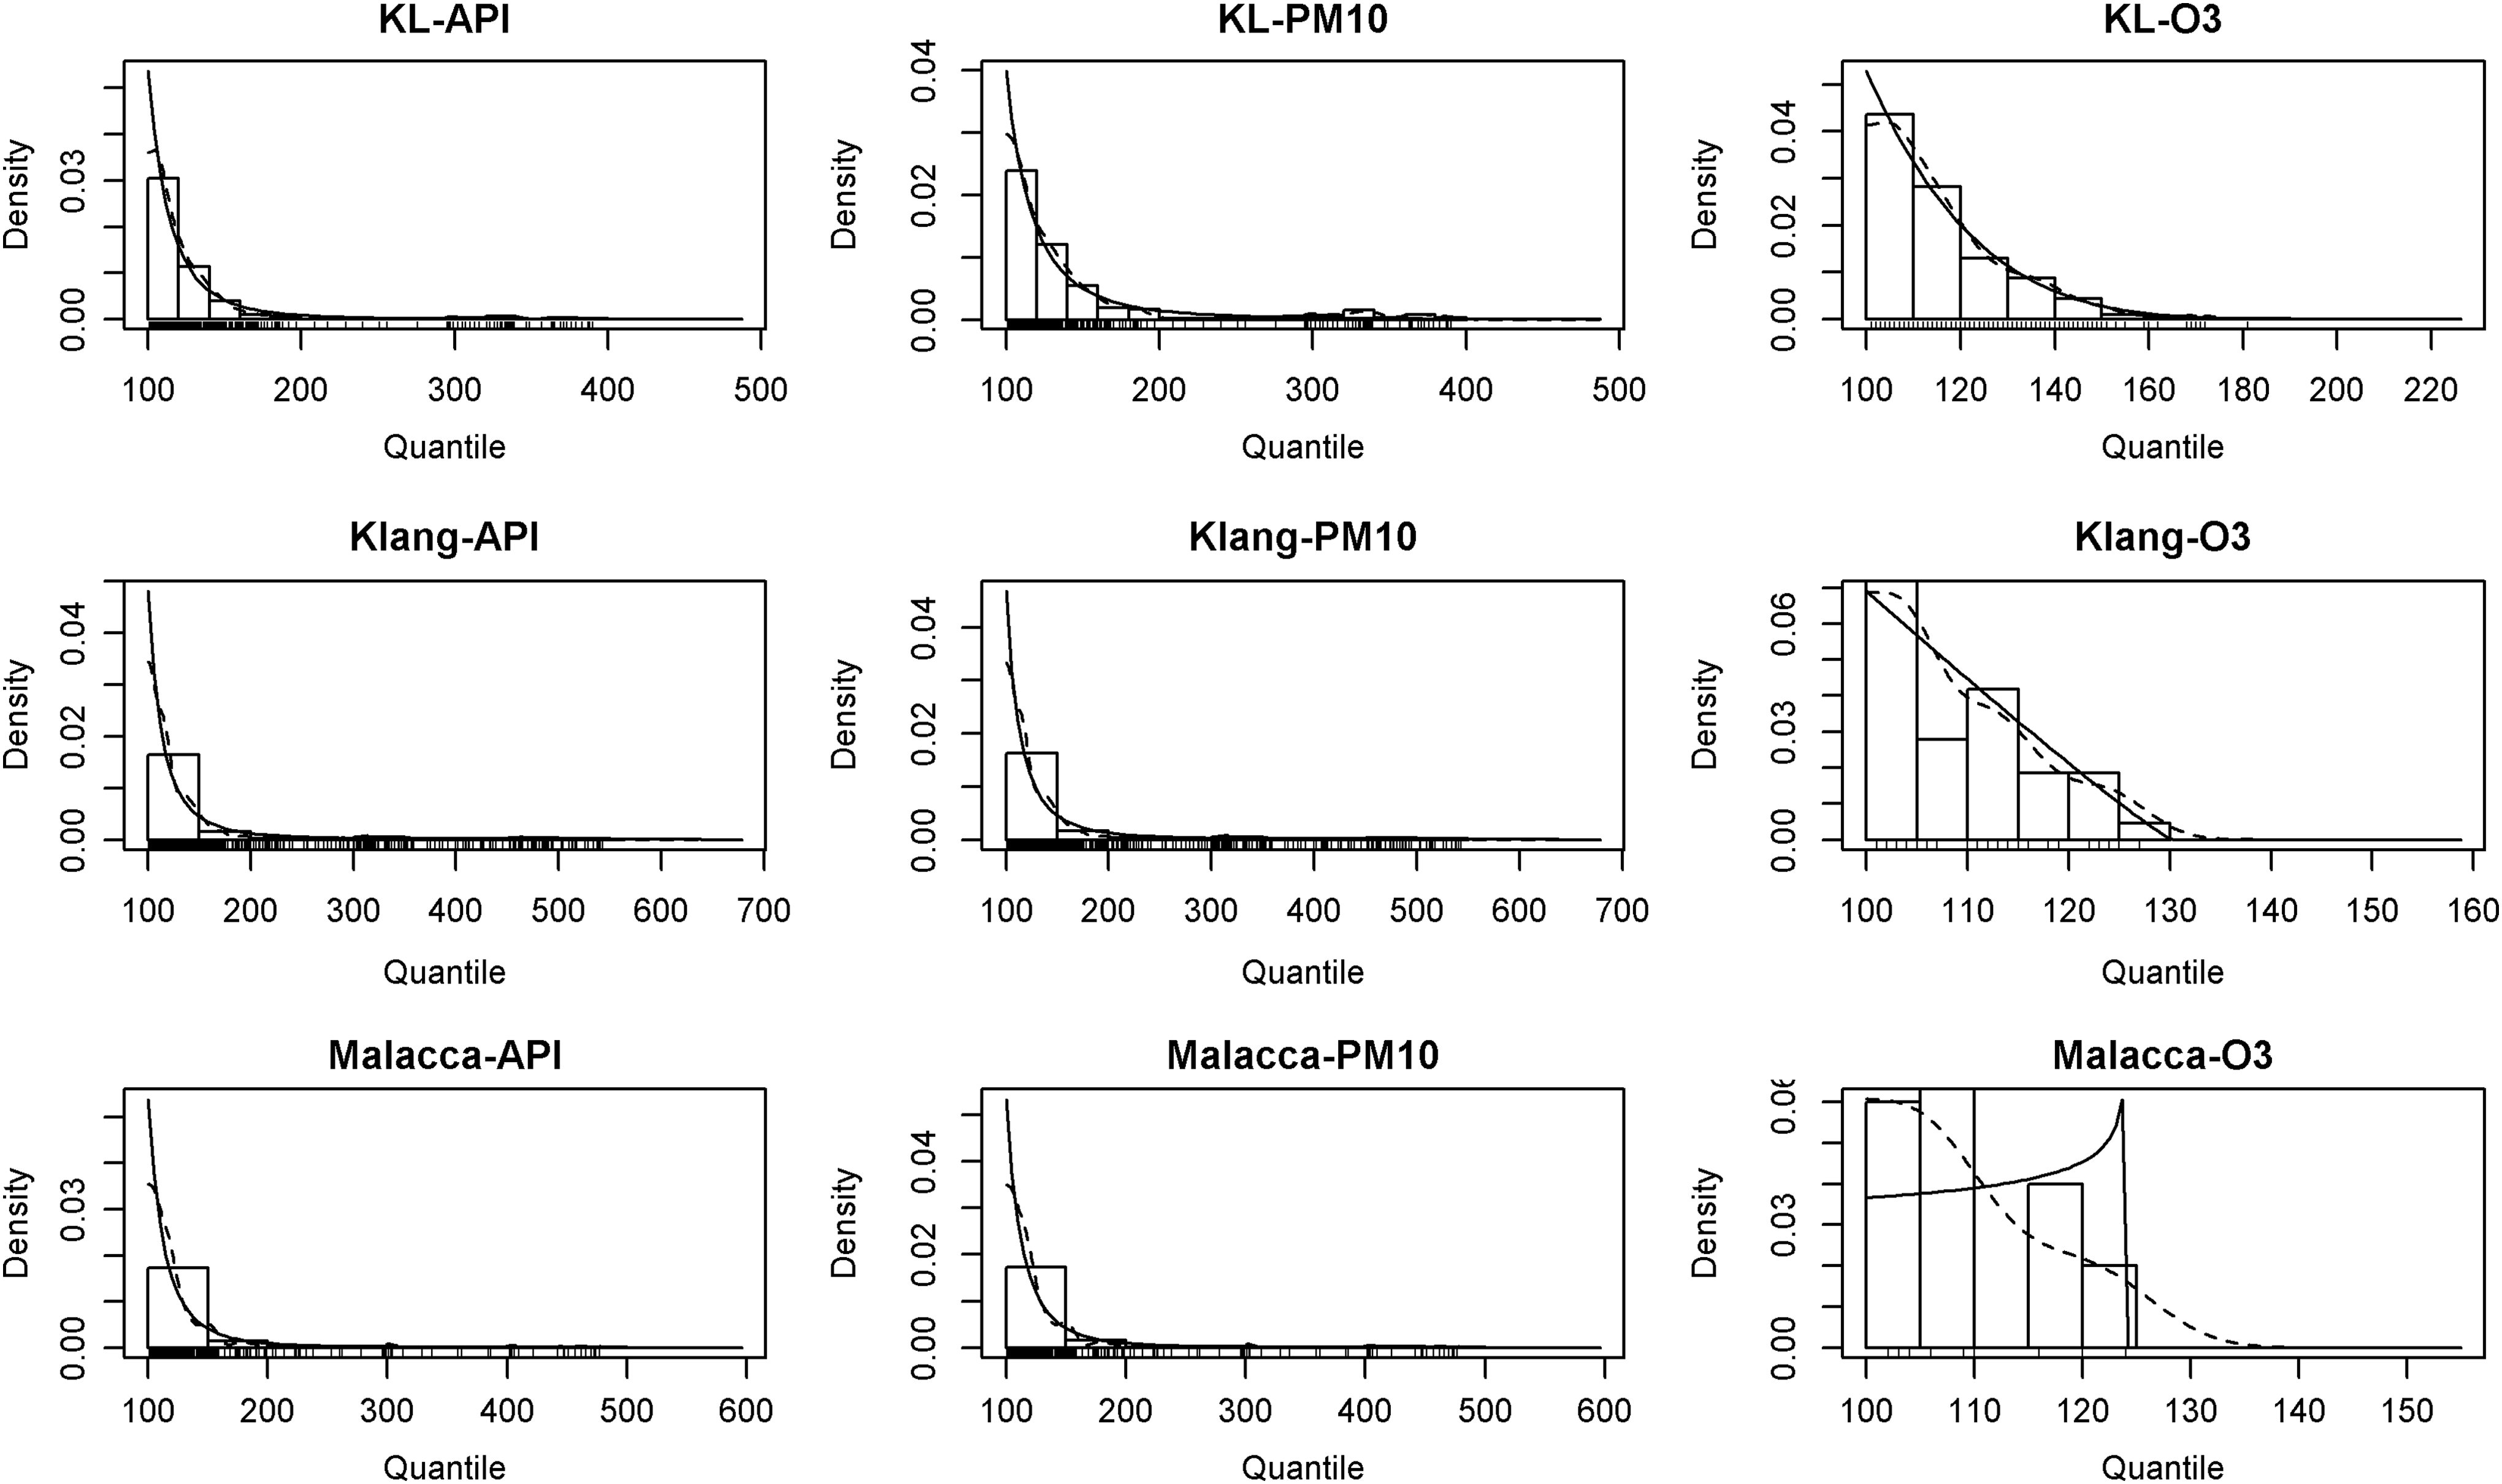
Density plots of the fitted GPD for the data of API and its dominants. Upper row: Kuala Lumpur data; middle row: Klang data; bottom row: Malacca data. Left column: API data; middle column: PM10 data; right column: O3 data. GPD, generalized Pareto distribution.
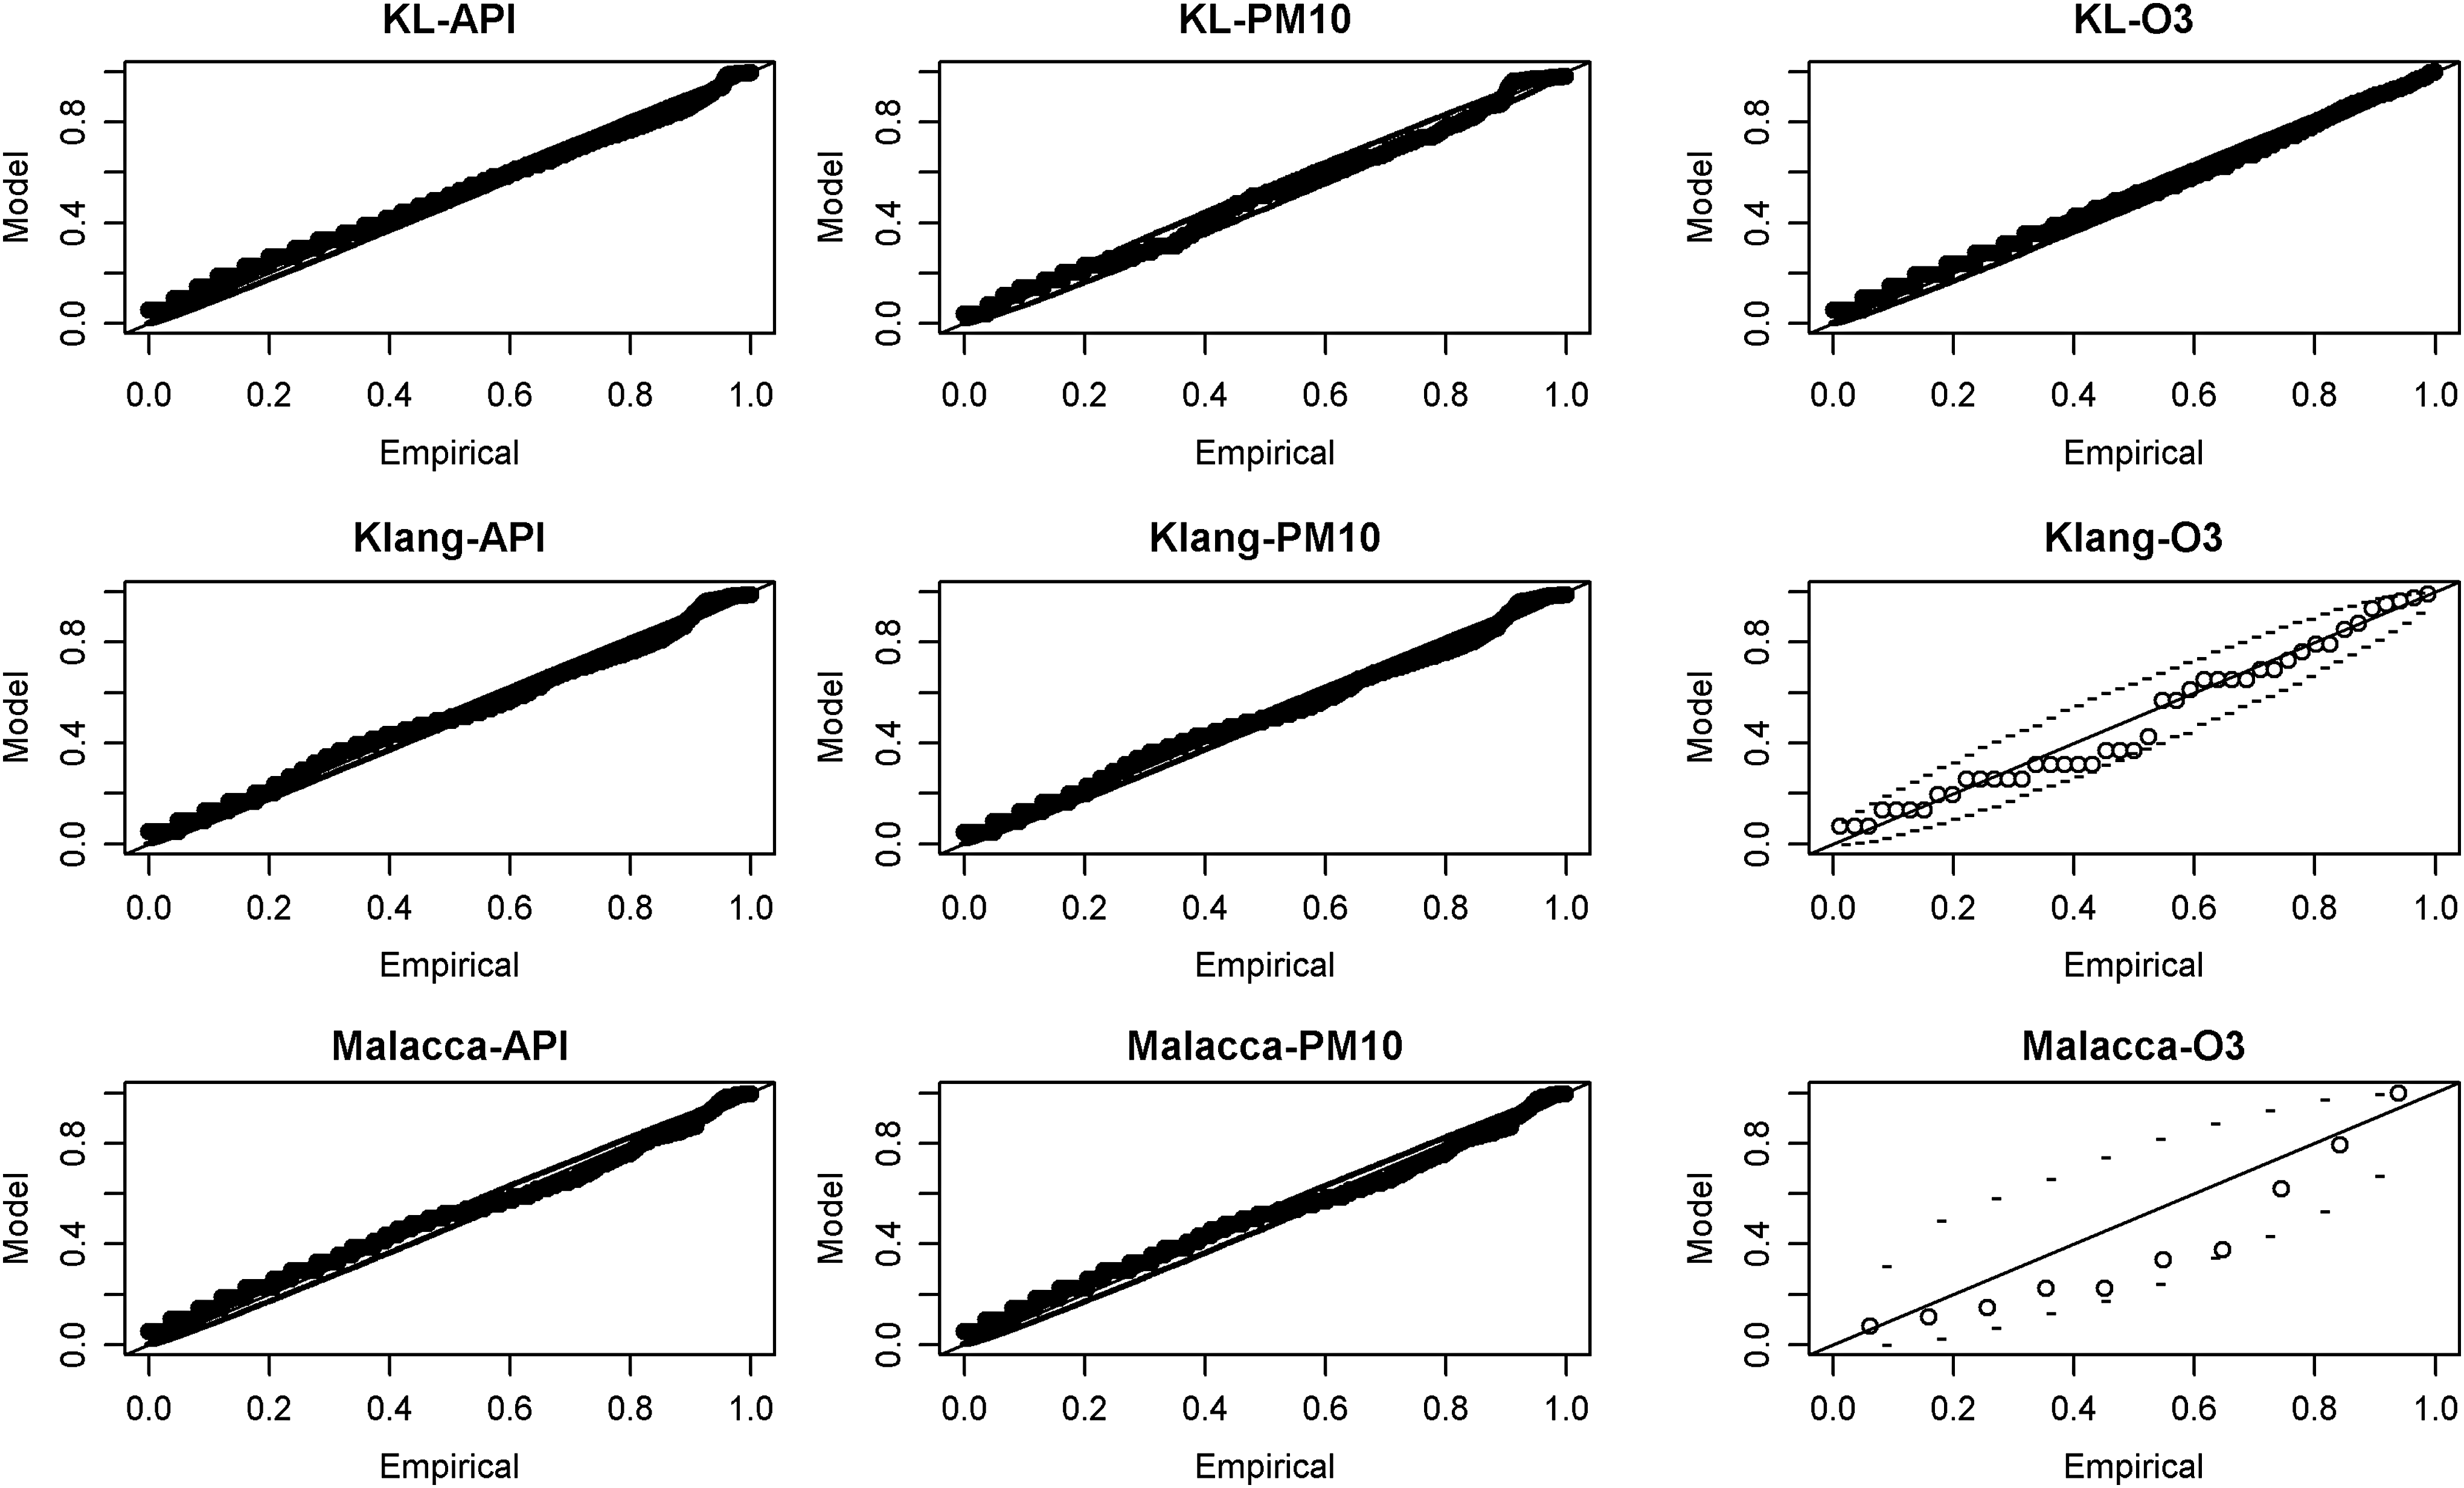
Probability plots for the unhealthy API and its dominants. Upper row: Kuala Lumpur data; middle row: Klang data; bottom row: Malacca data. Left column: API data; middle column: PM10 data; right column: O3 data.
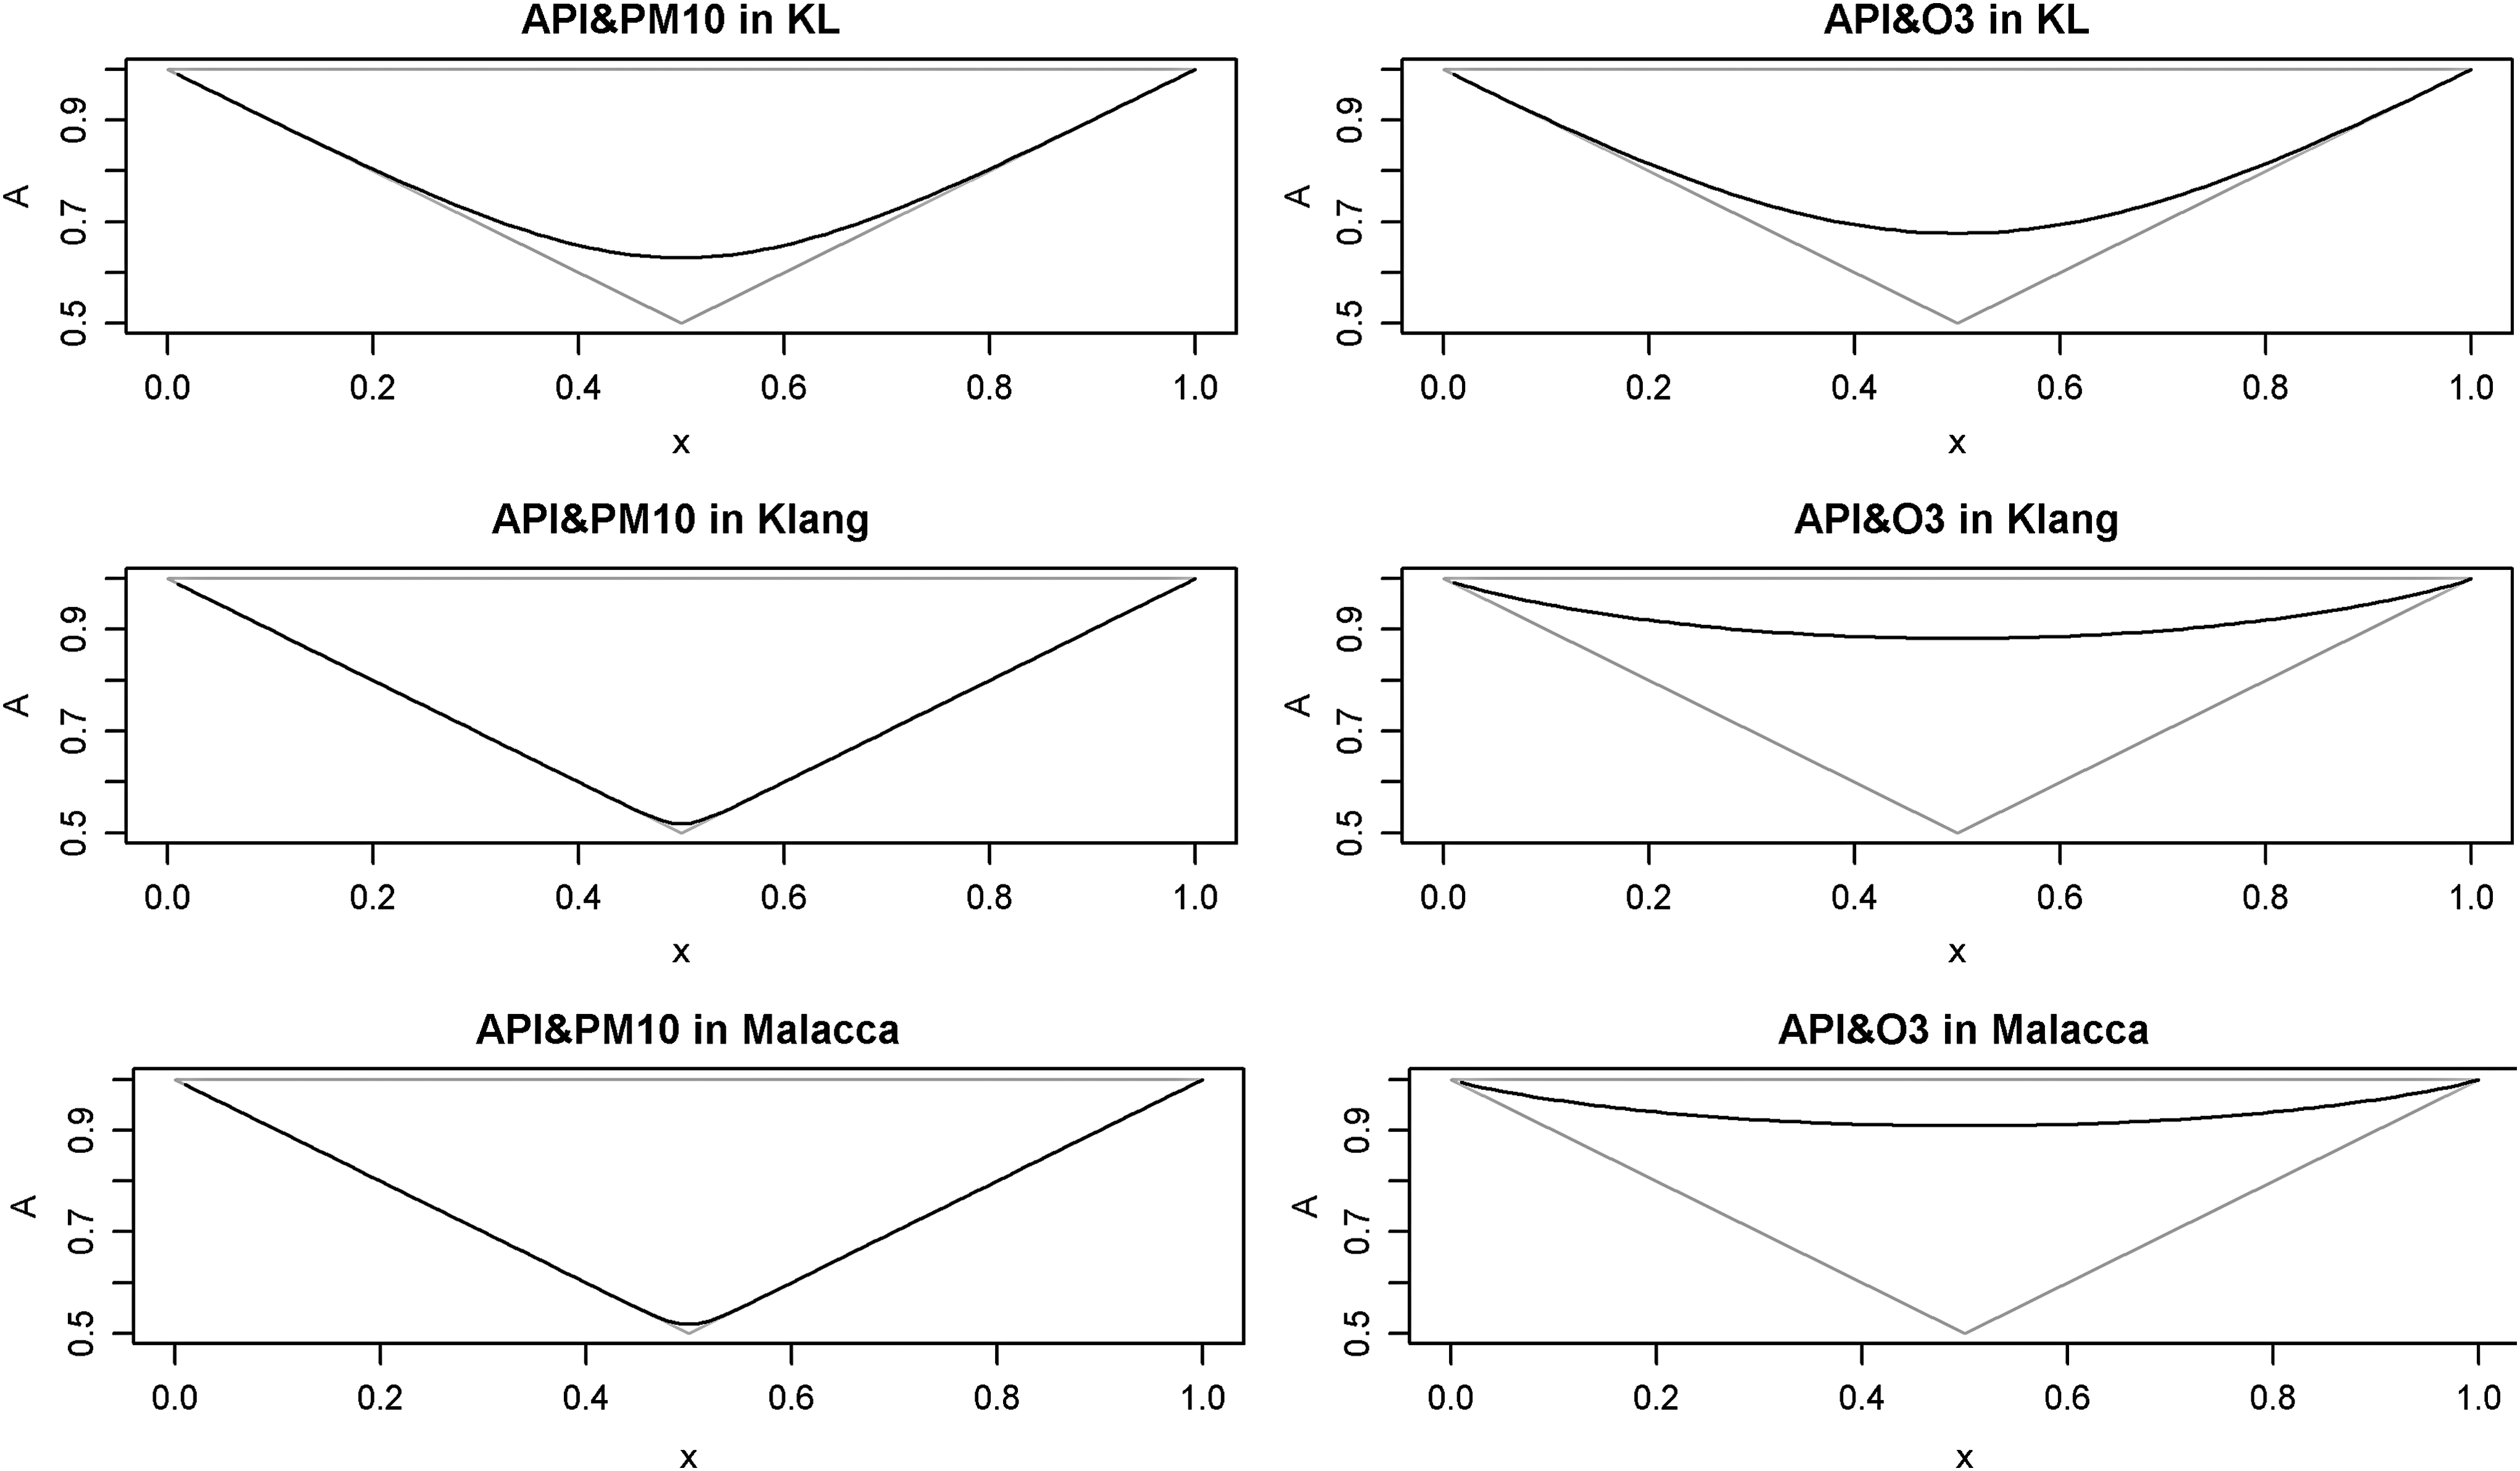
Pickands dependence function plots for evaluating strength of dependence between unhealthy API and its dominants. Left column: the dependence between API and PM10; Right column: the dependence between API and O3. Upper row: Kuala Lumpur data; middle row: Klang data; bottom row: Malacca data.
Estimation of parameter for GPD is revealed in Table 2 and it is found that the parameter shape ξ >0 for API and PM10, which indicates short-tail properties in the data distribution. Thus, the API and PM10 data for Kuala Lumpur, Klang, and Malacca areas will follow a Pareto type I model. However, the parameter shape ξ <0 for O3 in KL, and this is known as a Pareto type II distribution.
As mentioned above, PM10 plays the main role in determining the values of API and the unhealthy level of air quality. Also, O3 has an important contribution on the unhealthy values of API, especially in Kuala Lumpur. Thus, authorities need to focus on the reduction of the sources of the two pollutants, instead of five pollutants, in terms of maintaining safe air quality. The sources of air pollutants in Malaysia are classified into localized and transboundary (Hashim et al., 2004). The main local source of air pollution in Malaysia is vehicular emissions (Department of Environment Malaysia, 2002) and the critical transboundary source of pollutants from Indonesia is the haze from forest fires during the dry seasons, particularly between August and November each year (Brauer and Hisham-Hashim, 1998). Both type of sources influence, directly or indirectly, the level of pollutants of unhealthy API. For instance, PM10 is a primary pollutant that emanates directly from sources (Daly, 2007) and it is a useful index for some sources of outdoor air pollution, such as fossil fuel emissions (Künzli et al., 2000). However, O3 is a secondary pollutant, which is formed by a chemical reaction between oxides of nitrogen (NOx) and volatile organic compounds (VOCs) in the existence of heat and sunlight (Sillman, 1999). The main sources of NOx and VOCs that assist to form O3 are motor vehicle exhaust, industrial emissions, and gasoline vapors (Stieb et al., 2002). Thus, an advanced comprehension of the main pollutants and their sources will help in keeping the air quality in safe level, with the result being reduced bad effect on human health.
Several diseases associated with the unhealthy level of critical pollutants in the area under study. Long-term exposure to unhealthy level PM10 concentration leads to the increase of cardiopulmonary and lung cancer mortality (De Hartog et al., 2003; WHO, 2003). It also compromises lung function and helps develop asthma, pneumonia, bronchitis, and emphysema among children, elderly, and susceptible individuals (Zailina et al., 1996, 1997; Juliana, 1998; James et al., 2002). On the other hand, a high concentration of ground-level O3 causes some health problems such as aggravated asthma, coughing, wheezing, decrement in pulmonary function, and increased susceptibility to respiratory diseases like bronchitis and pneumonia (Dockery et al., 1993; Hashim et al., 2004; Stern, 2014). In the same vein, the exposure to unhealthy level of both pollutants increases the risks of cardiovascular and respiratory morbidity and mortality. Also, these illnesses, mentioned above, could be the most common diseases created by the critical pollutants of unhealthy API in the investigated areas.
From the results obtained, we can conclude that not all five air pollutants significantly impact the unhealthy level of API; however, just two pollutants, which are PM10 and O3, influence the unhealthy API, and PM10 is found to be the critical dominant among all targeted locations. A good comprehension for unhealthy API and its dominants will help detect the sources of air pollution and hence facilitate the development of plans and appropriate treatments to reduce the unhealthy level of air pollutants.
Conclusion
In this study, the critical dominants of unhealthy air pollution for three different urban areas of Peninsular Malaysia are investigated and characterized using the POT method based on the GPD model. The dominants for unhealthy level of API in the three urban locations are mainly PM10 and O3. The exceedance of API is mostly determined by both pollutants in KL, while only PM10 is the critical dominant of unhealthy API in Klang and Malacca. Likewise, the Pickands dependence function showed a strong dependency between unhealthy level of API and the exceedance of PM10 in Klang and Malacca, while there is a good dependency between unhealthy API and both main dominants (PM10 and O3) in Kuala Lumpur. For a given threshold (u = 100), the GPD has been fitted to the data of unhealthy API and its dominants in Kuala Lumpur, Malacca, and Klang. GPD model fits well with all variables in KL and two variables in the other locations, which are API and PM10. Accordingly, the main pollutants affecting the unhealthy API are studied with the view to reduce the sources of air pollution in the highest polluted cities in Malaysia.
Footnotes
Acknowledgments
The authors are indebted to the Department of Environment Malaysia for providing the air pollution data that made this article possible. In addition, the authors also wish to thank the competent reviewers for the valuable comments and suggestions.
Author Disclosure Statement
No competing financial interests exist.