
Abstract
Abstract
This study investigated the ability of monochromatic ultraviolet (UV) light at 254 nm applied at typical drinking water disinfection doses to damage the antibiotic-resistant genes mph(A), sul1, tet-A, and bla-Tem1 in waterborne bacteria. UV sensitivity rank was bla-TEM1 > tet-A > sul1 > mph(A), which is consistent with predictions of a previously presented genomic-based UV sensitivity model. It is the first time that predictions of the relative UV sensitivity of antibiotic resistance genes have been validated with experimental data and suggest that such modeling is useful for determining the UV sensitivity of other genes in waterborne microorganisms.
Introduction
A
A small number of studies on the inactivation of antibiotic-resistant bacteria using UV disinfection have been conducted, with Guo et al. (2013) reporting that a 5 mJ/cm2 dose resulted in 1.4- and 1.1-log reduction of heterotrophic bacteria resistant to erythromycin and tetracycline, respectively. Yoon et al. (2017) and Ferro et al. (2017) also investigated the use of UV alone and UV/H2O2 to inactivate antibiotic resistance genes at the same UV doses, with the results suggesting that the rate of inactivation does not differ significantly. The insignificant effect of H2O2 is likely due to the scavenging of the hydroxyl radicals by the cytoplasmic components and bacteria membrane before it could reach the genes (Yoon et al., 2017). Higher UV doses may be needed to inactivate antibiotic resistance genes, however (McKinney and Pruden, 2012).
Genomic modeling is a method to predict the UV sensitivity of microorganisms based on their whole-genome sequence. The method involves mathematical modeling of the complete genome and establishes the number of nucleic acids that are vulnerable to UV photodimerization (Kowalski, 2011). It has been well established that thymine dimers (a TT pair) are the most common photoproduct of UV irradiation of DNA in vitro and in vivo, followed in order by TC dimers, CT dimers, CC dimers, and dimers formed between purines and pyrimidines designated YR dimers (Setlow and Carrier, 1966; Smith and Hanawalt, 1969; Becker and Wang, 1985). The order of occurrence of these dimers, TT, TC, CT, CC, and YR, is assumed to represent a probability of dimerization. The frequency of these base pairs in any genome is further assumed to be an indicator of the overall UV susceptibility.
Base pairs are counted using software for large genomes and spreadsheets for small genomes and the results are combined with a methodology that has been detailed in various publications and in which it has been used to predict the UV susceptibility of emerging pathogens and Biosafety Level-3 pathogens that are hazardous to handle and test (Kowalski, 2009; Kowalski et al., 2009; Kowalski, 2011; Mayor-Smith et al., 2014). The aforementioned references should be consulted for details of the methodology, which consists of counting the base pairs and multiplying these values together with an exponent for each base pair that acts as a weighting factor. Also counted are the lengths of any pyrimidine clusters, since these form hot spots that can double the probability of photodimerization. The exponent for the TT bases is set to unity and the other exponents are adjusted iteratively until the product correlates strongly in a least-squares curve fit for the clinically established UV sensitivity of viruses or bacteria. In the current case, the products for each ABR gene were matched to data provided by McKinney and Pruden (2012).
While previous experimental studies have shown that this modeling provides reliable predictions of the UV sensitivity of microorganisms, there is no information on the ability of the model to predict the UV susceptibility of antibiotic resistance genes. This study experimentally examined the destruction of four antibiotic resistance genes under UV light: tet-A, sul1, bla-TEM1, and mph(A). These resistance genes were chosen to represent different mechanisms of antibiotic resistance (i.e., using efflux protein, enzymatic modification, or β-lactamase) and because of the relatively common occurrence of these genes in the environment (Yin et al., 2013; Bergeron et al., 2015; Koczura et al., 2016). The experimental results were then compared with predictions from genomic modeling of UV sensitivity of the genes.
Experimental Protocols
A multiple drug-resistant strain of Escherichia coli NCTC 13400, which harbors 10 resistance genes, including bla-TEM1, aac6′-Ib-cr, mph(A), catB4, tet-A, and sulI genes, was obtained from the National Collection of Type Culture (Public Health England). It was grown in Luria broth medium (Oxoid, Basingstoke, United Kingdom) with the addition of one of tetracycline, erythromycin, or trimethoprim, at 35°C. An overnight culture of the microorganisms was harvested by centrifugation at 3,000 rpm for 10 min. The harvested bacteria were washed three times and then resuspended into 50 mL sterile phosphate-buffered saline (PBS) in a 50-mL Falcon tube. Bacteria stock solution was prepared daily and stored at 4°C.
UV exposures were carried out using a low-pressure (monochromatic, 254 nm) UV collimated beam. Standard methods for UV dose measurement and calculations for collimated beam experiments were followed (Bolton and Linden, 2003). A radiometer (model ILT1700; International Light, Peabody, MA) was used to measure the UV intensity across the exposure surface and a UV spectrophotometer accounted for the UV absorbance at 254 nm of the samples. The UV irradiance at the center of water samples was 0.09 mW/cm2; a separate set of exposures at a higher UV irradiance (0.2 mW/cm2) was also conducted for comparison without any significant difference in the results observed (data not shown). The UV lamp was warmed up for at least 15 min before conducting any exposures.
The microbial solution was added into 100 mL sterile pH 7.2 PBS solution to obtain a microbial density of 107 colony forming unit/mL. The solutions were contained in 6.5-cm-diameter Pyrex® beakers and the depth of the samples was 3 cm. Samples were exposed to UV doses of 20, 50, 100, and 200 mJ/cm2, to cover the range of typical UV doses applied in water and wastewater disinfection. During UV exposure, samples were stirred by a magnetic flea at room temperature: (20 ± 2°C).
DNA isolation was performed using a PowerWater® DNA Isolation Kit (MoBio Company, San Diego, CA). Each 100 mL sample was filtered through a 0.45-μm pore-sized sterile membrane filter (Pall Corporation, New York), followed by DNA isolation according to the manufacturer's recommendations. DNA quantity and quality were measured using a UV spectrophotometer at wavelengths of 260 and 280 nm.
Quantitative PCR analysis was used to quantify four antibiotic genes, namely tet-A, sul1, bla-TEM1, and mph(A). All samples were run in triplicate in a 96-well plate in a PikoReal time PCR system (Thermo Fisher, Waltham, MA) and analyzed using Thermo Scientific PikoReal software version 2.2 (Thermo Fisher). Standard curves were prepared from serial dilutions of the plasmid serving as the positive control for the resistance gene. Dilution series were prepared as recommended by the Applied Biosystems tutorial “Creating Standard Curves with Genomic DNA or Plasmid DNA for use in Quantitative PCR” (2003) (Thermo Fisher). Reactions were run in a volume of 20 μL using Dynamo Flash SYBR green master mix (Thermo Fisher). Each 20 μL volume consisted of 10 μL 2× master mix, 10 mM forward and reverse primer, 2 μL of DNA template, 0.4 μL ROX™ passive reference dye, and sterile RNAse/DNAse-free water. Table 1 summarizes the primers and reaction conditions during the PCR analyses.
FW, forward primer; RV, reverse primer.
Degree of reduction of specific genes was quantified as surviving fraction (N/N0) with N0 indicating the copy number of the gene before UV disinfection and N indicating the copy number of the gene after UV disinfection. Statistical analysis was performed using SPSS version 24, with the means and standard errors displayed in the presented figures.
Results
Table 2 summarizes the gene sizes and the number of potential dimers that could theoretically be formed within the template strand of the studied genes. The mph(A) gene contains the lowest number of thymine–thymine dimer sites, followed by sul1, bla-TEM1, and tet-A. The potential dimer “YR” represents any pyrimidine (Y) that combines with a purine (R) from photodimerization.
Based on the genomic model and data from McKinney and Pruden (2012), the predicted UV dose required for 90% destruction (D90) of the bla-TEM1 gene is 20.7 mJ/cm2, the lowest among the studied genes, while the D90 value for the mph(A) gene is predicted to be 91.4 mJ/cm2, the highest among the studied genes (Table 3). These predicted doses apply to extracellular (EXC) DNA, whereas it will be seen that the intracellular (INT) DNA in this study requires higher doses for inactivation.
D90, 90% destruction; UV, ultraviolet.
Experimentally observed survival in the antibiotic resistance genes over the tested UV dose range is shown in Fig. 1. The mph(A) resistance gene is the most resistant to UV, with a survival ratio of 0.39 at 200 mJ/cm2, and 0.89 survival ratio achieved at 20 mJ/cm2; according to the potential dimer count in Table 2, the mph(A) gene also consists of the fewest pairs of thymines compared with the other studied antibiotic resistance genes. The second most UV resistant is sul1 gene, with a survival ratio of 0.9, 0.71, 0.4, and 0.2 at 20, 50, 100, and 200 mJ/cm2, respectively. Meanwhile, application of UV doses at 50, 100, and 200 mJ/cm2 gives tet-A reduction at 0.55, 0.47, and 0.13, respectively. In this study, tet-A has the longest gene size (1,275 base pairs), containing 121 TT pairs and 194 CT pairs. The modeling placed tet-A as the third most UV resistant, with a D90 value of 53.0 mJ/cm2.
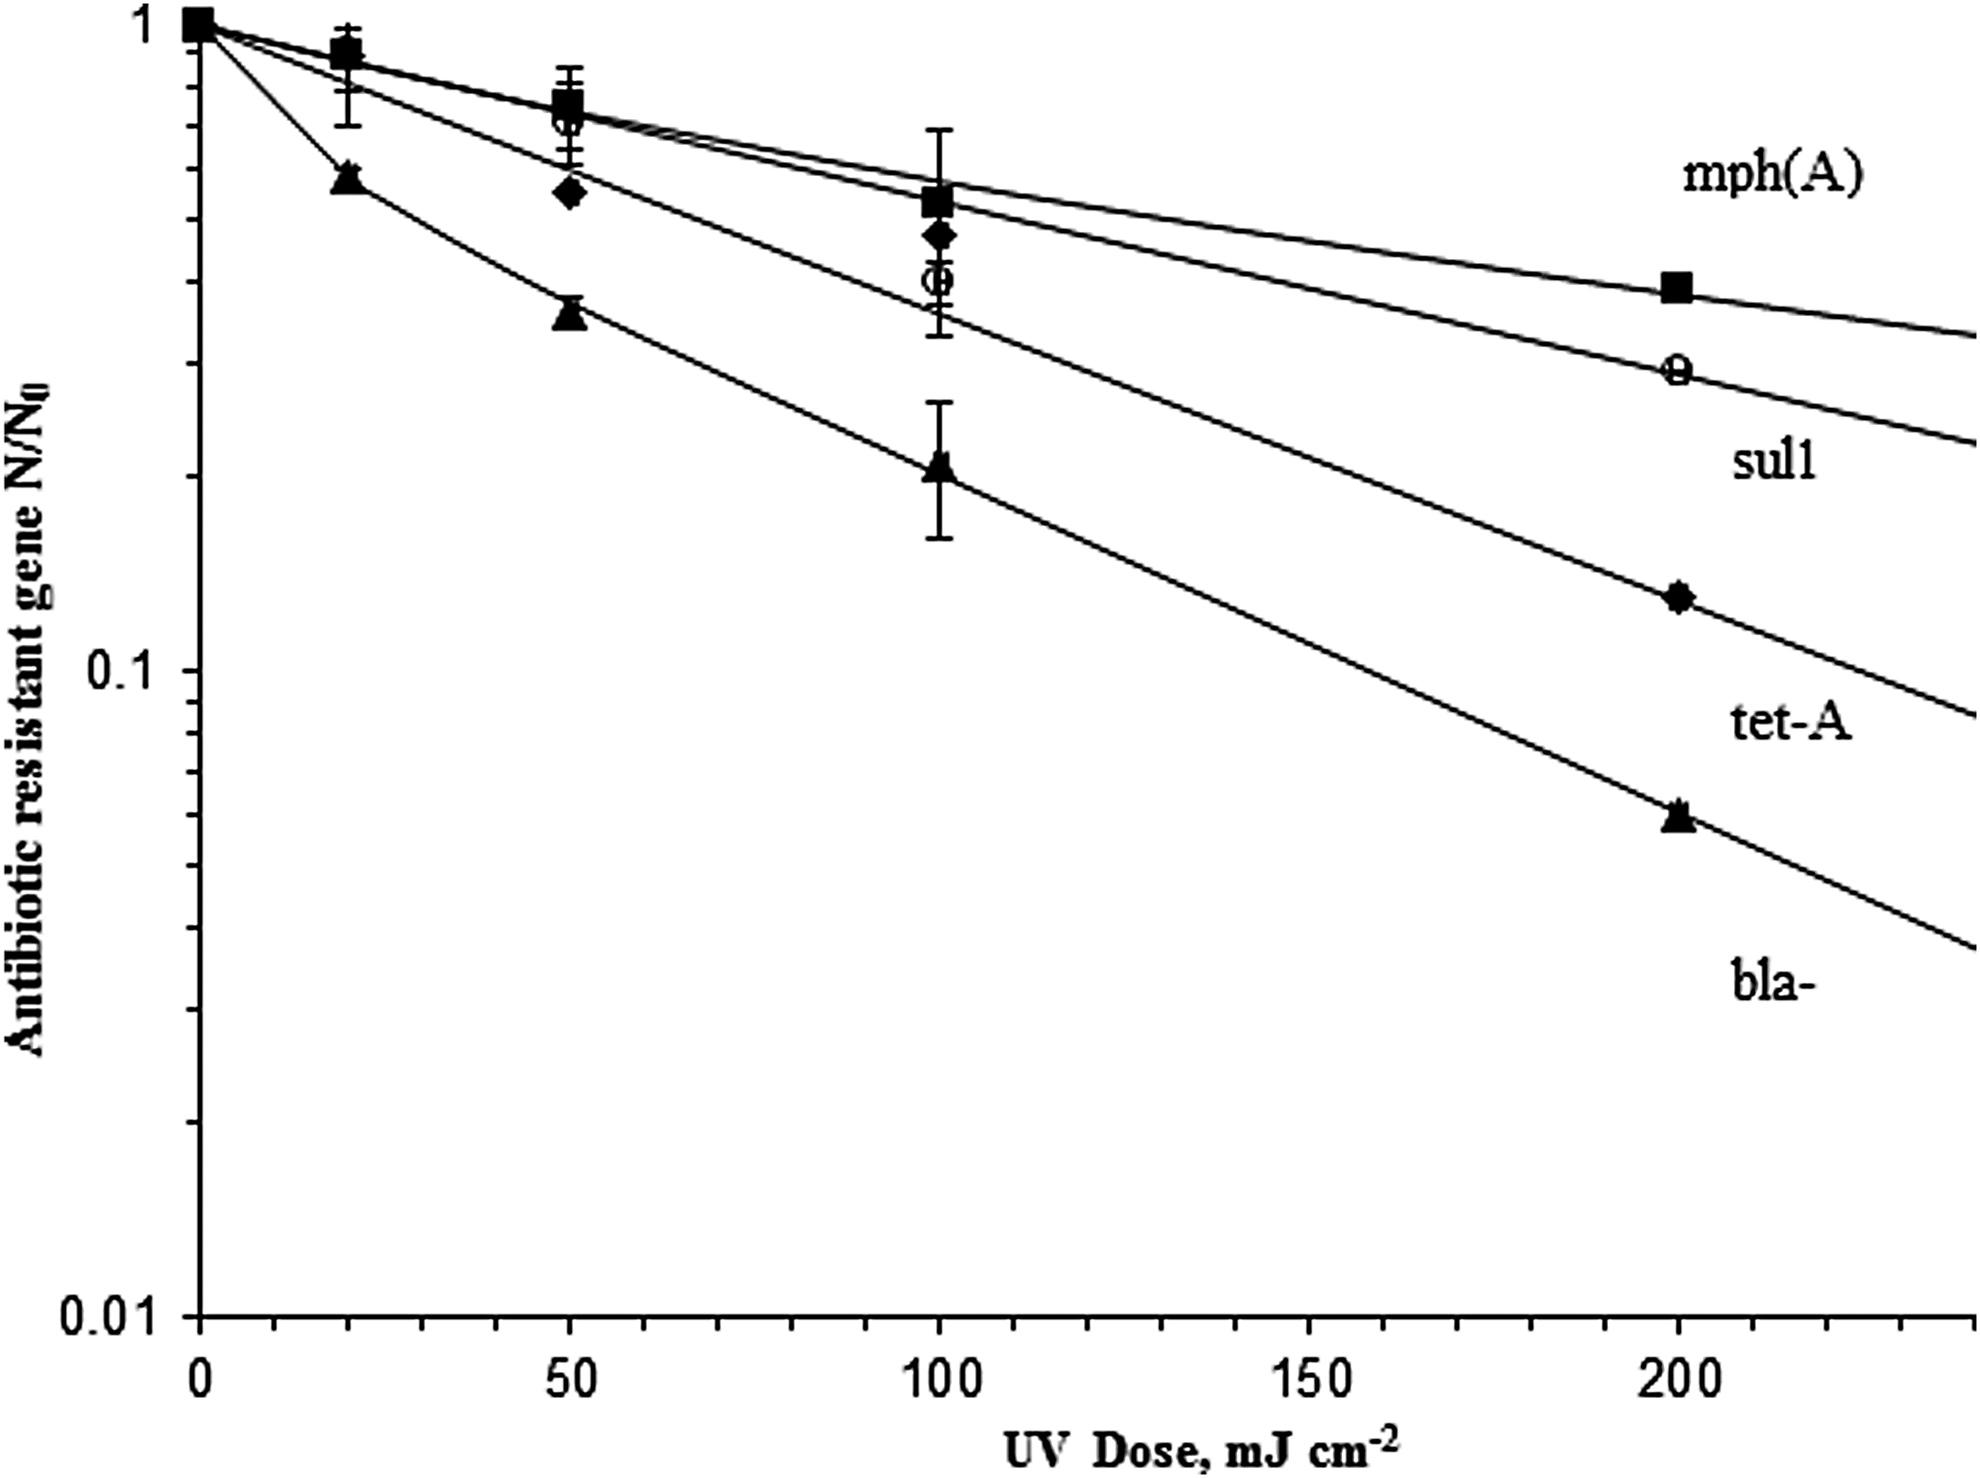
Gene survival curves fitted to a two-stage decay equation. Data points represent mean values and bars indicate standard deviation (n = 3).
The bla-TEM1 gene was the most susceptible to UV among the four studied genes, survival ratio of 0.58 at 20 mJ/cm2 and 0.06 survival ratio at 200 mJ/cm2 UV dose. bla-TEM1 gene is the smallest in size compared to others, and it consists of a higher number of potential dimers.
Data from Fig. 1 have been evaluated using a two-stage decay curve to accurately compute the D90 dose. The equations use a first-stage rate constant, kf, a second-stage (resistant) constant, ks, and the fraction f of the population that is resistant as follows:
where S = survival (i.e., nondestruction of the gene) and D = UV dose, mJ/cm2.
Table 4 summarizes the results of curve fitting the data to Equation (1) and gives the computed D90 values for EXC DNA, the predicted D90 values for INT DNA, and the ratio of these D90 values.
INT, intracellular; EXC, extracellular.
Discussion
UV light is mainly absorbed by the nucleobases containing DNA and RNA, and specifically by the thymine and cytosine bonds, allowing the structure to be opened (Dodd, 2012). The two major classes of UV mutagenic products are cyclobutane-pyrimidine dimer and 6-4 photoproducts (Sinha and Häder, 2002). Thymine dimers occur more commonly than cytosine dimers and both of these are more frequent than purine dimers. Douki and Cadet (2001) reported that TT and TC are the most photoreactive sequences, with CT and CC dimers occurring at a lower frequency. The frequency of occurrence and the total number of these potential dimers are the basis of genomic model predictions of UV sensitivity (Kowalski, 2009). The probability of photodimerization is also affected when clusters of pyrimidine dimers (i.e., “hot spots”) occur in the genome. Clustering can enhance the probability of photodimerization and a Cluster factor can be assigned to each cluster denoting the degree of enhanced photoreactivation (Kowalski, 2009).
Data indicate that four studied genes are far more UV resistant than the host microbe, E. coli, which has a well-established D90 in water of about 2.6 mJ/cm2 (Kowalski, 2009). A study conducted by McKinney and Pruden (2012) showed a higher destruction of resistance genes, particularly for tet-A gene, which showed a gene survival ratio of 0.11, 0.014, and 0.002 at 50, 100, and 200 mJ/cm2 UV doses, respectively.
Relative ranking of UV susceptibilities of the four genes used in this study was correctly predicted by genomic modeling. However, the predicted UV doses required to achieve 90% reduction based on EXC DNA are lower than the experimentally determined INT UV doses required for this level of reduction. This may be partly because the model does not consider the UV absorbance of the bacterial cytoplasmic membrane.
Summaries
This study has demonstrated that UV doses applied at the typical levels used in water and wastewater disinfection do not completely destroy antibiotic resistance genes in waterborne bacteria and that the relative UV susceptibility of these genes is related to their genomic content (pyrimidine and purine dimer formation potential). Genomic modeling may therefore be useful for predicting the relative UV susceptibility of antibiotic resistance genes.
Footnotes
Acknowledgment
The authors acknowledge the Indonesian Endowment Fund for Education (LPDP) for the PhD funding of the first author.
Author Disclosure Statement
No competing financial interests exist.