




Abstract
Abstract
A new biosorbent, obtained by chemical modification of lignocellulosic biomass with Al2O3, was tested for removal of anionic surfactant sodium dodecylbenzenesulfonate (DBS) from aqueous solution in batch conditions. As a basic lignocellulosic material for chemical modification by Al2O3 was used Lagenaria vulgaris shell (LVB). Biosorbent characterization was performed by Fourier transform infrared spectroscopy, scanning electron microscopy with energy dispersive X-ray spectroscopy, and X-ray diffraction analysis. Obtained matter showed significant improvement of removal efficiency compared with unmodified biomass. Effect of initial pH value, biosorbent dosage, and initial concentration of DBS on the sorption process was studied. Sorption of DBS onto LVB-Al2O3 was highly pH dependent. Complete DBS removal was attained at lower pHs; as pH increased up to 9, DBS removal rapidly decreased. Optimal sorbent dosage was 2 g/dm3. Sorption kinetics followed pseudosecond-order, intraparticle diffusion and Chrastil's models, suggesting that both surface reaction and diffusion were rate-limiting steps. Equilibria experimental results were best fit by Langmuir sorption isotherm models. Maximum sorption capacity of LVB-Al2O3 for DBS was found to be 513.28 mg/g. The present study suggests that the chemically modified L. vulgaris shell with Al2O3 could be used effectively for the removal of DBS from aqueous solution.
Introduction
S
Moreover, surfactants persist in biota for long time periods (Cserháti et al., 2002). When present above a certain concentration in water, surfactants reduce the quality of water, impart unpleasant taste and odor, cause foams in rivers and effluent treatment plants, and cause both short- and long-term changes in the ecosystem. By reducing the surface tension of water, surfactants allow easy in vivo penetration of aqueous solutions and thus affect aquatic life adversely. It has also been shown that surfactants can potentially act synergistically with other toxic chemicals present in natural waters (Lewis, 1991; Mösche and Meyer, 2002; Ying, 2006).
Among various processes adopted for surfactant removal, biosorption is a promising alternative technology, using inactive and dead biomasses as sorbents, with the advantages of low cost, availability in nature, greater profitability, and ease of operation. Biosorbents are inexhaustible, low-cost, and nonhazardous materials, which require easy processing. Different plant lignocellulose biomasses (orange peels, sugar cane bagasse, coconut shells, olive stones, olive tree prunings, cabbage waste, banana peels, and cashew bagasse) are commonly used as biosorbents for synthetic and real wastewater treatment, which are typically composed of cellulose, hemicellulose, and lignin (Abdolali et al., 2014; Bhatnagar et al., 2015; De Quadros Melo et al., 2016; Kumar et al., 2017).
Biomaterials can be chemically modified by inorganic materials, such as metal oxides, providing new, unique hybrid, or composite materials (Bakircioglu et al., 2010; Copello et al., 2011; Liu et al., 2011; Mahmoodi et al., 2011). Modifications of biosorbents by metal oxides may improve their sorption characteristics, mechanical properties, and ability to remove many organic pollutants, which could not be effectively removed from water with starting biomaterial.
In this article, to get a chemically modified biosorbent as a basic lignocellulosic material was used Lagenaria vulgaris shell. L. vulgaris is a large annual herb that can be grown worldwide. It is mostly composed of cellulose and lignin (Shah et al., 2010). L. vulgaris shell possesses a macroporous structure, very high mechanical stability under various biosorption treatment conditions, it does not swell in water, and its lignocellulosic structure offers the possibility of chemical modification (Stanković et al., 2013). In addition, it is easily available, environmentally friendly, inexpensive, and easy to grow and prepare.
Biosorbents based on L. vulgaris shell and biosorbents obtained by its modifications have been used predominantly for efficient removal of metal cations from water (Mitic-Stojanovic et al., 2011; Stanković et al., 2013; Kostić et al., 2014). In an attempt to improve L. vulgaris biosorbent to remove not only metal cations but also organic pollutants from water, a new biosorbent based on chemical modification by a small amount of Al2O3, was synthesized.
In this article, the synthesis, characterization, and application of a novel L. vulgaris-Al2O3 biosorbent for the removal of DBS from aqueous solution was studied. The effect of initial pH value, initial concentration of DBS, and biosorbent dosage on DBS removal was examined. Biosorbent characterization was performed by Fourier transform infrared spectroscopy (FTIR), scanning electron microscopy with energy dispersive X-ray spectroscopy (SEM-EDX), and X-ray diffraction (XRD). Four kinetic models (pseudofirst-order, pseudosecond-order, intraparticle diffusion, and Chrastil's model) were used to determine the kinetic parameters. The experimental results were fitted to the Langmuir, Freundlich, and Dubinin–Radushkevich isotherm models.
Materials and Methods
Sodium salt of DBS was purchased from Sigma-Aldrich, and Al(NO3)3 × 9H2O, HNO3 and NaOH were of reagent grade (Merck, Germany). All chemicals were used without further purification. All solutions were prepared with deionized water (18 MΩ). The main characteristics of DBS are shown in Table 1 in Supplementary Data.
Preparation of biosorbent
Experiments were performed using a shell of L. vulgaris, which was roughly crushed, washed with deionized water, and ground by laboratory mill. Biomass was acid treated (0.3 M HNO3) to remove bioaccumulated metals, then alkali treated (1 M NaOH) in the period of 60 min. Ten grams of obtained material was dispersed in 100 cm−3 of solution containing 1 g of Al(NO3)3 × 9H2O and the dispersion was stirred for 0.5 h at 25.0°C ± 0.5°C. After that the solution was evaporated. The obtained material was washed with deionized water, treated by trimethylamine, then washed with deionized water until neutral pH, and dried at 55°C ± 1°C for 5 h. This material was abbreviated as LVB- Al2O3.
Characterization of biosorbent
Content of Al in the biosorbent was determined using the inductively coupled plasma optical emission spectrometry (ICP-OES) model iCAP 6500 Duo (Thermo Scientific, United Kingdom) equipped with a CID86 chip detector. SEM was performed using the JEOL JSM −5300 equipped with EDS LINK QX 2000 ANALYTICAL. For SEM-EDX analysis, samples were attached to aluminum stubs using Leit-C carbon cement. A JEOL SEM in low-vacuum mode was used for imaging the samples with an Oxford Instruments X-MAX 50 cm3 detector for semiquantitative EDX analysis. Nominal magnifications of × 50, × 100, and × 200 were used when imaging the samples. Three random particles averaged for EDX analysis.
FTIR spectra were recorded by means of BOMEM MB-100 FTIR spectrometer (Hartmann & Braun, Canada) using KBr pellets containing 1.0 mg of the sample in 150 mg KBr. Instrument is equipped with a standard DTGS/KBr detector in the range of 4000–400 cm−1 with a resolution of 2 cm−1. Crystal structure was analyzed by XRD using filtered Cu Kα radiation (Ultima IV Rigaku). The experiments were performed in the scan range 2θ = 5–90° under 40 kV, 40 mA, with scan speed 5 degree/min and steps with 0.02 degree. Before measurement, the angular correction was done by high-quality Si standard. Lattice parameters were refined from the data using the least square procedure. Standard deviation was about 1%.
Suspension pH (pHsus) relates to the overall acidity or basicity of the adsorbent. In the present study, biosorbent samples (0.2 g) were suspended into 50 mL of deionized water and equilibrated for 24 h. The resulting pH was denoted as pHsus. The point of zero charge was determined by the pH drift method (Yang et al., 2004) with some modifications for LVB-Al2O3. The pH of test solutions was adjusted in the range between 2 and 10 using 0.01 M HNO3 and 0.01 M KOH. Biosorbent samples (0.2 g) were added to 50 mL of test solutions into stopped glass tubes and equilibrated for 24 h. The final pH (pHf) was measured after 24 h and plotted against the initial pH (pHi). The pH at which the curve crosses the line pHi = pHf was taken as pHpzc.
Oxygen acidic functional groups in LVB-Al2O3 were determined by potentiometric titration based on Boehm's method (Boehm, 1966; Goertzen et al., 2010). This method is based on the titration of functional groups with different acidity constants using base solutions of increasing strength (NaHCO3, Na2CO3, and NaOH). Solutions of bases were freshly prepared and stored in nitrogen atmosphere. First, each biosorbent was protonated with 0.01 M HCl and dried at 50°C. Then, protonated biosorbent (0.5 g) was suspended in 50 mL of 0.1 M NaNO3. To achieve equilibrium, the suspension was stirred on a magnetic stirrer for 1.5 h before titration. Increments of base (0.04–0.06 mL) were successively added. The next increment was added after reaching equilibrium. One hour before and during the titration, nitrogen gas was bubbled through the solution to avoid dissolution of carbon dioxide.
Batch sorption experiments
Working model solutions were prepared by the appropriate dilution of the stock solutions (1.0000 g/dm3). The pH of the solutions was adjusted with 0.1/0.01 mol/dm3 NaOH/HNO3 solutions pH metrically (SensIon5; HACH). All experiments were performed at 25.0°C ± 0.2°C. The aliquots of the solution were taken before the sorption started and after particular periods of time. DBS concentration was determined using the methylene blue active substances assay (MBAS assay) (George and White, 1999). MBAS assay is a photometric analysis test method that uses methylene blue to determine the presence of anionic surfactants. The limit of detection for this version of the method is ∼0.1 ppm (Eaton et al., 1998). The amount of adsorbed DBS qt (mg/g) was determined by using the following equation:
where c0 and ct are the initial and final DBS concentrations (mg/dm3), V is the solution volume (dm3), and m is the mass of the sorbent (g).
The removal efficiency (RE) of DBS by biosorbent was calculated using the following equation:
In all experiments, solution samples were taken in triplicate for the measurement of metal ion concentrations. Average values ± SD (error bars) are presented in all graphs and tables. All the kinetics and isotherm parameters were evaluated with the nonlinear regression method by means of Origin Pro 2016 software.
Results and Discussion
Material characterization
Physicochemical characteristics of LVB-Al2O3 biosorbent are shown in Table 1.
LVB-Al2O3, Lagenaria vulgaris-Al2O3 biosorbent.
SEM images of LVB and LVB-Al2O3 (Fig. 1) show a porous morphology of the biomaterial. The surface structure of the biomaterial before (Fig. 1a–c) and after incorporation of Al2O3 (Fig. 1d–f) is very similar, meaning that the modification process did not bring any significant change of morphological structure of the biomaterial surface. The surface of the LVB-Al2O3 biosorbent is smooth, with characteristic channels and macropores, like those of basic material LVB (Mitic-Stojanovic et al., 2011). The sample had particle sizes above 1 mm and consisted of cell-like structures of around 100 μm in size. These structures have holes of around 1 μm in a random position over the cell-like units. Visible Al2O3 layers, particles, and/or “islands” as the separate phase on the biomaterial surface were not detected. These indicated that Al2O3 was highly and homogeneously dispersed, without a change in the biomaterial structure.
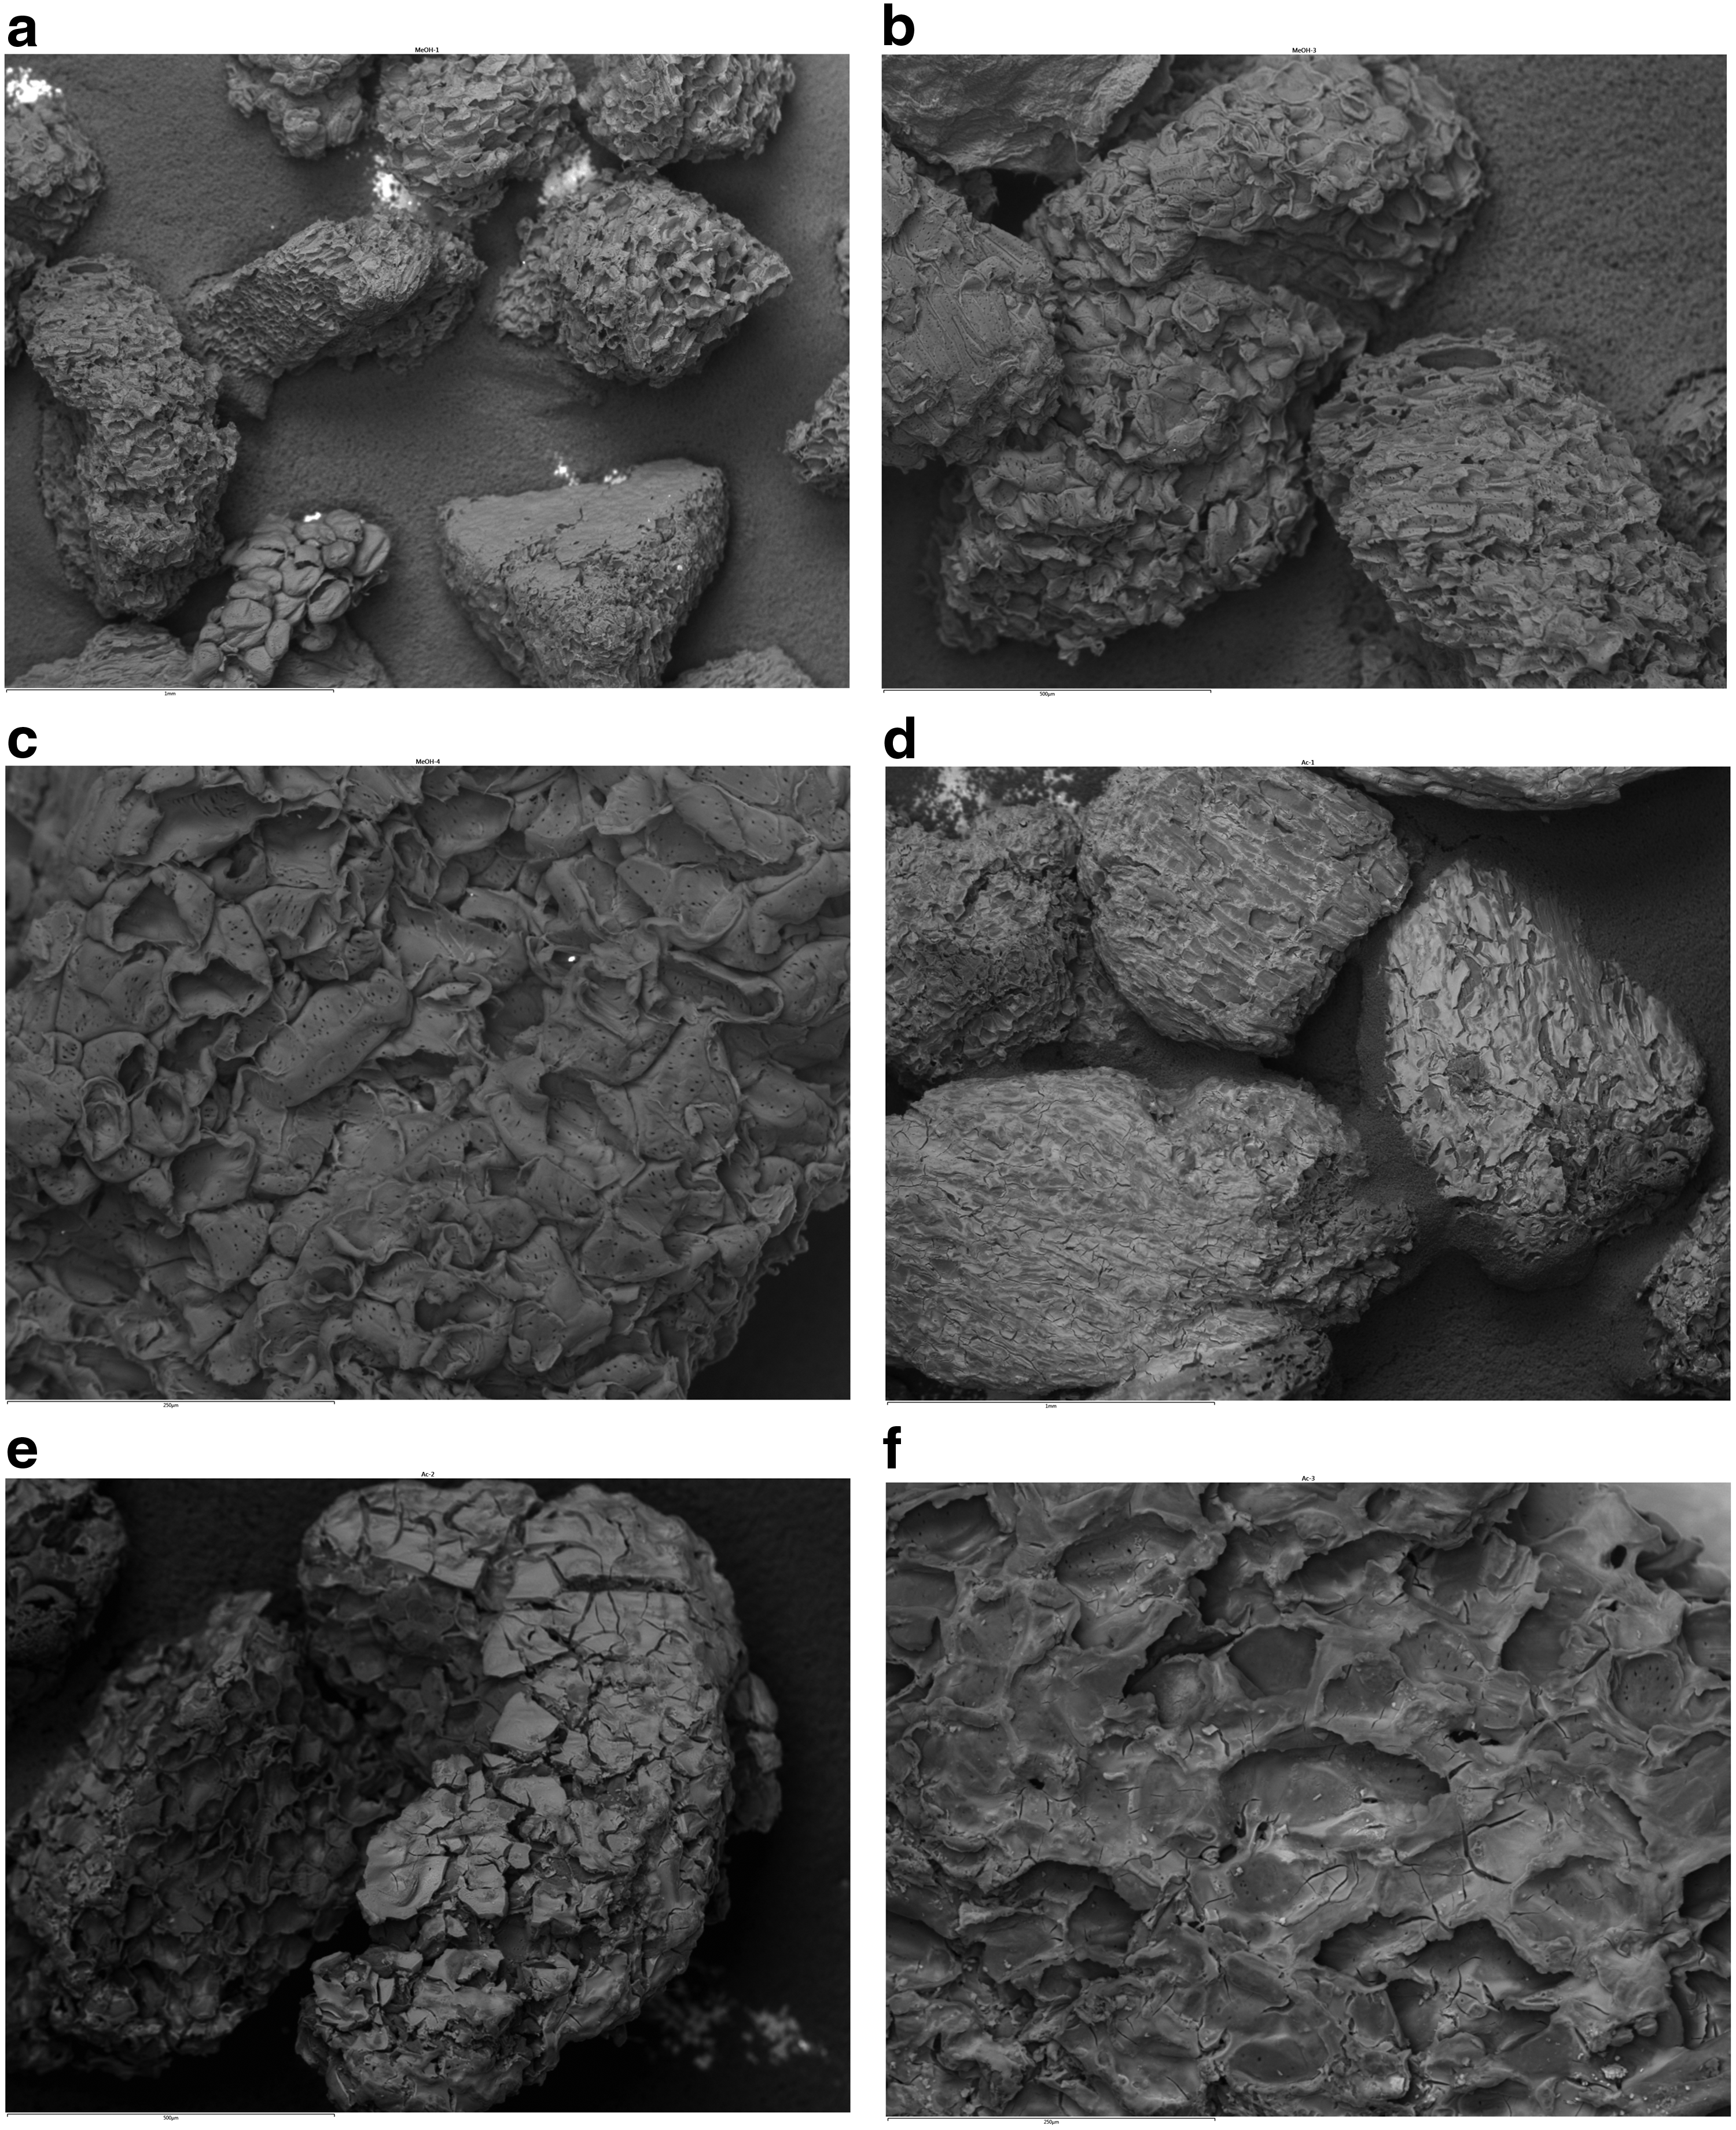
SEM images of unmodified biomass at a magnification of
EDX analysis (Fig. 2) shows the presence of carbon and oxygen in unmodified biomass (Fig. 2a) and carbon and oxygen with aluminum in LVB-Al2O3 biosorbent (Fig. 2b). Base on weight percentage quantification of samples, there is 57.38% of carbon and 42.62% of oxygen in biomaterial before modification and 29.63% of carbon, 52.87% of oxygen, and 17.50% of aluminum in LVB-Al2O3 biosorbent. The content of aluminum in the LVB-Al2O3 biosorbent is in agreement with the results obtained by the ICP-OES method (Table 1).
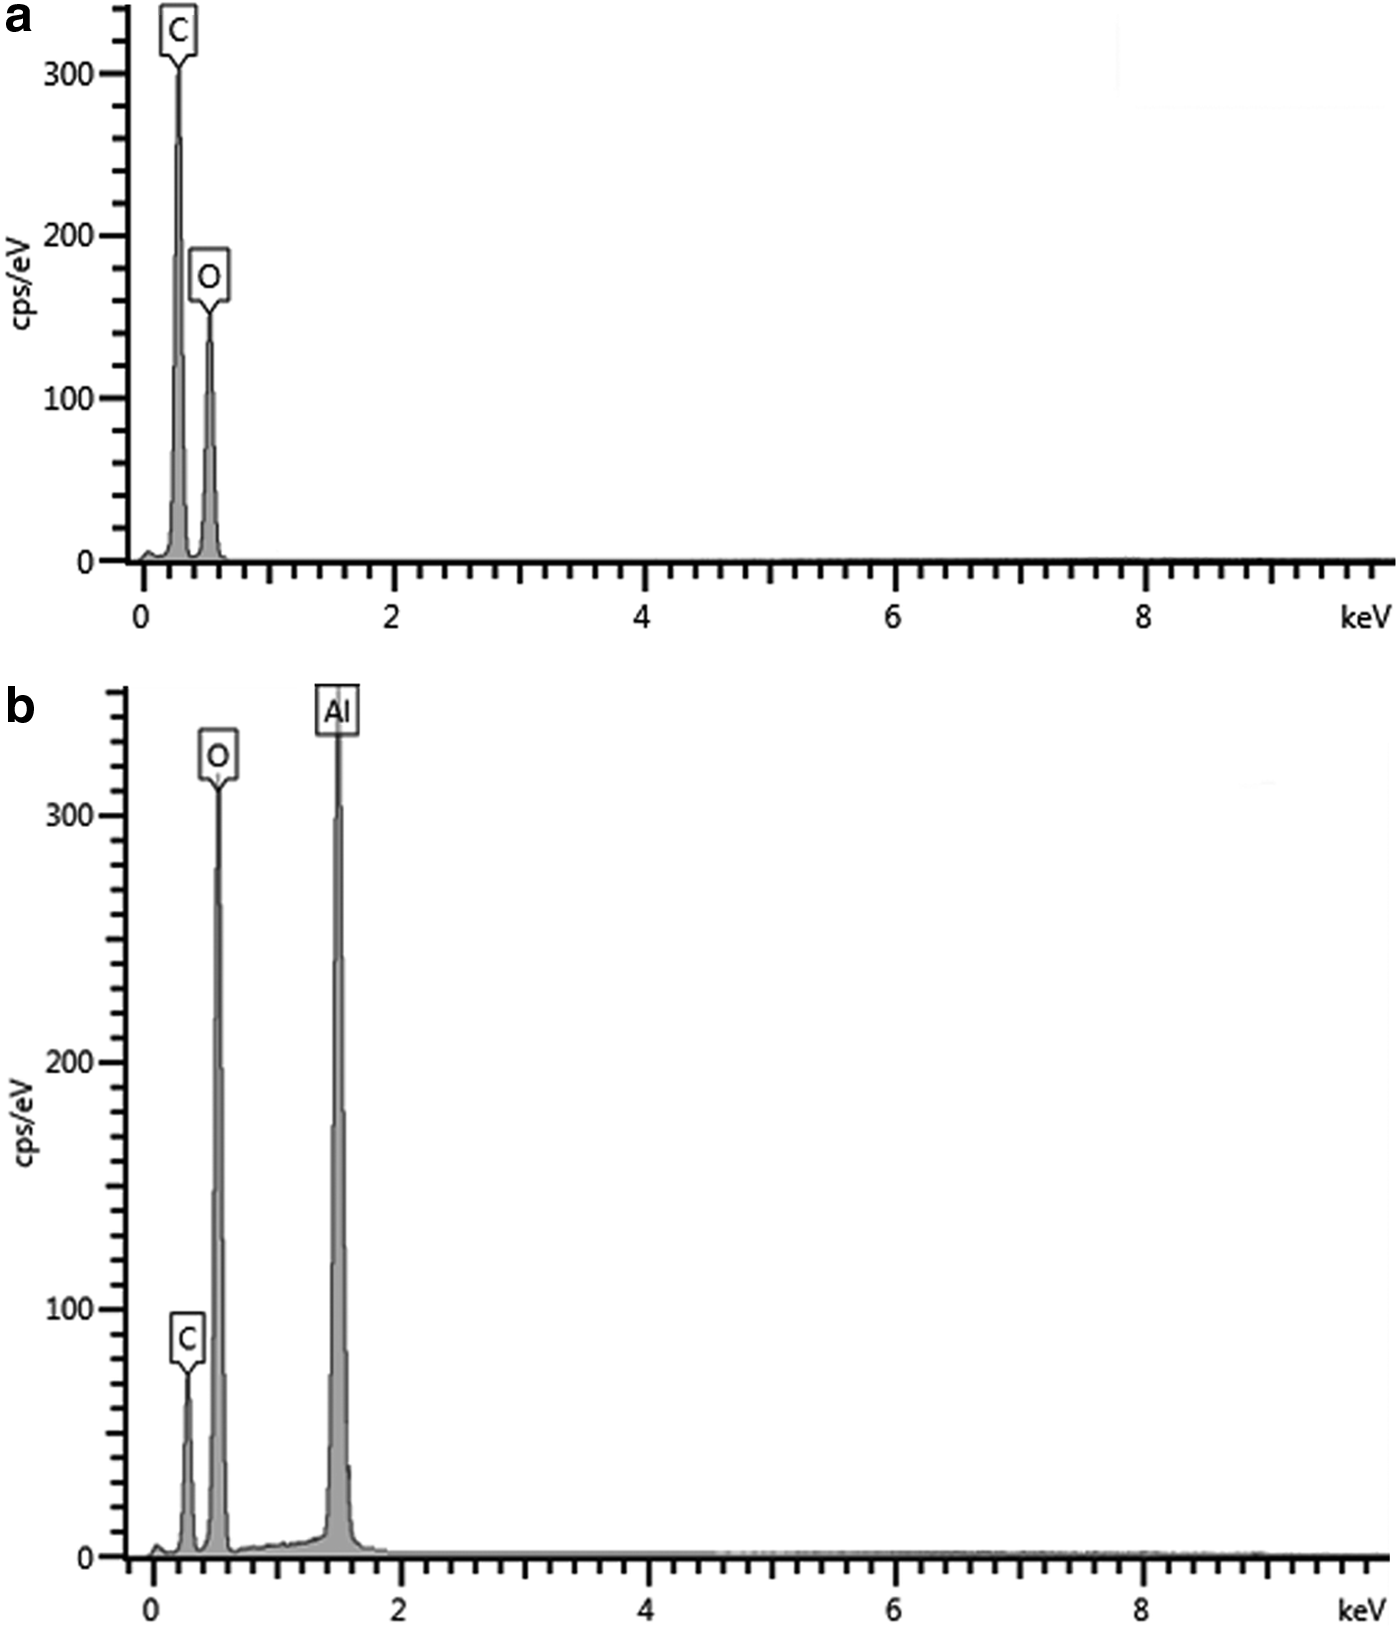
EDX spectrum of
FTIR spectrum of the chemically modified LVB is shown in Fig. 3. Modification of the LVB biomass by Al2O3 generated several changes in the IR region of 4,000–400 cm−1. First, there is a slight displacement of the band associated to the O-H deformation mode, from 1,635 to 1,641 cm−1. The increase in intensity of the band at around 1,458 cm−1 may be associated with the interaction or coordination between aluminum and carboxyl groups from components of lignocellulosic biomass (Benítez-Guerrero et al., 2014). It has been reported that the symmetrical COO- stretching vibrations corresponding to carboxylate bridges established with aluminum centers of different nature are located between 1,470 and 1,460 cm−1 (Landry et al., 1995; Van den Brand et al., 2004).

FTIR spectra of unmodified biomass and LVB-Al2O3. FTIR, Fourier transform infrared spectroscopy.
Second, changes attributed to the degradation and removal of some lignocellulosic components, as well as to the decomposition of carbohydrates during the reaction and alumina infiltration period in appropriate medium and under certain reaction conditions (pH, T). The band at 1,732 cm−1 that is observed in the spectrum of the untreated LVB is involved either to the acetyl and uronic ester groups of the hemicellulose or to the carboxylic group of the ferulic and p-coumaric acids of lignin and hemicellulose (Elanthikkal et al., 2010). Probably the clear peak represents the C O stretching vibration, which may originate from nonionic carboxyl groups (–COOH or –COOCH3), and may be assigned to carboxylic acids or corresponding esters presented in the hemicellulose or lignin. This peak is weak in the case of unmodified biomass spectrum and disappears in spectra of modified LVB, confirming the fact that carboxyl groups of lignin from unmodified biomass are mostly in ionic form due to hydrolysis of –COOR and ionization of –COOH, indicating a partial removal of lignin.
Moreover, in the FTIR spectra of modified LVB (Fig. 3), the absorption band from O-H stretching vibration moved to higher wave numbers, from 3,424 to 3,441 cm−1, indicating the broken inter- and intramolecular hydrogen bonds in cellulose. This finding indicates that the -OH groups can be involved in the sorption process. The OH groups of cellulose types can rotate and orient themselves to make interactions with adjacent groups of alumina. Furthermore, FTIR spectrum of modified LVB biosorbent showed that the peaks originating from C-O stretching vibration of cellulose expected at 1,052, 1,109, and 1,158 cm−1 were shifted to 1,056, 1,116, and 1,161 cm−1, respectively. This finding indicates that the hydroxyl groups were involved in aluminum interaction. These groups present in the biomass may act in deprotonated forms as key sites in coordination of metals.
When the lignocellulose biomass reacted with alumina, the FTIR spectrum of modified LVB showed a considerable decrease in the intensity of the band at 1,335 cm−1 originating from O–H in plane bending vibration, and the appearance of a new intensive band at 1,317 cm−1 typical for C–H wagging vibrations of the CH2 groups, confirming that alumina molecules are coupled to the surface of cellulose chains. In addition, distinct changes in the FTIR spectrum of the modified biosorbent are noted in the region 800–400 cm−1. The O–H out of plane bending vibrations in this area has a higher absorbance intensity ratio for higher substituted samples (El-Sakhawy, 2001). This area indicates a higher occupation of the alumina octahedral sites, corresponding to Al-O vibration. These sites have a higher coordination and their occupation will be favored by specified synthesis.
The XRD pattern of LVB-Al2O3 shows the peaks that are typical for lignocellulosic materials with amorphous regions (Fig. 1 in Supplementary Data). The XRD pattern of LVB-Al2O3 does not contain any characteristic peak of Al2O3, which appears in the XRD spectra of different crystalline alumina (Kumar et al., 1999). Obtained XRD results mean that Al2O3 does not exhibit its individual characteristics, even though its presence in the material was confirmed.
Results of the XRD analysis of LVB-Al2O3 are in accordance with the result obtained by SEM-EDX analysis, which did not detect Al2O3 as a separate phase on the biosorbent surface. It can be assumed that LVB-Al2O3 is a unique, highly amorphous lignocellulosic material, where Al2O3 is bound to a biomass. This fact, as well as its absorption bands presented in the FTIR spectrum of LVB-Al2O3, indicates that it is chemically bonded to the biomaterial functional groups creating new specific active centers.
The pH of LVB-Al2O3 biosorbent suspension in demineralized water (pHsus) was 5.93 probably due to the presence of surface acidic groups. The point of zero charge (pHpzc) of LVB-Al2O3 was 5.85, which means that at pH lower than 5.85, its surface is positively charged and at pH higher than 5.85, it is negatively charged. The pHpzc of not modified LVB was 6.10, meaning that the modification made the material a little more acidic (Mitic-Stojanovic et al., 2011).
Based on Boehm's analysis, the amount of acidic groups was calculated assuming that NaOH neutralizes carboxylic, phenolic, and lactonic groups; Na2CO3 neutralizes carboxylic and lactonic groups, while NaHCO3 neutralizes only carboxylic groups. The total content of acidic functional groups at LVB-Al2O3 surface, determined by titration with NaOH as a reagent, was calculated to be 0.2352 mmol/g. The content of carboxyl groups, as strongly acidic functional groups, was 0.2081 mmol/g. The concentrations of lactones and phenols determined for LVB were 0.0366 and 0.0096 mmol/g, respectively. Biosorbent LVB-Al2O3 has fewer amounts of acidic groups than LVB (Mitic-Stojanovic et al., 2011).
This indicated that chemical modification with Al2O3 decreases the contribution of oxygen functional groups in biosorbent, probably because they are replaced with new functional groups, creating a new specific active center for substrate binding. However, the remaining acidic functional groups on LVB-Al2O3 probably also participate in the binding mechanism for the sorption of DBS.
Effect of initial pH
Removal of DBS by LVB-Al2O3 is significantly affected by the pH value of the solution, thereby changing the surface charge of the sorbent and charge of sulfonic group in DBS molecules. The experiments were studied by varying initial pH value from 1.0 up to 9.0, while other parameters were kept constant (initial DBS concentration 40.0 mg/dm3, sorbent dose 2.0 g/dm3, temperature 25.0°C ± 0.2°C). Results show that an increase in the solution pH from 1 to 9 led to a decrease of RE of DBS (Fig. 4).
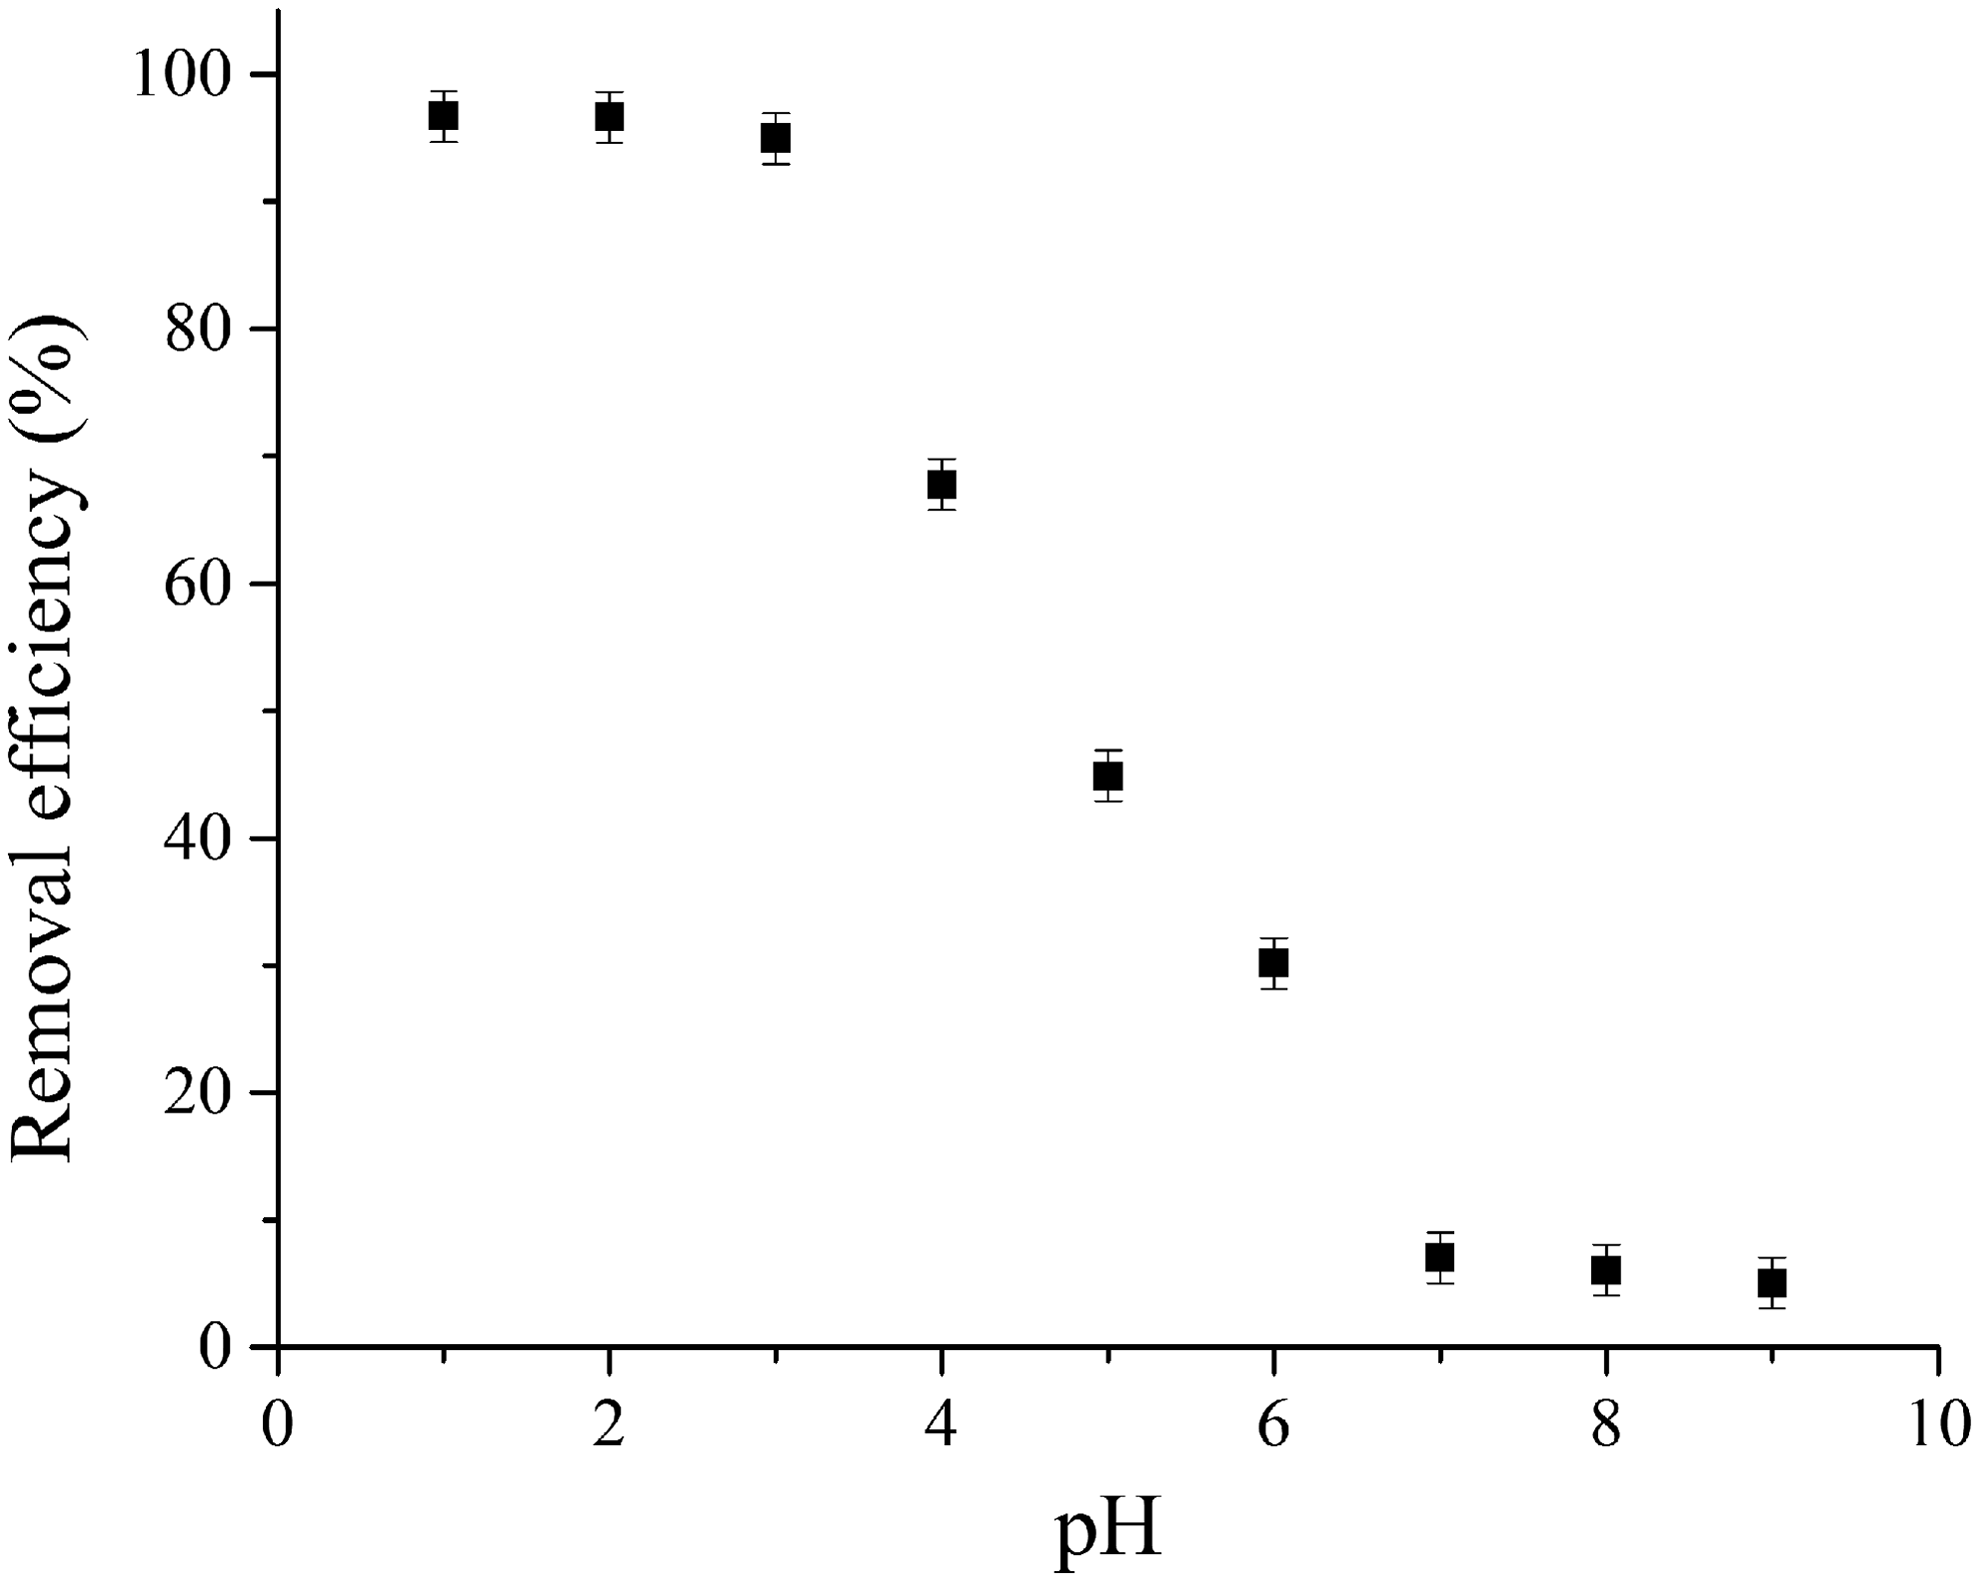
Effect of pH on DBS removal with LVB-Al2O3. Initial DBS concentration 40.0 mg/dm3, sorbent dose 2.0 g/dm3, and temperature 25.0°C ± 0.2°C. DBS, sodium dodecylbenzenesulfonate.
DBS has a sulfonic group, which is negatively charged even at lower pH, because its pKa value is lower than zero (Roberts and Caserio, 1977). The biosorbent surface has many different functional groups and its net charge is pH dependent, especially because of the presence of the –C–O–Al–(OH)2 group. At pH values lower than pHpzc, this group is protonated and the sorbent surface is positively charged. It can be assumed that the main binding mechanism is ionic exchange, based on the attraction between negatively charged sulfonic group of DBS and the positively charged sorbent surface.
With the increasing medium pH, the net positive charge of the surface decreases and the DBS uptake decreases as well. At pHs higher than pHpzc, the sorbent surface becomes negatively charged, the DBS binding rapidly decreases, reaching its minimum at pH 9, and remaining constant with further increase of pH (Guerrero-Coronilla et al., 2015; Albadarin et al., 2017). However, at higher pH values, the material has adsorbed a certain amount of DBS as well, indicating that ionic exchange is not the only sorption mechanism, although it is predominant. The effect of pH on the sorption of DBS on LVB-Al2O3 is similar to that reported in the literature for the sorption of DBS by sand sorbents (Khan and Zareen, 2006) and by metal oxide modified biomaterials (Copello et al., 2011; Mahmoodi et al., 2011).
Effect of sorbent dosage
Effect of sorbent dose on DBS RE was investigated at LVB-Al2O3 doses ranging from 0.5 to 8.0 g/dm3. The results are presented in Fig. 5. RE of DBS increased quickly from 73.3% to 99.8% by an increase in the sorbent dose from 0.5 to 2 g/dm3, because of the increased active surface area of the biosorbent and the number of available binding sites for DBS. Further increasing of the sorbent dose to 4 g/dm3 slightly enhanced RE to 99.9%. RE was almost without change at the sorbent doses of 6.0 and 8.0 g/dm3.
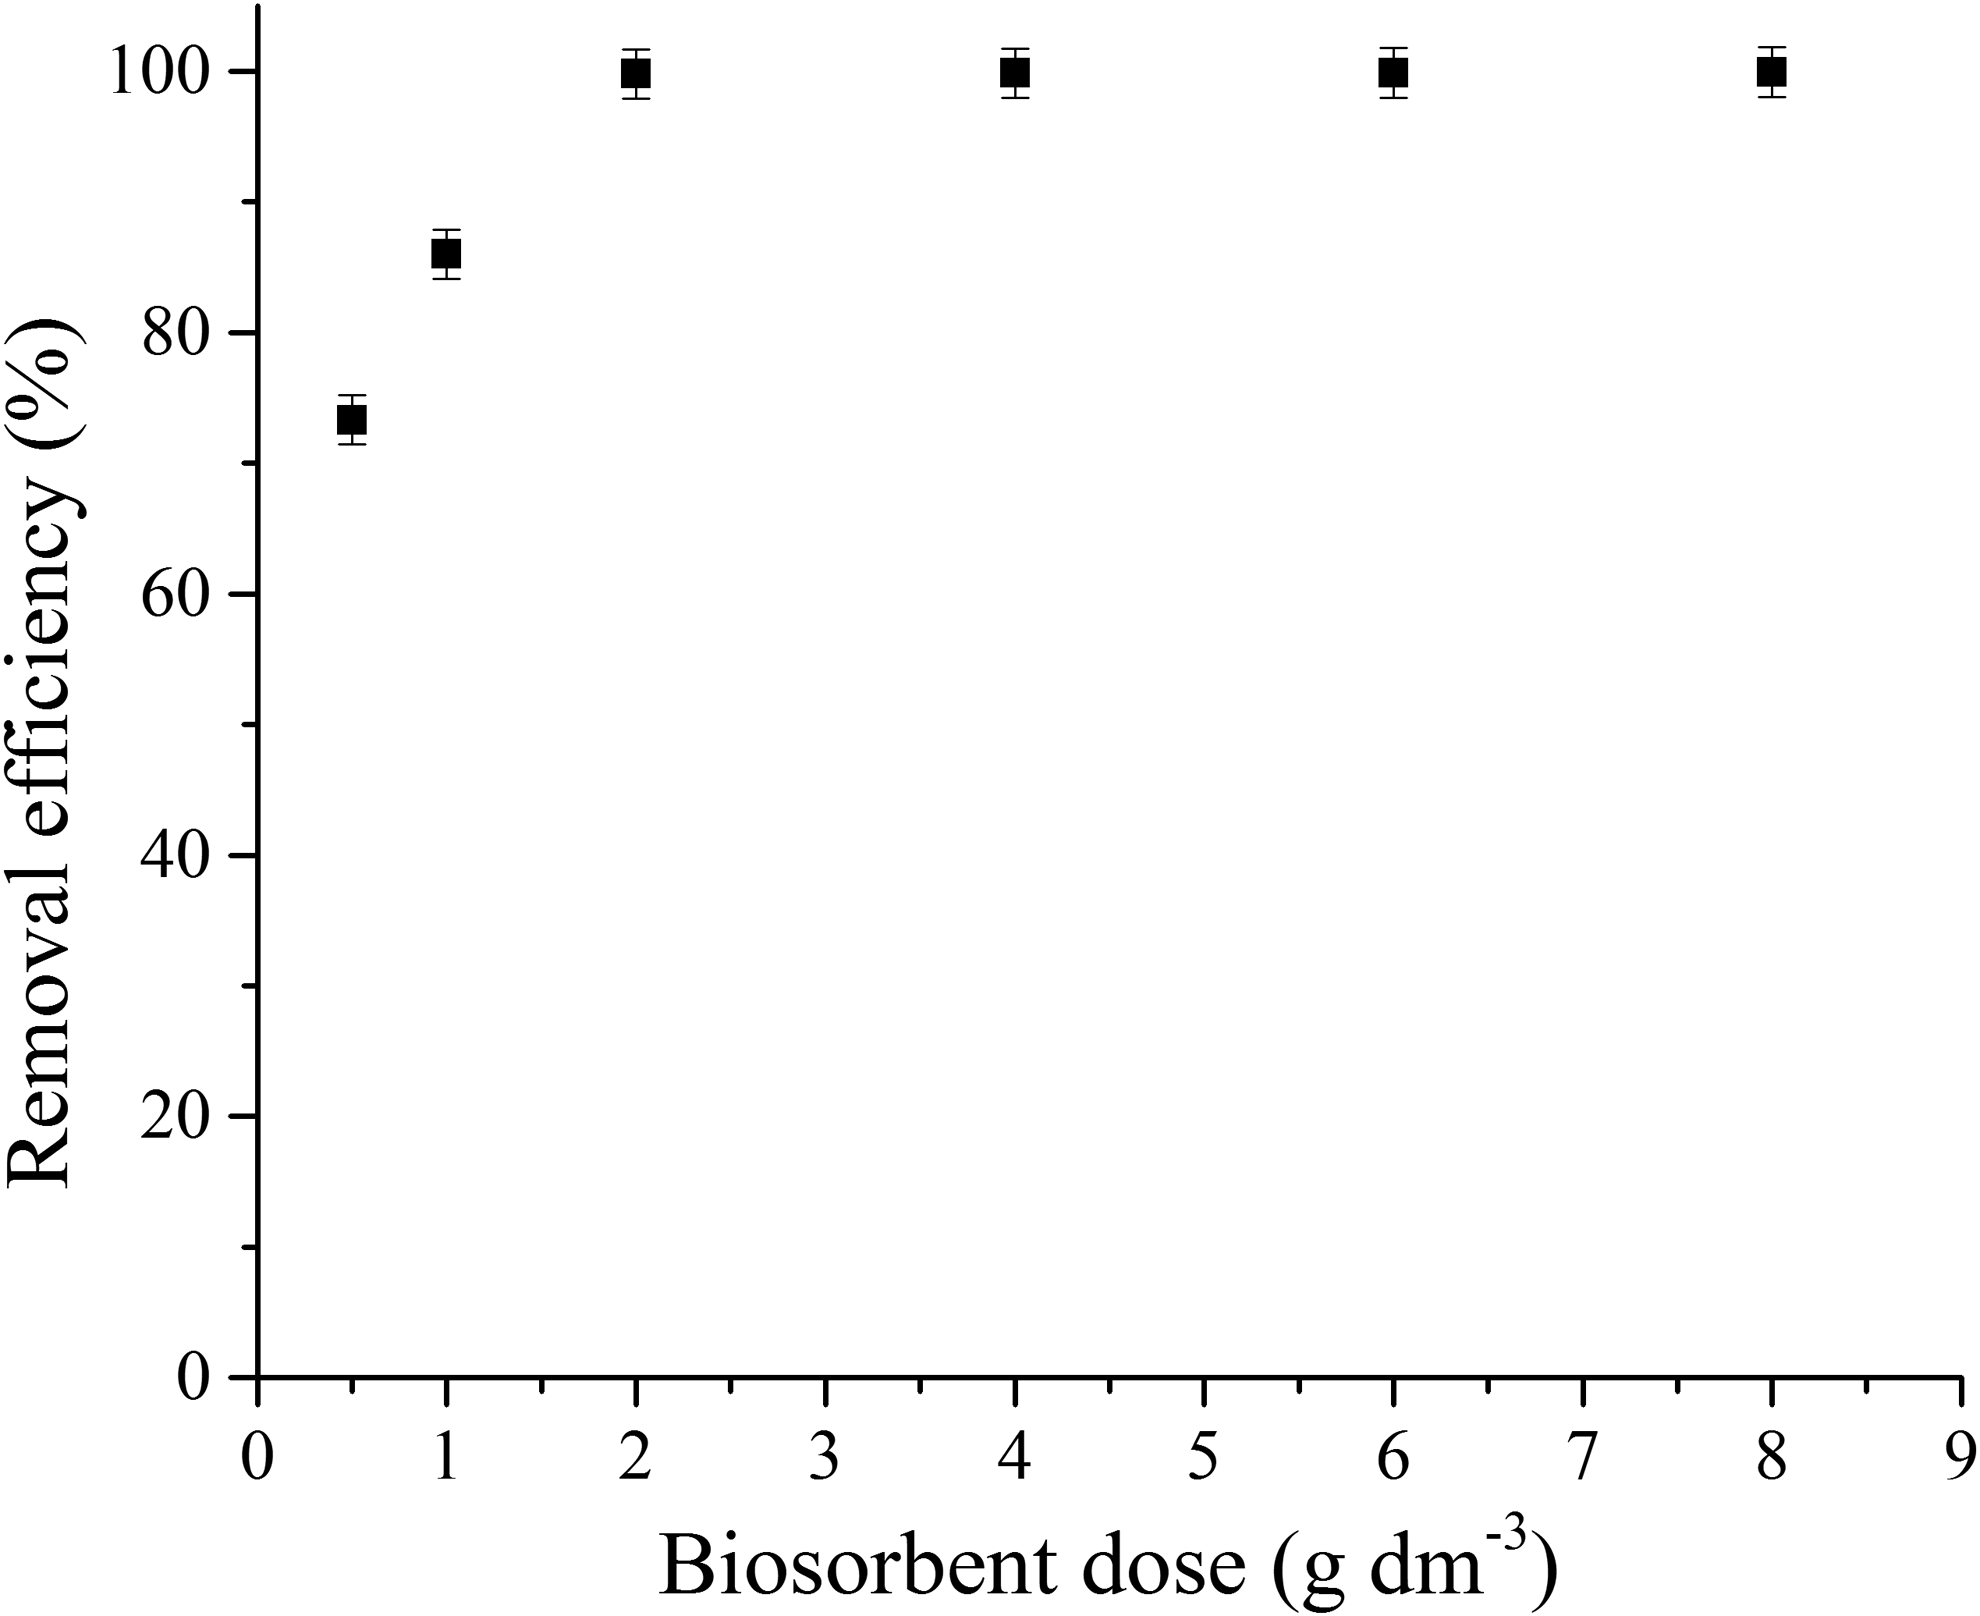
Effect of sorbent dose on DBS removal with LVB-Al2O3. Initial DBS concentration 40.0 mg/dm3, pH 2.0 ± 0.1, and temperature 25.0°C ± 0.2°C.
A negligible change of the RE at biosorbent dosage higher than 2.0 g/dm3 may be attributed to the presence of the excess of active centers for DBS binding on biosorbent surface, with regard to the amount of DBS molecules at applied initial concentration, suggesting that after a certain dose of sorbent, the maximum sorption is attained and the amount of DBS molecules bound to the sorbent and the amount of free DBS molecules remains constant even with further addition of the dose of sorbent. Therefore, value of 2.0 g/dm3 was considered as the optimal biosorbent dose of LVB-Al2O3 for DBS removal. A similar effect was reported by other authors (Beltrán-Heredia et al., 2012; Bozbas and Boz, 2016; Tural et al., 2017).
Effects of initial DBS concentration
Effects of initial DBS concentration on the RE were investigated at initial DBS concentrations ranging from 10 to 1,200 mg/dm3 with 2 g/dm3 biosorbent dosage (Fig. 6). For the initial DBS concentration of 10 and 20 mg/dm3, the RE was very high, 99.6 and 98.1%, respectively. At initial concentrations of 50 and 100 mg/dm3, the RE was still over 90%, but it slowly decreased. With a further increase of initial concentrations from 200 to 600 mg/dm3, RE exceeded 80%. Removal (%) sharply decreased to 61.88% for the initial DBS concentration of 800 mg/dm3, and to 56.44% for 1,000 mg/dm3 of the DBS. For initial concentrations of 1,200 mg/dm3, removal (%) was very low, 32.51%.

Effect of initial DBS concentration on the biosorption of DBS onto LVB-Al2O3. pH 2.0 ± 0.1, sorbent dose 2.0 g/dm3, and temperature 25.0°C ± 0.2°C.
In the case of lower investigated concentrations (10, 20, 50, 100 mg/dm3), the ratio of initial number of DBS to the available sorption sites is low and the biosorption becomes independent of initial concentration, which enabled the over 90% DBS uptake. At higher investigated concentrations (200, 300, 400, 600, 800, 1,000, 1,200 mg/dm3), a certain amount of DBS is left unabsorbed in the solution due to a saturation of the limited available binding sites in the biomass. In that case, the removal of DBS depends on its initial concentration (Beltrán-Heredia et al., 2012; Tural et al., 2017).
However, the biosorption capacity of DBS increases with increasing initial DBS concentration (Fig. 2 in Supplementary Data) and reaches 454.89 ± 6.82 mg/g with 1,200 mg/dm3 initial concentration of DBS and 2 g/dm3 dose of biosorbent. This can be attributed to the fact that the higher DBS concentrations increase the overall mass transfer driving force, and thus, the DBS uptakes onto the biosorbent (Liu et al., 2013)
Sorption kinetics
Kinetics of DBS sorption on LVB-Al2O3 can be described by the pseudofirst-order model, pseudosecond-order model, intraparticle diffusion kinetic model, and Chrastil's diffusion model.
Pseudofirst-order model
A pseudofirst-order kinetic model describes the rate of sorption, which is proportional to the number of unoccupied binding sites of the sorbent (Lagergren, 1898). It can be expressed in the following form:
Given the boundary conditions for t = 0, qt = 0; t = t, qt = qt, the equation can be integrated to give a nonlinear function:
where k1 (min−1) is the first-order rate constant, qt and qe (mg/g) are the amounts of DBS sorbed at time t and at equilibrium, respectively. Plot of qt versus t for different initial DBS concentrations is shown in Fig. 3 in Supplementary Data.
Pseudofirst-order rate constant k1 and the predicted qe values by nonlinear analysis are given in Table 2. As can be seen from the data presented in Table 2, the determination coefficients for the pseudofirst-order kinetics obtained by nonlinear analysis are relatively high for all studied initial DBS concentrations. Likewise, the determined values of qe calculated from the Lagergren's equation showed similarity with the experimental values, which indicated that pseudofirst-order kinetics can predict the sorption of DBS onto LVB-Al2O3.
DBS, sodium dodecylbenzenesulfonate.
Pseudosecond-order model
Pseudosecond-order kinetic model (Ho and McKay, 1998), based on equilibrium sorption, can be expressed as follows:
Integrating the previous equation for boundary conditions t = 0 to t = t and qt = 0 to qt = qt gives the following:
where k2 (g/[mg·min]) is the second-order rate constant, qe (mg/g) is the amount of sorbate sorbed at equilibrium, qt (mg/g) is the amount of sorbate sorbed at time t. Plot of qt versus t for different initial DBS concentrations is shown in Fig. 4 in Supplementary Data.
The values for the pseudosecond-order constant, k2, and the amount of DBS sorbed at equilibrium, qe, determined by nonlinear regression, for the sorption of different initial DBS concentrations, are listed in Table 2.
The experimental data showed that the pseudosecond-order model better fitted experimental data than the pseudofirst-order model, due to a higher determination coefficient obtained in all cases. The calculated qe values for DBS were also relatively close to the experimental qe values suggesting that the biosorption of DBS by LVB-Al2O3 approximately follows a pseudosecond-order reaction. With increasing initial DBS concentration from 10 up to 1,200 mg/g, the pseudosecond-order rate constant, k2, decreased from 0.104 to 0.00002 g/[mg·min]. At a lower initial DBS concentration, almost all binding sites were free, which resulted in high pseudosecond-order rate constant, while at a higher DBS concentration, saturation of sorption sites occurred and the value of k2 decreased.
Equilibrium sorption capacity, qe, calculated by nonlinear regression, increased almost linearly from 5.06 ± 0.07 mg/g up to 409.37 ± 6.14 mg/g with an increase in initial DBS concentration from 10 mg/dm3 to 800 mg/dm3, and slightly to 462.65 ± 6.94 mg/g, with a further increase in initial DBS concentration up to 1,200 mg/g. This can also be related to the saturation of binding sites on sorbent surface. Obtained results indicate that the pseudosecond-order model can be successfully used for the study of DBS sorption by LVB-Al2O3 and suggest that the mechanism may be presented as a surface reaction, through sharing or exchange of electrons between sorbent and sorbate (Pal et al., 2013; Lee et al., 2016).
Intraparticle diffusion model
Adsorbate transport from the solution phase to the surface of the adsorbent particles occurs in several steps: bulk diffusion, external (film) diffusion, intraparticle diffusion, and finally, sorption of the sorbate onto the sorbent surface. The overall sorption process may be controlled by either one or more steps.
The possibility of intraparticle diffusion was explored by using the intraparticle diffusion kinetics model (Weber Jr. and Morris, 1964), which can be represented by the following equation:
where C is the intercept, and kid is the intraparticle diffusion rate constant (mg/[g·min1/2]) determined from a plot qt versus t1/2. If this plot satisfies the linear relationship with the experimental data, then the intraparticle diffusion is a rate-controlling step; if the data exhibit multilinear plots, then some degree of boundary layer control might be present and two or more steps influence the sorption process. The values of C provide an idea about the thickness of the boundary layer: the larger the intercept, the greater the boundary layer effect (Mitic-Stojanovic et al., 2012).
Regression of qt versus t1/2 for the sorption of DBS onto LVB-Al2O3 is not linear, suggesting that the intraparticle diffusion is not the only rate-controlling step. The intraparticle diffusion model for all studied initial DBS concentrations showed multilinearity and three stages in sorption, except for initial DBS concentrations of 1,000 and 1,200 mg/dm3, where two stages in sorption were obtained. Plots of qt versus t1/2 for different initial DBS concentrations are shown in Fig. 5 in Supplementary Data. Similar results were shown in the studies of Cheung et al. (2007) and Allen et al. (1989), where authors fitted kinetic data by three linear lines with a different slope.
The first, sharper portion of the plot can be attributed to the diffusion of DBS through the solution to the external surface of the sorbent, or the boundary layer diffusion of solute molecules. It is a rate-limiting process at the beginning of the sorption. The second portion described the gradual sorption stage, where intraparticle diffusion was rate limiting. The third portion was attributed to the final equilibrium stage for which the intraparticle diffusion started to slow down due to the extremely low DBS concentration left in the solution.
It could be deduced that there were three processes that controlled the rate of molecules sorption but only one was rate limiting in any particular time range. The slope of the linear portion indicated the rate of the sorption. The lower slope corresponded to a slower sorption process. One could observe that the diffusion in the bulk phase to the exterior surface of adsorbent, which started at the onset of the process, was the fastest. The second portion of the plot seemed to refer to the diffusion into mesopores, and the third one, with the lowest slope, to sorption into micropores. This implies that the intraparticle diffusion of DBS molecules into micropores was the rate-limiting step in the sorption process on LVB-Al2O3, particularly over long contact time periods.
The value of rate constant for intraparticle diffusion kid1 and kid2 shown in Table 2 increases with increasing initial DBS concentration. Increasing the constant for intraparticle diffusion kid1 and kid2 indicates a greater driving force with increasing initial DBS concentration (bulk liquid concentration raises the driving force of DBS to transfer from the bulk solution onto and into the solid particle). Based on kid1 and kid2 values, it can be concluded that film diffusion is more efficient than intraparticle diffusion.
In addition, the C1 and C2 (thickness of the boundary layer) values varied like the kid values with the initial DBS concentration (Table 2) indicating film diffusion in the rate-limiting step. A larger C value corresponds to a greater boundary layer diffusion effect.
The intraparticle diffusion rate constant, ki3, was determined from the slope of the third portion of the plot, while increment represents constant C. The calculated intraparticle diffusion rate constants (Table 2) increased from 2.7 × 10⁻⁴ to 0.486 mg/[g·min1/2] with increasing initial DBS concentration from 10 to 800 mg/dm3, which can be related to faster diffusion, thus also biosorption, because a higher initial DBS concentration produces a stronger driving force for diffusion. In addition, constant C3, which is taken to be proportional to the extent of boundary layer thickness, increased from 4.97 to 358.77 by increasing initial DBS concentration, indicating decreases in the rate of the external mass transfer and hence increases in the rate of internal mass transfer.
The determination coefficients for the intraparticle diffusion model are slightly lower than those of the pseudosecond-order kinetic model.
Chrastil's diffusion model
Chrastil's diffusion model describes sorption kinetics in diffusion-controlled systems. The model can be expressed by the following equation (Chrastil, 1990):
where kC is a rate constant (dm3/[g·min]), which depends on diffusion coefficients and the sorption capacity of biosorbent, A0 is the dose of biosorbent (g/dm3), and n is a heterogeneous structural diffusion resistance constant, which can range from 0 to 1. Constant n is independent of the sorbate concentration, sorbent concentration A0, qe, and temperature (Chrastil, 1990; Mitic-Stojanovic et al., 2012). In systems with small diffusion resistance, parameter n approximates 1, while the more significant resistance parameter n assumes small values (<0.5). The plot of qt versus t for different initial DBS concentrations is shown in Fig. 6 in Supplementary Data.
Parameters of the model, qe, kC, and n, for the sorption of DBS at initial concentration from 10 up to 1,200 mg/dm3 were determined by a nonlinear regression analysis of experimental data according to Equation (8) and given in Table 2.
Obtained high determination coefficients, larger than 0.98 (Table 2), indicate a very good fit of experimental kinetic data with Chrastil's model, for all tested concentrations (10–1,200 mg/dm3). Applicability of this diffusion model also confirms similar values of the calculated qe with experimentally determined qe (Table 2). The results obtained for the diffusion resistance coefficient show values between 0.925 and 0.502 (Table 2) for initial DBS concentration from 10 up to 1,200 mg/dm3, indicating that the sorption process of DBS on LVB-Al2O3 is significantly limited by diffusion resistance.
Adsorption isotherm
Sorption isotherms represent the distribution of sorbate between the biosorbent and solution, when the system is at equilibrium. Isotherm studies provide information important for the optimization of the biosorption mechanism pathways, expression of the surface properties, capacities of biosorbents, and effective design of the biosorption systems. In this study, the experimental data were analyzed by using the following equilibrium models: Langmuir, Freundlich, and Dubinin–Radushkevich (D-R).
Langmuir isotherm model
The Langmuir model assumes that the uptake of adsorbate occurs on a homogeneous surface by monolayer adsorption without any interaction between adsorbed species (Langmuir, 1918; Ho and McKay, 2000). The nonlinear form of Langmuir isotherm can be presented by the following equation:
where qe is the amount of sorbate sorbed at equilibrium (mg/g), ce is the equilibrium concentration of the sorbate in solution (mg/dm3), qm is the maximum sorption capacity (mg/g), and KL is a Langmuir constant related to the energy of sorption, reflecting quantitatively the affinity between the sorbate and the sorbent. Maximum sorbate uptake qm and Langmuir constant KL can be deduced from experimental data by a nonlinear regression of the plot qe versus ce (Fig. 7 in Supplementary Data) and they are presented in Table 3.
The high value of determination coefficient suggests that the Langmuir isotherm provides a good model of the sorption DBS onto LVB-Al2O3. The monolayer maximum DBS uptake capacity, qm, estimated from Langmuir model is 513.28 ± 7.70 mg/g, and the experimental value is 454.89 ± 6.82 mg/g. The Langmuir isotherm model makes it possible to predict if a sorption system is favorable or unfavorable by calculating RL, a dimensionless constant referred to as the equilibrium parameter using the following equation:
where KL (dm3/mg) refers to the Langmuir constant and c0 is denoted as the initial sorbate concentration (mg/dm3). RL value indicates the sorption nature to be unfavorable (RL > 1), linear (RL = 1), favorable (0 < RL < 1), or irreversible (RL = 0).
Calculated values of RL for the initial DBS concentrations from 10 mg/dm3 up to 1,200 mg/dm3 spanned the range from 0.787 to 0.030, confirming the favorability of the present process. Although the sorption process is favorable over the entire studied initial concentration range, it is more favorable at higher initial DBS concentrations than at lower ones.
Freundlich isotherm model
The Freundlich empirical adsorption isotherm equation is based on adsorption on a heterogeneous surface. It is assumed that the stronger binding sites are occupied first and that the binding strength decreases with the increasing degree of site occupation (Freundlich, 1906). The nonlinear form of this isotherm can be presented by the following equation:
where qeq is the amount of sorbate sorbed at equilibrium (mg/g), ceq is the equilibrium concentration of sorbate in solution (mg/dm3), KF is Freundlich constant, related to the sorption capacity, and 1/n is Freundlich exponent, related to the intensity of sorption, varying with the heterogeneity of the sorbent surface. When 1/n = 1, free energy for all sorbate concentrations is constant; when 1/n < 1, sorbate is added with weaker and weaker free energies, and finally, when 1/n > 1, more sorbate presence in the sorbent enhances the free energies of further sorption (Schwarzenbach et al., 2003). The Freundlich isotherm for the sorption of DBS on LVB-Al2O3 is shown in Fig. 7 in Supplementary Data.
Experimental data for DBS sorption indicate favorable sorption, which is in accordance with determined n value of 2.76. However, the low determination coefficient value (R2 = 0.877) confirmed that the Freundlich model was not suitable for predicting sorption of DBS onto LVB-Al2O3 from aqueous solution (Aguayo-Villarreal et al., 2013).
D-R isotherm model
The D-R model is an empirical model developed for the sorption of subcritical vapors in micropore solids, where the sorption process follows a pore filling mechanism onto an energetically nonuniform surface (Dubinin and Radushkevich, 1947). So, the D-R isotherm is an analog of Langmuir type but it is more general because it does not assume a homogeneous surface or constant sorption potential. The D-R model is given by the following nonlinear equation:
where qDR (mg/g) is the Dubinin–Radushkevich model constant representing the theoretical monolayer saturation capacity, KDR (mol2/kJ2) is the constant of sorption energy related to mean sorption energy, and ɛ is the Polanyi potential defined as follows:
where R, T, and ce represent the gas constant (8.314 J/[mol·K]), absolute temperature (K), and sorbate equilibrium concentration (mg/dm3), respectively.
Values qDR, KDR, and E should be determined from the nonlinear plot of qe versus ce (Fig. 7 in Supplementary Data). The mean sorption energy, which may provide useful information with regard to whether or not sorption is subject to a chemical or physical process, can be calculated as follows:
The value of mean biosorption energy, which is in the range of 1–8 kJ/mol and 9–16 kJ/mol, suggested the physical sorption and chemical sorption or ion exchange, respectively. According to the calculated E value, which was 1285.70 J/mol, physical sorption can be involved in DBS sorption onto LVB-Al2O3. Considering determination coefficient value (R2 = 0.952), it can be concluded that the D-R model fits well with experimental data (Table 3).
Conclusion
A new material based on the chemical modification of L. vulgaris shell with Al2O3 was synthesized to improve ability of starting biomass to remove anionic organic pollutants, such as DBS. Modification of the biosorbent was confirmed by FTIR spectrum analysis. SEM micrographs showed that the chemical modification did not change the biomaterial morphological structure. The EDX analysis shows the presence of carbon and oxygen with aluminum. Based on weight percentage quantification of samples, there is 29.63% of carbon, 52.87% of oxygen, and 17.50% of aluminum in LVB-Al2O3 biosorbent. No separate crystalline Al2O3 phase was detected in LVB-Al2O3 by the XRD pattern, further indicating the chemical bond between Al2O3 and the biomaterial functional groups.
The obtained modified biosorbent showed significant sorption improvement in the removal of DBS compared with the starting biomass. The initial pH strongly affects the sorption of DBS onto LVB-Al2O3. Complete DBS removal was attained at lower pHs (1–3); as the pH increases up to 9, DBS removal rapidly decreases. It can be assumed that the main binding mechanism is ionic exchange, based on the attraction between the negatively charged sulfonic group of DBS and the positively charged sorbent surface. However, at higher pH values, the material has adsorbed a certain amount of DBS as well, indicating that ionic exchange is not the only sorption mechanism, even though it is predominant. The extent DBS removal is directly related to the concentration of LVB-Al2O3 in the suspension, with an optimal biosorbent dose of 2.0 g/dm3.
The sorption process followed the pseudosecond-order model, indicating that surface reaction is the rate-limiting step that controls the sorption. The sorption process can also be well described by the three-stage intraparticle and Chrastil's diffusion model, indicating that both reaction and diffusion processes can be involved in the biosorption of DBS onto LVB-Al2O3. The Langmuir isotherm model showed the best fit to experimental data in describing the sorption of DBS on biosorbent. The maximum sorption capacity was 513.28 mg DBS per g of LVB-Al2O3. In addition to the high RE, LVB-Al2O3 possesses other benefits, such as mechanical stability, ease of synthesis, cost-effectiveness, biocompatibility, and environmental friendliness, all of which make it a promising material for the removal of anionic pollutants from water.
Footnotes
Acknowledgment
This work was financed by the Serbian Ministry of Education, Science and Technological Development through Grant No. TR34008.
Author Disclosure Statement
No competing financial interests exist.
References
Supplementary Material
Please find the following supplemental material available below.
For Open Access articles published under a Creative Commons License, all supplemental material carries the same license as the article it is associated with.
For non-Open Access articles published, all supplemental material carries a non-exclusive license, and permission requests for re-use of supplemental material or any part of supplemental material shall be sent directly to the copyright owner as specified in the copyright notice associated with the article.
