
Abstract
Abstract
As efforts to address grand challenges in engineering move forward, one important challenge has been conspicuously absent—improving diversity in science, technology, engineering, and math fields. Previous research has shown that diverse teams perform better in a range of output measures and are better equipped to objectively and creatively evaluate problems. Here, we make the case for including diversity as a critical component of our ability to enable transformative solutions to the grand challenges in environmental engineering.
T
There are a number of motivations for improving diversity in our field: pursuing social and environmental justice; generating a talented workforce; increasing objectivity; and, enabling the creative and transformative solutions needed to address grand challenges. In 2006, underrepresented minority groups comprised 28.5% of our national population but only 9.1% of college-educated Americans in science and engineering occupations (National Academy of Sciences 2011). Previous research has shown that gender-, ethnically-, and racially-diverse groups perform better across a range of output measures related to profitability, innovation, and solving complex problems in the social sciences, business, healthcare, technology, and natural sciences (Herring, 2009; Hunt et al., 2014; Valantine and Collins, 2015). With a wider range of personal backgrounds and experiences, diverse teams are also better equipped to objectively evaluate work without introducing implicit (or unconscious) bias (Intemann, 2009). For similar reasons, ethnically diverse groups have also been shown to be more creative than homogeneous groups (McLeod et al., 1996). Switzer and Teodoro (2017) reported that Safe Drinking Water Act violations were higher in lower income communities with higher Hispanic and African American populations. We posit that the increased objectivity and creativity inherent in diverse teams can ensure environmental justice through increased collective understanding of complex systems of social inequality. Nevertheless, as Williams and Multhaup (2017) note, the “imagined rationality of engineering” continues to inhibit efforts aimed at improving diversity.
Previously, we reported on the population and demographics of U.S. environmental engineering students and faculty for the 2005–2013 period (Blaney et al., 2016). Since that time, three more years of data have become available through the American Society for Engineering Education (ASEE), Engineering Management Database System (ASEE, 2017). Using the same methods from our prior research, we have analyzed these new data to better understand gender, ethnicity, and racial demographics for environmental engineering students and faculty. Here, we mostly focused on comparison of the 2008, 2012, and 2016 demographics data for degrees and faculty. Over the 2008–2016 period, the number of BS, MS, and PhD degrees awarded increased 154%, 81%, and 43%, respectively. In fact, students earned ∼1,200 BS, 1,000 MS, and 200 PhD degrees in environmental engineering in 2016.
The 2016 race and ethnicity demographics for students earning degrees in environmental engineering are shown in Fig. 1. Approximately 65.7% of BS degrees were awarded to Caucasians, followed by Hispanic Americans (10.1%), Asian Americans (7.8%), African Americans (2.6%), and Native Americans (0.6%). U.S. census data indicate that African Americans, Asian Americans, Caucasians (not of Hispanic or Latino origin), Hispanic Americans or Latinos, and Native Americans made up 13.3%, 5.7%, 61.3%, 17.8%, and 1.3%, respectively, of the U.S. population in 2016. As such, African Americans, Hispanic Americans, and Native Americans are underrepresented in environmental engineering. With changing national demographics (Colby and Ortman, 2015), it is important to actively address diversity now to prevent increased underrepresentation of select racial and ethnic groups in the coming decades.

(top) Race and ethnicity demographics for students being awarded BS, MS, and PhD degrees in environmental engineering and (bottom) diversity of assistant, associate, and full professors associated with environmental engineering programs. Note that the legend (top-to-bottom) proceeds in a clockwise pattern from the top of the pie charts. For the sake of clarity, demographic groups with 0.0% are not labeled. All data were retrieved for the year 2016 from the American Society for Engineering Education, Engineering Management Database System.
No clear gains have been made with respect to the percentage of BS, MS, or PhD degrees awarded to underrepresented minorities since 2008 (Fig. 2). Although the percentage of PhDs granted to African Americans was 8.7% in 2016, it varied from 0% to 4.8% for the previous 15 years. Based on PhD enrollments, which averaged 4.6% African American for the 2013–2016 period, the apparent increase in PhDs awarded to African American students for 2016 is likely an artifact. Hispanic Americans account for 11.1% (2013–2016 average) of PhD enrollments. The demographic deficits in PhD enrollments (i.e., U.S. demographics minus PhD student demographics) for African Americans and Hispanic Americans were 8.7% and 6.7%, respectively, for this 4-year period.
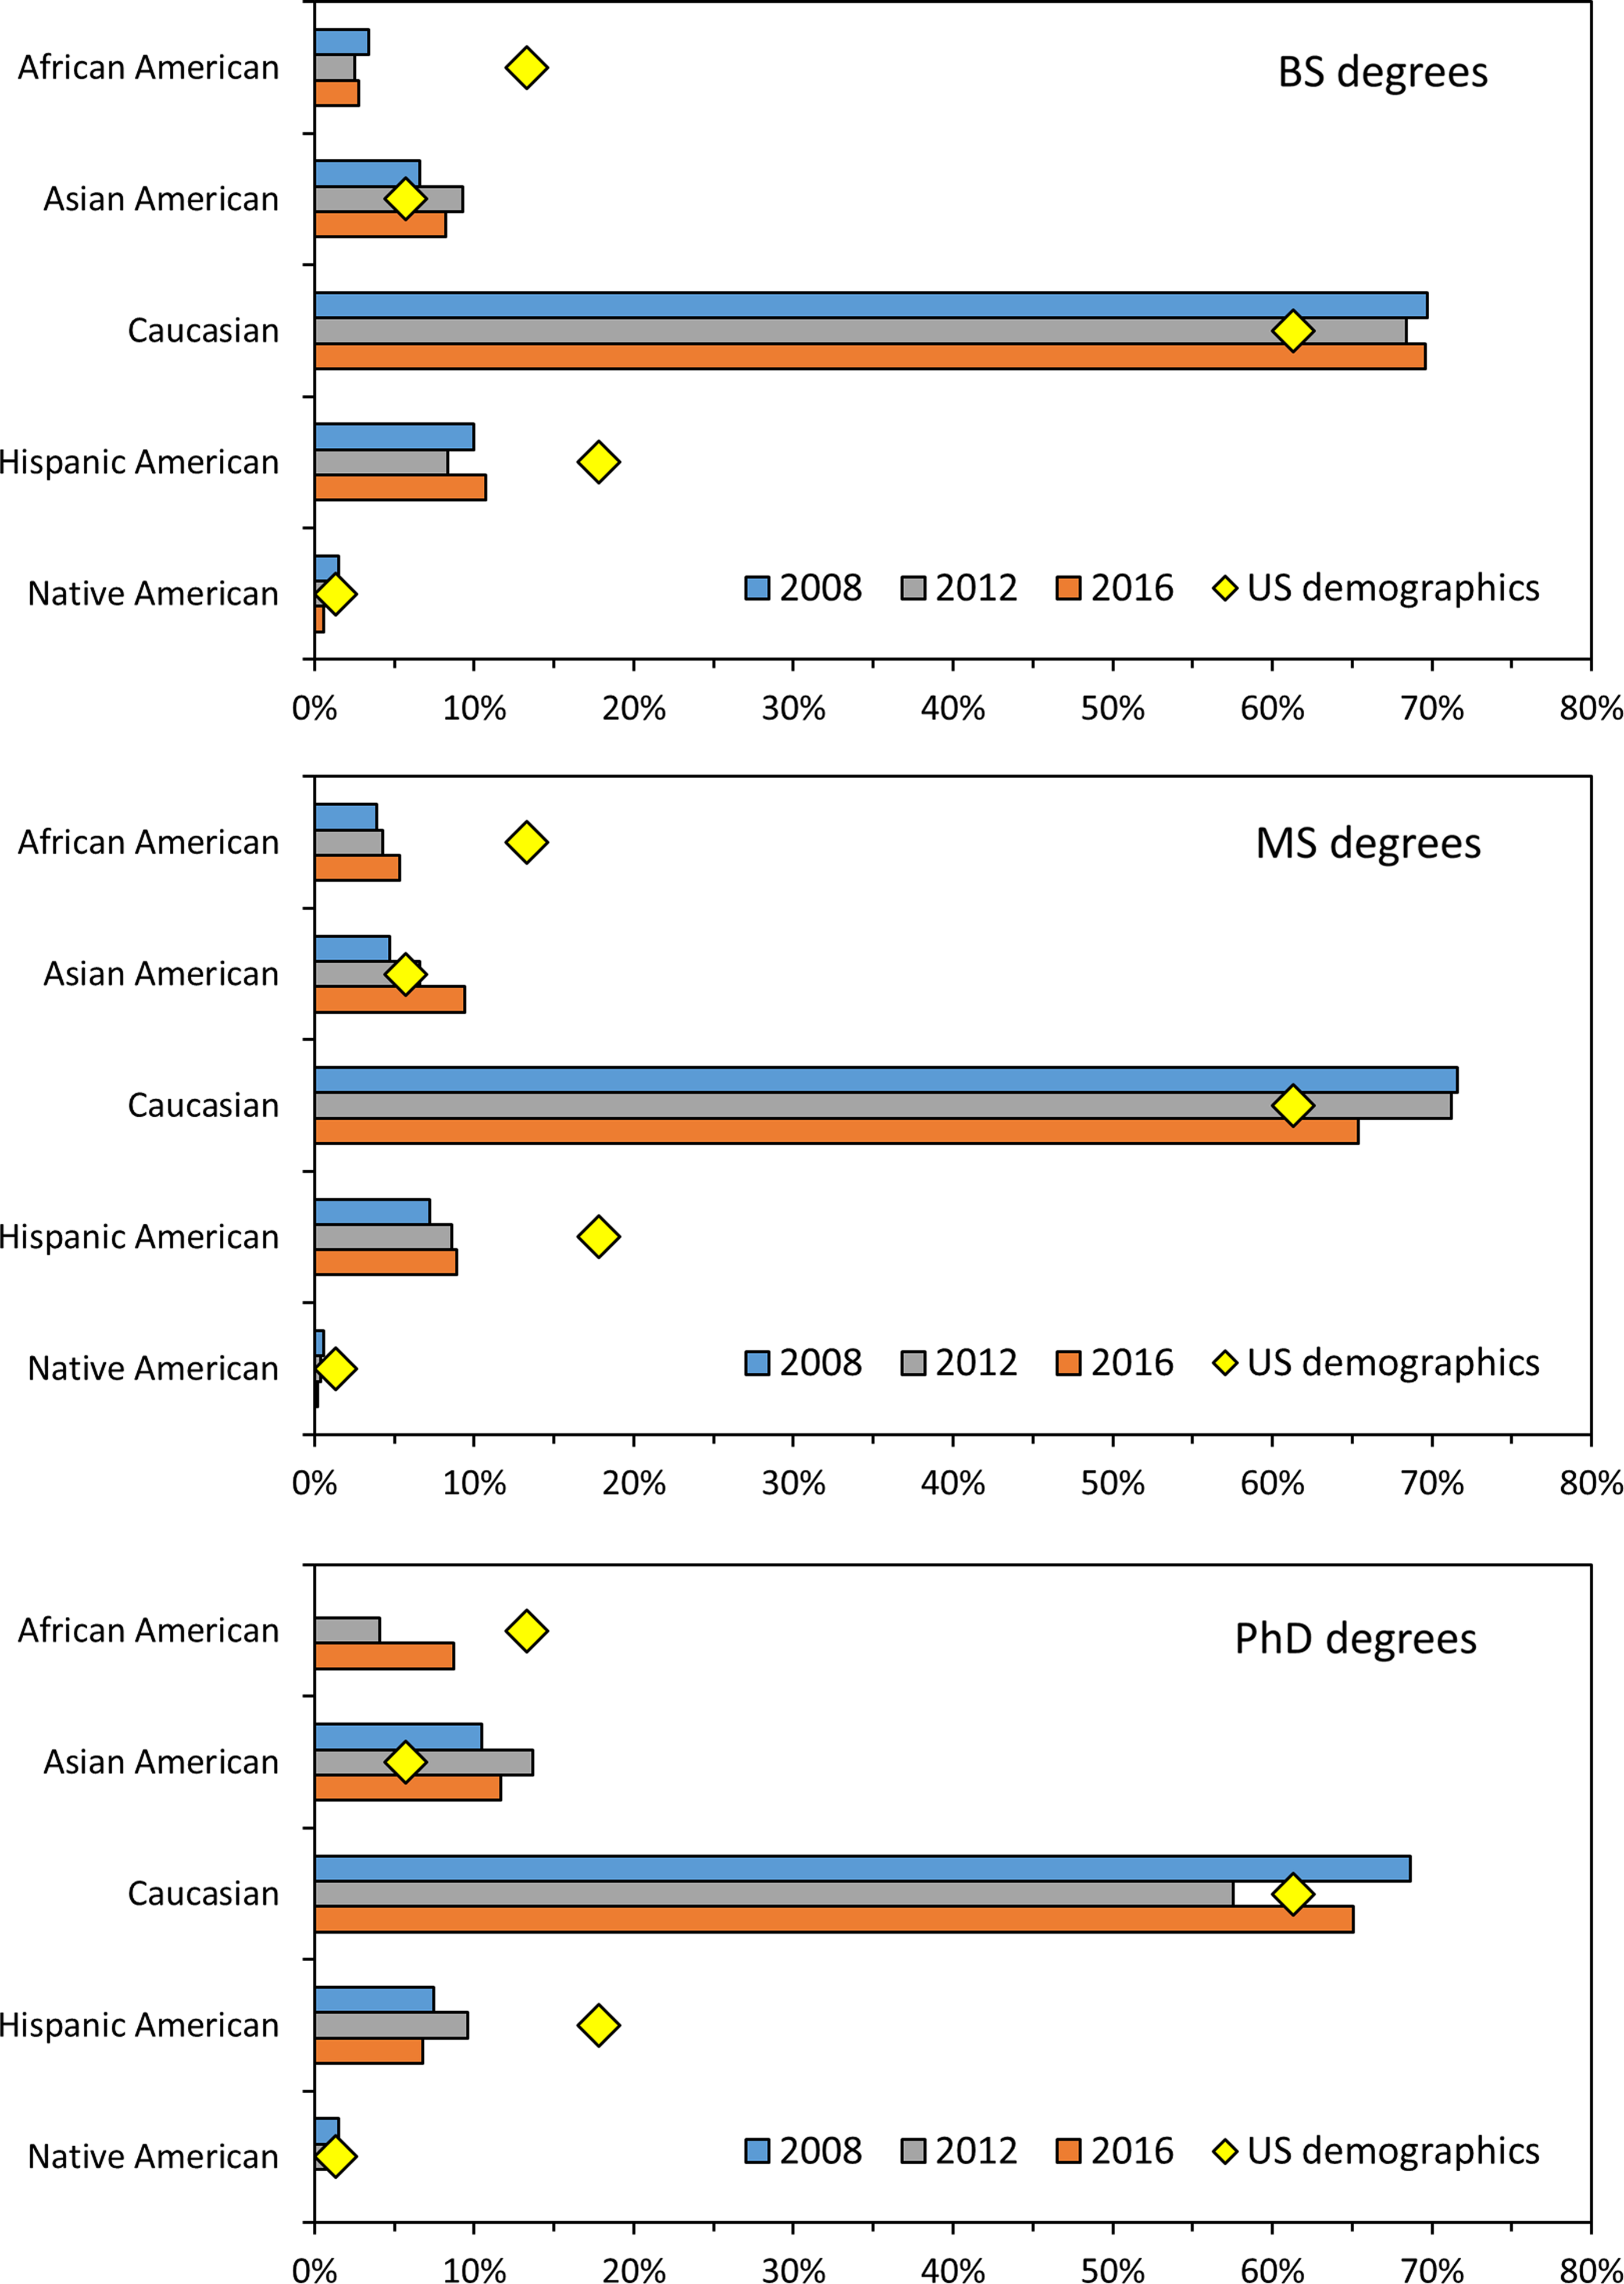
Percentages of BS, MS, and PhD degrees awarded to African Americans, Asian Americans, Caucasians, Hispanic Americans, and Native Americans in environmental engineering for 2008, 2012, and 2016. In this case, the data were adjusted to domestic students, that is, international students were not counted in the denominator. ASEE also reports “Other” (1998–2009), “Native Hawaiian,” “Two or more,” and “Unknown” (2010–present). The “Other” and “Unknown” categories were the next most populated, but for the sake of brevity, these groups were not plotted here. U.S. demographic levels are for 2016.
African Americans, Hispanic Americans, and Native Americans are also underrepresented in environmental engineering faculty (Fig. 1), and the extent of underrepresentation is greater than that for students (Fig. 3). In 2016, 2.3%, 5.4%, and 0.0% of assistant, associate, and full professors, respectively, were African American. Hispanic Americans accounted for 4.5%, 5.4%, and 1.0% of assistant, associate, and full professors. No Native American professors of environmental engineering were identified in the ASEE data for 2014–2016, although Blaney et al. (2016) noted that environmental engineering faculty may be housed within other disciplines, including civil and chemical engineering, in the ASEE database and, therefore, underreported in environmental engineering. Previous research (Appel, 1996; Smith et al., 1997) has shown that diverse faculty members are needed to motivate and encourage diverse students to enter and persist in science, technology, engineering, and math majors. The lack of a racially and ethnically diverse faculty, therefore, represents a negative feedback on student diversity.

Race and ethnicity data for assistant, associate, and full professors in environmental engineering for 2008, 2012, and 2016. The “Other” (1998–2009) and “Unknown” (2010–present) categories were combined for this analysis. U.S. demographic levels are shown for 2016.
Gender diversity in environmental engineering students has steadily improved over the past two decades. Figure 4 shows the percentage of degrees awarded to women for 2008, 2012, and 2016. These data demonstrate moderate improvements at the BS and MS levels, with more drastic changes for PhD students. For the 2013–2016 period, 46.7 (±2.0)%, 43.8 (±2.6)%, and 42.7(±3.7)% of environmental engineering BS, MS, and PhD degrees, respectively, were awarded to women. For the same period, women earned 22–27% and 31–34% of degrees in civil and chemical engineering, respectively. Notably, Gelbgiser and Albert (2017) reported that green fields in higher education are characterized by greater gender equality than nongreen fields. In this context, women are comparatively well represented in the environmental engineering student body but still below U.S. demographic levels (∼51% women). One potential strategy for further improvement of gender representation is to reframe fields as both humanistic and scientific (Barone, 2011), a space in which environmental engineering is naturally positioned.

Percentage of BS, MS, and PhD degrees awarded to women and percentage of female assistant, associate, and full professors for 2008, 2012, and 2016.
In general, the percentage of female assistant professors has been relatively steady at 30–40% over the past 15 years. However, clear gains have been made at the full professor rank, where women comprised 24% of environmental engineering faculty in 2016 compared with 12% in 2008. As full professors approach the 30% women level, we do not expect continued growth because associate professors have been fairly constant at 31 (±2)% women for the past 8 years. Importantly, a gap exists with respect to PhDs awarded to women (44.7% in 2016) and the percentage of female assistant professors (34.1% in 2016). Blaney et al. (2016) further discussed the intersection of race, ethnicity, and gender demographics in faculty. To ensure that faculty diversity keeps pace with student diversity, systems that encourage and support women to join and succeed in academia are necessary.
Given these data, we reiterate our claim that improving diversity needs to be considered a grand challenge in environmental engineering. Without a more diverse faculty, underrepresented students may be discouraged from pursuing environmental engineering degrees since the faculty members who are teaching them do not reflect their own image. For the same reason, improving diversity with respect to disability status, gender identity, and sexual orientation is also important. The National Science Foundation analyzes data on women, minorities, and persons with disabilities in STEM (NSF, 2017); however, demographics data for these domains are not available for environmental engineering, which makes it difficult to assess current levels of representation. As we build a more diverse faculty and student body, we will also increase objectivity in hiring processes, proposal reviews, and scientific citations, all of which have been shown to be impacted by implicit bias (Lee et al., 2013; Carnes et al., 2015). Improvements in these areas may lead to a positive feedback loop as students will have more faculty at all ranks to look to for support, encouragement, and motivation to pursue graduate degrees and careers in academia. The world cannot afford to produce incremental solutions to the grand challenge of integrating culture, perception, and behavior with advances in science and technology in either the developing or the developed world. To overcome this challenge, we must build a truly diverse cohort of students in our classrooms and laboratories to not only generate a more talented and creative workforce, but also enable transformative solutions to grand challenges in environmental engineering.
Footnotes
Author Disclosure Statement
No competing financial interests exist.