
Abstract
Abstract
This article proposes a combined principal component analysis (PCA) and local Fisher discriminant analysis (LFDA) scheme to improve the fault diagnosis performance of the indoor air quality (IAQ) measuring devices in subway stations. The combined scheme employs PCA for fault detection step and subsequently utilizes LFDA for diagnosing faulty IAQ sensors. A fault discriminant index based on LFDA discriminant components is proposed for fault diagnosis. Effectiveness of the proposed approach is demonstrated on the IAQ measuring system, where three types of IAQ sensor faults including bias fault, drifting fault, and complete failure fault are involved. Results demonstrate that diagnosing performance of LFDA is better than that of conventional Fisher discriminant analysis. The combined method has the capability of detecting and discriminating the sensor faults in the subway system.
Introduction
C
Fault detection and diagnosis (FDD) has received more attention both in the academic and industrial community over the past two decades (Qin, 2012). FDD can be classified into two categories: data-driven (Qin, 2012) and model-based (Gao et al., 2015) methods. The data-driven FDD is more frequently used than the model-based method due to the fact that process data can be easily obtained with the fast development of computer usage in industries. In addition, the model-based FDD has the main disadvantage that the detection and diagnosing results are more sensitive to the developed models. This characteristic makes it unsuitable for the more complex chemical and environmental processes. To detect abnormal conditions, the data-driven FDD typically employs multivariate statistical process monitoring methods such as principal component analysis (PCA) and partial least squares (PLS). PCA is one of the most widely used fault detection methods and has been successfully applied in numerous applications (Kwon et al., 2015). Besides the PCA-based methods, PLS is also widely used for FDD. PLS is similar in concepts to PCA except that PLS is used in processes that have response variables (Qin and Zheng, 2013).
Process monitoring approaches are mainly used in fault detection, fault identification, and fault reconstruction. Their isolation and separation capability is unsatisfactory to diagnose the detected faults. Fault detection is a technique used to determine whether the process is in the normal situation, fault identification is used to find out the root cause of the detected faults, and fault reconstruction is used to estimate the fault-free values of the faulty sensors or process variables. Fault diagnosis, also known as the classification of multiple fault classes, is a procedure of finding out the root causes of the observed abnormal situations (Jiang et al., 2015). For the details about the differences among and methods used in fault detection, fault identification, fault reconstruction, and fault diagnosis, refer to the review by Qin (2012).
Fisher discriminant analysis (FDA) is originated from pattern classification and has been introduced to the fault diagnosis area (Zhao and Gao, 2015). FDA is a linear dimensionality reduction technique that can effectively separate different fault classes by maximizing the scatter between classes and by minimizing the scatter within classes simultaneously. He et al. (2005) proposed an FDA-based procedure that employed FDA fault directions to generate contribution plots for fault diagnosis. To improve the isolation performance within the framework of FDA, a local FDA (LFDA)-based fault diagnosis method was developed and applied to the Tennessee Eastman process (Yu, 2011). Having the advantage of preserving the multimodality within multiple faulty clusters, LFDA usually shows better diagnosing performance than the traditional FDA method.
In particular, extensive research has been carried out on the fault detection and identification of IAQ sensors in subway systems (Kim et al., 2010a, 2010b, 2013, 2014; Liu et al., 2012, 2013a; Lee et al., 2014). Multivariate statistical techniques such as PCA have gained successful applications in the chemometrics research field during the past two decades. A multivariate monitoring method based on PCA was presented not only to monitor the real-time indoor air pollutants data but also to diagnose the status of the IAQ in a subway station (Kim et al., 2010a). Furthermore, multiway principal component analysis (MPCA) (Kim et al., 2010b) and parallel factor analysis (Lee et al., 2014) were developed to improve the monitoring performance for the air pollutants possessing periodic patterns in subway systems. Some work with IAQ sensor fault monitoring has also been reported. A sensor validation scheme based on PCA was developed to improve the IAQ in a subway station. The method mainly consists of three parts: sensor fault detection using PCA, sensor fault identification using a sensor validity index, and sensor fault reconstruction using an iterative reconstruction algorithm (Liu et al., 2012). To achieve sustainable monitoring of indoor air pollutants in an underground subway environment, a self-validating soft sensor was developed on the basis of recursive PLS (Liu et al., 2013a). In addition to the mentioned process monitoring methods such as PCA or PLS, independent component analysis (ICA) has also been actively pursued in recent years (Kim et al., 2013). A dynamic ICA, which is a technique that extracts essential information from dynamic non-Gaussian distributed data, was used to detect, identify, and reconstruct IAQ sensor faults (Kim et al., 2014). However, most of the research on the process monitoring of IAQ in subway systems has focused on the fault detection other than fault diagnosis.
The purpose of this work is to propose a combined scheme of PCA and LFDA for monitoring and diagnosing faulty IAQ sensors in a subway station in Seoul. PCA is used for detection step and LFDA for diagnosing the fault source after a sensor fault is discovered. The aim of this study is to develop an effective fault diagnosis method to the subway IAQ monitoring research field.
Theory
Motivation of fault diagnosis using LFDA
Fault isolation is an important task for the systems containing multiple faulty sensors. Unfortunately, the traditional fault detection statistics such as squared prediction error (SPE) and T2 cannot be used to determine which sensor is problematic. In this case, fault diagnosing methods such as FDA and its enhanced version LFDA can be used to solve this problem. FDA is a supervised dimensionality reduction method that is used to search for a few characteristic directions that make samples in the same class close and samples in different classes apart simultaneously (Zhong et al., 2014). It is a widely used method in the pattern classification and recognition field. However, it has a main disadvantage that does not take the within-class multimodality into account. Therefore, it cannot separate the samples in the same class with multimodal feature (one class has several separate clusters). In addition, there are only a few researches on this topic in the domain of process monitoring. For example, FDA has been applied to an industrial Tennessee Eastman chemical process (Ge et al., 2016).
As a linear supervised dimensionality reduction method, LFDA was developed by Sugiyama (2007) and stands for an improved version of conventional FDA. The most significant feature of LFDA is that it can preserve within-class's local structure and multimodality. Multimodality is common in the data measured from many applications. Taking the diagnosis of subway IAQ sensors as an example, the problematic samples resulting from the faulty IAQ sensors could be multimodal because there usually exist several fault types such as bias, drifting, and precision degradation of sensor signals. In contrast to FDA, LFDA takes into account the local structure of the multimodal data, which can be embedded effectively in a local manner by reformulating the constraint of the traditional FDA optimization problem (Sugiyama, 2007).
Principal component analysis
PCA is one of the most commonly used dimension reduction techniques and is widely used in the multivariate statistical process monitoring field. Qin (2012) provided a comprehensive overview and analysis of PCA for process monitoring. Here we briefly describe the key equations for fault detection based on PCA.
Let
The number of principal components d can be determined by the variance of reconstruction error method (Qin and Dunia, 2000). To determine whether a fault occurs when a new sample
The other fault detection index is Hotelling's T2 statistic, which can be calculated using the following equation:
where
Local Fisher discriminant analysis
Let the normalized training data
Let
and
where the weighting matrices
and
where
The objective function for finding the local Fisher discriminant directions is defined as follows (Sugiyama, 2007):
where r is the dimensionality reduction order in LFDA. This objective function is equivalent to the following generalized eigenvalue decomposition problem
where
Then the LFDA transformation matrix

Finally, a mapped representation
For further details of the LFDA algorithm, see the article by Sugiyama (2007).
Sensor fault diagnosis index
To diagnose the fault type that a faulty measurement pertains to, several methods have been proposed in the literature. Pattern matching, such as the similarity factor between test discriminant vector and optimal discriminant vector calculated from historical data, has been proposed for fault diagnosis as well (Singhal and Seborg, 2006). A fault diagnosis method based on the Mahalanobis distance has also been applied to some industrial applications such as air handling units (Du and Jin, 2008). In fact, the Mahalanobis distance can be treated as a kind of T2 statistic that can be used to evaluate the similarity between each test sample and fault types.
In this work, we propose to use a new sensor fault discriminant index
where
The intuitionistic meaning of
Procedure of the proposed method
Three main steps of the proposed procedure are described in Fig. 1. First, a pretreatment of historical data is conducted to deal with the problematic data that may have missing data and outliers. After the pretreatment to the original data, the normalization of the treated data is performed for the PCA modeling. Then, discriminant models based on conventional FDA and LFDA are generated with the aid of process knowledge that is helpful for the last step of sensor fault diagnosis. The purpose of process knowledge is to predefine fault patterns. In this study, IAQ data collected from subway stations may be contaminated due to some sensor faults such as bias, drifting, and complete failure. A PCA model is at the same stage built from the normal data for sensor fault detection. Two statistics of SPE and T2 are used to discover sensor fault information for fault detection. Finally, the two-dimensional Fisher direction and three-dimensional Fisher feature space graphs are used for fault visualization. Furthermore, the discriminant index

Overall flowchart of fault diagnosis of IAQ using LFDA. IAQ, indoor air quality; LFDA, local Fisher discriminant analysis.
Fault Diagnosis of Subway IAQ
IAQ data description
In this study, seven air pollutants (nitrogen monoxide [NO], nitrogen dioxide [NO2], nitrogen oxides [NOx], particulate matters with diameters <10 μm [PM10] and 2.5 μm [PM2.5], carbon monoxide [CO], and carbon dioxide [CO2]), and two meteorological variables (temperature and humidity) were measured by minivolume air samplers and a telemonitoring system in a subway station in Seoul. The detection limits and the measurement accuracy of the air analyzers are given in Table 1 (Liu and Yoo, 2016). The IAQ data were collected in January of 2010 with a sampling interval of 1 h (Fig. 2). The peak values shown in Fig. 2 are due to the rush hour effect in the subway station. All of the variables were scaled to zero mean and unit variance for PCA modeling. The normalized data were then divided into two data sets: training data set used for getting off-line models and test data set for validating the accuracy of the developed training models. The total number of IAQ data measurements is 600, among which the first 400 measurements were used as training data and the rest as test data.
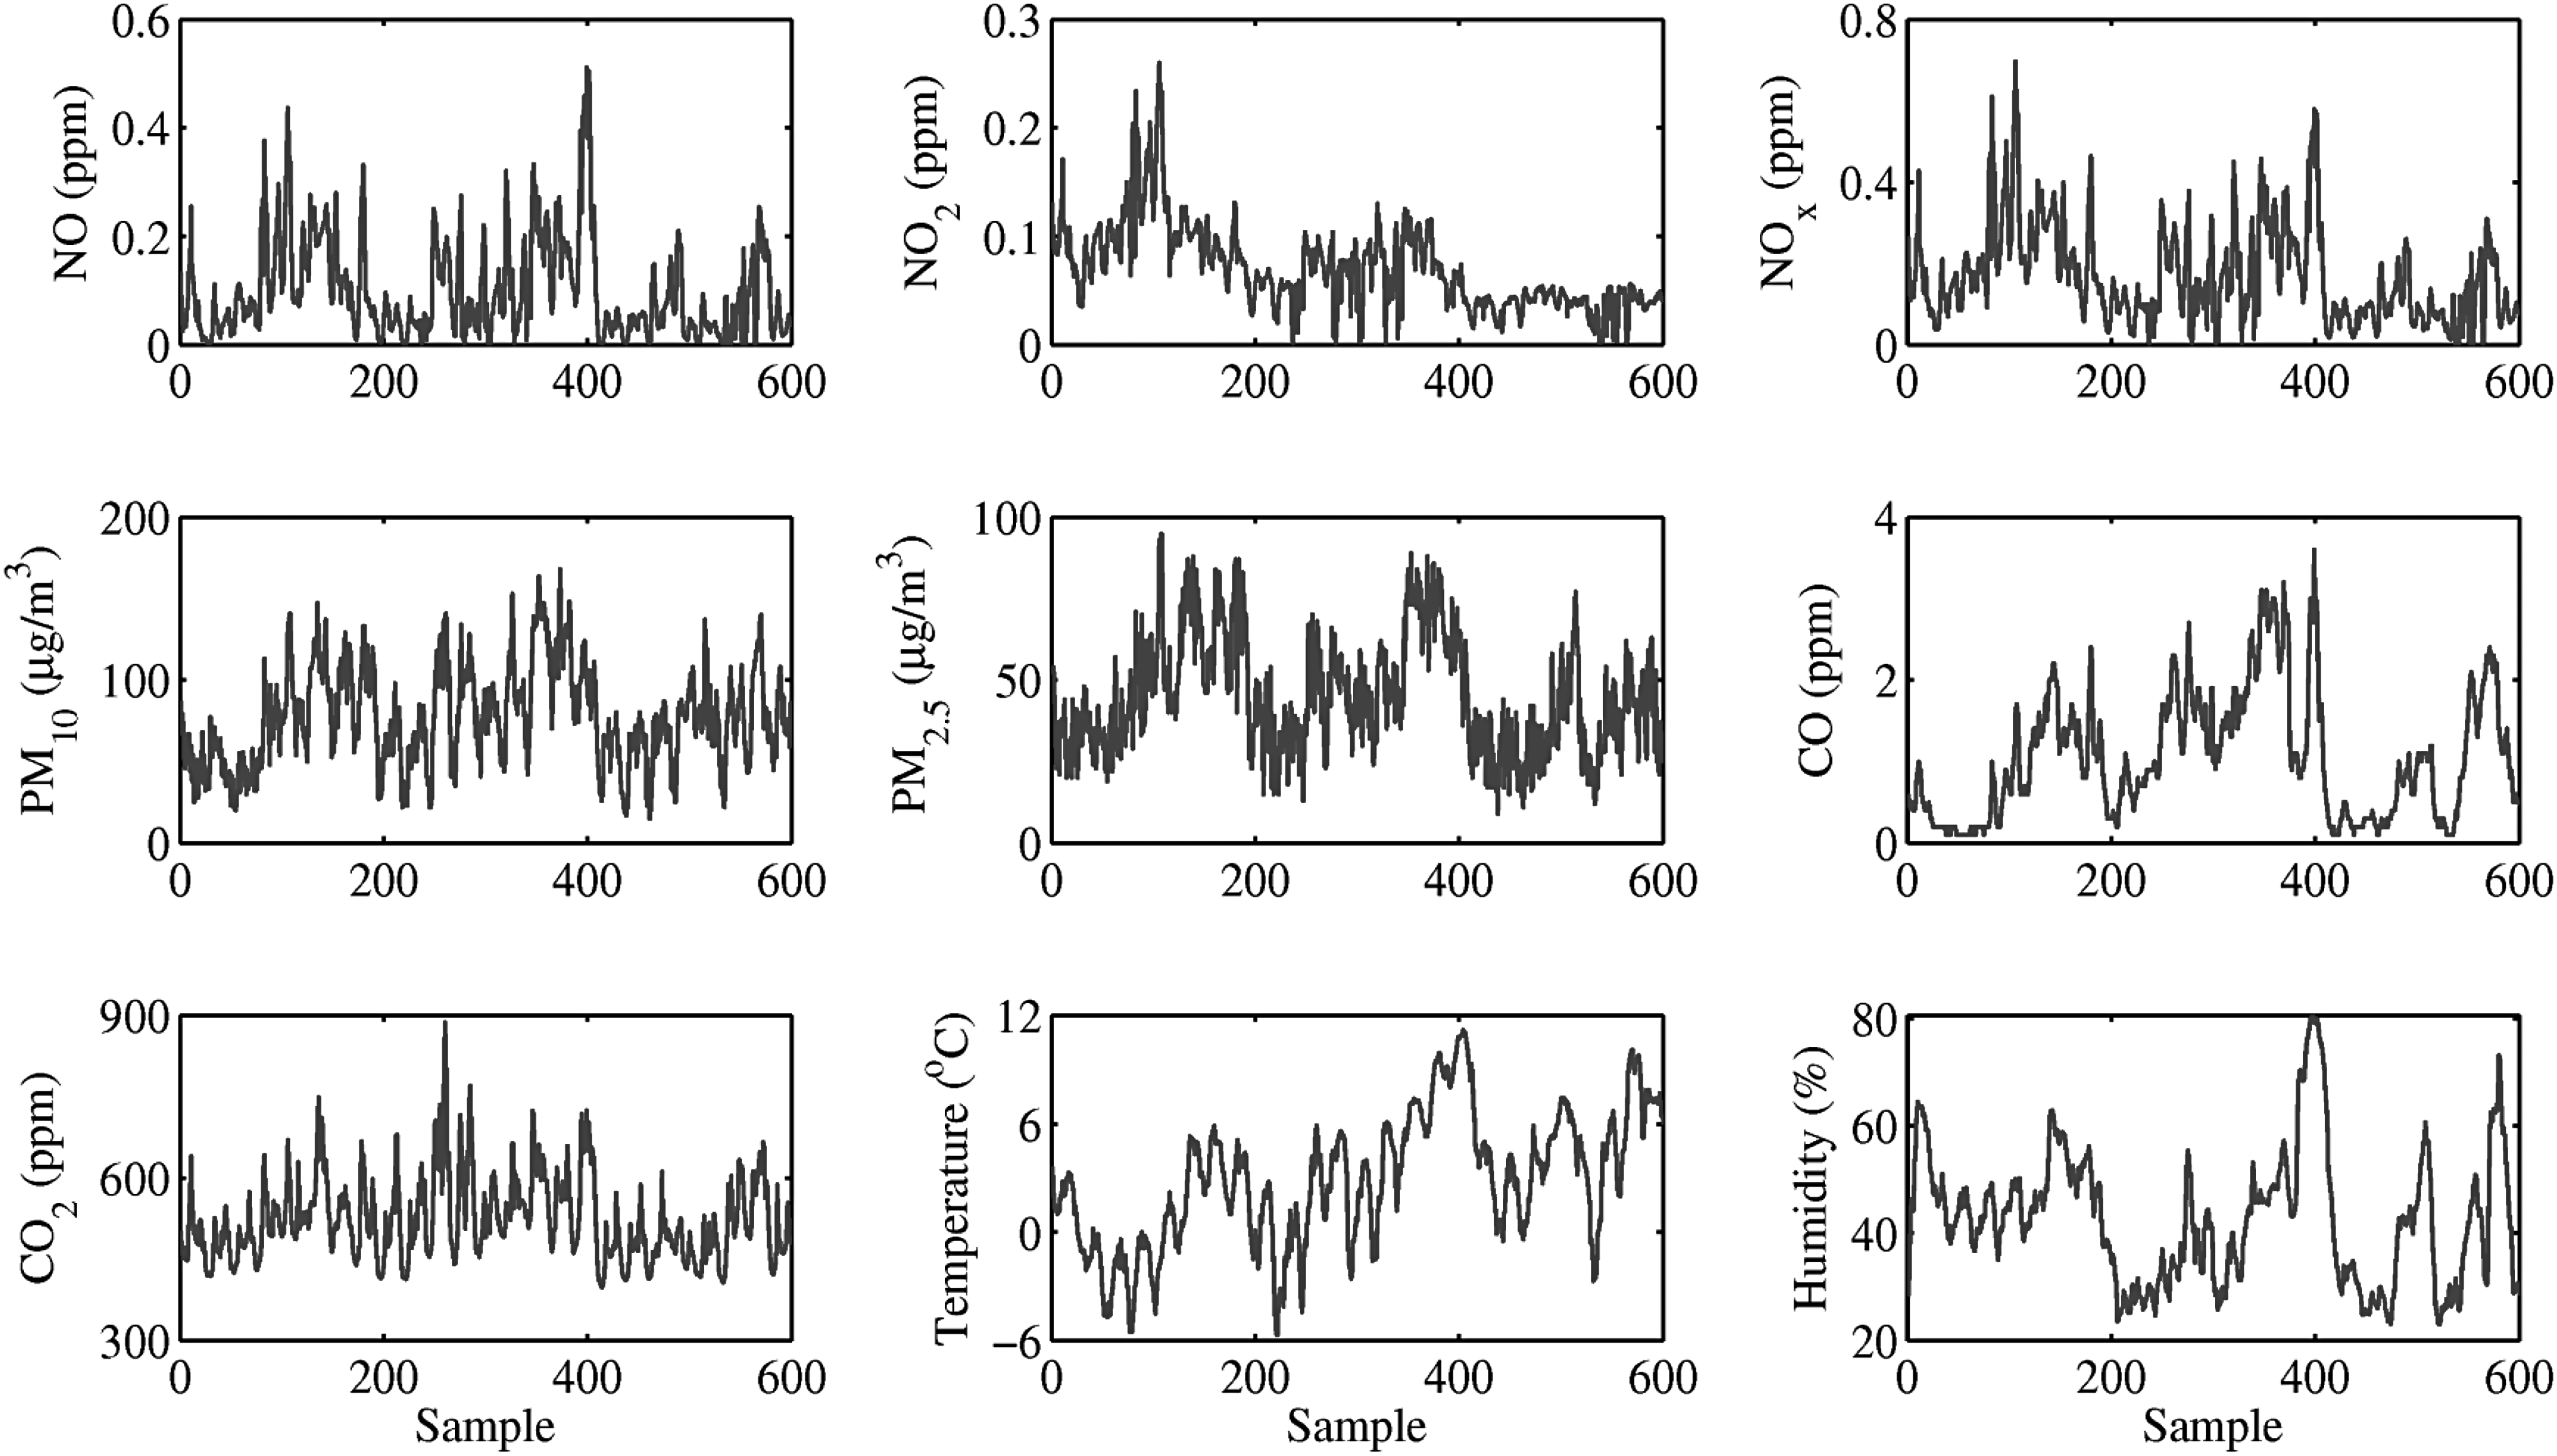
Variations of the IAQ data obtained from a subway station in Seoul.
Discriminant model development using LFDA
To evaluate the fault diagnosis performance of FDA and LFDA methods, three types of subway sensor faults were introduced to the normally collected IAQ data, as shown in Fig. 3a–c. Each sensor fault spans 100 samples and only influences one IAQ sensor. For the training data listed in Table 2, the first sensor fault is a PM10 bias with bias term of 150 μm/m3; the second sensor fault is a drifting type that happens in the temperature sensor from samples 201 to 300 with drifting factor of 0.1°C/h; the third sensor fault is a complete type happening in the PM10 sensor with a constant fault size of 200 μm/m3.
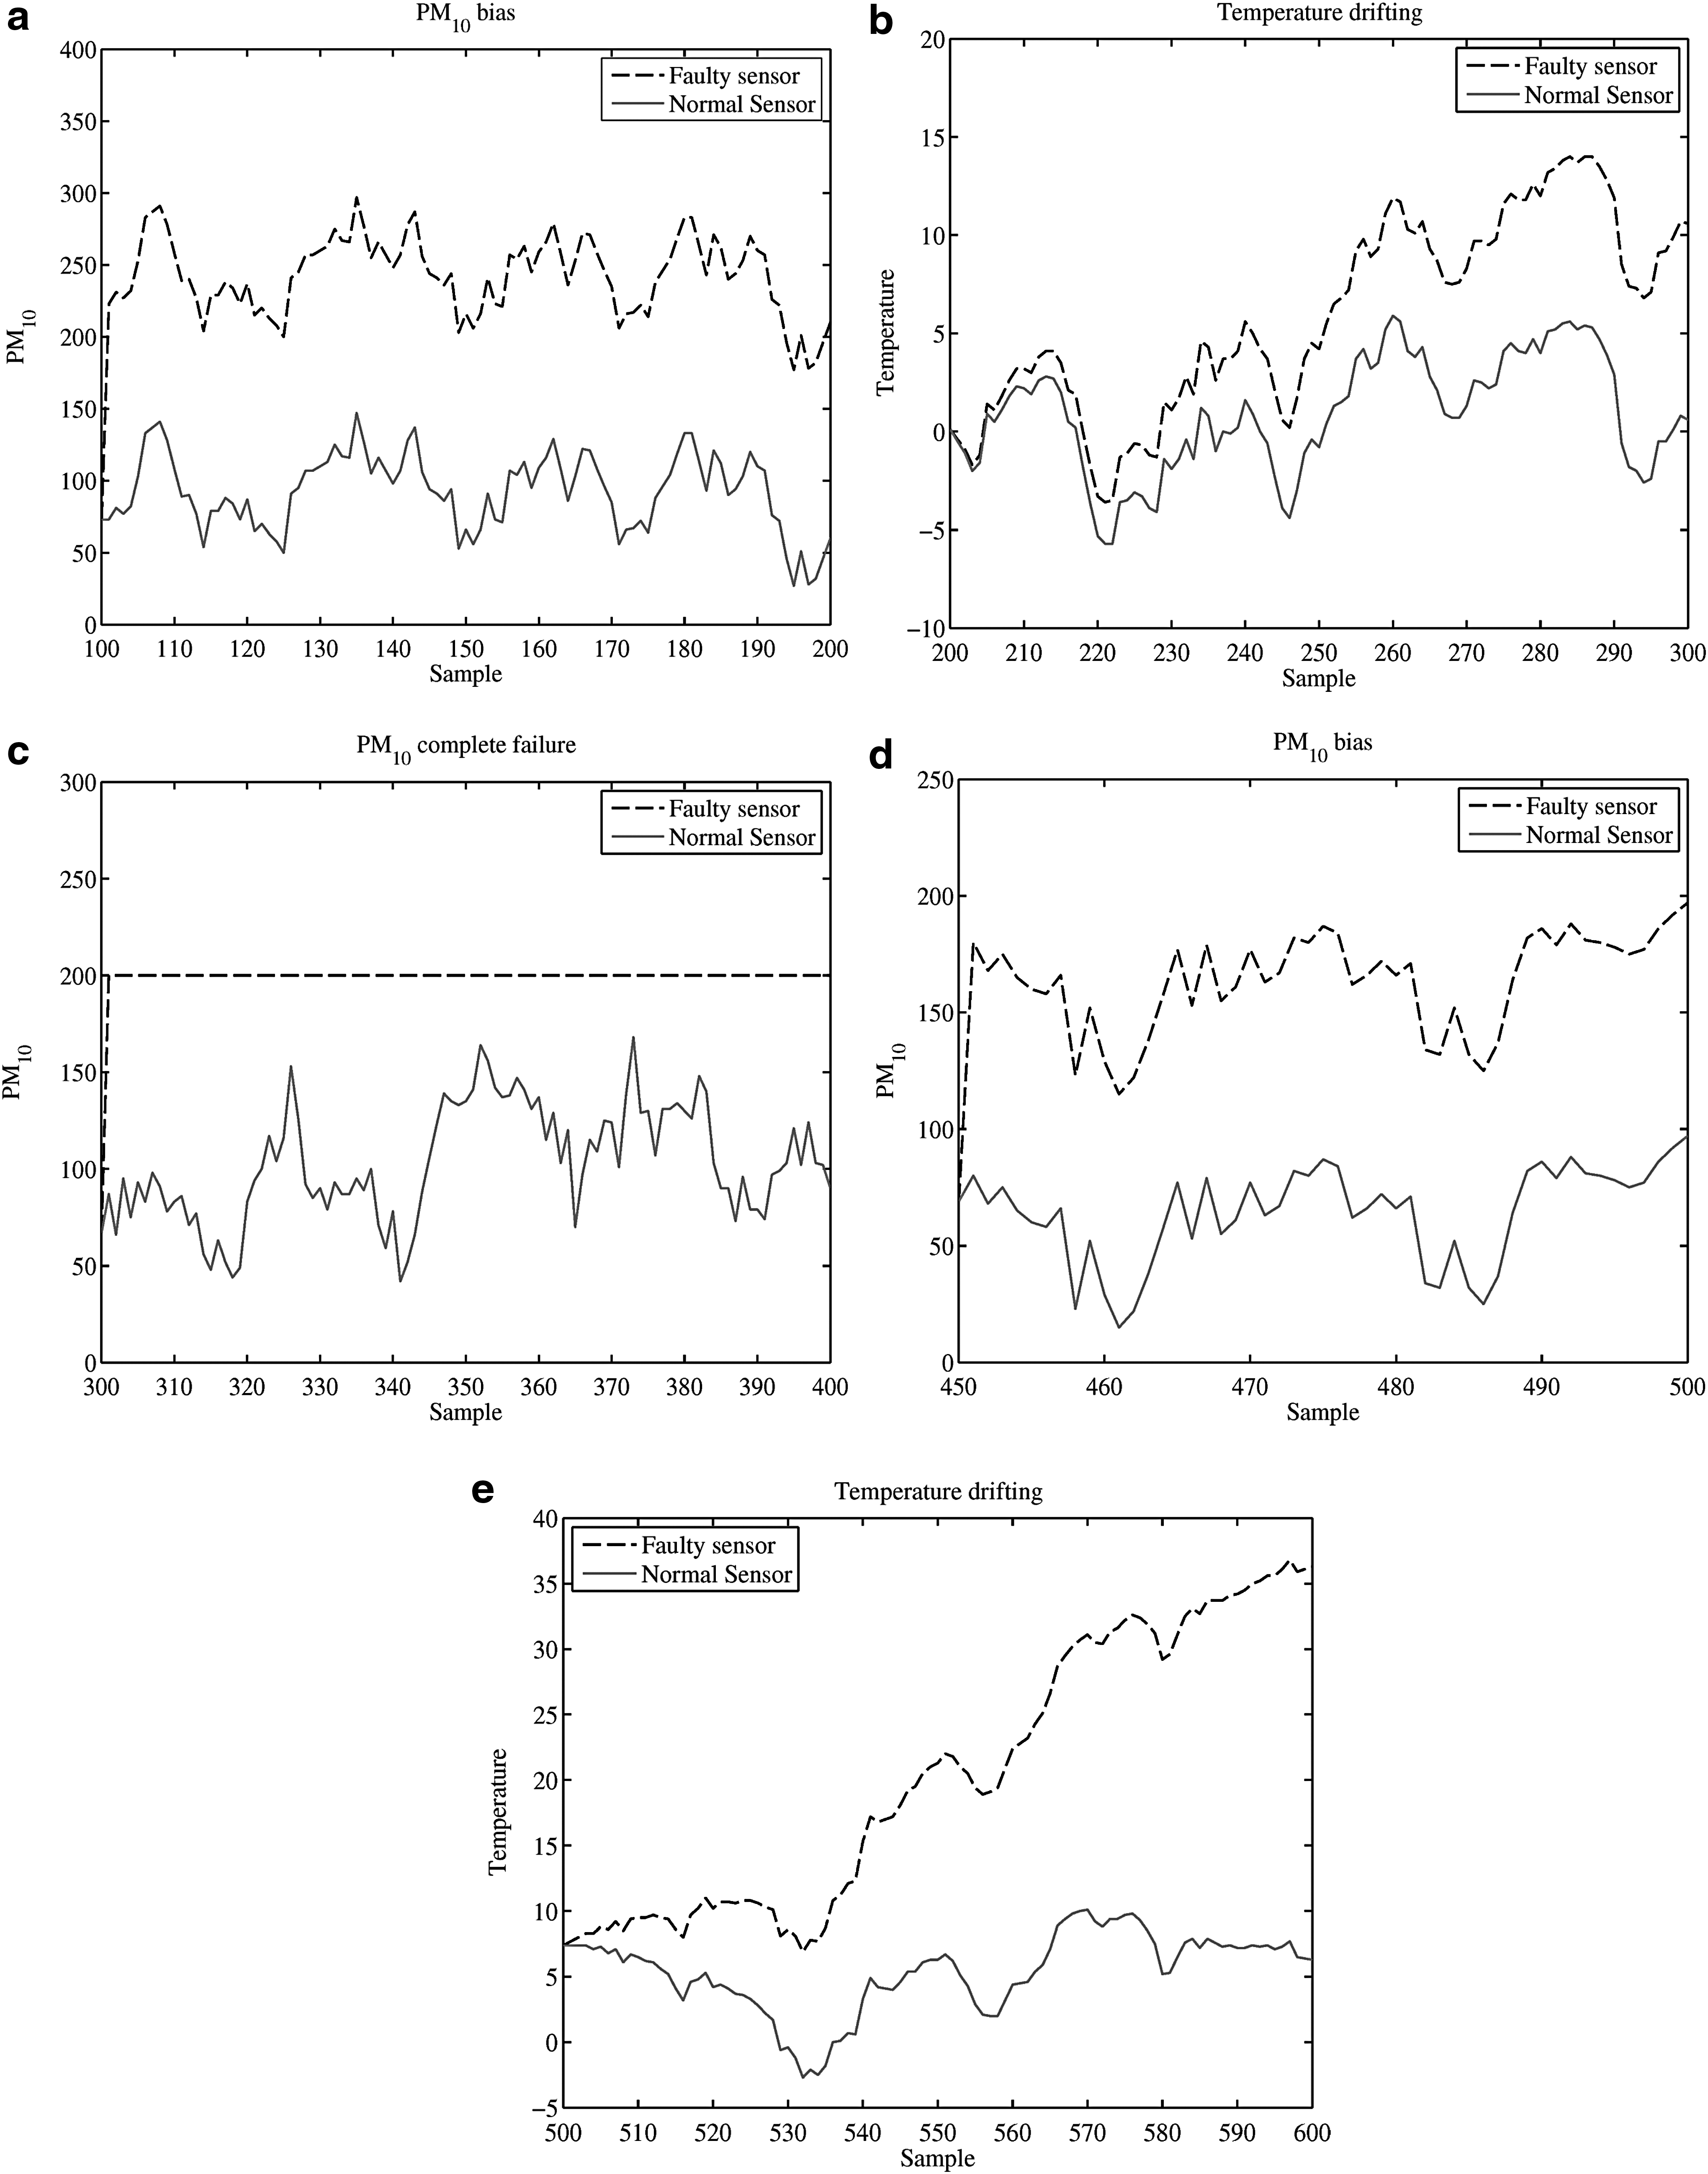
IAQ sensor faults:
The comparison of the isolation results in terms of the three-dimensional and two-dimensional graphs obtained using FDA and LFDA methods is shown in Figs. 4 and 5, respectively. FDA shows poor isolation capability for the four different classes representing IAQ sensor conditions, including one normal condition and three faulty conditions. From Fig. 4 we observe that most of the data points in the three-dimensional and two-dimensional graphs mix together, which makes FDA impossible for the isolation of IAQ sensor faults. On the contrary, LFDA can separate the faulty data correctly both in the three-dimensional local Fisher feature space and in the projected two-dimensional directions shown in Fig. 5.
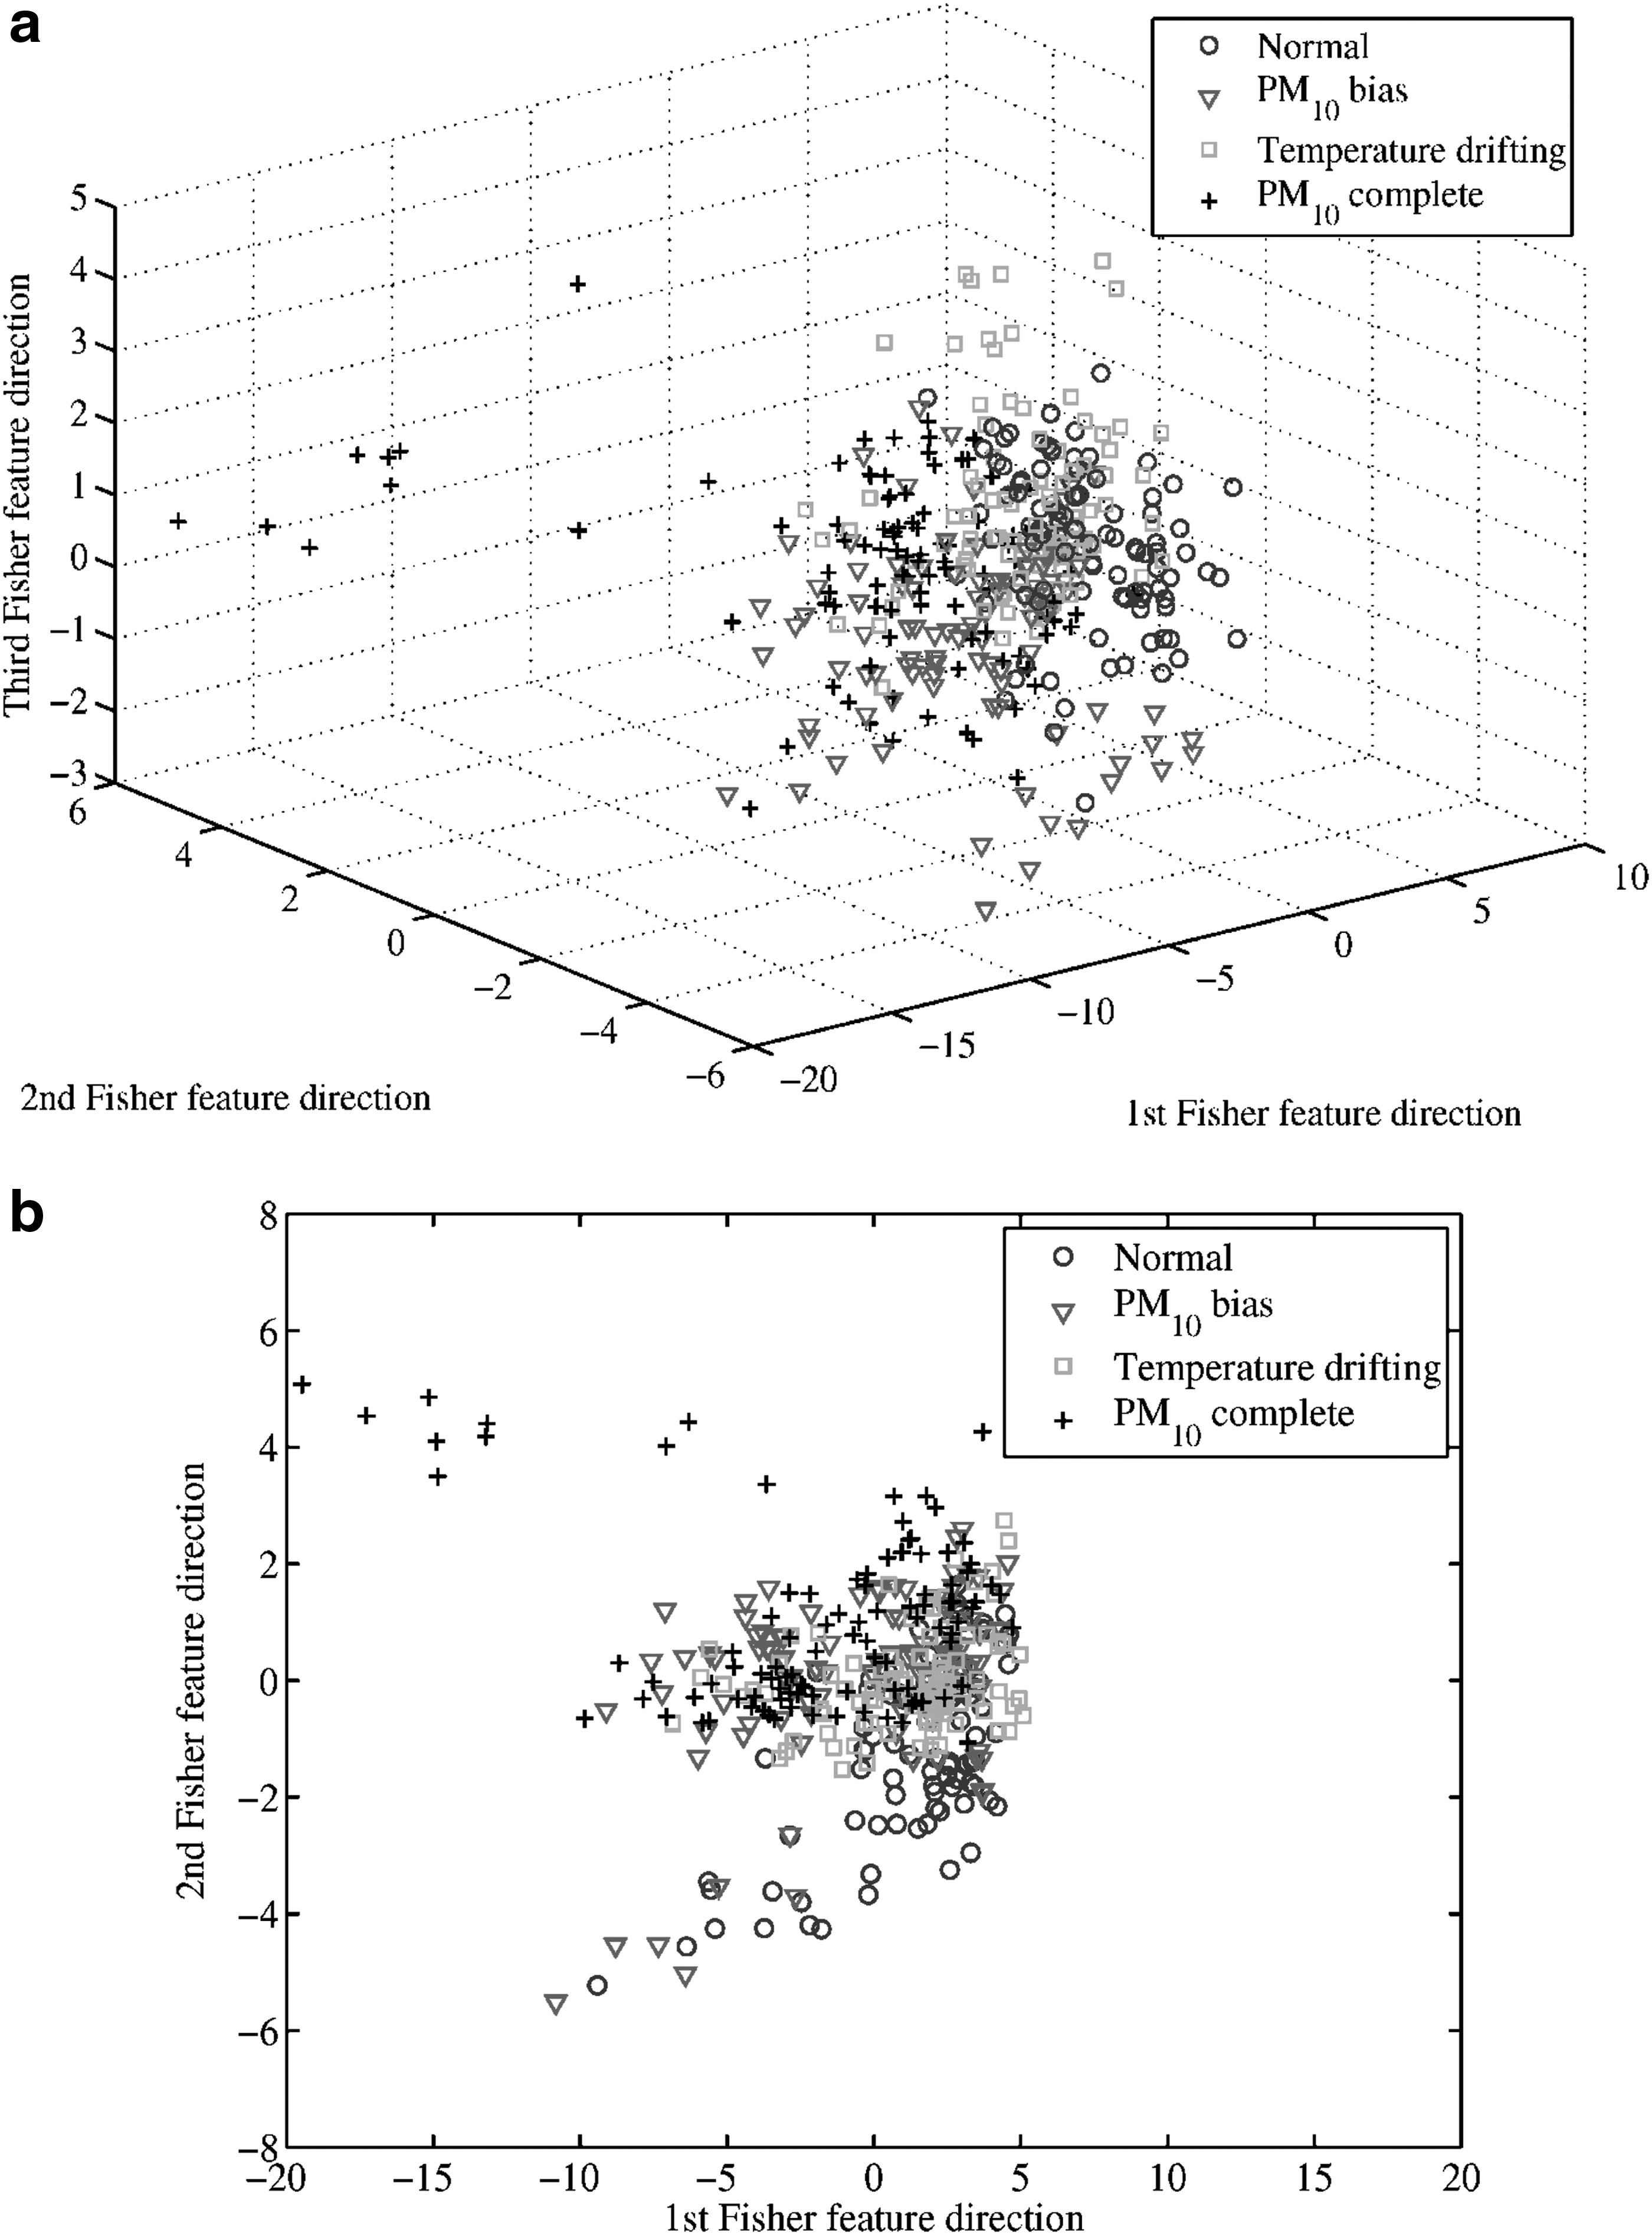
FDA discriminant model illustrated
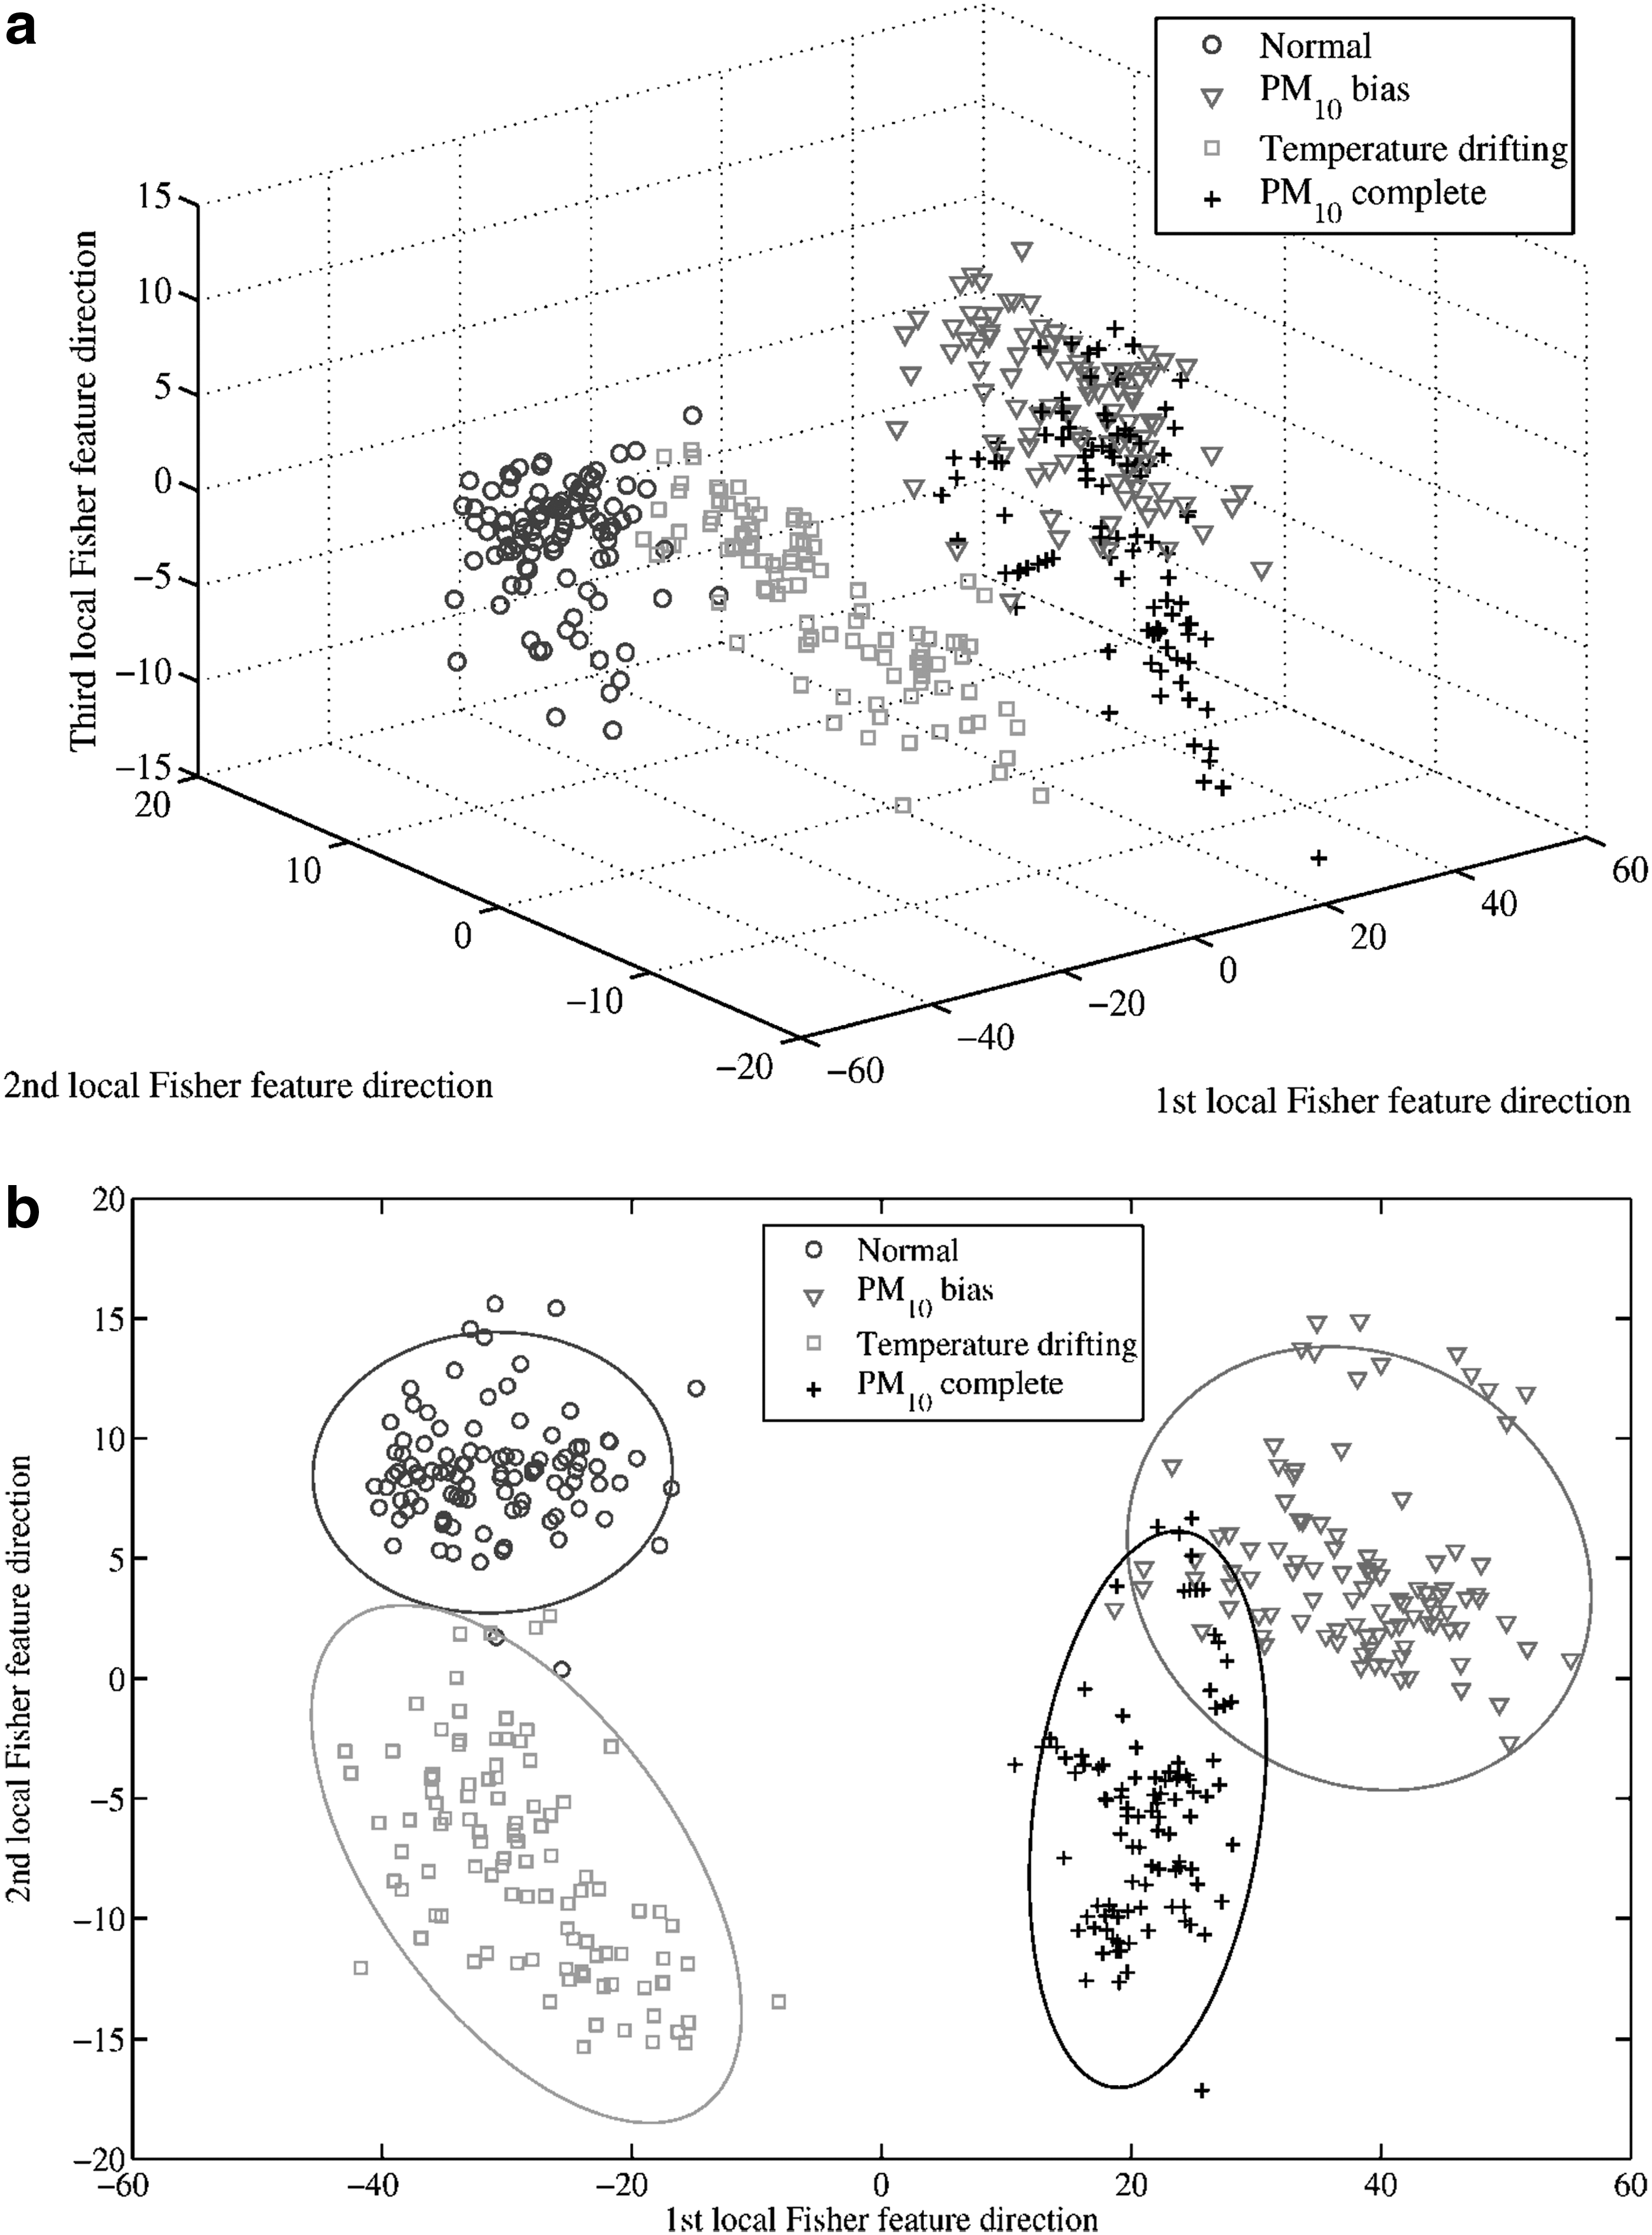
LFDA discriminant model illustrated
The 95% elliptical confidence regions for the four IAQ classes obtained using LFDA method are also shown in Fig. 5b. The elliptical confidence regions were used here to analyze fault diagnosis or classification performance. Only PM10 sensor bias and PM10 sensor complete faults overlap partially, which decreases the isolation performance between these two IAQ sensor faults. With respect to the PM10 sensor bias fault, 7 out of the total 100 samples falling in the intersection of the two elliptical confidence regions are misclassified as the PM10 sensor complete fault, and thus the misclassification rate is 7%. In contrast, with respect to the PM10 sensor complete fault, 12 out of the total 100 samples are misclassified as the PM10 sensor bias fault, therefore, the misclassification rate is 12%. In a word, LFDA is more effective to separate the normal and faulty conditions of IAQ sensors than FDA.
IAQ sensor faults detection and diagnosis for test data set
A statistical PCA model can be developed using the first 100 samples from the measured IAQ data (Table 2). The method of calculating unreconstructed variances for best reconstruction (Qin and Dunia, 2000) was implemented to determine the optimal number of principal components. Three principal components were chosen on the basis of searching for the lowest unreconstructed variance. The first three principal components corresponding to the three largest eigenvalues could explain 85.40% of the total variance of the system, and thus, three principal components were retained for the PCA model.
To test the diagnosing performance of the LFDA method, a test data set containing a normal data set and two IAQ sensor fault data sets was used (Fig. 3d, e and Table 2). The developed PCA model was then utilized for the IAQ fault detection purpose. The results of PCA detection show that there are mainly three distinct regions relating to the mentioned sensor faults as shown in Fig. 6. The SPE statistic is more accurate than the T2 statistic with regard to the fault detection rate. The PM10 bias sensor fault can be detected without any time delay by the SPE statistic, whereas it cannot be detected by the T2 statistic. In the case of the detection of the temperature drifting sensor fault, the SPE statistic has better detection performance than the T2 statistic. The detection delay of 15 samples is also observed for the monitoring chart, which is mainly due to the slowly changed characteristic of the temperature drifting sensor fault.
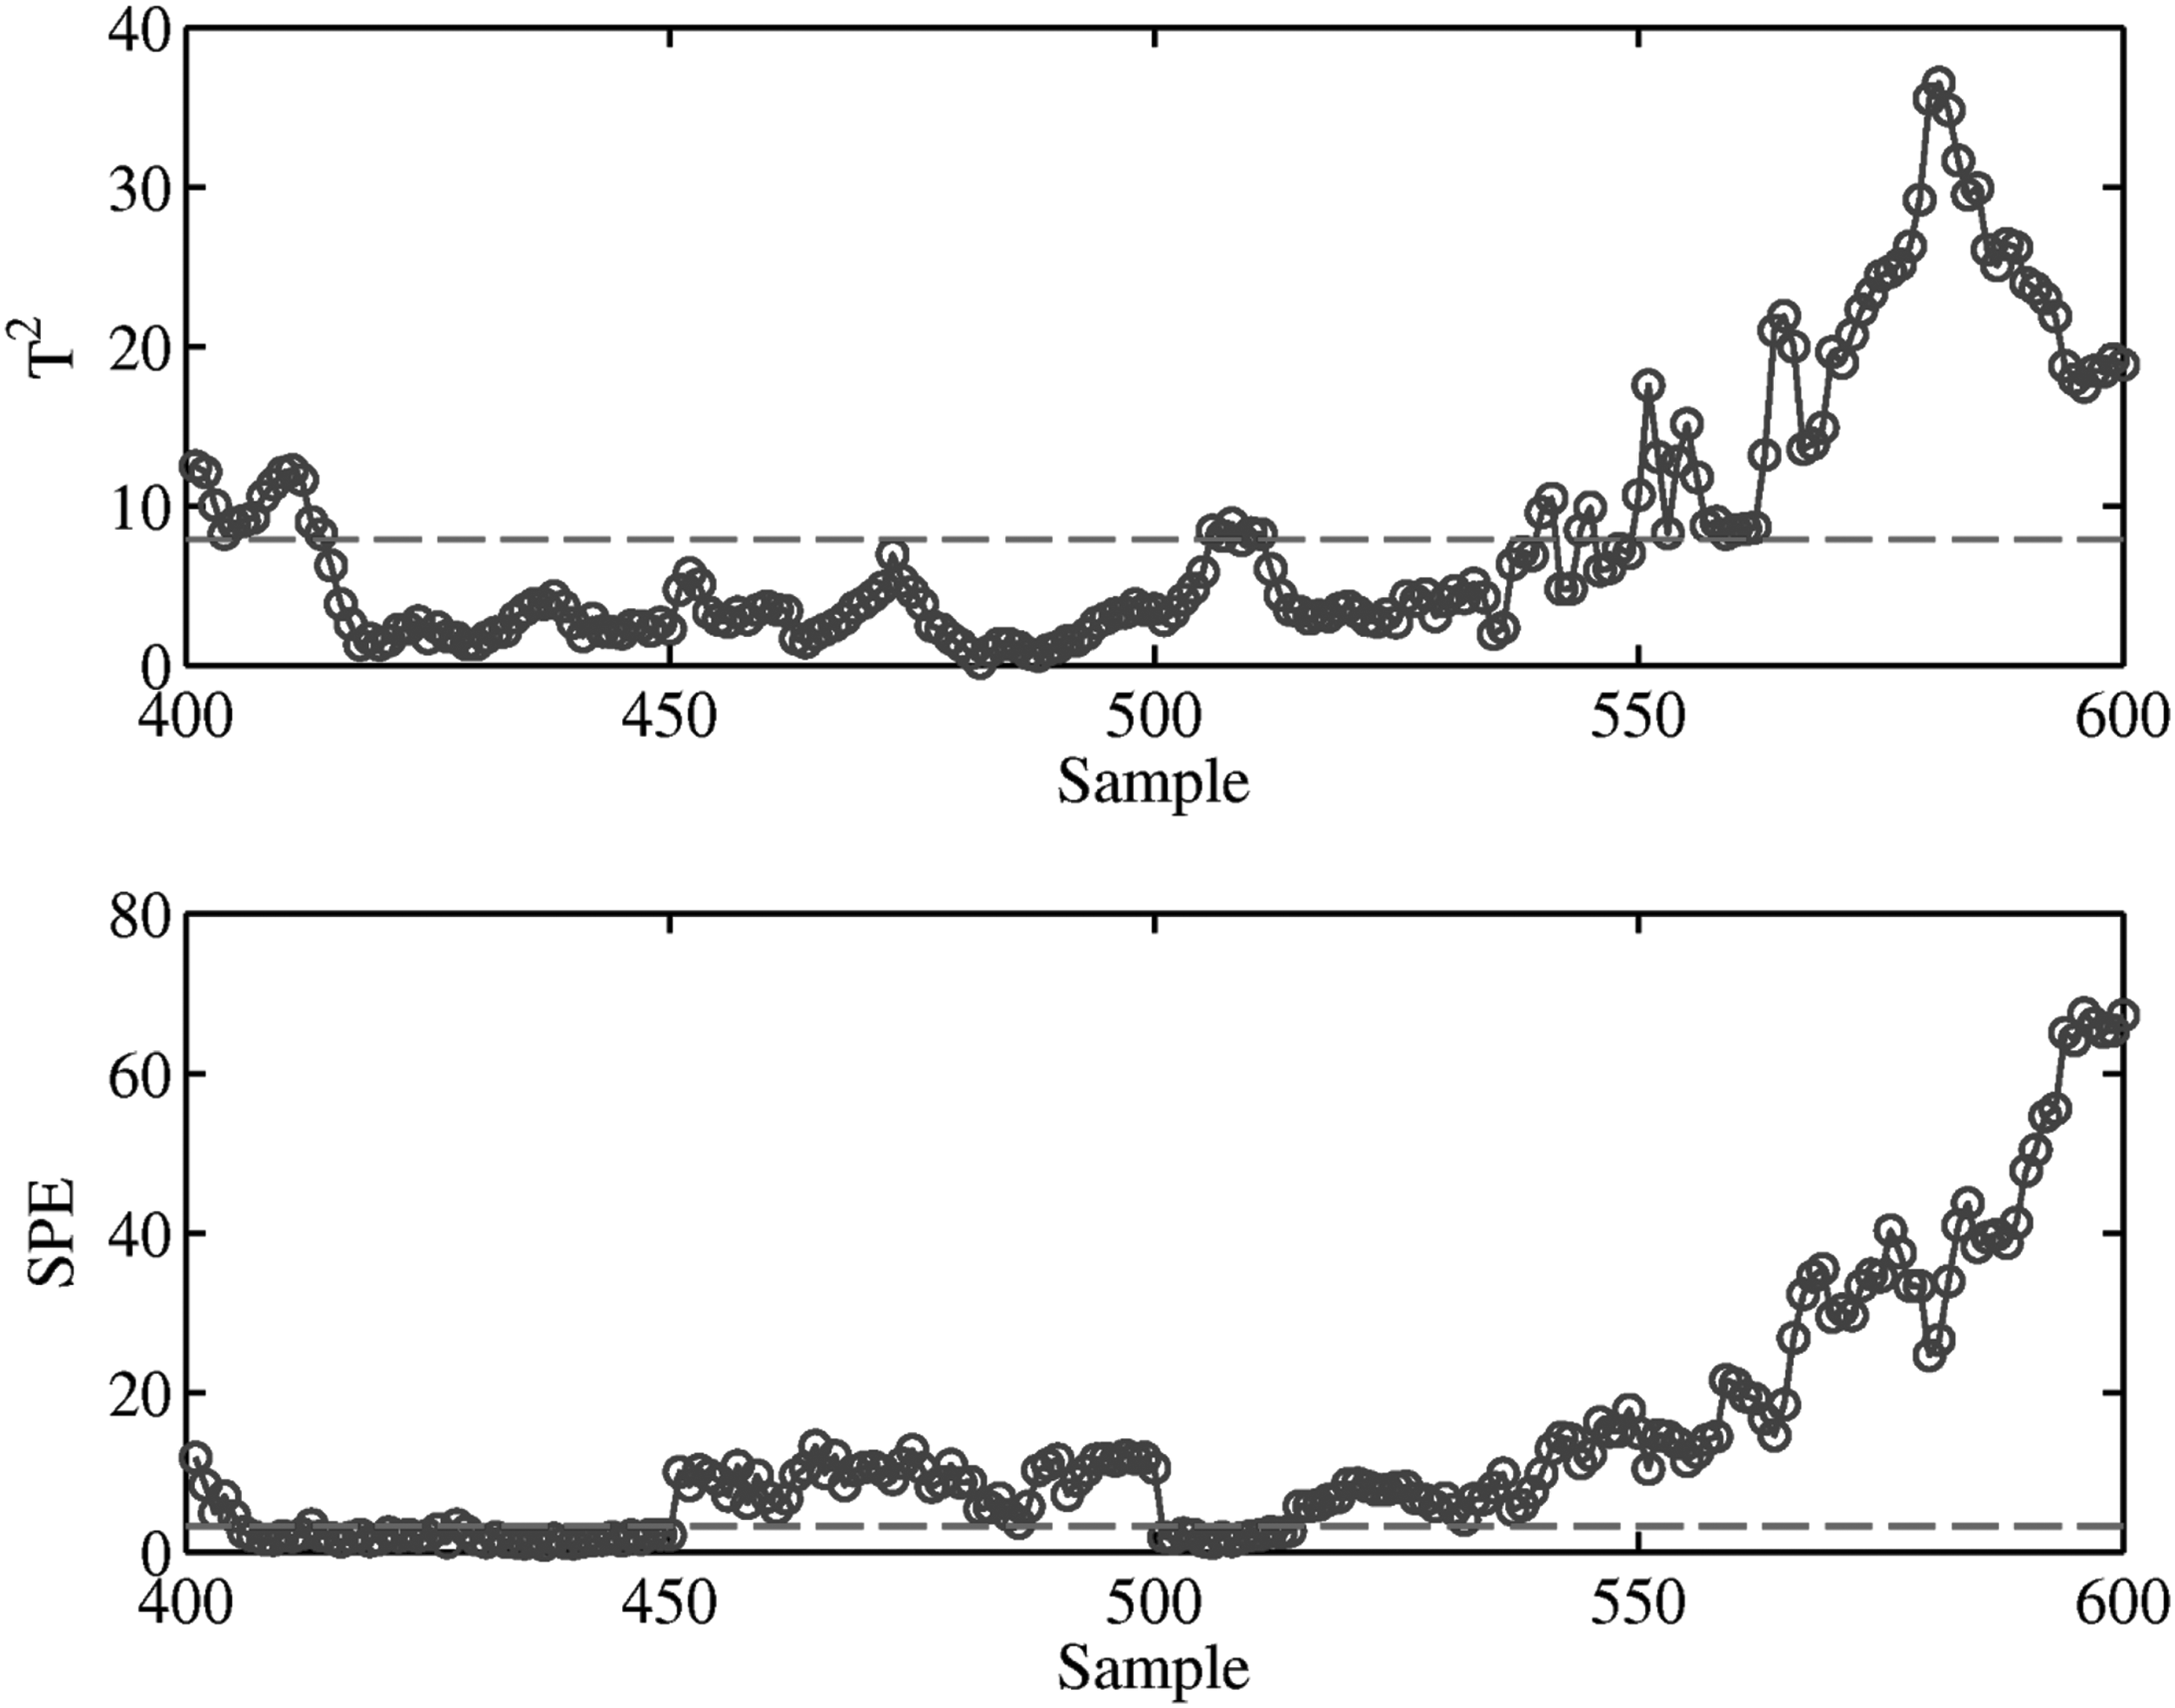
Process monitoring results of T2 statistic (top figure) and SPE statistic (bottom figure) for the PM10 bias and the temperature drifting sensor faults. SPE, squared prediction error.
The dimensionality reduction order r of LFDA has a significant effect on the diagnosing results when applied to the IAQ sensor fault diagnosis. Table 3 lists the misclassification rates of different LFDA order values when using the test data that contain the PM10 bias fault and the temperature drifting fault. The misclassification rates of the temperature drifting fault are much lower than those of the PM10 bias fault for the LFDA order values ranging from 2 to 7. The misclassification rate of the PM10 bias fault decreases significantly from 94% to 20% when the LFDA order r increases from 4 to 5. A minimum overall misclassification rate can be achieved when the reduction order of LFDA is 8, which is used in the following analysis. After the sensor fault detection step by PCA, the IAQ sensor fault discriminant index
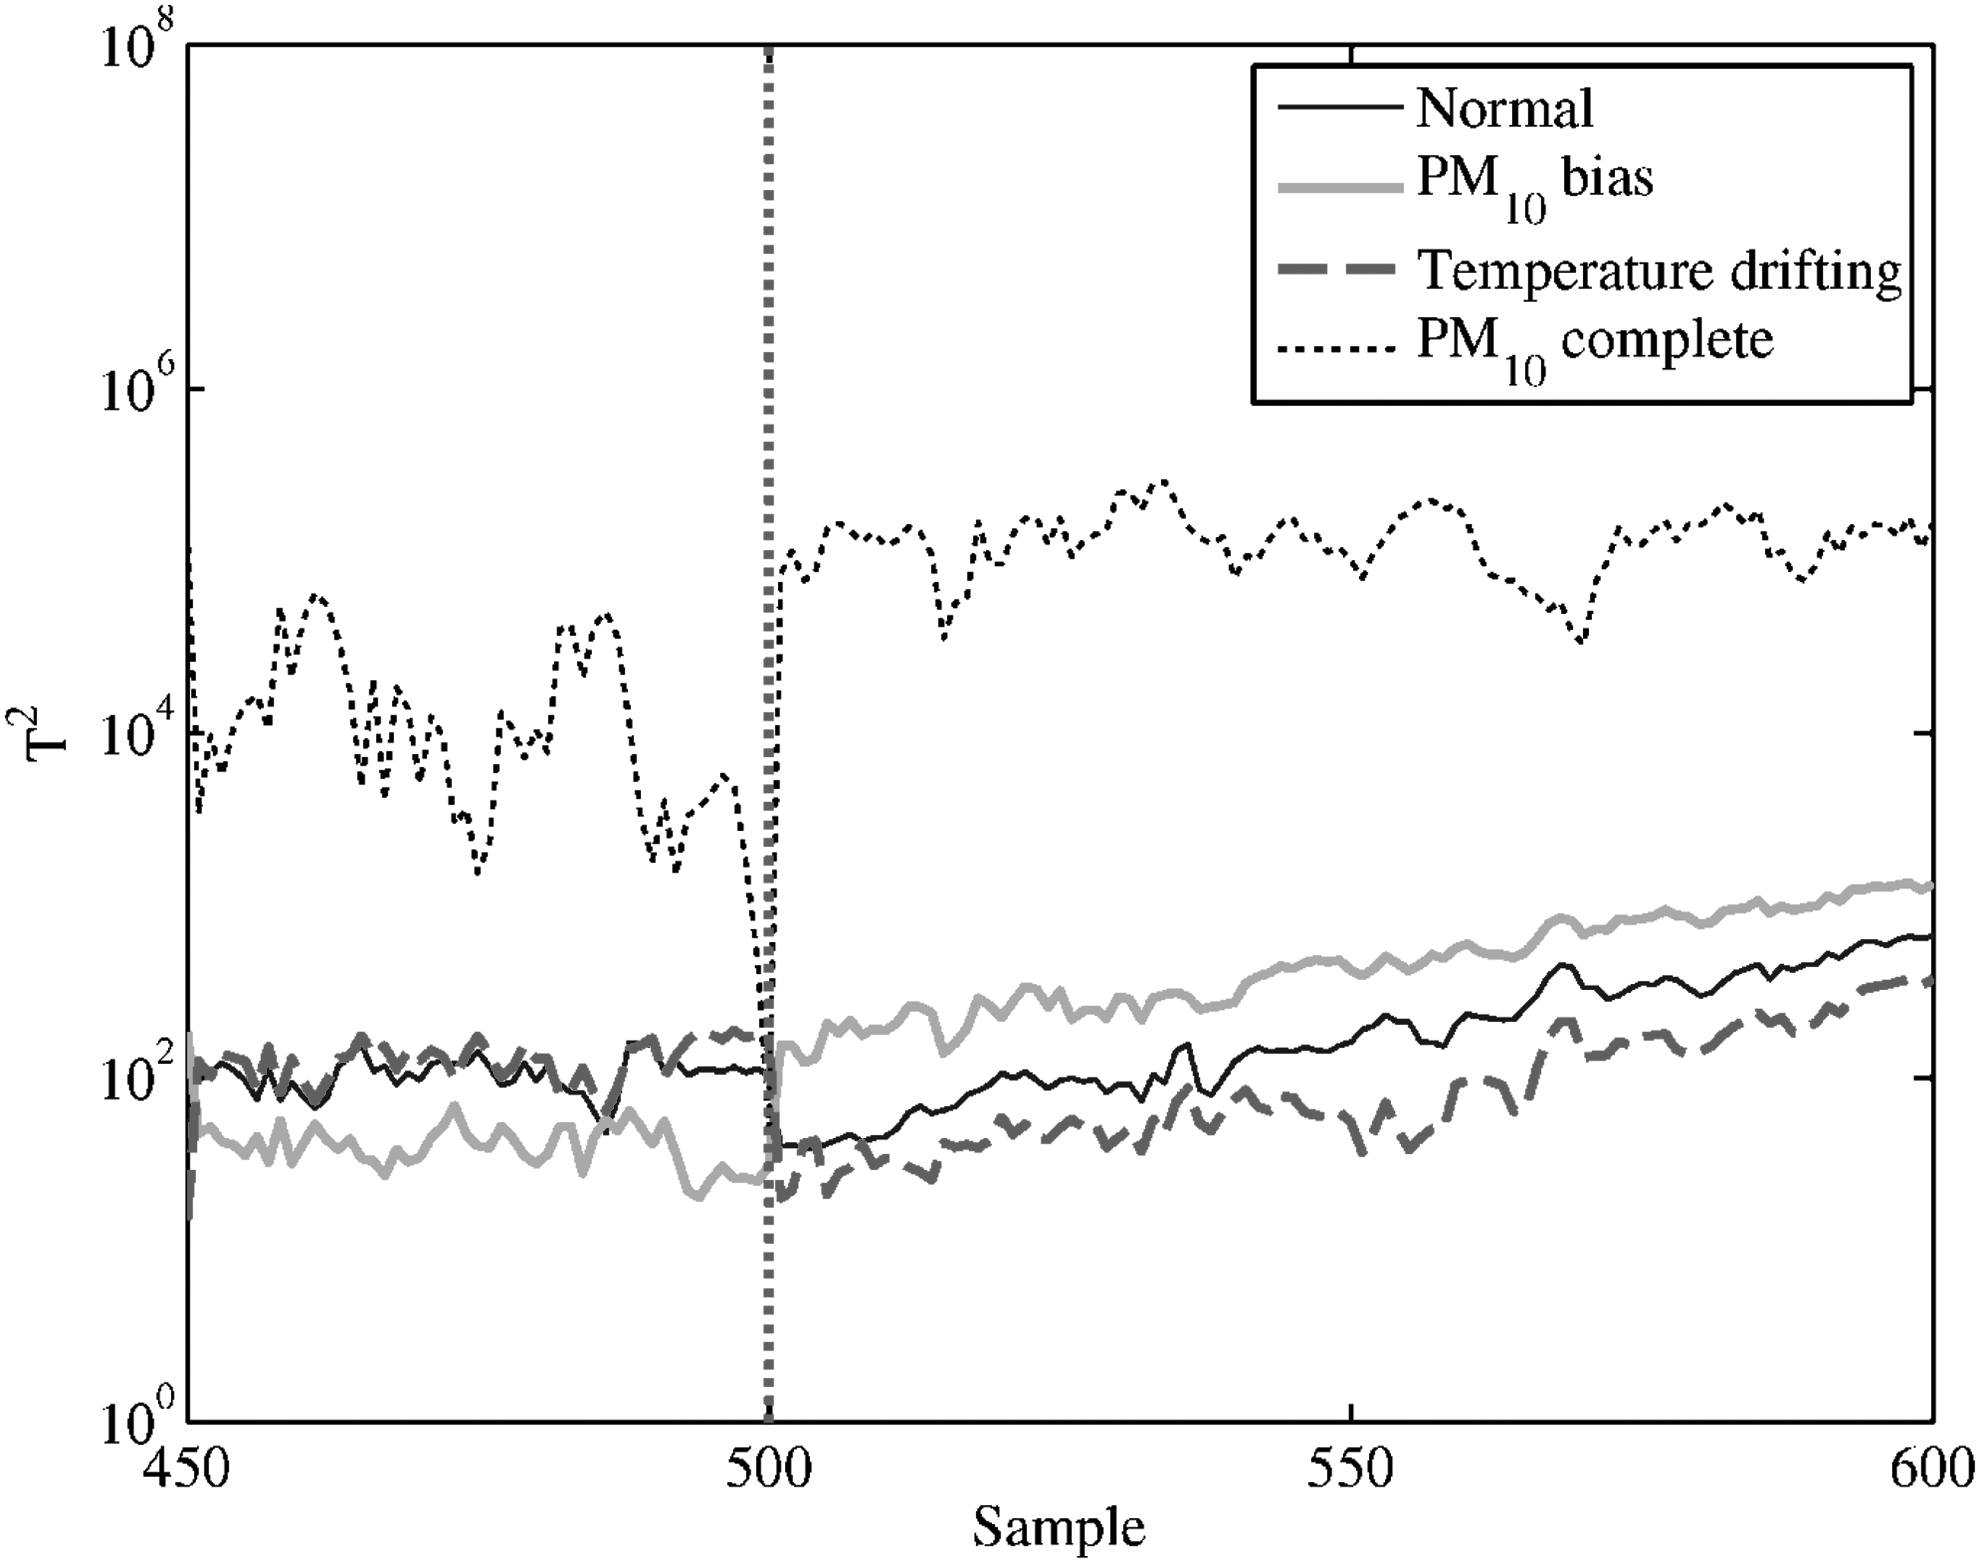
IAQ sensor fault discriminant index
LFDA, local Fisher discriminant analysis.
Alternatively, Fig. 8 shows a graph that can be used to diagnose the IAQ sensor faults in a more intuitive way. Three considered patterns of IAQ sensor faults are shown on the y-axis, and x-axis represents the detected faulty samples by the PCA monitoring statistics (Fig. 8). The fault diagnosis results using LFDA are satisfactory. Only 1 out of 50 samples is misclassified as normal condition when PM10 bias sensor fault occurs. In terms of temperature drifting sensor fault, 2 out of 100 samples cannot be diagnosed correctly, which leads to 2% Type-II error, and both of the samples are misclassified as normal condition. No samples are diagnosed as PM10 complete sensor failure, which indicates that the LFDA approach could perform accurately when dealing with this kind of IAQ sensor fault.
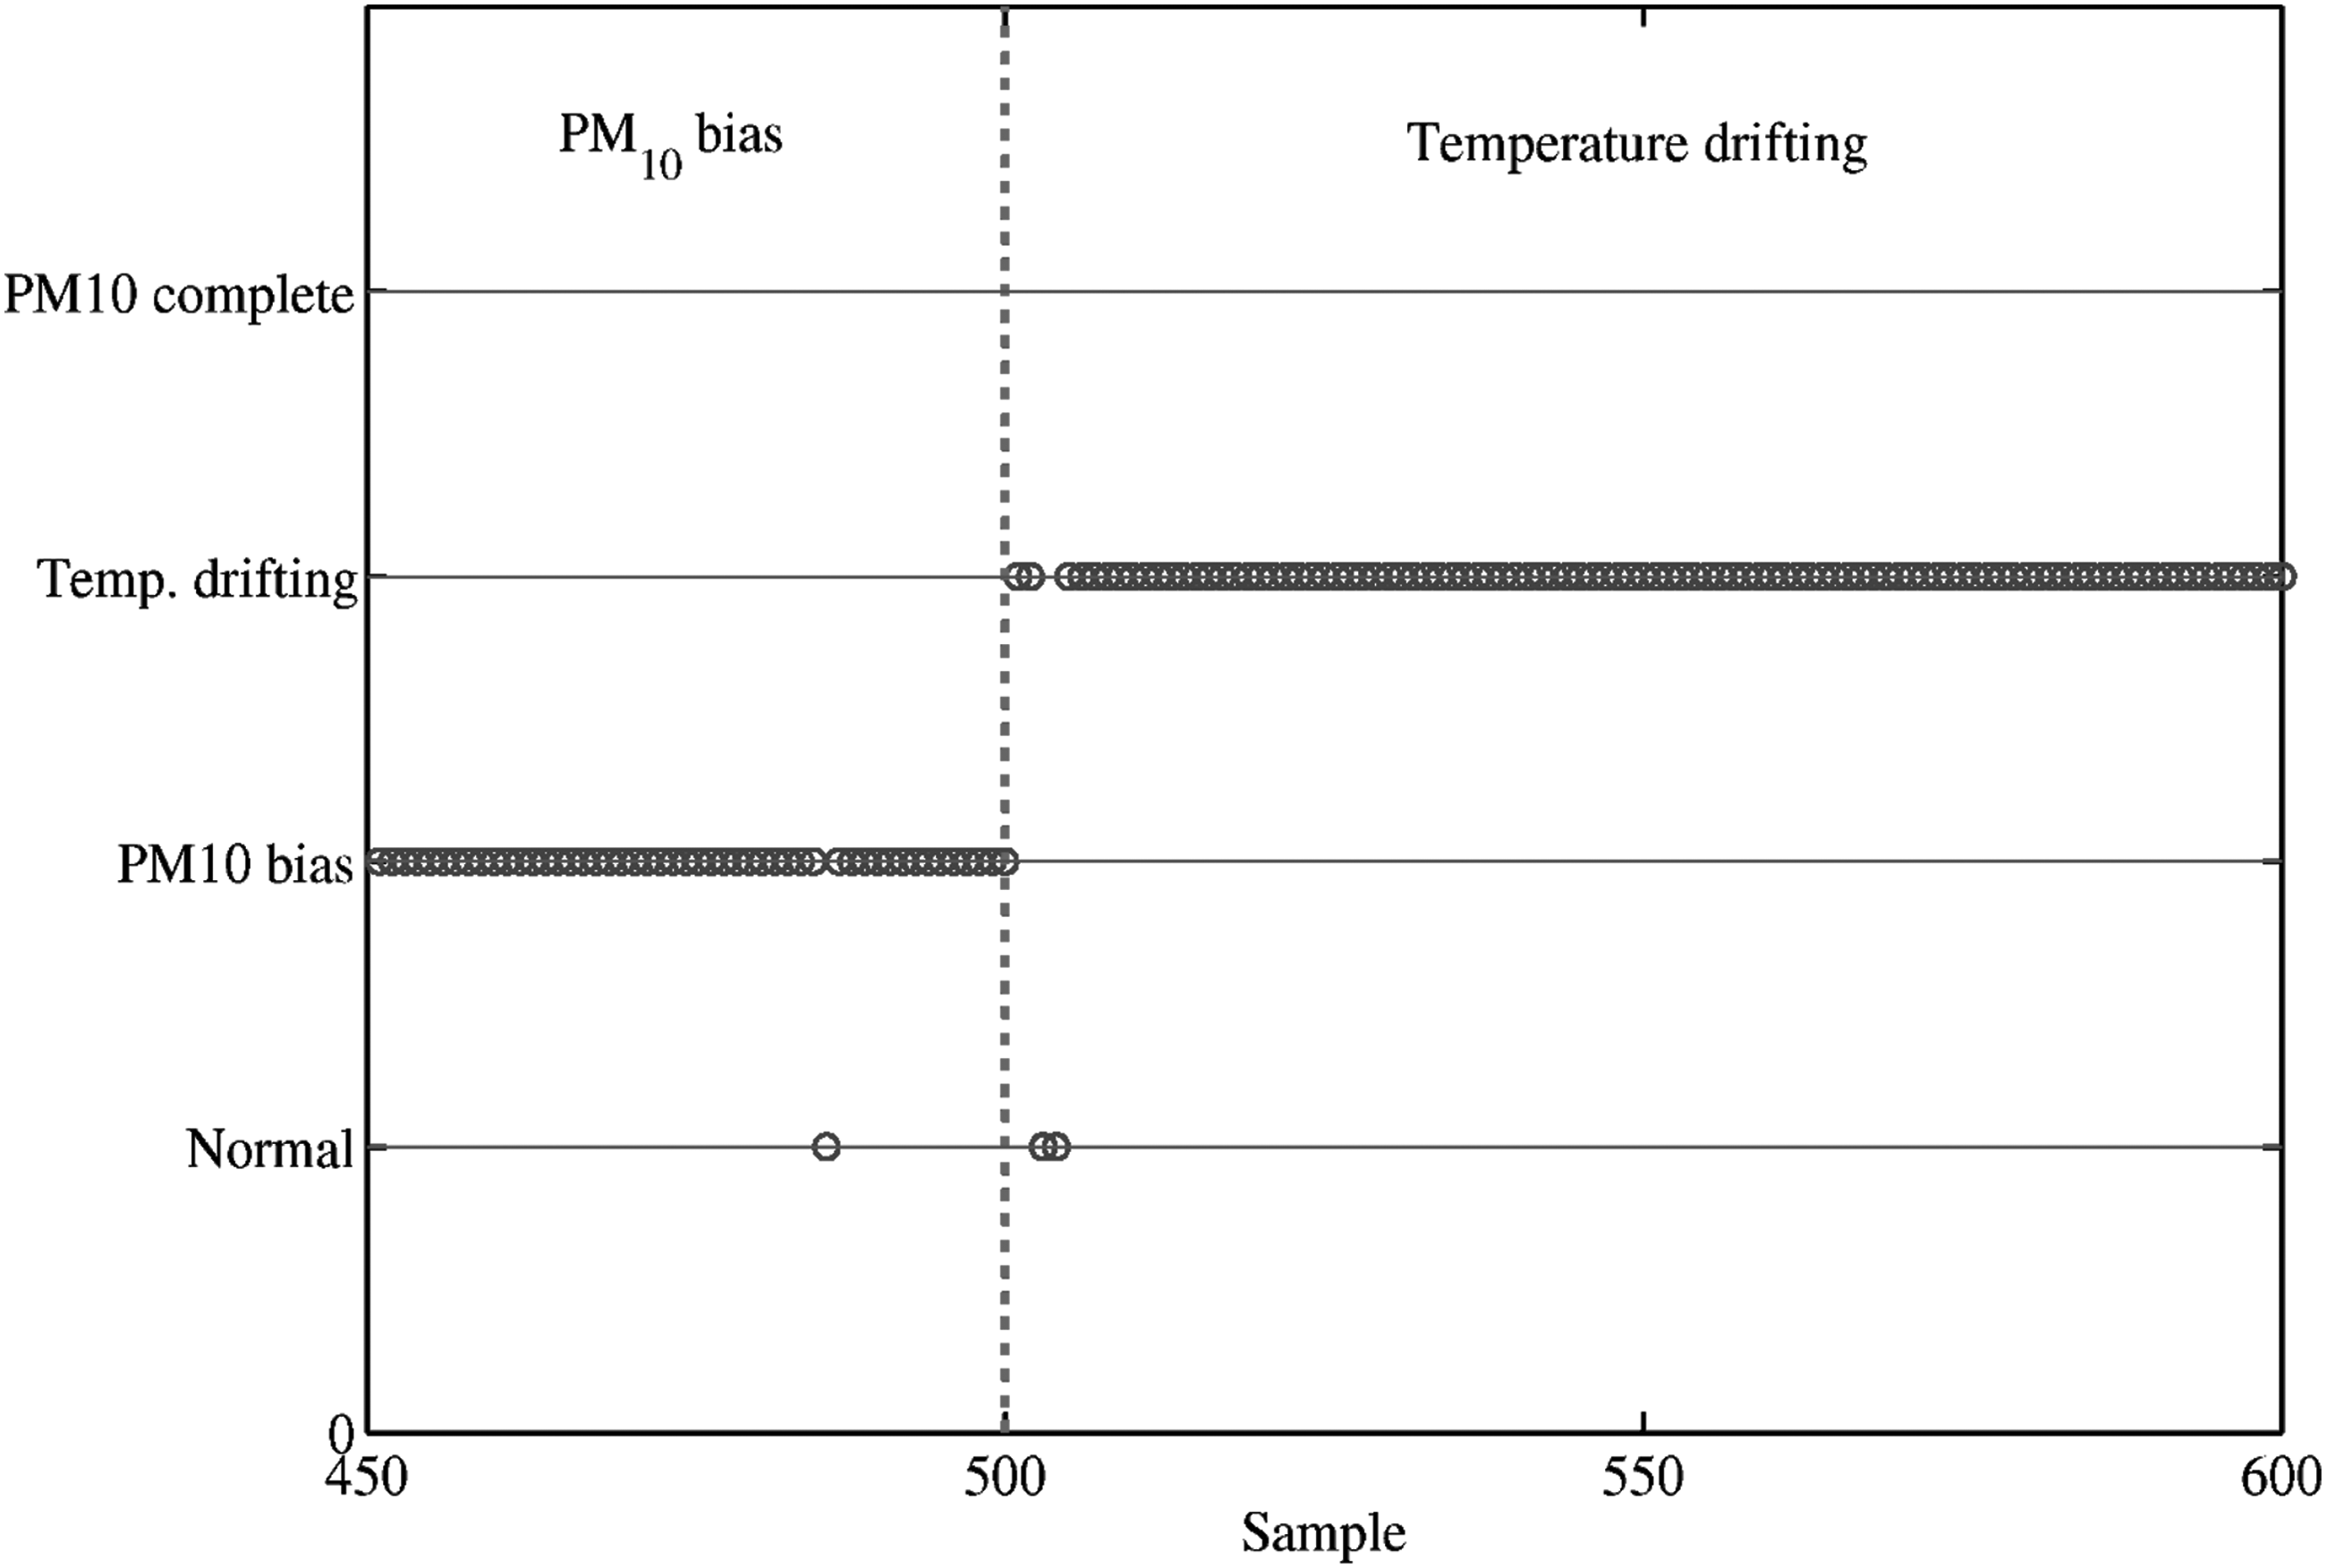
Fault diagnosis results using LFDA.
Conclusions
To maintain a stable and reliable monitoring system of indoor air pollutants, a data-driven FDD method is developed in this article to monitor and diagnose sensor faults in the subway IAQ management system. The diagnosing method combines PCA with LFDA. PCA monitoring tools consisting of SPE and T2 are used to detect three types of IAQ sensor faults. The detected faulty data are then diagnosed by the two- and three-dimensional visualization graphs of FDA and LFDA. The comparison of the visualization results shows that LFDA is more effective to separate multiple IAQ sensor faults than FDA. To quantitatively determine which IAQ sensor fault occurs, the discriminant index
Footnotes
Acknowledgments
This study was supported by the Foundation of Nanjing Forestry University (No. 163105996), Open Fund of State Key Laboratory of Pulp and Paper Engineering (Nos. 201813 and 201610), Open Fund of Jiangsu Provincial Key Lab of Pulp and Paper Science and Technology (No. 201530), and the National Research Foundation of Korea (NRF) grant funded by the Ministry of Science and ICT (No. 2017R1E1A1A03070713).
Author Disclosure Statement
No competing financial interests exist.