
Abstract
Abstract
Treatment of styrene-contaminated air using a combined process of microelectrolysis and biotrickling filter was studied in this article for the first time. Removal of styrene was higher than 95% and kept rather stable after the process reached a stable state. The active substance produced by microelectrolysis with an appropriate electric current presenting the synergy effect for the combined process, resulted in an improvement in the styrene removal. There exists an optimum electric current for the combined process. At the residence time (RT) of 108 s and the styrene inlet load of 15 g/(m3·h), when the electric current increased from 50 to 150 mA, styrene removal increased from 92.6–94.4% to 98.5–99.1%. When the electric current further increased to 200 mA, however, styrene removal reduced to 92.9–95.5%. When RT was 216 or 108 s and the styrene inlet load was 7.5 or 15 g/(m3·h), varying the styrene inlet concentration did not affect the styrene removal. The influence of styrene inlet concentration on the styrene removal gradually emerged with decrease of RT. At a relative low styrene inlet load (≤30 g/[m3·h]), styrene removal load increased linearly with increasing styrene inlet load. In addition, we found that the optimum pH value was relatively low (5.2) when the electric current (100 mA) was applied to the biological process.
Introduction
V
For a typical biological treatment process, air pollutants are first transferred into a biological film. The transferred pollutants are then degraded into salts, water, and carbon dioxide by microorganisms, including bacteria and fungi, which are immobilized in the biological film. In this regard, the efficiency of biologically based technologies is highly dependent on the water solubility and biological degradability of the VOC. Comparing to other biologically based technologies, biotrickling filters are especially suitable for the treatment of high volume and low concentration VOCs because it has high superficial area available for mass transfer. Álvarez-Hornos et al. (2011) reported that the removal of paint booth-emitted VOC is around 70% in a pilot-scale biotrickling filter at the VOC inlet load of 25 g/(m3·h). Li et al. (2012) found that the removal of acetone and methyl ethyl ketone (MEK) reached over 99%, while the removal of styrene was only 63% in a field-scale biotrickling filter. Currently, biotrickling filters still have difficulties in treating VOCs having poor water solubility and high inlet load.
Recently, microelectrolysis was combined with bioreactors to enhance the removal of pollutants by increasing biological degradability for wastewater treatment (Feleke and Sakakibara, 2002; Kim et al., 2011; Lapinsonnière et al., 2012). In such a combined system, electric current of microelectrolysis or electrodeposition should be controlled at a value high enough to enhance pollutant removal, but low enough to maintain the microbial activity (Kishimoto et al., 2008; Fan et al., 2009; Cui et al., 2012). For example, Flora et al. (1994) reported that the biological denitrification could be reached over 90%, and it was increased with an electric current until 20 mA, and then decreased with the further increase of electric current. Cao et al. (2001) found that the optimum electric current density for the suspended nitrobacteria was 5 A/m2, whereas that for biofilms with a special packing configuration was 15 A/m2. Recent studies have reported that the use of biofilm electrode reactor could also effectively enhance NOx removal from flue gas (Li et al., 2015; Xia et al., 2016; Zhang et al., 2018). However, at present, there are no relevant research reports on the use of combined process of microelectrolysis and biotrickling filters to treat VOCs.
In this article, we used the combination of microelectrolysis and a biotrickling filter to treat VOC for the first time. As compared with suspended-growth reactor, biotrickling filters can remove VOCs more efficiently due to much more microorganisms adhered on the packed materials (Datta and Philip, 2014). Styrene was used as a model VOC, because it is an important organic chemical material and is widely used in the industries of resin, plastic, and medicine. Styrene is also a typical VOC that is difficult to be biodegraded because it has poor water solubility.
Recent studies on styrene removal using biotrickling filters have been summarized in Supplementary Table S1 of Supporting Information. Yuan et al. (2012) found that when the inlet concentration of styrene was less than 20 mg/m3 and the RT was 48 s (2.2 g/[m3·h] inlet load), styrene removal was as high as 92% and the removed load was around 2 g/(m3·h) by using a biotrickling filter. Previous studies also found that the styrene removal load could be obviously increased by using surfactant and by optimizing the microorganism in the biotrickling filters (Rene et al., 2011; Song et al., 2012). The purpose of this study is to report a new approach to enhance the biological degradation of styrene. The effects of inlet concentration, RT, inlet load, and pH value of spraying liquid on the styrene removal were studied. The preliminary mechanism for the combined process of microelectrolysis and biotrickling filter for the removal of styrene was discussed.
Experimental Setup
The experimental setup consisted of a waste gas preparation system, a biological microelectrolysis reactor, and a measurement system. The biological microelectrolysis reactor (Fig. 1) was constructed in an organic glass vessel having a diameter of 120 mm and a height of 1,300 mm. The volume of the biological microelectrolysis reactor was 9.0 L. The biological microelectrolysis reactor was divided into two parts to prevent the compaction of the packed material. The packed materials were polyurethane plastic boxes having 20 mm in length and more than 5,000 m2/m3 in surface area. The biological microelectrolysis reactor was equipped with a spray device and a water pump, so that a nutrient solution could continuously spray to the packed materials. The flow rate of the nutrient solution was 45 L/h. The experiment was operated with a gas–liquid countercurrent operation. The packed materials were placed between a graphite plate (60 × 10 × 200 mm3) and a stainless steel plate (60 × 2 × 200 mm3), where the graphite plate and the stainless steel plate were used as an anode electrode and a cathode electrode, respectively. Two electrodes were connected with a 0–60 V adjustable direct current (DC) power supply (Shanghai regulator factory, SW-17). Flowmeters and gas sampling ports were equipped in the gas line of the biological microelectrolysis reactor. The flowmeters controlled the gas flow, and the sampling ports were used to sample the gas samples.
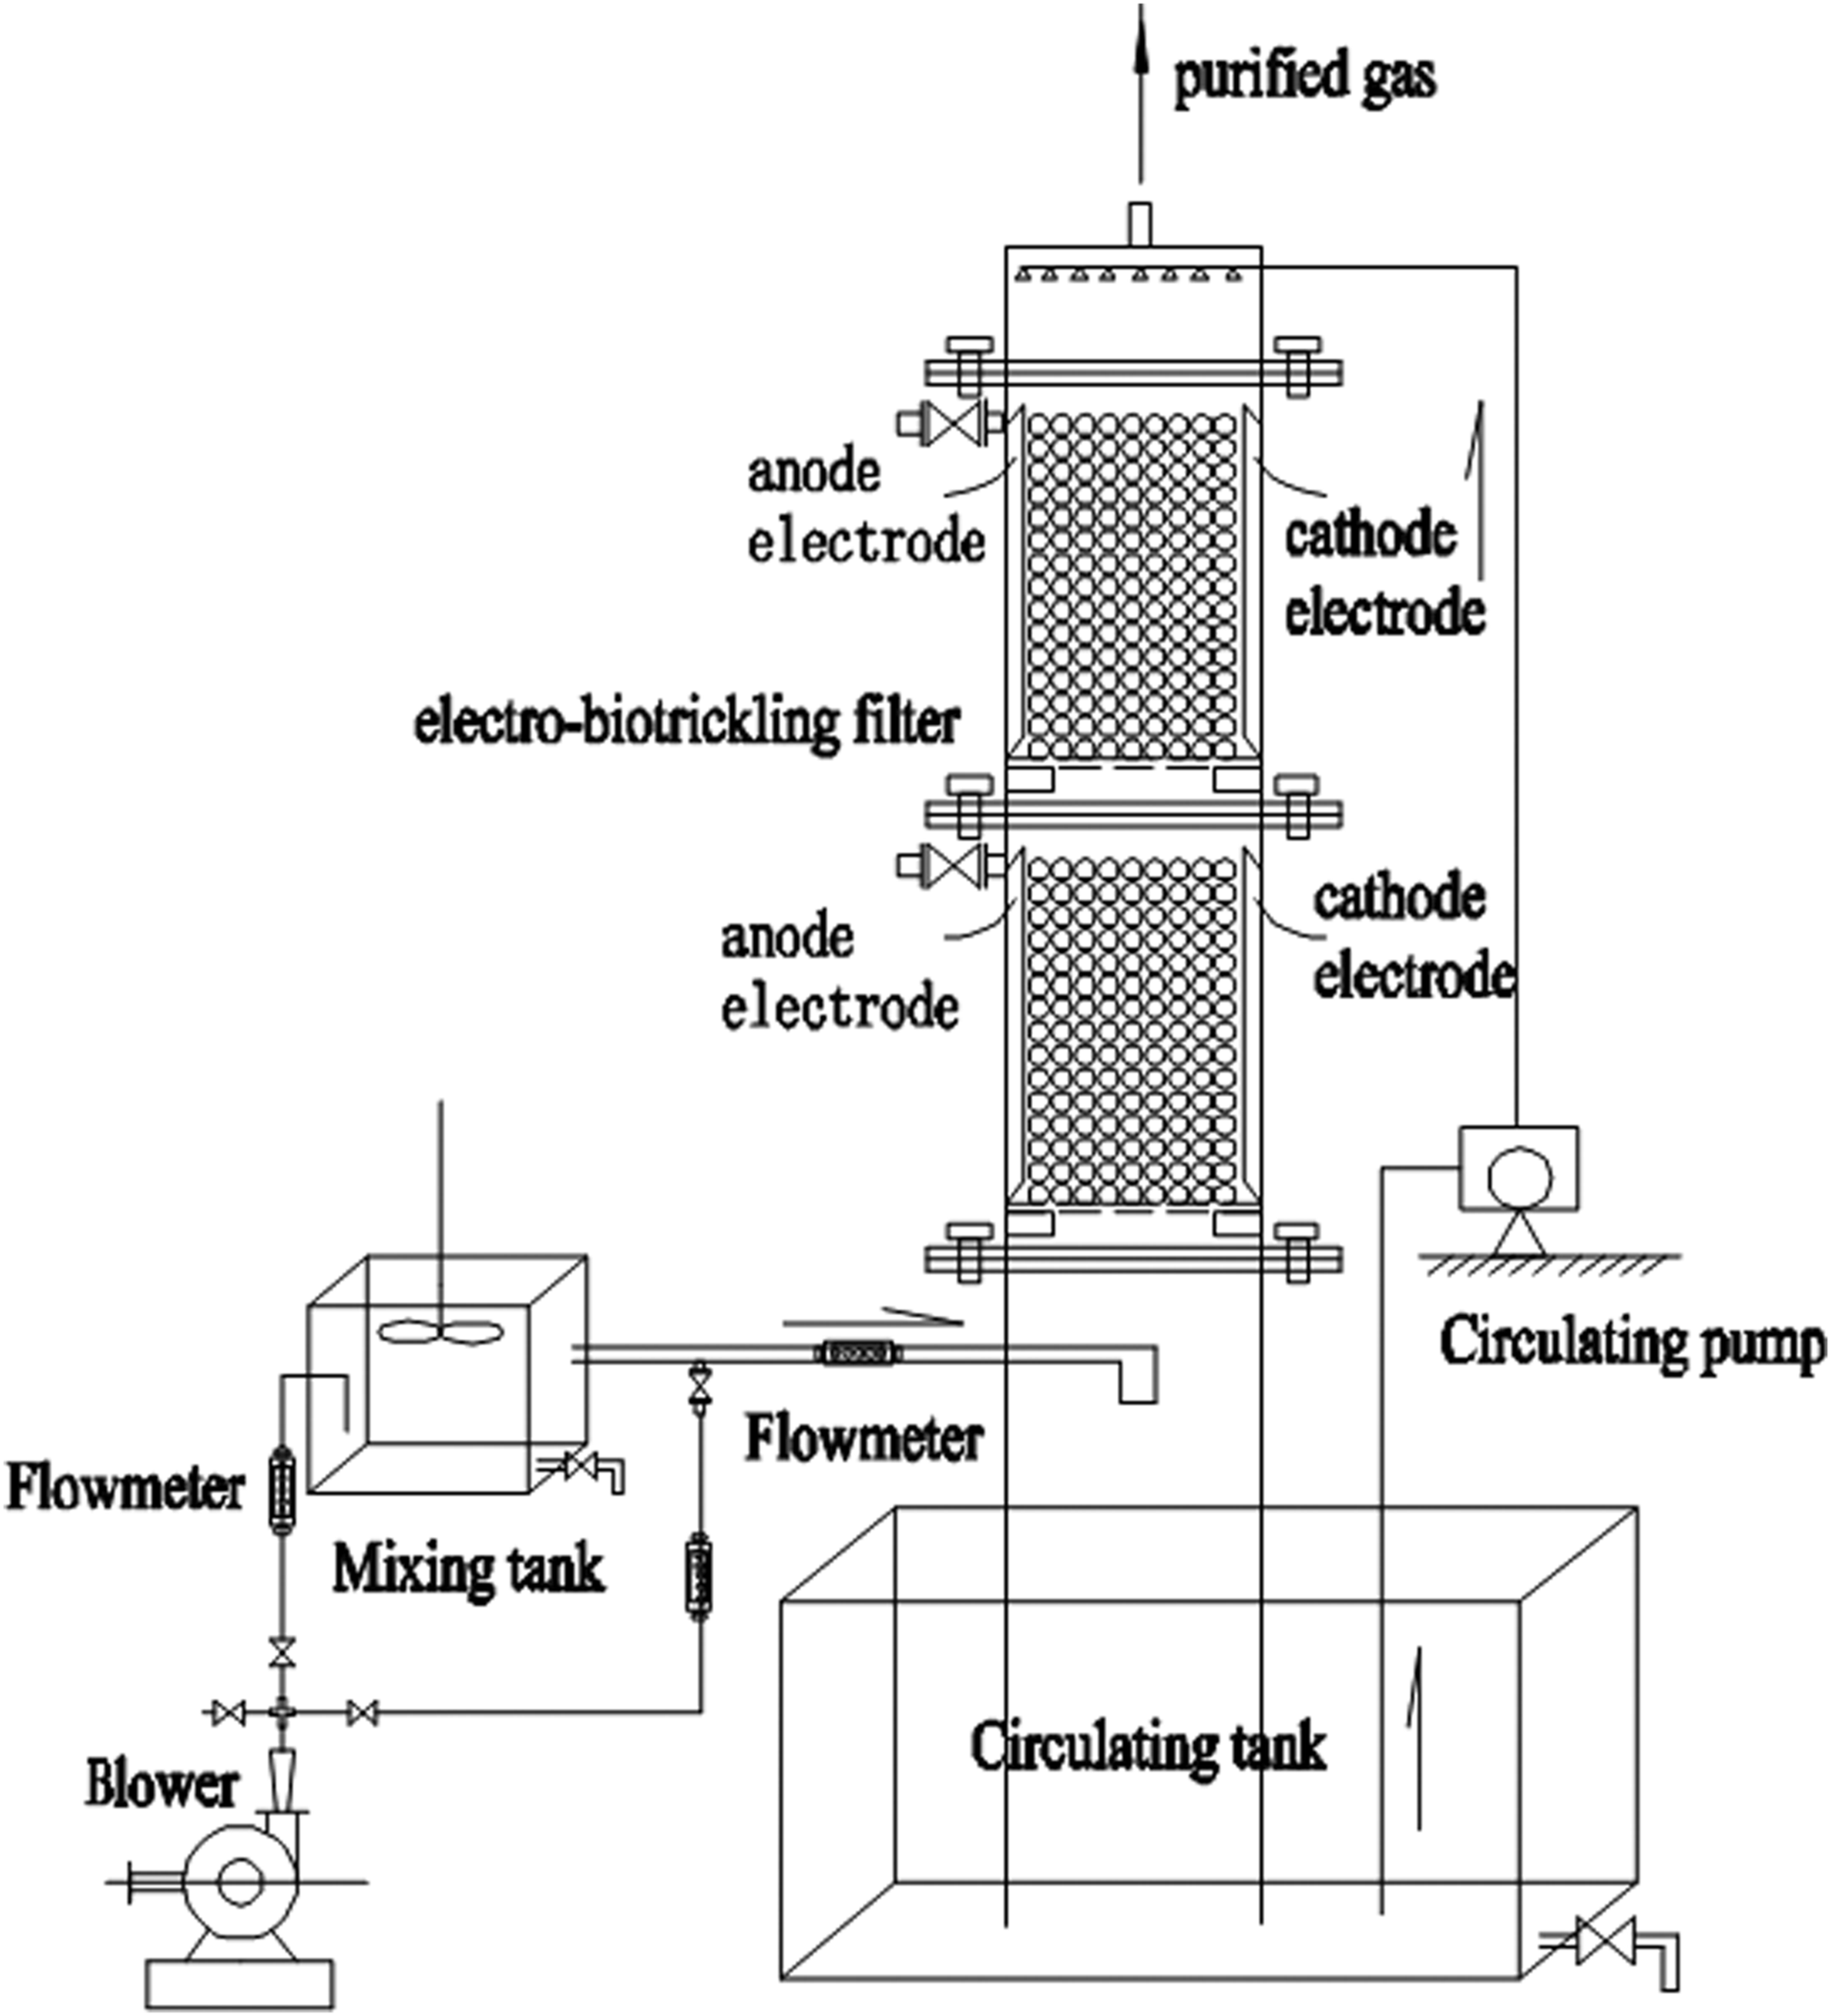
Schematic of experimental setup.
Before experiments, activated sludge, which was taken from a secondary sedimentation tank of a sewage plant (Southern municipal sewage plant, Ningbo), was inoculated and acclimated on the packed materials in the biological microelectrolysis reactor. During inoculation and acclimation period, the mixture of activated sludge and nutrient solution was continuously sprayed to the packed materials. Meanwhile, the DC power supply was switched on, and it supplied 15 V voltage and 50 mA electric current to the biological microelectrolysis reactor. The inoculation and acclimation period were completed when a high and stable styrene removal was observed. The mixed liquor suspended solids and the sludge volume after 30 min settling (SV30) of the activated sludge were 4,200 mg/L and 25%, respectively. During experiments, aqueous styrene (AR grade, >99%; Beijing Reagents Factory) was blown into the biological microelectrolysis reactor by an electric blower. To control the initial concentration of styrene, a designed portion of air was bypassed to a mixing tank filled with the AR. The temperature of the mixing tank was kept constant at 303 K by using a water bath. The experimental conditions were as follows: electric current was 0–200 mA, RT was 36–216 s, pH of circulating fluid (or spraying liquid) was 4.3–7.5 (alkalinity was between 0.4 and 1.0 mmol/L), inlet concentration of styrene was 320–548 mg/m3, the temperature of circulating liquid was kept at 30°C, and the 1/7 volume of circulating fluid was replaced every day. We note that the styrene inlet concentration used in this study is a typical styrene concentration in the resin and rubber industry. The composition of nutrient solution was as follows: 5,200 mg/L NH4Cl, 1,000 mg/L K2HPO4, 1,000 mg/L KH2PO4, 54 mg/L CaCl2, 0.5 mg/L FeCl3, and 10 mg/L MgCl2. When varying electric current, experimental data were typically recorded after 10 days of stabilization; according to a preliminary experiment, 10 days are sufficient to stabilize the experimental result. When varying styrene inlet concentration, RT, or pH value, however, 1–2 days are sufficient to stabilize the experimental result. The detailed working plan is shown in Supplementary Table S2.
Styrene concentration was measured by an online gas chromatography (GC; Thermo Fisher Scientific Company, TRACE 1300) equipped with a flam ionization detector (FID). Typical relative standard deviation for styrene measurement was less than 2%. The conditions for the GC measurement were as follows: inlet temperature 150°C, column temperature 105°C, and FID temperature 150°C. The samples were measured three times in parallel, collected by a 1 mL air sampler. Typical relative standard deviation for the presented data was 5%. The pH value was measured by a pH/ORP analyzer (HACH Science Instruments Company, P53).
Results and Discussion
Removal of styrene with combined process
Startup and stable running studies of the biological microelectrolysis combined process were operated for 60 days. Experimental operation conditions were as follows: gas flowrate was 0.3 m3/h (RT 108 s), pH of circulating fluid was 6.0–6.5, and the styrene inlet concentration was controlled between 320 and 548 mg/m3, voltage was 15 V, electric current was 50 mA, and energy consumption was 0.0025 kWh/m3.
The variation of styrene concentration and styrene removal are shown in Fig. 2. The styrene removal increased from 10% to 95% until 33 days, and then kept rather stable in the following 27 days. The result of styrene removal could be divided into two periods; the first 33 days was the startup period, and the latter 27 days was the stable operation period. According to the speed of styrene removal, the startup period could be further divided into three stages. The first stage lasted about 7 days, during which the styrene removal increased from 10% to 20% at a relatively low and unstable speed. In this stage, microorganism was introduced into the fresh medium; it took some time to adjust with the new environment. In the second stage, the styrene removal rapidly increased from around 20% to 70% within 13 days. In this stage, microorganisms might be gradually adapting to the microelectrolysis environment in the biological microelectrolysis reactor, which was characterized by the rapid growth of the microorganism and the rapid increase of styrene removal. In the third stage, the microorganism might have adapted to the environment of the combined process, and thus the styrene removal slowly increased from 70% to 95% (took 13 days).

Time resolved of styrene removal during startup and stable operation period.
Styrene removal was stable at >95% from the 33rd day of the experiment, and thus the startup period of the biological microelectrolysis combined process was complete. Previous studies have shown that the startup period in the biotrickling filter was typical between 7 and 45 days, which depends on the type and concentration of the microorganism and the kind of pollutants (Jiang and Tay, 2010; Cheng et al., 2011; Omri et al., 2011; Qian et al., 2011; Zhou et al., 2011; Sha et al., 2013). We note that the time to achieve steady-state (startup period) is relatively long as compared with other studies as shown in Supplementary Table S1 of Supporting Information. This relatively long startup period was also observed in water treatment using a biological microelectrolysis reactor (Cao et al., 2001), and it might be due to the use of microelectrolysis; microorganism might require longer time to adapt the environment having microelectrolysis. In the stable operation period (after 33 days), the averaged styrene removal was 95.3%, and the averaged styrene outlet concentration was 16 mg/m3.
Effect of RT on styrene removal
Effect of RT on styrene removal was studied under 15 V voltage, 50 mA electric current, 0.0008–0.005 kWh/m3 energy consumption, 6.0–6.5 pH of circulating fluid, and 320–585 mg/m3 styrene inlet concentration. We note that no styrene removal was observed in the condition without microorganism. At the same styrene inlet concentration (Fig. 3), the styrene removal increased with the increase of RT, which requires a greater volume of the biological microelectrolysis reactor for a given gas flowrate, and thus increased investment cost. The styrene removal was almost unaffected by the varying of the styrene inlet concentration when RT was 216 or 108 s. However, at RT of 36 or 54 s, the styrene removal decreased with the increase of styrene inlet concentration. In the tested range of RT, 108 s was considered as a reasonable value as the styrene removal was high at this relatively low RT. In addition, at 108 s RT, when the styrene inlet concentration increased from 320 to 585 mg/m3, the styrene removal only decreased from 95.3% to 93.9%. We note that the styrene removal with electric current was always higher than that without electric current at the same experimental condition (RT and inlet concentration).

Effect of RT on styrene removal. RT, residence time.
Effect of inlet load on removal of styrene
Effect of styrene inlet load on the removal of styrene was investigated when the voltage was 15 V, electric current was 50 mA, energy consumption was 0.0008–0.005 kWh/m3, and RT varied between 36 and 216 s. As shown in Fig. 4, the styrene removal load (defined as gas flowrate × removed styrene concentration/reactor volume) of the biological microelectrolysis combined process increased linearly with the increase of styrene inlet load (defined as gas flowrate × inlet styrene concentration/reactor volume), until the styrene inlet load of 30 g/(m3·h); further increase of the styrene inlet load led to the increase of styrene removal load, which gradually decreased and deviated from the linear trend, and finally approached a constant value of 33 g/(m3·h), regardless of the specific RT. In addition, we found that at the same styrene inlet load, the styrene removal load with electric current was always larger than that without electric current.
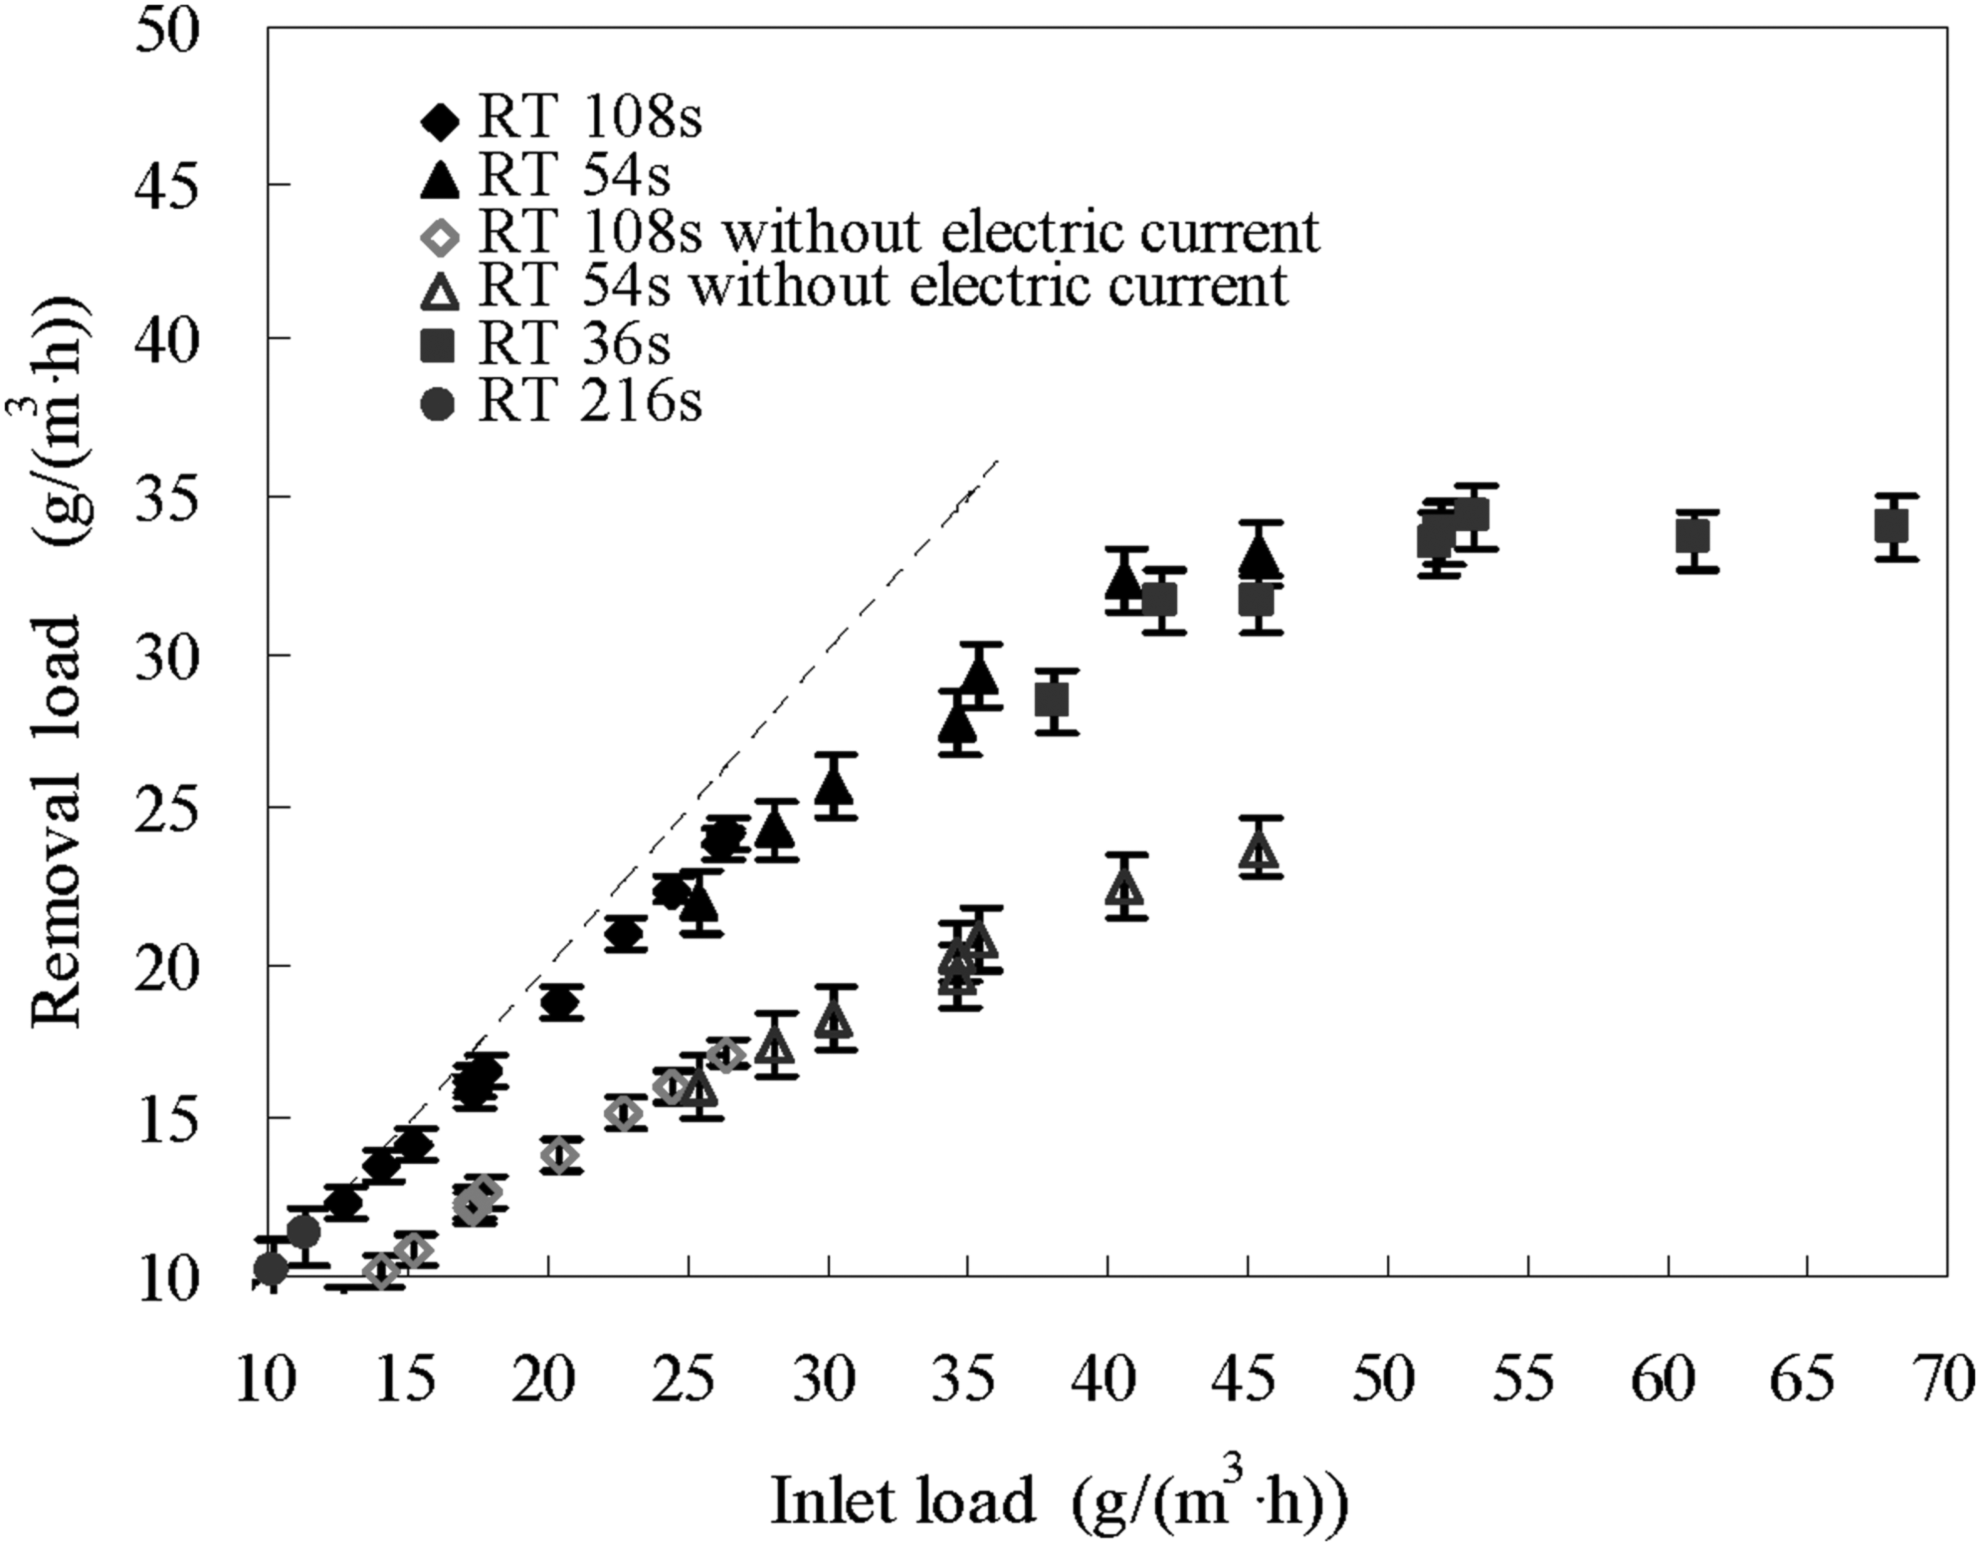
Effect of styrene inlet load on styrene load.
Increasing styrene inlet load increased the mass transfer rate of styrene, and the styrene molecules rapidly transferred into biofilm. Macroscopically, the styrene removal was stable, and the styrene removal load was increased. However, further increases of the styrene inlet load resulted in the molecular mass transfer rate to reach a maximum value, and then the rate of the biological degradation of styrene became a rate-limiting step. The styrene removal load tended to reach a certain value because the amount of microorganism was limited in the system.
Effect of electric current on styrene removal
The effect of electric current on the removal of styrene was investigated at fixed RT = 108 s as shown in Fig. 5. At the beginning (62th–73th day), no external electric current was applied and the styrene removal was varied between 67.7% and 71.7%. From the 74th day, the electric current was adjusted to 50 mA (15 V voltage, 0.0025 kWh/m3 energy consumption) without changing other conditions, and the styrene removal gradually increased to 92.6–94.4%. The styrene removal was further increased to 96–97.5% and 98.5–99.1% when the electric current was 100 mA (29 V voltage, 0.01 kWh/m3 energy consumption) and 150 mA (44 V voltage, 0.02 kWh/m3 energy consumption), respectively.
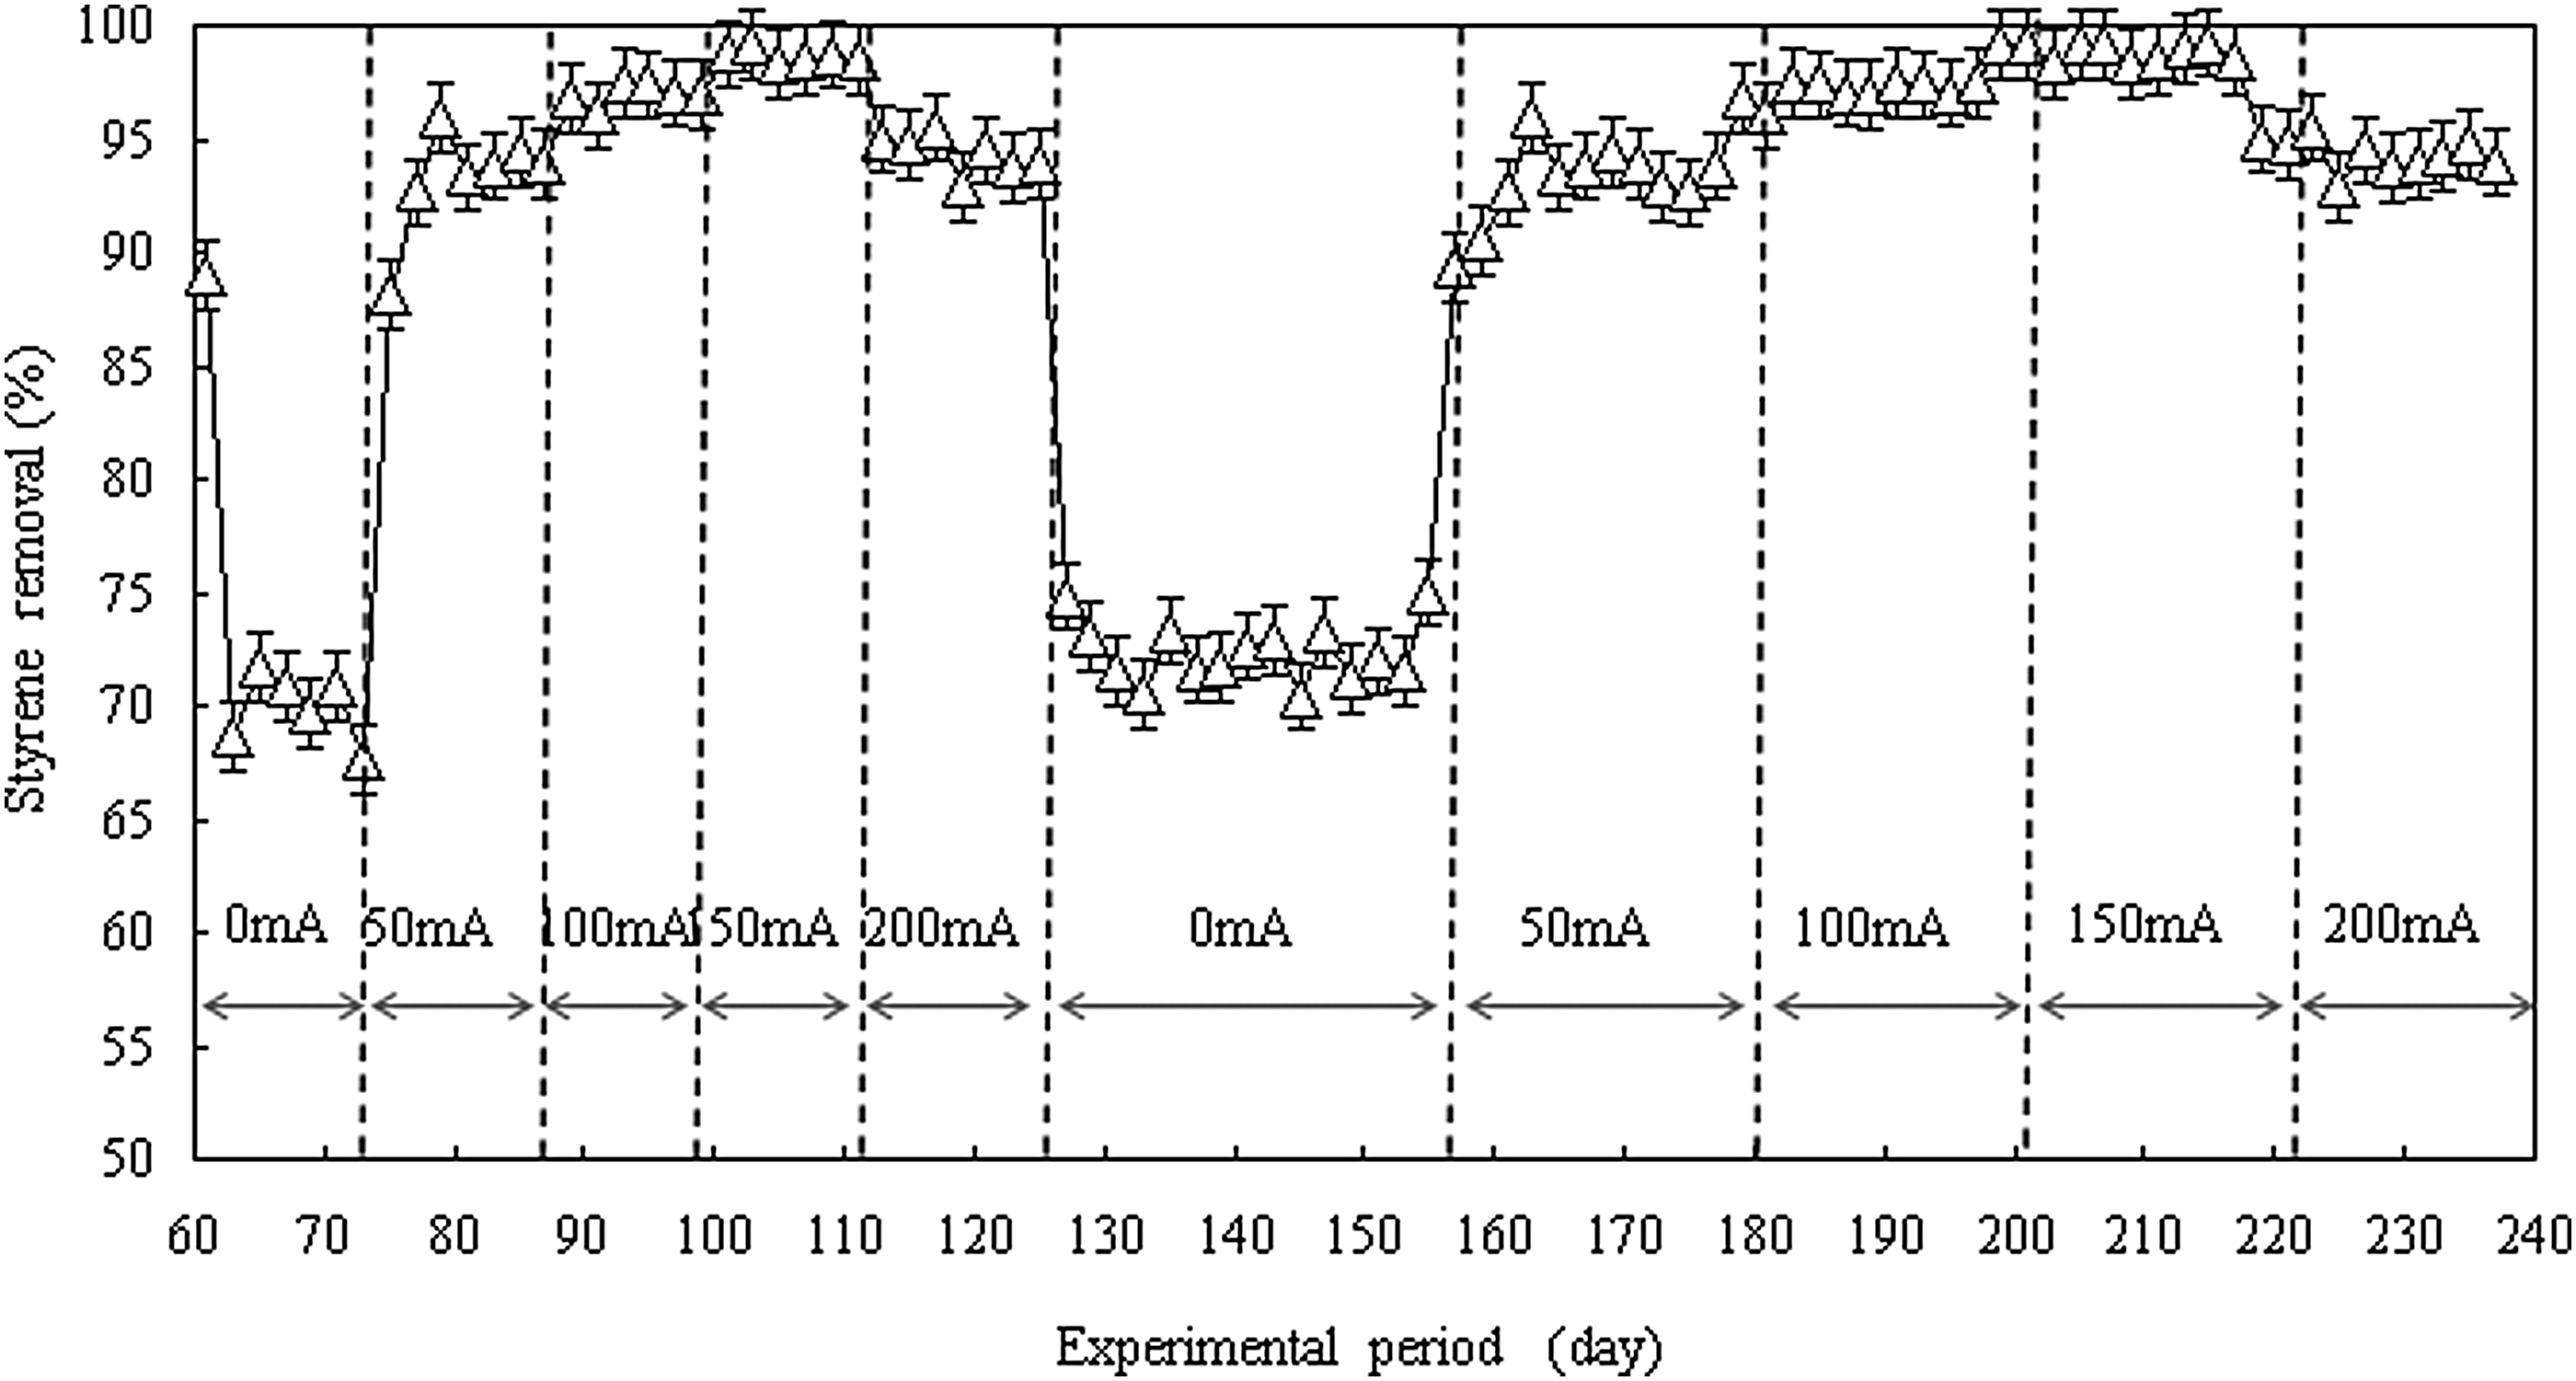
Effect of electric current on removal of styrene.
However, from the 113th day, when the current intensity reached to 200 mA (59 V voltage, 0.04 kWh/m3 energy consumption), the styrene removal decreased to 92.9–95.5%. In addition, we investigated the styrene removal under different electric currents with longer experimental period (from 125th to 237th day). The result is consistent with a previous experimental period (from 62nd to 125th day).
Effect of pH value of spraying liquid on removal of styrene
Effect of the pH value of spraying liquid on the removal of styrene was investigated at fixed RT = 108 s. Figure 6 shows that the maximum styrene removal in the biological process was 73.5% without the electric current when pH value was 6.3, and the maximum styrene removal was 65.2% when the pH value was 4.9. At an electric current of 50 mA (15 V voltage, 0.0025 kWh/m3 energy consumption), the maximum styrene removal in the biological microelectrolysis combined process was 95.3% when pH value was 5.8, and the styrene removal decreased whenever pH increased or decreased. At an electric current of 100 mA (29 V voltage, 0.01 kWh/m3), the maximum styrene removal in the combined process was 98.5% when pH was 5.2, and the styrene removal clearly decreased to 78.6% when pH was 4.3.

Effect of pH value of spraying liquid on styrene removal.
These results demonstrated that the effect of the pH value of spraying liquid on the styrene removal was complicated. The optimal pH of the experiment was more acidic under the condition with electric current than the condition without the electric current, and the greater the electric current, the more acidic the optimal pH value.
When there was no electric current applied to the reactor, styrene removal was completed due to the microorganism, and the electron donors and the energy required by the metabolic processes were obtained from the carbon source and the nutrient solution. The optimal pH value of the biological reaction was equal to 6.3, and styrene removal by microorganism was decreased if the pH was too high or too low. When the electric current was applied, the removal of styrene resulted from both the biological reaction and electrocatalytic reduction, which required the participation of hydrogen ions. Thus, the pH was more acidic, in which condition the electrocatalytic reduction rate of styrene was faster. When the pH was too small, the metabolism of microorganisms would be affected, and the microorganism degradation of styrene rapidly dropped.
Discussion
Biological microelectrolysis combined process has been applied in wastewater treatment, but it has not been applied in the VOCs treatment. In this study, we have shown that the use of electric current could pronouncedly increase the biological removal of gaseous styrene; at the same styrene inlet concentration and RT, the styrene removal with electric current (e.g., 50 mA) was typically 40% higher than that without the electric current in a biotrickling filter. Note that no styrene removal could be observed using electric current but without microorganism. It is worth mentioning that the RT (36–216 s) in this study is not short as compared with the RT (15–120 s) reported in literature when the styrene inlet load (5–45 g/[m3·h]) and styrene removal (>90%) was in a similar level (Supplementary Table S1 of Supporting Information). In the future study, biotrickling filter will be optimized (such as adding surfactant and optimizing microorganism) to further decrease the RT.
Regarding the effect of electric current, when the electric current increased from 50 to 150 mA, the styrene removal increased from 92.6–94.4% to 98.5–99.1%. This result implied that the electric current promoted or slowed down microorganism growth. We note that the cell number (counted by the flat colony counting method) was not significantly changed when electric current was used; the cell number with and without microelectrolysis were 6.2 × 10⁷ and 8 × 10⁶ CFU/g, respectively. The diffusion of ions due to concentration difference was the driving force for the mass transfer when no electric current was applied. After applying the electric current, the positive electric field strength and the concentration difference across the biological filter were in the same direction, and thus the driving force of mass transfer and the ion diffusion rate was enhanced (Flora et al., 1994; Li et al., 2001; Santoro et al., 2014). The nutrient substance could easily pass through the cell membrane, which promoted microorganism growth (Cao et al., 2001). The biological removal of styrene was promoted by the external electric current, which can promote the growth of microorganisms through electrochemical processes or electrolysis reactions.
Alternatively, the existence of microorganisms changed the adsorption and transformation process of the materials on the electrode surface. The electrode adsorbed the ionic complexes through electrophoretic phenomenon, which could remove the harmful metabolites produced in biodegradation process, and maintain a good environment for microorganism growth.
However, there was an optimal value of the electric current (150 mA) for the enhancement of styrene removal. Below the optimal electric current, the microorganisms might not be sufficiently activated. Above the optimal electric current, the styrene removal was decreased. The decrease in pollutant removal at higher electric current was also observed by Cao et al., (2001) who studied the effect of electric current on the metabolism of nitrifying bacteria in water treatment. They proposed that the negative effect of higher electric current was attributed to a higher electric potential across the microorganisms; the microorganisms would be deactivated when a 0.4–2 V electric potential was established on the microorganisms. However, more studies are required to elaborate this decreased styrene removal at the higher electric current.
Notably, at the optimized electric current, the increased energy consumption per volume of treated gas due to the use of microelectrolysis was as low as 0.001 kW·h/m3, which occupies only around 10% of the total energy consumption per volume of treated gas (including microelectrolysis, electric fan, and water pump). In this regard, biological microelectrolysis combined process has great potential for the practical application from the point of economic view.
Conclusions
Treatment of styrene-contaminated air using the combined process of microelectrolysis and biotrickling filter has been investigated. It is found that the use of microelectrolysis could obviously enhance styrene removal. However, there existed an optimal electric current for the combined process. The styrene removal load of the combined process initially increased linearly with the increase of styrene inlet load, and then deviated from the linear trend, tending to approach a constant value. The optimal pH of the experimental was more acidic under the condition with electric current than the condition without the electric current, and the greater the electric current, the more acidic the optimal pH value. Our findings could be potentially helpful in the development of cost-effective and practical biotrickling filter system for VOCs removal.
Footnotes
Acknowledgments
This work was supported by the National Natural Science Foundation of China (11775189, 51408551), the Science and Technology Project of Zhejiang Province (2016C33015), the Public Welfare Research Projects in Zhejiang Province (No. 2017C33042, 2017C37071), the open fund of priority among priorities of biological engineering in Zhejiang Province (KF2017004), Zhejiang College Students' Science and Technology Innovation Activity Plan (2017R420009), and the Science and Technology Project of Ningbo city (2015C50002).
Author Disclosure Statement
No competing financial interests exist.
References
Supplementary Material
Please find the following supplemental material available below.
For Open Access articles published under a Creative Commons License, all supplemental material carries the same license as the article it is associated with.
For non-Open Access articles published, all supplemental material carries a non-exclusive license, and permission requests for re-use of supplemental material or any part of supplemental material shall be sent directly to the copyright owner as specified in the copyright notice associated with the article.