
Abstract
Abstract
The present research is based on the removal of safranin (cationic) dye, an emerging contaminant from wastewater by sodium bicarbonate modified Bambusa tulda (variety of bamboo and a bioadsorbent) using adsorption technology. Characterization study of sodium bicarbonate-treated bamboo was done through scanning electron microscope analysis and it was found that after treatment with sodium bicarbonate, pore structure of B. tulda gets widened increasing active pore cavity in the adsorbent resulting in larger surface area for higher adsorption. Energy dispersive X-ray analysis showed the presence of Na, Cl, etc., in safranin dye adsorbed adsorbent; in Fourier transform infrared spectroscopy analysis presence of Hydroxyl and Carboxyl group helps largely for adsorption of safranin dye. The batch study experiment gave optimum results for safranin dye at pH 7; rpm 200, temperature 298 K, with an initial concentration of 50 mg/L and a dose of 10 g/L with maximum adsorption capacity of 32.26 mg/g, followed by pseudo second order rate equation and a removal rate of 98.15% for 60 min of time duration. The activation energy was 17.376 kJ/mol. Two algorithms are used in artificial neural network (ANN), that is, Levenberg–Marquardt (LM) and Bayesian Regularization algorithm with different nodes. LM algorithm with three hidden nodes has higher R2 value with the lesser value of statistical error. Time, dose, and initial concentration can be considered for t-test. Intensive research has been carried out on the modified B. tulda along with characteristic study and modeling analysis by ANN and regression analysis Model Study and Error analysis. Taking considerations of all experimental results and model analysis, it is concluded that sodium bicarbonate treated B. tulda is a good, low cost, and effective adsorbent in comparison to commercially activated carbon for the removal of safranin (cationic) dye from wastewater.
Introduction
W
One of the most commonly used cationic dyes in textile, paper, and pharmaceutical industries is safranin. Safranin dye without proper treatment is discharged into water bodies, and it poses threat to human health such as respiratory problem, skin irritation, and infections in the digestive system (Fayazi et al., 2015). Hence, it is very necessary to control such pollutant from mixing with water bodies to its minimum level or at lowest concentration level to reduce the harmful effects (Bhatnagar and Sillanpaa, 2010; Chowdhury et al., 2012; Saha and Mishra, 2012; Soni et al., 2012; Shakoor and Nasar, 2016).
In this research article, locally available B. tulda (a species of bamboo) was used as an adsorbent for the removal of safranin dye from water bodies.
B. tulda is available in abundance in nature, especially in South East Asian countries; it is low-cost bioadsorbent biodegradable in nature and readily not soluble in water. Cellulose and hemicelluloses are the main constituents of B. tulda. Some of the other elements are lignin, wax, etc. (Potsangbam et al., 2010; Singh et al., 2010; Wang and Yan, 2011). In comparison with other bioadsorbents like wood, tea leaves, and sawdust, the bamboo contains the higher presence of alkaline and silica which is suitable for adsorption techniques (Tomalang et al., 1980; Chen and Qin, 1985).
Raw lingo cellulose material like B. tulda gets biodegradable after a certain period of time, has low resistance, and less surface area and porosity (Wang et al., 2011). Therefore, to enhance the efficiency of B. tulda for effective dye removal, modification of B. tulda was done with sodium carbonate and HCI (Hydrochloric acid) for higher surface area and porosity.
The objective of the experiment is to find the effective and feasibly efficient low-cost bioadsorbent. From the initial experiment, it was found that sodium carbonate-modified B. tulda showed up as a better adsorbent compared with HCI-modified B. tulda and distilled washed B. tulda (DBT). Adsorption studies were done under effective operation parameters which include pH, dye concentration, adsorbent dosage, time of contact, temperature, and rotation per minute (RPM). Further studies were done with different isotherm models, kinetics studies, thermodynamics analysis with artificial neural network (ANN) model, regression analysis, and statistical error analysis. The characterization study of the adsorbent was done by SEM (scanning electron microscope), EDAX (energy diffractions and X-ray), and FTIR (Fourier transform infrared spectroscopy) analysis.
From the literature survey, removal of safranin dye using sodium carbonate modified B. tulda, HCI modified B. tulda, and distilled B. tulda has not been reviewed by any researcher. The physicochemical properties of the adsorbent have been analyzed. Moreover, there is no report of detailed characteristic study and modeling analysis by ANN and Regression Analysis (RA) Model Study along with Error analysis on modified B. tulda as an adsorbent in adsorption technique in the literature survey which established novelty of the research work.
Materials and Methods
Modification of bioadsorbent
B. tulda was collected from local market and made into small pieces of particle size 425–600 μm. It was washed with deionized water to remove any kind of foreign substances and then at 60°C it was oven dried. Some amount of DBT was then modified with 0.1 M Na2CO3 (sodium carbonate) and HCI (hydrochloric acid) separately for 6 h at rpm of 200. The excess of Na2CO3 and HCI onto B. tulda was later on washed properly to keep the pH at 7–7.5 and dried again at 60°C temperature and store it in a seal pack glass bottle for future experiment.
Adsorbate preparation
The chemical formula of safranin (SAF) is C20H19 N4Cl, λmax = 516 nm (Saha and Mishra, 2012; Fayazi et al., 2015), which was used as an adsorbate in the experiment. A stock solution of 1,000 mg/L was prepared with the required amount of safranin dye in distilled water. All experiments were done by diluting the stock solution with distilled water to attain the required concentration requirement.
Characterization analysis of B. tulda
SEM analysis was done to get high-resolution image of the adsorbent; it has a magnification power from 8× to 300,000× .
The FTIR analysis was done to identify the functional group active in the adsorbent for dye removal, ranges from 450 to 7,500 cm−1. Infrared rays identify the functional groups present in the adsorbent.
Energy dispersive X-ray spectroscopy was done to identify the elements present in the adsorbent.
Brunauer–Emmett–Teller (BET) analysis was done to get the actual measurement of the surface enhancement of the modified bioadsorbent, before and after chemical modification.
Batch adsorption studies
Preliminary screening experiment
The preliminary screening experiment was studied with sodium carbonate treated B. tulda (NBT); hydrochloric acid treated B. tulda (HBT); and DBT. The optimum parameters were selected based on adsorption kinetic efficiency and maximum adsorption capacity of the adsorbent. Initial experiments were done for dye removal, and it was found that NBT is effective in safranin dye removal.
Batch kinetics studies
Batch studies were done with NBT and HBT adsorbent in 250 mL flasks with 50 mL total volume of safranin dye at 50 mg/L initial dye concentration with 10 g/L of dose added in solution and rotated at 200 rpm for 90 min. The operational effect of pH, dose, contact time, rpm, initial dye concentration, and temperature was investigated in the present research. At a certain interval, samples were analyzed in UV-VIS Spectrophotometer. The safranin adsorbed per unit of modified B. tulda in mg/g was calculated by the following Equation (1).
where q = amount of the adsorbate adsorbed at any time (mg/g). Co = initial concentration of safranin in mg/L. Ct = equilibrium concentration of the dye in mg/L. V = volume of the solution in L, m = mass adsorbent used g. For correctness and accuracy, an average of three reading has been taken for analysis.
Adsorption isotherm studies
Adsorption isotherm studies were done to get the adsorption behavior and understand its bonding with adsorbent and adsorbate. It was conducted after obtaining the optimum parameters of rpm, temperature, pH, contact time, etc. by varying the dose from 2 g to 10 g/L with safranin (SAF) dye of 100 mg/L concentration. In this experiment Langmuir, Freundlich, Temkin, and Dubinin–Radushkevich isotherms were studied for the safranin dye removal from water bodies. Langmuir and Freundlich's isotherm is among the two most used isotherms by the researchers (Kumar and Acharya, 2013; Kumar and Kumar, 2015; Mohsenipour et al., 2015; Xiaopeng et al., 2016).
Adsorption kinetic model study
Kinetic analysis was done to determine the effectiveness of adsorption technique with respect to its time. The pseudo first order and pseudo second order kinetics models were calculated to get the rate constants.
where qe and qt adsorbed dye mass (mg/g), t time, and K1 is first order rate constant (/min)
Pseudo second order equation is:
where k2 is second order rate constant (g/[mg·min]) (Kumar and Kumar, 2015).
Activation energy
The minimum energy required by the bioadsorbate to get adsorbed is known as activation energy. The rate constant K at different temperatures was used to understand the activation energy using the Arrhenius equation:
where Ea and A are Arrhenius Activation Energy and Arrhenius factor, respectively.
Thermodynamic analysis
The thermodynamic study was done to understand the temperature effect of the adsorbent. Gibbs free energy change (ΔG°), enthalpy change (ΔH°), and entropy change (ΔS°) were identified by van't Hoff equation (Kumar and Acharya, 2013; Kumar and Kumar, 2015).
Study of ANN and RA
In this study MATLAB 8.1/R2013a, Neural Network Toolbox software was used to predict the adsorption effectiveness of safranin dye removal by NBT. Input variables for feed forward neural network were as follows: contact time (5–120 min), temperature (298–318 K), RPM (125–200), pH (3–10), initial concentration (50–200 mg/L), and dose (0.05–0.5 g). The percentage removal was taken as the output variable. All total 83 experimental data were taken, and among them, 65 were taken as training data and 18 as testing data; number of hidden nodes was 3, 4, and 5. The Levenberg–Marquardt (LM) back propagation algorithm and Bayesian Regularization (BR) algorithms were utilized. A statistical error such as coefficient of determination R2, mean square error, mean absolute error, median absolute error, and root mean square error was used to evaluate the performance of the model. The regression analysis was done to predict the % removal of safranin dye by NBT; here % Removal (% R) has been taken as a dependent variable, whereas other parameters like pH, temperature, rpm, dose, initial concentration, and contact time are independent variables taken into consideration (Daneshvar et al., 2006; Behzat et al., 2011; Seniha et al., 2012; Ghaedi et al., 2014; Maghsoudi et al., 2015; Debnath and Dey, 2016).
Results and Discussion
SEM, EDAX, and FTIR analysis of B. tulda
Three SEM images were analyzed and shown in Fig. 1a–c for Distilled B. tulda (DBT), sodium bicarbonate treated B. tulda (NBT), and safranin dye adsorbed sodium bicarbonate B. tulda. After chemical modification of B. tulda with sodium bicarbonate, the pores get widen up compared to distilled washed B. tulda. Such modification helps in increase of pore cavity in adsorbent and results in the larger surface area for higher adsorption of safranin dye into it.
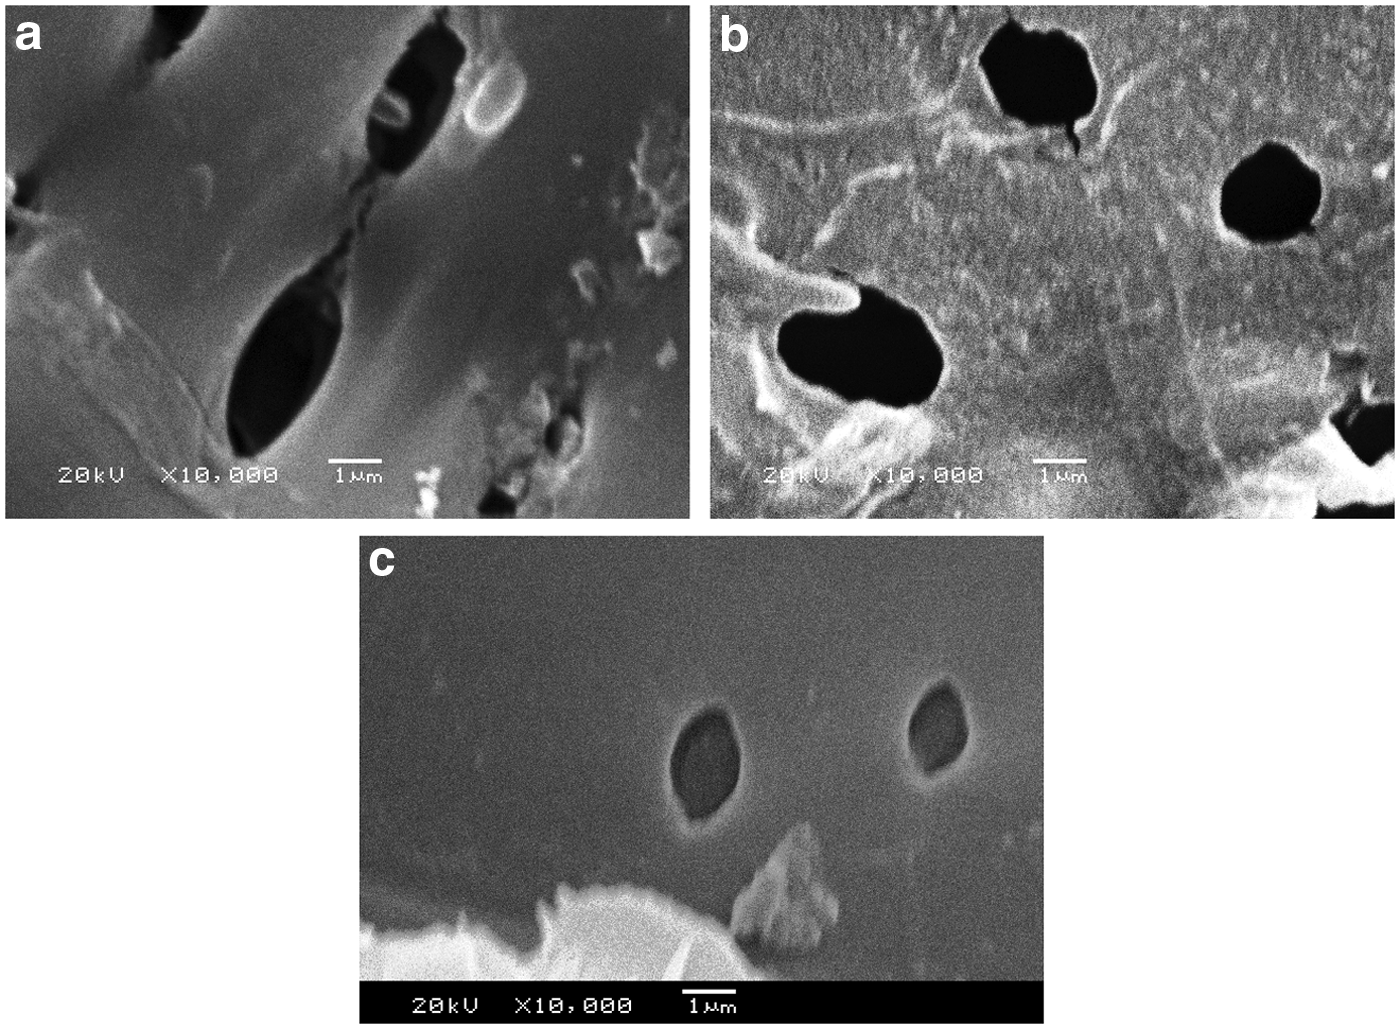
In Table 1 BET surface test was shown and that after treatment the surface area of NBT was found to be 0.6002 m2/g, which is double that of DBT. EDAX of safranin dye adsorbed NBT is shown in Fig. 2. From the EDAX analysis image, it is clear that after the safranin dye has been adsorbed by NBT, it attacks some elements like Na, Cl, etc. Similar results were found by Patil and Shrivastava (2015).

EDAX images of safranin adsorbed NBT. EDAX, energy diffractions and X-ray.
Number of Brunauer–Emmett–Teller Analysis
BET, Brunauer–Emmett–Teller; DBT, distilled washed Bambusa tulda; NBT, sodium carbonate treated B. tulda.
FTIR analyses were done to identify the functional group and the molecular structure present in the B. tulda. The spectrum range of FTIR was from 4,000 to 400 cm−1. FTIR image of safranin (SAF) dye adsorbed NBT is shown in Fig. 3. Peak shows were at 3476.26 cm−1 (OH stretch, H-bonded), 2894.17 cm−1 (CH stretch, strong), 1,639 cm−1 (C = O stretch (strong) amide), 1,706 cm−1 (C = O stretch and stretch (strong) aldehyde), 1,103 cm−1 (C–O stretch, strong), and 519 cm−1 (C–H bond). Adsorption of safranin dye from water environment occurs due to the presence of Hydroxyl and Carboxyl group in NBT; similar results were found in Zhang and Bing (2014); Reddy et al. (2017); and Kulkarni et al. (2017).

FTIR of sodium carbonate treated and safranin (SAF) dye adsorbed NBT. FTIR, Fourier transform infrared spectroscopy.
Screening experiments
Effect of contact time and initial concentration was analyzed and shown in Fig. 4. The figure represents the removal percentage of safranin dye and decrease in concentration level (Co mg/L) of safranin dye with respect to time for different adsorbents. The removal of safranin dye with respect to contact time from 0 to 90 min was examined. Three adsorbents were taken for analysis DBT, NBT, and HBT with an initial concentration of 50 mg/L, dose of 10 g/L, rpm 200, and pH 7. It was found that NBT adsorbent shows the maximum removal of safranin dye compared with HBT and DBT adsorbent. The removal rate was very high in the initial stage, and later on, after attaining the equilibrium time, there was no such significant removal of safranin dye. After 60 min there was removal of 98.75% safranin dye with initial concentration reduced to 2.32 from 50 mg/L when treated with NBT. The same observation was done with HBT showing 95.70% removal with initial concentration reduced to 8.00 mg/L, whereas DBT showed better results than HBT with 96.91% removal rate; the initial concentration reduced to 5.75 from 50 mg/L after 60 min.
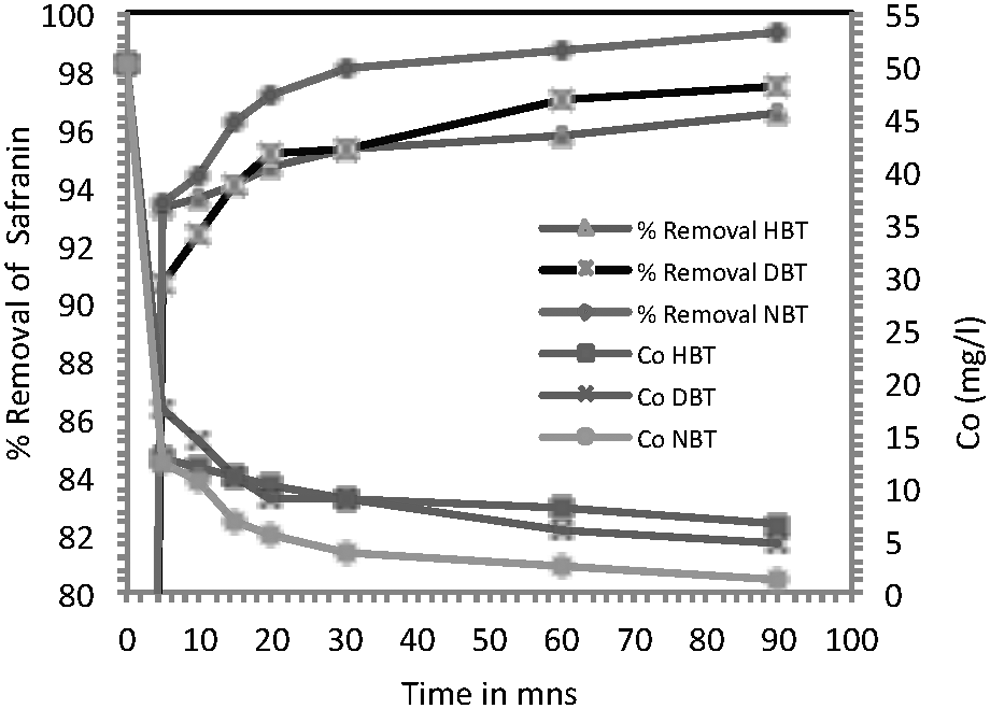
Screening experiment by DBT, NBT, and HBT. HBT, hydrochloric acid treated B. tulda.
Operational parameter analysis
Contact time and initial concentration
The effect of contact time and initial concentration is analyzed in Fig. 5. The figure represents the removal percentage of safranin dye and decrease in concentration level (Co mg/L) of safranin dye with respect to time. Three concentrations of safranin dye were taken at 50, 100, and 200 mg/L. It was found that the 50 mg/L concentration has higher removal rate as the dye concentration increases in the active pores of the NBT adsorbent get saturated, and hence, no further adsorption takes place. Thus NBT provided the best removal rate because of more active sites on absorbent after chemical treatment. A similar observation was noticed by Kumar and Kumar (2015).
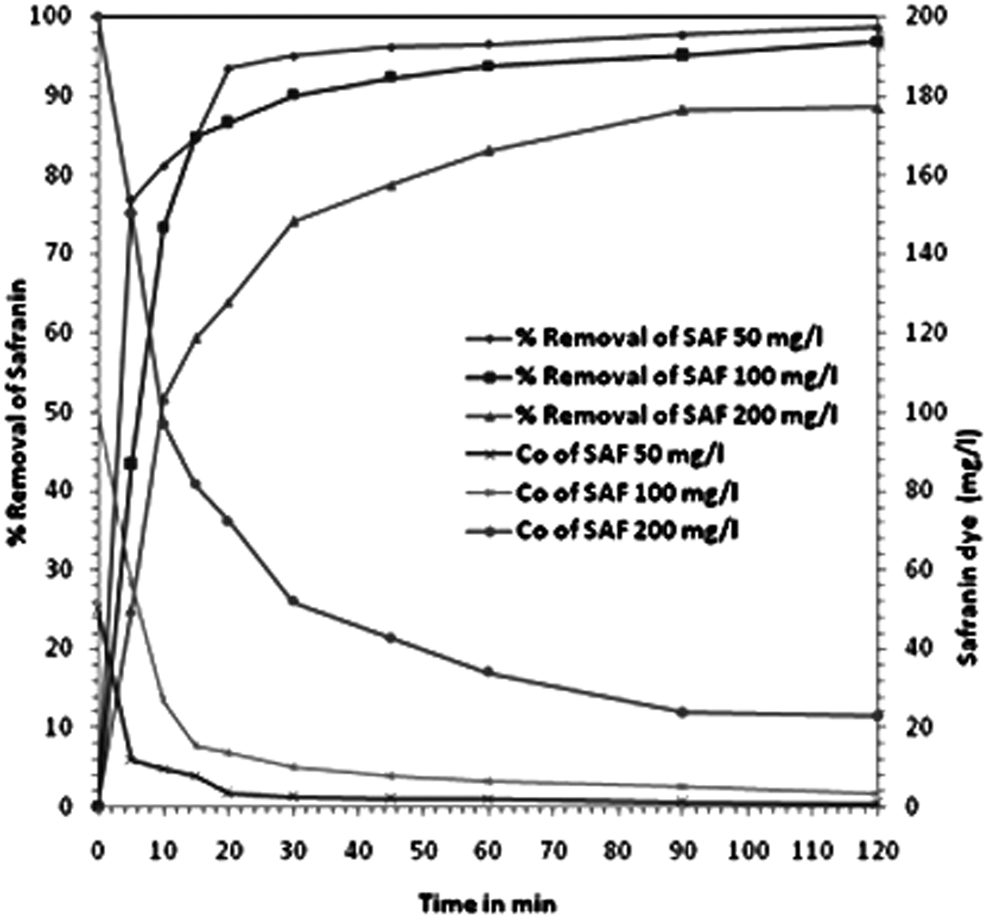
Effect of initial concentration of safranin by NBT.
Effect of pH
The pH test is one of the most important test analyses in adsorption technology. In this study the test analysis was done from pH 3 to 10. The Fig. 6 shows the percentage removal of safranin and concentration (Co mg/L) of safranin dye with respect to pH. In acidic zone (pH 3) there was less removal of safranin dye by NBT but the removal rate increased as pH increased and after pH 7 there was again slight decrease in removal rate. Two possible conclusion theories can be drawn from the observed pH test: (a) there is an electrostatic force of attraction between adsorbent and adsorbate and (b) the chemical interaction taking place between adsorbent and adsorbate. Moreover, the pHZPC value or zero point charge was found to be 7.6, which signifies that below 7.6 NBT charge is positive in nature and above is negative in nature. The negative charge of NBT gets attracted with the positive charge of the safranin dye and hence more adsorption takes place and results in higher dye removal rate. A similar observation was noticed by Hossein and Mohammadi (2015).

Effect of pH.
Effect of NBT dose
Effect of adsorbent dose on safranin dye removal was studied by varying the NBT dose from 1 to 10 g/L with an initial concentration of 50 mg/L, rpm 200, pH 7, and temperature 298 K, as shown in Fig. 7.

Effect of NBT dose.
The removal of safranin dye increased with increase in dosage, due to availability of more active pore cavity on the surface of NBT adsorbent. In the experiment, it was found that 10 g/L gives best removal rate of 98.22%. So, the optimum dose was taken as 10 g/L for the removal of safranin dye by NBT from water bodies. A similar observation was noticed by Etim et al. (2012); Rajurkar and Asha (2015); and Kumar and Kumar (2015).
Effect of temperature
Effect of temperature study was done to check the temperature variation between NBT adsorbent and safranin dye. In Fig. 8, the temperature varies from 298 to 318 K; the initial dye concentration was 50 mg/L, rpm 200, pH 7, and a dosage of 10 g/L. From the experiment, it was observed that there is an increase of removal rate at a higher temperature which indicates that the adsorption is endothermic in nature. The pores of NBT get increased and enhanced the adsorption of safranin dye. A similar observation was noticed by Maurya and Mittal (2011) and Khattri and Singh (2000).
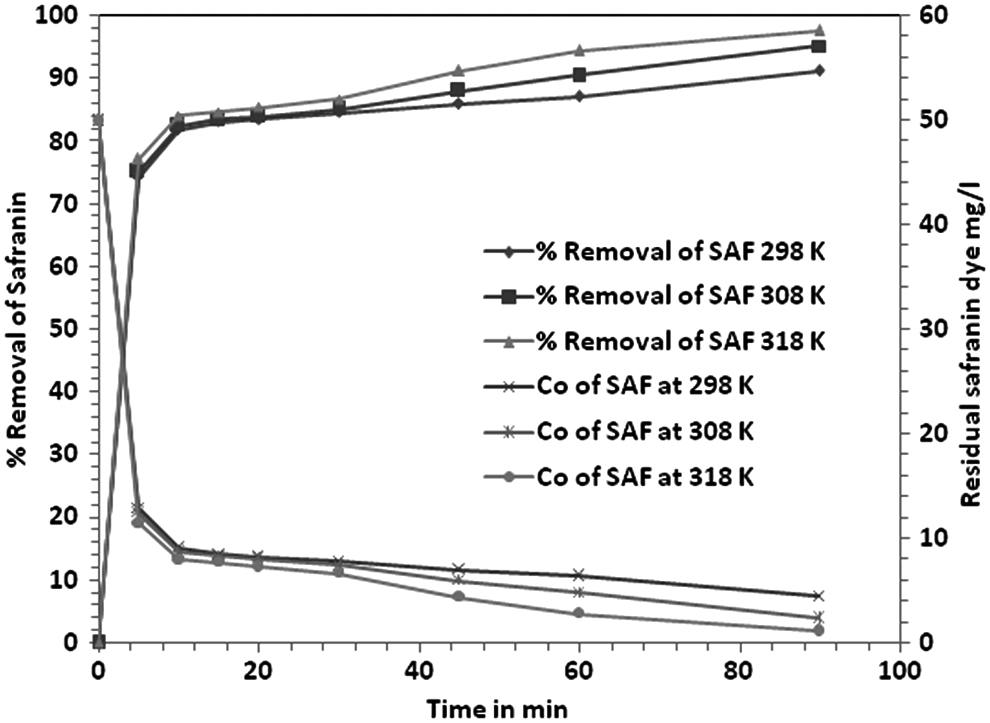
Effect of temperature.
Effect of RPM
Another parameter for adsorption technique is RPM. In Fig. 9, it is seen that RPM experiments were done by varying the rotation speed from 125 to 250 rpm and initial concentration of 50 mg/L, pH 7, temperature 298 K, and dosage 10 g/L. As the rpm increases there is a higher removal rate but after 200 rpm there is a slight decrease in removal rate. It is due to an excess of development of centripetal forces which results in the creation of repulsive forces and as a result dye which was adsorbed in NBT gets repulsed a bit. Hence, 200 rpm was taken at an optimum level. A similar observation was noticed by Kumar and Kumar (2015) and Kumar and Bandyopadhyay (2006).

Effect of rpm.
Adsorption isotherm analysis
In Table 2, the experimental data were analyzed with four isotherm models Langmuir, Freundlich, Temkin, and Dubinin–Radushkevich isotherm. It was found that adsorption system best fits with Langmuir isotherm model compared to other models. The Qmax value was 32.26 mg/g with R2 value 0.923. The KF value was 7.834 mg/g with R2 value 0.908. The KT value was 1.319 L/mg with R2 value 0.837, and qe value was −2E–06 mg/g with R2 value 0.661. The RL value was 0.15 which symbolizes that the adsorption process is favorable in nature.
Adsorption Isotherm Study of Safranin onto Sodium Carbonate Treated B. tulda
Adsorption kinetic model study
Kinetics analysis was done by putting the experiment values at different temperatures and initial dye concentration on pseudo first order and pseudo second order rate equation (Papita, 2012; Ertugay, 2014; Yang et al., 2014; Mehmood et al., 2015). All the results are shown in Tables 3 and 4. It was observed that the pseudo second order rate equation suits better than pseudo first order. At 50 mg/L of initial concentration, the R2 value was 0.995 and Kp2 was 0.1253 with qexp 5.0 mg/g and qcal 5.025 mg/g, whereas at 308 K temperature the R2 value was 0.999 and Kp2 was 0.1201 with qexp 4.852 mg/g and qcal 4.97 mg/g.
Adsorption Kinetic Parameters at Different Concentrations of Safranin
Adsorption Kinetic Parameters at Different Temperatures of Safranin
Activation energy
Activation energy was 17.376 kJ/mol. From literature survey, it was found that if the value is in between 8.4 and 83.70 kJ/mol then it denotes that the adsorption system is chemical adsorption (Chan et al., 2006; Aljeboree et al., 2014; Kumar and Kumar, 2015; Ashfqaq et al., 2016).
Thermodynamic analysis
The thermodynamic analysis is explained in Table 5; it was found that at three different temperatures the value of ΔG° is negative in nature which denotes that the adsorption process is favorable and spontaneous in nature. ΔG° decreases with the increase of temperature, which shows the mobility of dye molecules at a higher temperature. Both ΔH° and ΔS° are positive in nature, so the process is endothermic in nature (Yakout and Elsherif, 2010; Chowdhury et al., 2011; Ramakant et al., 2017).
Thermodynamic Analysis at Different Temperatures of Safranin
Comparative study of NBT versus AC
A comparative study was done for the removal of safranin dye from wastewater with NBT adsorbent and a commercially available AC compound. In Fig. 10, it was observed that after 1,440 min of treatment, NBT gave better results in comparison to AC for the removal of safranin dye. AC removed 91.40% of safranin dye, whereas NBT removed 98.28% of safranin dye. Thus it can be concluded that the NBT is a better adsorbent to be used for the removal of safranin dye. Performance level of various adsorbents including AC was discussed in Table 6.
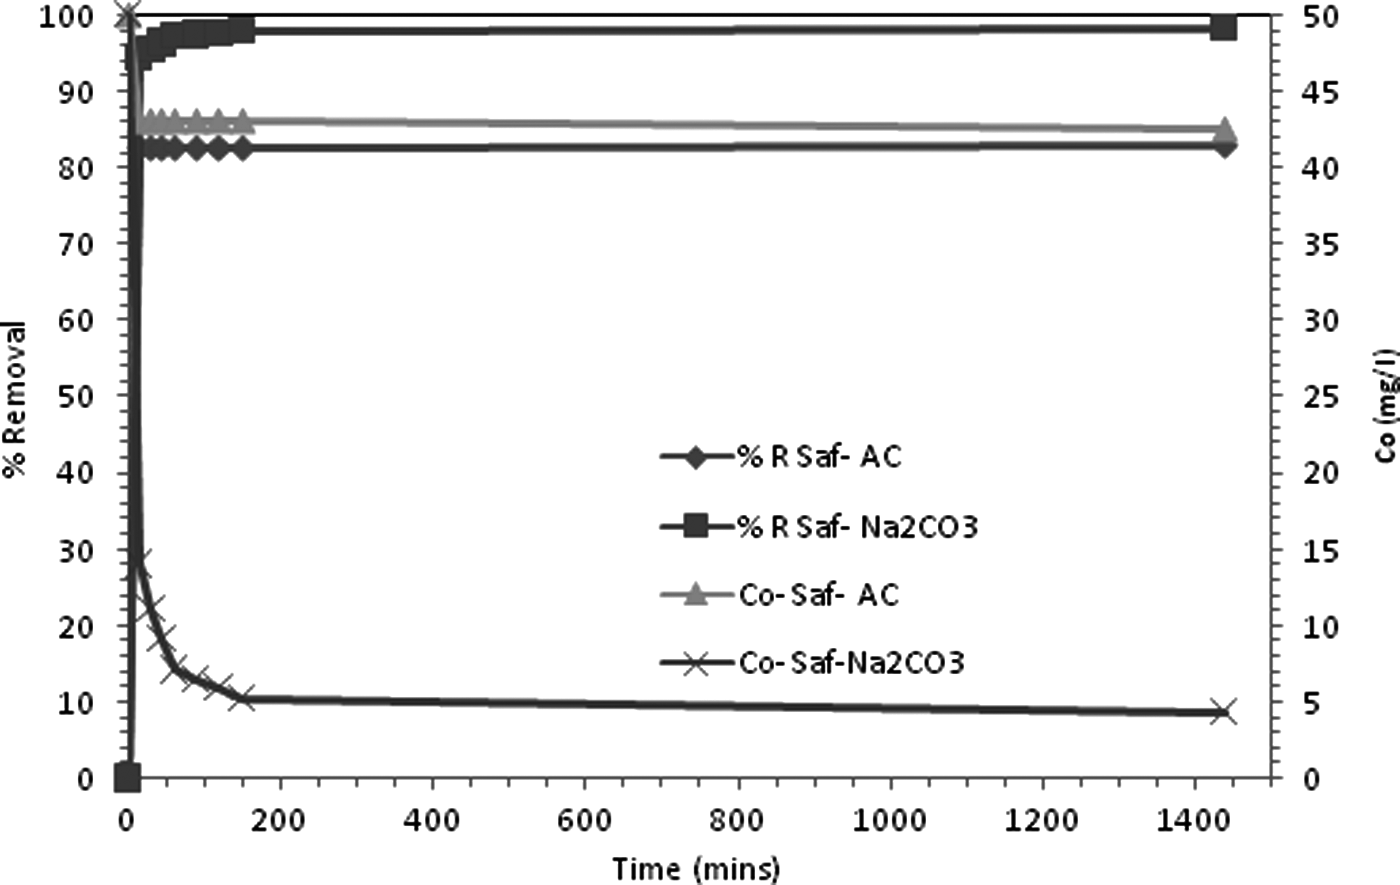
Comparative study of AC and NBT. AC, activated carbon.
Performance Level of Various Adsorbents for the Removal of Safranin Dye
HBT, hydrochloric acid treated B. tulda.
ANN and RA Model Study
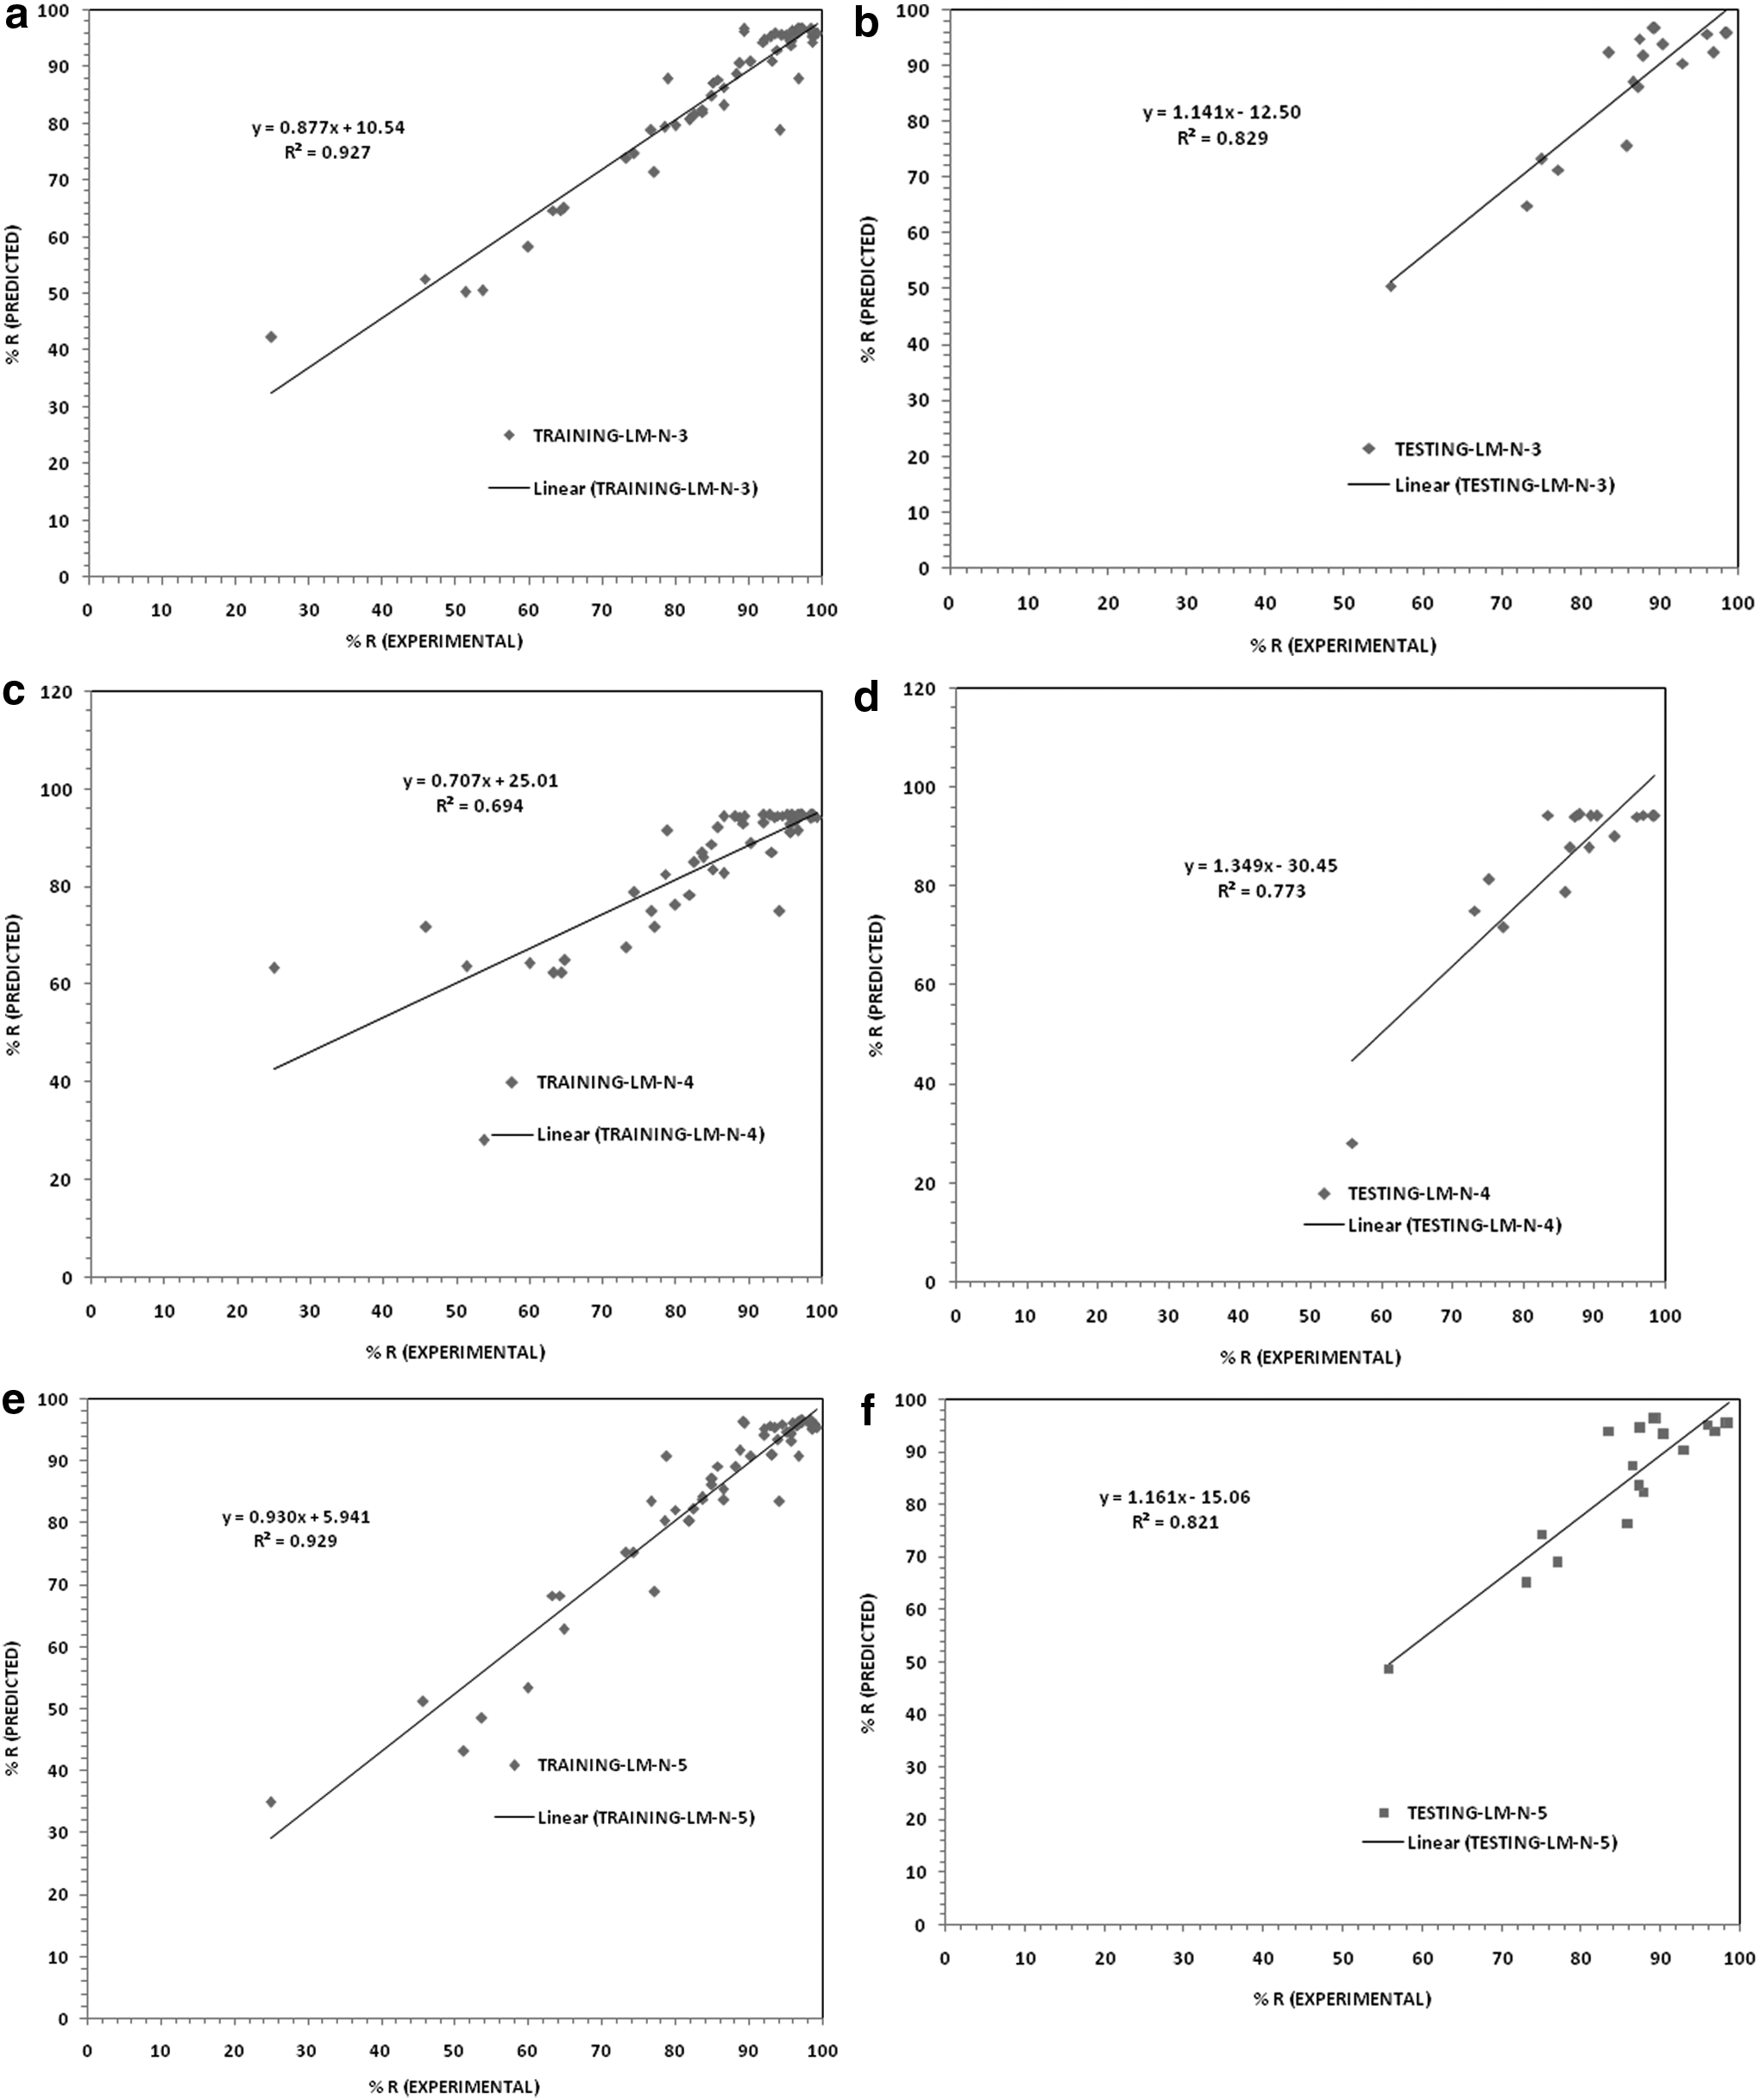
Modeling of adsorption studies was made by ANN and RA to understand the adsorption performance at different model analyses. Structure of ANN is shown in Fig. 11. All the experimental data were put up as per the condition used in ANN for both training and testing of the LM algorithm and BR algorithms. Fig. 12a–l shows the comparative study of experimental and predicted values of the LM and BR with hidden node 3, 4, and 5, and in Tables 7 and 8 it shows the training and testing data of ANN.
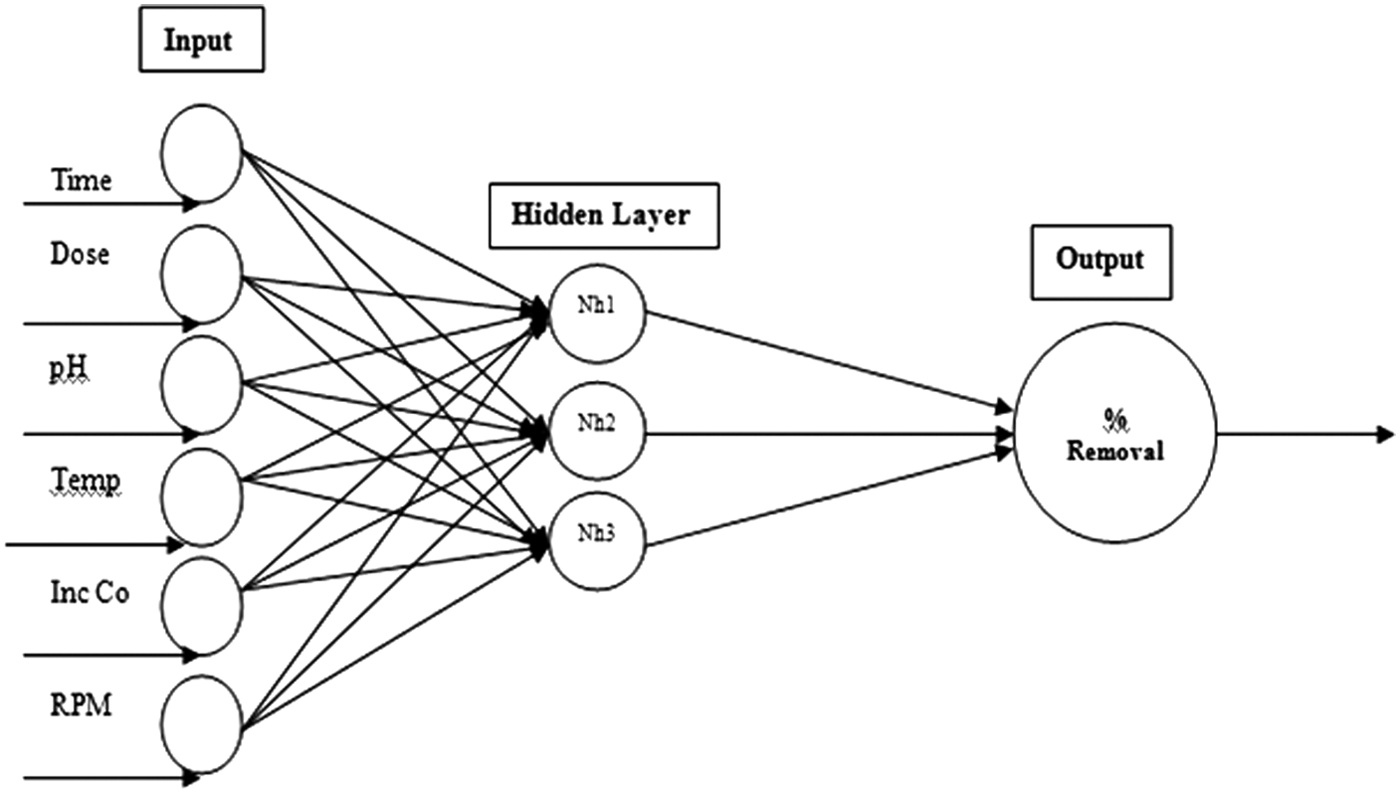
Structure of artificial neural network.
Training Data of Artificial Neural Network Model
RPM, rotation per minute.
Testing Data of Artificial Neural Network Model
Statistical parameter analysis of ANN model is shown in Table 9. In Table 10, it was observed that two types of ANN algorithm were used. The LM with three hidden nodes has higher R2 value with the lesser value of statistical error.
Statistical Error Analysis of Artificial Neural Network Model
BR, Bayesian Regularization; LM, Levenberg–Marquardt; MAE, mean absolute error; MEDAE, median absolute error; MSE, mean square error; RMSE, root mean square error.
Statistical Error Analysis of Artificial Neural Network Model
In Table 11, performance study of ANN versus RA model was done, and the ANN model was found to be better suitable compared to RA model. The analysis of variance (ANOVA) and the statistical analysis of variable in ANOVA are shown in Tables 12 and 13; RA model was analyzed with 95% confidence level. The p-value 4.27E–09 is very low, and the confidence level is almost 100%. It is found that the p-value of variable pH, temperature, and RPM is having a low confidence level, that is, (1 − p) < 0.95, and so the variables pH, temperature, and RPM are not signified for RA model analysis. However, p-value of time, dose, and initial concentration has high confidence level (1 − p) > 0.95.
Comparative Performance Study of Artificial Neural Network and Regression Analysis Model
Analysis of Variance
Statistical Analysis of Variables in Analysis of Variance
In Table 13, 95% confidence level of lower and upper limits is shown, where pH, temperature, and RPM have zero value and cannot be considered for the t-test, whereas time, dose, and initial concentration can be considered for the t-test. Thus ANN model is better than RA model in the prediction of adsorption parameters within the ranges of the experimental data.
Chemical oxygen demand study and cost analysis
The chemical oxygen demand (COD) analysis was done to identify any difference in wastewater before and after treatment. It was found that COD level was 144 mg/L before treatment, and after treatment with NBT, it was 94 mg/L which is below the permissible limit of COD in wastewater. A similar observation was noticed by Kumar and Kumar (2015).
Currently, the cost of commercial AC is costly ($172.96/kg, Singh et al., 2016). The total cost of NBT, including drying, raw bamboo, and sodium carbonate, is Rs. 6.32 (approx.) per kg of NBT.
Conclusion
A detailed experimental study was done to remove the safranin dye from water bodies by NBT. The batch study experiment gave optimum results for safranin dye at pH 7, rpm 200, temperature 298 K, the initial dye concentration at 50 mg/L, and dose of 10 g/L with maximum adsorption capacity of 32.26 mg/g. The pseudo second order rate equation suits better than pseudo first order. At 50 mg/L of initial dye concentration, the R2 value was 0.995 and Kp2 was 0.1253 with qexp 5.0 mg/g and qcal 5.025 mg/g. BET surface test was done and found that surface area of NBT after treatment is twice that of DBT. COD test was done, and it was found that the level of COD got reduced after treatment from 144 to 94 mg/L which is below the acceptable range of COD in wastewater. Comparing two adsorbent NBT and AC it was found that NBT (98.28% removal) shows better performance in safranin dye removal in comparison to AC (91.4% removal) at 1,440 min. In ANN the LM algorithm with three hidden nodes has higher R2 value of 0.911 with lesser value of statistical error. Regression analysis model was analyzed with 95% confidence level. The p-value 4.27E–09 is very low, and the confidence level is almost 100%. It was found that the p-value of variable pH, temperature, and RPM is having a low confidence level, that is, (1 − p) < 0.95, and so the variables pH, temperature, and RPM are not signified for RA model analysis. However, p-value of time, dose, and initial concentration has high confidence level (1 − p) > 0.95. In the thermodynamic analysis, both ΔH° and ΔS° are positive in nature, so the process is endothermic in nature. The activation energy was found to be 17.376 kJ/mol. The total cost of NBT, including drying, raw bamboo, and sodium carbonate, is Rs. 6.32/kg of NBT. Taking consideration of all experiment results and model analysis, it is concluded that NBT is a good, low cost, and effective adsorbent for the removal of safranin dye from wastewater.
Footnotes
Acknowledgments
The authors thank Ministry of Human Resource, Government of India and TEQIP II NIT Silchar for providing financial and other support throughout the research and SAIF NEHU Shillong, SAIF IIT Bombay, CSIR Bhavnagar, and Pollution Control Board Silchar, Assam for technical help in SEM, EDAX, FTIR, BET, and COD analysis of work.
Author Disclosure Statement
No competing financial interests exist.