
Abstract
Abstract
This study presents chemical, mineralogical, and leaching characterization of chromite ore processing residue (COPR) derived from the soda ash process, which is currently replacing the lime-based process in China, the world's largest chromite processor. Results indicated that, while soda ash COPR had 8,500 mg/kg Cr(VI), 90% of that was readily available in deionized water and thus the result of incomplete dissolution during the leaching process. The remaining 850 mg/kg of Cr(VI) could only be leached by decreasing the pH from 12.5 to 8, and geochemical modeling indicated that hydrotalcite (Mg4Al2(OH)12CO3
Introduction
C
Since 2009, about 40% of the global chromate sale production is in China (MIIT, 2012). The most popular roasting process for chromite uses lime (CaO) to complex other metals in ore (Fe, Mg, Al) and isolate Cr. However, this method generates a large amount of waste residue (up to three tons of residue per ton of sodium dichromate produced (Zhang et al., 2005), the disposal of which has caused widespread environmental pollution in the past (Bewley et al., 2001) and continues to incur high treatment costs and pollution in producing countries. To deal with this issue, China has banned lime roasting since 2013 (MIIT, 2012).
In the most widely applied lime-free roasting process, chromite ore is mixed with soda ash and return slag, which is residue generated from the initial leaching process, and the mixture is roasted in a rotary furnace at 1,200°C (Antony et al., 2006). Although lime-free roasting generates fewer residues (about 0.8 tons per ton of produced Na2Cr2O7 (Zhang et al., 2005), COPR from the soda ash process still contains high amounts of hexavalent chromium (Cr(VI)) due to incomplete leaching, similar to traditional COPR generated from the lime based. While there are several studies on the chemical and leaching characteristics of COPR derived from the lime-based process (Burke et al., 1991; Deakin et al., 2001; ünlü and Haskök, 2001; Weng et al., 2001; Hillier et al., 2003; Yalçin and Ünlü, 2006; Kamolpornwijit et al., 2007; Wazne et al., 2008; Chrysochoou et al., 2009, 2010; Matern et al., 2016; Huang et al., 2017), there is limited information available with respect to the chemistry, mineralogy, and leaching properties of COPR derived from the soda ash process. Such information is important to optimize Cr(VI) recovery and subsequent treatment of COPR for environmentally responsible disposal. Accordingly, this article presents the results of chemical and leaching studies conducted on COPR obtained from a large processing plant in China that utilizes the soda ash process.
Materials and Methods
Materials
COPR samples were obtained from a large processing plant in China that has begun using soda ash since 2007. Raw COPR material is designated as “original COPR.” The material was very fine and homogeneous and required no further processing to conduct leaching tests. According to the sieve analysis, about 95% of the material had a particle size <2 mm and about 80% had a particle size <0.425 mm (mesh-40). The complete grain size distribution is provided in Supplementary Information (Supplementary Fig. S1).
Initial leaching experiments showed that COPR had high amounts of readily exchangeable Cr(VI), as described in subsequent sections. In addition to this fraction that could be easily leached with deionized (DI) water, a more recalcitrant fraction was present in the solid. To study the leaching behavior of this fraction, COPR was leached with DI water for 17 h, recovered and air-dried, and then subjected to further leaching tests. The material resulting from the DI water leaching in the column is referred to as “column-leached COPR.” Every batch of column-leached COPR was tested by alkaline digestion to ascertain that the concentration of residual Cr(VI) was consistent.
Sample characterization
All sample analyses with the exception of scanning electron microscopy (SEM) were conducted at the College of Resources and Environmental Science, South Central University for Nationalities in Wuhan, China. The elemental composition was analyzed by X-ray fluorescence spectrometry (XRF, Vanta VCR, Olympus), and the mineralogical composition was determined by X-ray diffraction (XRD, D2 Phaser, Bruker) using Cu-Kα radiation in the range of 2θ from 5° to 60°. SEM with energy dispersive X-ray (SEM EDX) was performed on samples prepared as 30 μm standard diamond polished thin sections, using an Field Electron and Ion Company (FEI) electron microscope at the Institute of Materials Science at the University of Connecticut. The total Cr(VI) content in COPR samples was determined by the USEPA 3060A method (alkaline digestion) as an extraction procedure and the concentration of dissolved hexavalent chromium was determined by the USEPA method 7196A.
Batch leaching experiments
To investigate the release of Cr(VI) from COPR, three different extractants were used for shorter time scale, DI water, 0.1M HNO3, and 0.1M Na2SO4. Five grams of original COPR samples were mixed with 50 mL extractant solution to yield a liquid-to-solid ratio of 10 in polyethylene containers and placed in a rotary shaker for 2, 4, 6, 8, 15, 24, and 48 h. For column-leached COPR, the same tests were repeated with a reaction time up to 336 h. After reaction, samples were filtered with a 0.45-μm cellulose filter. Leachate pH, redox potential, and conductivity were recorded and Cr(VI) concentrations were analyzed using the EPA method 7196.
Another set of batch leaching tests was conducted to study COPR leaching behavior as a function of (a) pH, (b) L:S ratio, and (c) time. pH edges for both original and column-leached COPR were obtained for a variety of elements. Incremental amounts of 5% HCl (1.5l7 mol/L) were added to cover a pH range from 2 to 12. Both materials were studied at L:S of 5 and 150 to investigate solubility control for each element, similar to an approach adopted by Geelhoed et al. (2003) for lime-based COPR. For original COPR, the experiments were repeated for two leaching times, 24 h and 2 weeks, while for column-leached COPR, 3 weeks of equilibration time were adopted. As demonstrated later, this was due to the different behaviors of the two materials in terms of reaching equilibrium with the leaching solution.
The Toxicity Characteristic Leaching Procedure (TCLP) test was also performed according to the EPA method 1,311 to determine whether the materials are designated as hazardous. Leaching solution #2 was used for both materials.
After reaction and filtration, leachate pH, redox potential, and conductivity were recorded in each sample. Total Cr, Ca, Mg, Fe, K, Na, and Ni were determined by the USEPA method 7000B. Total inorganic carbon was measured with a Shimadzu TOC analyzer. The dissolved Al concentration was determined by the USEPA method SW6010C and Cl, N, and S were measured by the USEPA method E300.0 at Phoenix Environmental Laboratory, Wuhan, China. Si was measured by the USEPA method 6010 at Eurofins Spectrum Analytical, Inc., Shanghai, China.
Column leaching experiments
The objective of the column leaching experiments was to study the effectiveness of Cr(VI) leaching from COPR by DI water. Polyethylene columns of 50 mL volume were filled with about 77 g dry original COPR (dry unit weight of 1.54 g/cm3). The specific gravity of COPR was measured to be 3.16, which yields a porosity of 51% or a pore volume of 25.4 mL. Filling was carried out stepwise by applying a gentle compaction with a small hammer to obtain uniform packing. Columns were leached upward with DI water using a peristaltic pump at a constant flow rate of 1.35 mL/min, which corresponds to 3.18 PV per hour. The leachate was collected every 10 min in the first hour, every 30 min in the second hour, and then collected every 60 min for 17 h (54 PV total). Each leachate Cr(VI) concentration was determined by the USEPA method 7196A. Columns were taken apart after leaching, the column-leached COPR was collected onto a watch glass and air-dried. The total Cr(VI) content in and the recovered column-leached COPR were determined by the USEPA 3060A method (alkaline digestion).
Geochemical modeling
Geochemical equilibrium computer program Visual MINTEQ v. 3.1 was used to model the concentration of Cr(VI) in the pH-dependent batch leaching experiments with liquid-to-solid ratio (LS) of 10 and to determine the predominant solid phases in original COPR and column-leached COPR. Measured leachate solution concentrations of Cr(VI), Ca, Mg, K, Na, Ni, Si, Al, Cl, CO3, NO3, and S as SO42− were used in the pH range 4.5–12.5. Lower pH values were excluded because the ionic strength exceeded 0.3 and the Davis equation could not be used for activity correction. For Fe, the measured concentration was below the detection limit of the AA Flame analysis method for the entire pH range and this presented a challenge with respect to input. In addition, Fe is present in the solid as two species, both ferrous and ferric. Geelhoed et al. (2003) provided Fe concentrations of ∼2–3 μM (>100 ppb) for the entire pH range of lime-based COPR. To deal with the problem, a sensitivity analysis for critical iron-based phases was conducted with Fe concentrations ranging from 0.1 to 100 ppb, and considering both Fe(II) and Fe(III) species. Finally, Cr(III) was not considered in the model, since the difference between Cr(tot) and Cr(VI) had a very high error across the pH range.
To determine potential solubility controlling phases, the MINTEQ thermodynamic database was supplemented with a variety of relevant solids from the literature, shown in Supplementary Table S1.
Results and Discussion
Chemical and mineralogical properties
Main elements in the soda ash COPR are Cr, Ca, Mg, Fe, Al, and Si, similar to lime-based COPR (Table 1). As expected, the soda ash COPR only has about 5.5% CaO, compared with an average of 25–29% for COPR from Glasgow and New Jersey. The use of lime results in dilution of elements other than Ca, so that the Fe, Al, and Cr contents of the soda ash COPR are higher. The Mg content of Glasgow COPR was found to be higher, but this is likely due to the different compositions of the original ores. Chromite has a general composition of (Fe,Mg)2(Cr,Al,Fe)3O4 with other trace elements present as well, such nickel, silica, and manganese (Chen et al., 1997). The composition of chromite ore from India that was used in a similar Chinese plant is also shown in Table 1, which corresponds approximately to the chemical formula (Mg0.6Fe0.4)(Cr0.55Al0.25Fe0.2)2O4 excluding other impurities. Based on Cr alone, the Cr2O3 recovery is 83% efficient, which is close to the 76% reported by Xu et al. (2006) for the same process. Trace elements in soda ash COPR are shown in Supplementary Table S2 and include Ni at ∼1,000 mg/kg and V at 500 mg/kg, both of which are trace elements frequently associated with COPR (Matern et al., 2016).
Data from Indian chromite ore used in China, data from Zhang et al. (2014).
COPR, chromite ore processing residue; XRF, X-ray fluorescence spectrometry.
Alkaline digestion showed a total of 8,487 ± 561 mg/kg Cr(VI) concentration in the soda ash COPR, which is within the range of Cr(VI) concentrations from 4,900 to 16,000 mg/kg measured in lime-based COPR (Burke et al., 1991; Geelhoed et al., 2002; Chrysochoou et al., 2010). The pore water in equilibrium with soda ash COPR has a pH of 12.5 due to the addition of the soda ash, which consists primarily of Na2CO3.
XRD analysis yielded only a mixed magnesiochromite phase as the main crystalline phase in soda ash COPR, with trace amounts of hematite (Fe2O3) and calcite (CaCO3) (Supplementary Fig. S2). Thus, additional techniques are necessary to properly characterize the amorphous phases present in soda ash COPR. Figure 1 and Supplementary Fig. S3 show an SEM image of a typical particle assemblage of COPR, and Table 2 shows the EDX results of the elemental distribution within different areas of the grain. These are identified by the EDX software mapping tool, which synthesizes the individual EDX maps of each element in areas with common chemical composition.

Scanning electron microscopy image (left) and energy dispersive X-ray map (right) of a particle in original COPR. The white bar scale is 20 μm. Each color represents an area with similar chemical composition, shown in Table 2. The percentages correspond to the fraction of the area covered by each color. COPR, chromite ore processing residue.
Approximately 20% of the image area is covered by the resin (Area 10), as evidenced by the predominance of C in the composition. Areas 8 and 9 are almost indistinguishable in Fig. 1 and correspond to the transition zone between the resin and COPR mass, appearing as a halo in both the SEM image and the EDX map. Both are dominated by carbon and are thus not assessed as true COPR. The green Area 7 is actually COPR, as indicated by the EDX map of carbon alone (not shown). Thus, 35% of the image area is resin and 65% COPR mass. Most of that area is dominated by the red chromite grains (20% of the total area or 30% of the area covered by COPR mass).
Based on the elemental composition of the red area (Area 1 in Table 2), the chromite chemical formula in COPR is (Mg0.65,Fe0.35)(Fe0.63Cr0.15Al0.22)2O4, which is substantially poorer in Cr and richer in Fe compared with the original chromite ore composition shown in Table 1.
An orange yellow halo (Area 4) is present around the grains, which has similar proportions of Fe, Cr, Mg, and Al, but is also intermixed with Ca, Si, and Na from the soda ash. This is likely an exsolution border, which is often observed in naturally occurring chromite grains (Chrysochoou et al., 2016). Areas 2 and 3 have larger concentrations of Ca and Na, and especially Area 3 roughly corresponds to bright features in the SEM image. Area 6 (bright yellow) also appears to correspond to certain particles within the image and is enriched in Na, Ca, and Al compared with the average composition of the image. Interestingly, while Cr is enriched in the chromite grains, it also appeared to be diffused with the remaining matrix, following approximately the same proportion as Fe compared with the average concentration. Comparison of the composition of the different areas with specific compounds identified by geochemical modeling (jarosite, hydrotalcite) did not yield a good match with any particular phase. Microstructural analyses with higher spatial solution are underway to aid with identification of Cr-bearing compounds.
Batch and column leaching tests
Results of the batch leaching tests of original COPR using DI water, nitric acid, and sodium sulfate solutions are shown in Fig. 2a. The results indicate that the use of sulfate as an ion exchanger or acid that decreased the solution pH from 12.5 to 7.9 did not enhance Cr(VI) leaching. All three solutions showed a maximum concentration of about 750 mg/L or ∼90% of the total Cr(VI) in the solid within 48-h leaching. No trend was observed with time within the 48 h, with the exception of some random fluctuations.
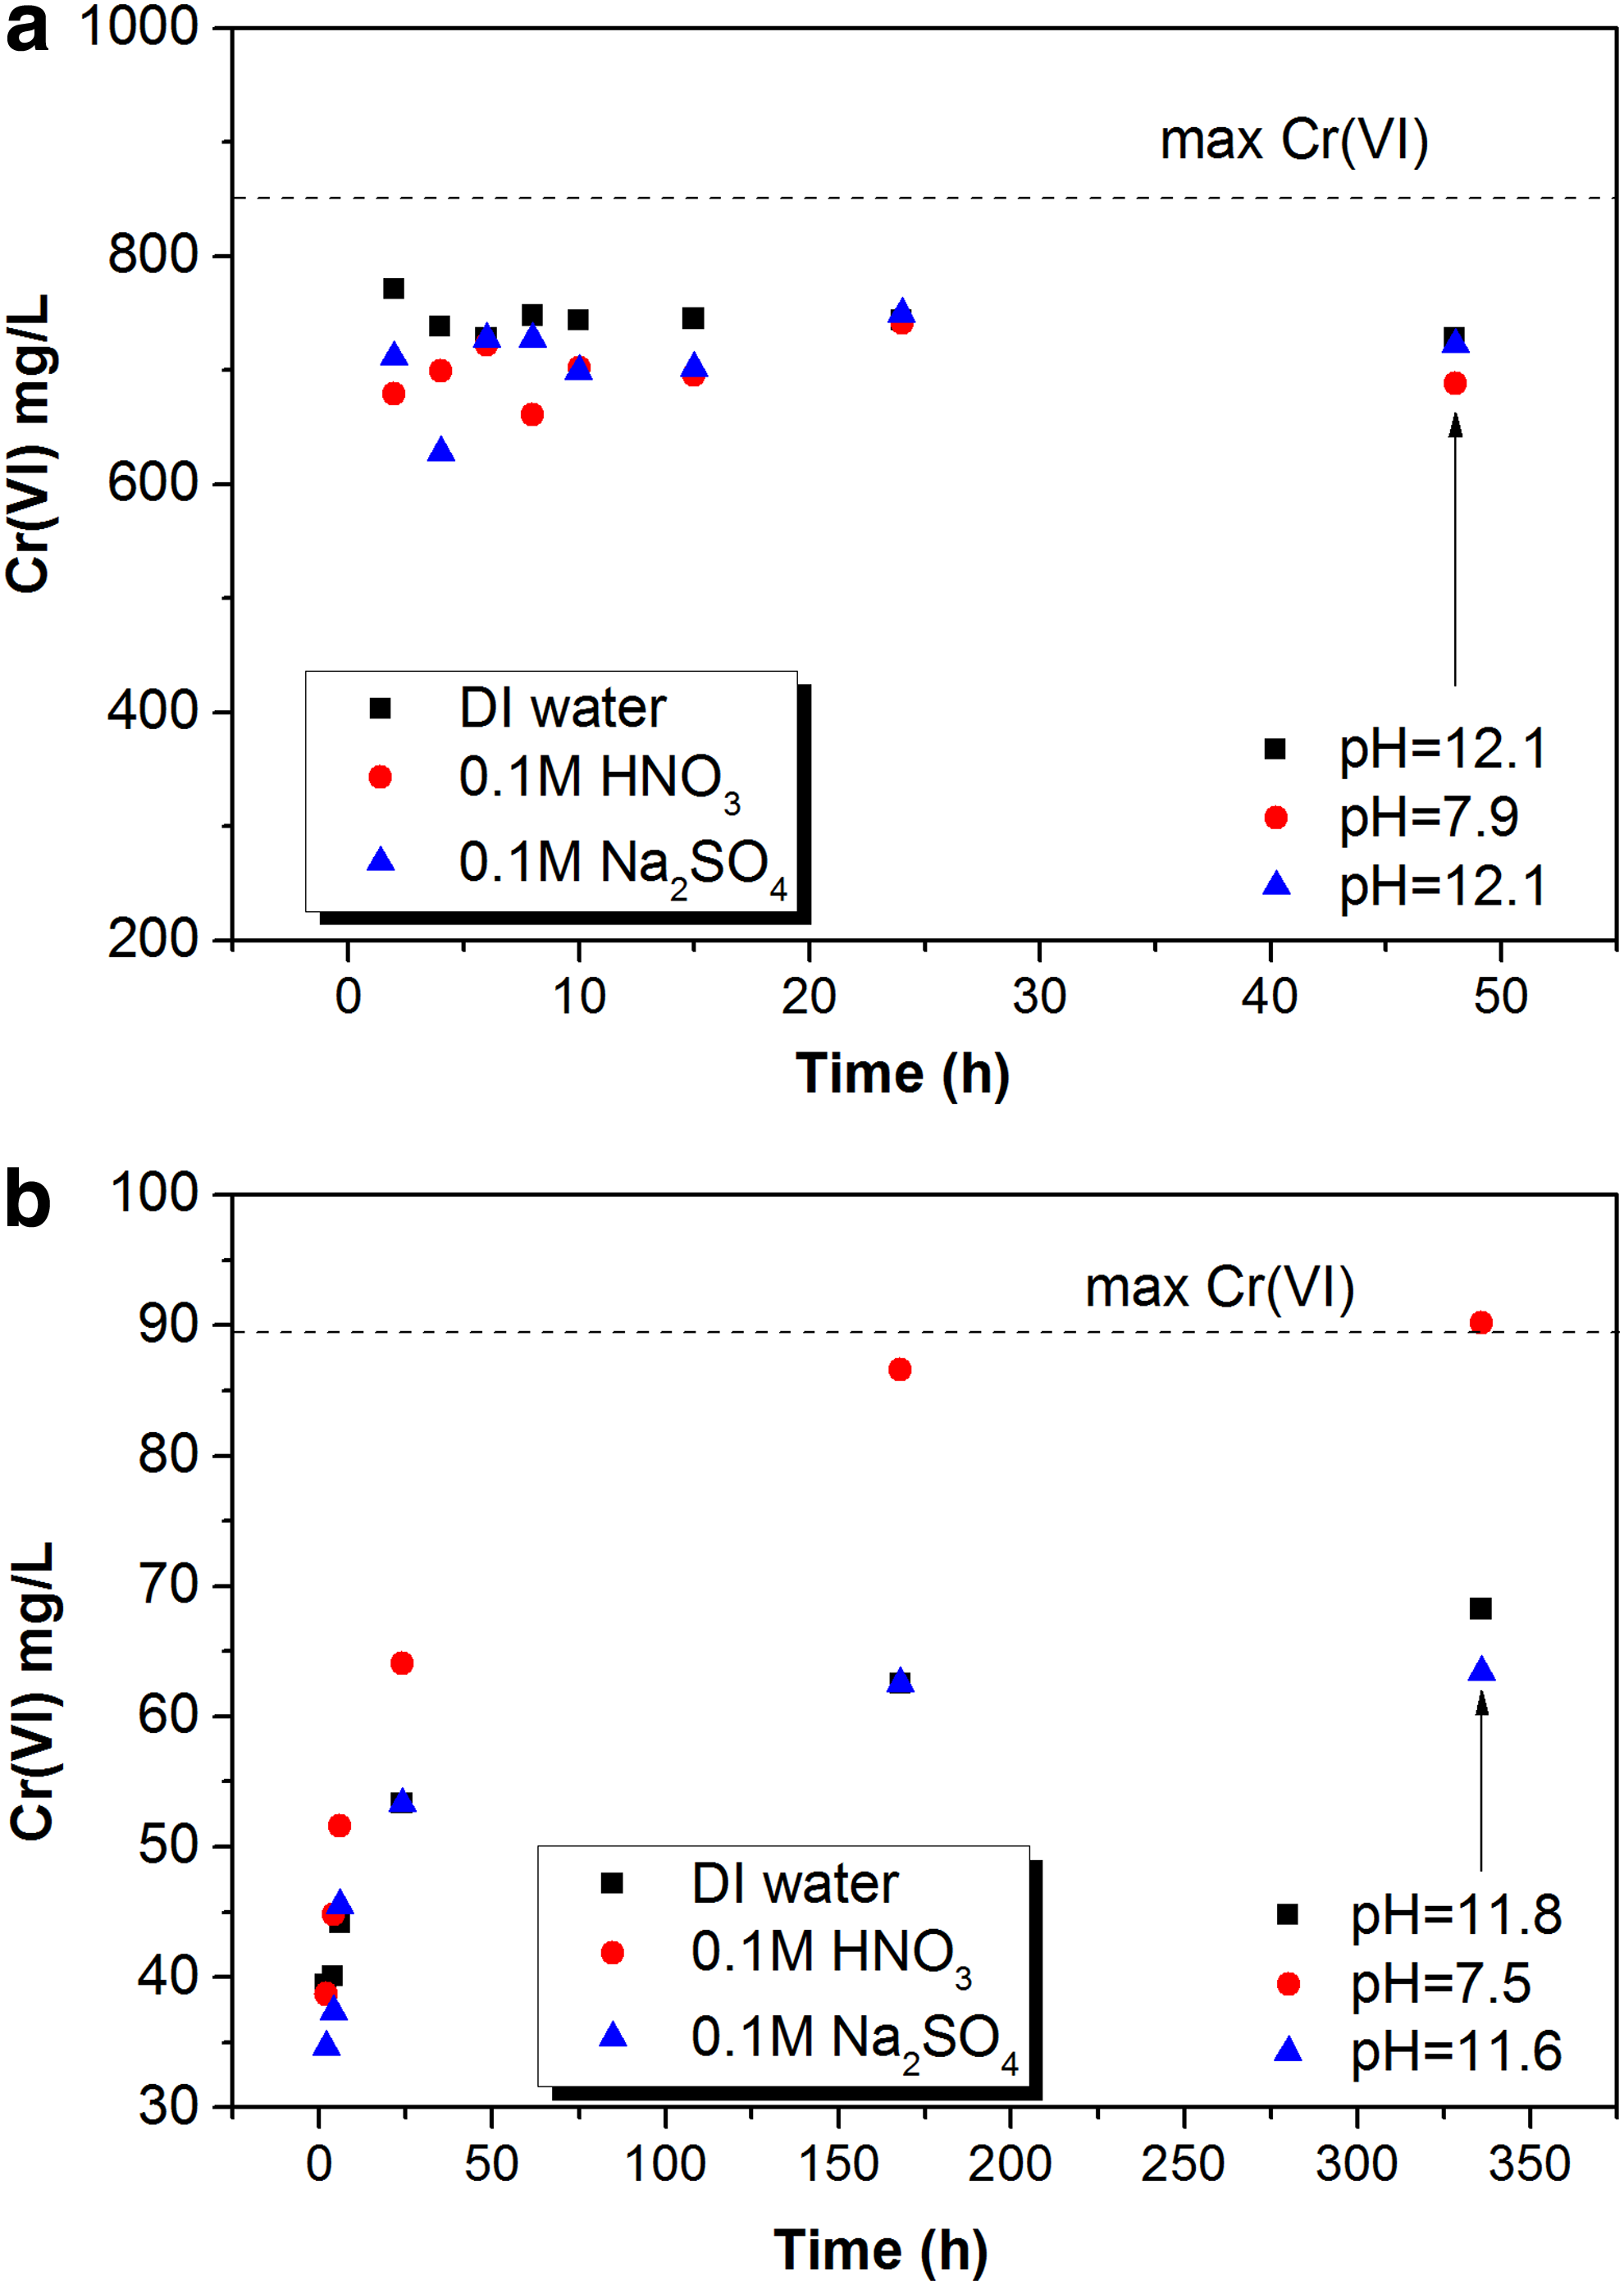
Cr(VI) concentrations in original soda ash COPR
To further ascertain the observation that Cr(VI) is readily available in DI water, leaching was studied in a column experiment. The breakthrough curve (Fig. 3) showed that 83% of the total Cr(VI) was recovered in the effluent after 2 pore volumes, and this fraction increased slowly to 88% up to 35 PV and then remained approximately constant for the final 20 PV, with the Cr(VI) concentration in the effluent measured at 0.3 mg/L during the plateau. The effluent pH decreased from 12.5 to ∼11 during that process. The Cr(VI) concentration in the recovered solid was on average 850 mg/kg, which closes the mass balance between the original solid concentration and the amount recovered in the effluent. This value also agrees with the batch experiments. The comparison between elements measured by XRF (Table 1 and Supplementary Table S1) showed that other leached elements included S and V, both of which are present as oxyanions (SO42− and VO43−). Na+ and K+ leaching were the main cations leached during this stage. All other elements increased in the column-leached COPR due to a concentration effect.
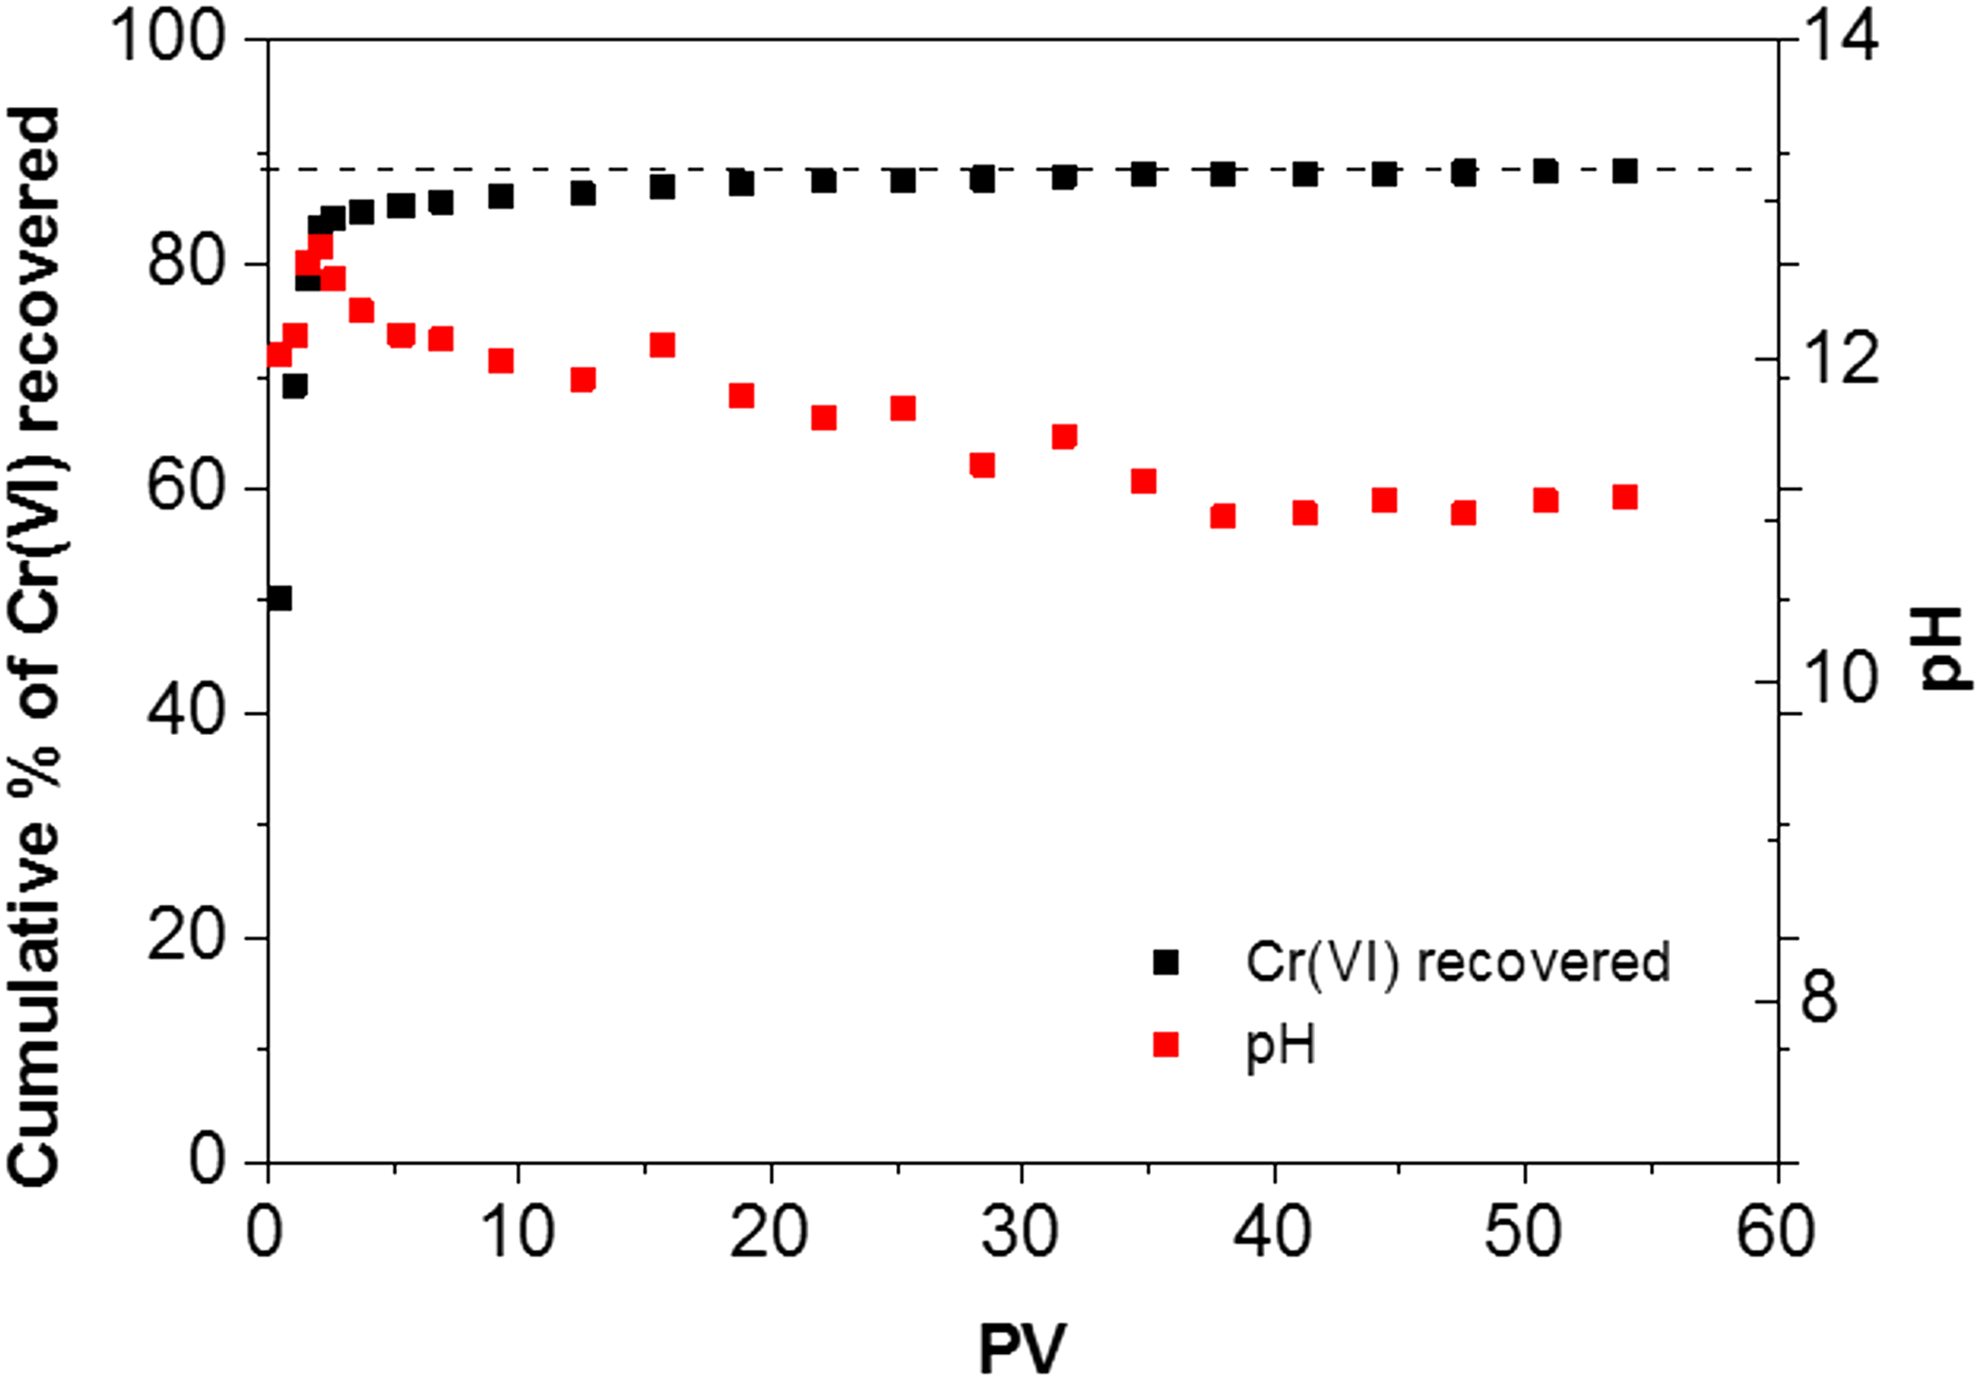
Cumulative percentage of total Cr(VI) and pH in solution during column leaching.
The batch leaching experiments with different solutions were repeated for the leached COPR recovered from the column, shown in Fig. 2b. In this case, DI water and sodium sulfate both leached 75% of the remaining Cr(VI) after 336 h (2 weeks) of leaching, while decreasing the pH with HNO3 to 7.5 resulted in complete dissolution of Cr(VI) in 2 weeks. In both cases, the dissolution was a slow process, unlike the original COPR.
The TCLP test yielded a Cr concentration of 380.62 ± 8.9 mg/L for original and 17.45 ± 0.2 mg/L for column-leached COPR, with a final pH of 5.89 and 5.45, respectively. Thus, while both materials are hazardous waste, column-leached COPR has substantially lower concentrations and is likely easier to treat.
Overall, both experiments indicate that ∼90% of the Cr(VI) in COPR is readily recoverable, likely due to incomplete recovery during the leaching process. Optimization of the leaching process could reduce the residual concentration of Cr(VI) that requires treatment to less than 1,000 mg/kg, leading to significant reduction in pollution and cost savings for remediation. The residual Cr(VI) leached very slowly during the batch and column tests, indicating different speciations and geochemical behaviors. To better understand the differences, the COPR leaching behavior as a function of pH was studied in the two materials (original and column-leached COPR) separately.
pH-dependent batch leaching of original and column-leached COPR
Buffering capacity curves of soda ash COPR are shown in Supplementary Fig. S4. Small differences were observed between the original and column-leached COPR, mainly in the pH range 8–10. The reason for the similar behavior is that pH in the column-leached COPR released only slightly and the released elements did not contribute substantially to the overall buffering capacity. The overall amount of acid required to decrease the pH to 2 was ∼6 molc/kg and the amount to decrease the pH to 8 was ∼1 molc/kg. Lime-based COPR had a total buffering capacity of 30 molc/kg and the amount of H+ required to decrease pH from 12.5 to 8 was between 5 and 10 molc/kg due to the high portlandite contents in COPR (Chrysochoou et al., 2010). Thus, even though both materials are highly alkaline, the amount of buffering capacity imparted by soda ash is much lower compared with lime. This facilitates pH decrease, which may be desired or necessary for reductive treatment. Soda ash COPR exhibits a plateau around pH 8, which indicates the dissolution of solid phases at that pH.
Concentrations of cations and anions in the original and column-leached COPR are shown in Figs. 4, 5, Supplementary Figs. S6 and S7. The aqueous concentration of Cr(VI) in the original COPR was approximately constant between 10 and 12.5 and continuously decreased as the pH was lowered. The ratio of the Cr(VI) concentration at LS5 and LS10 was 1.8–1.9 above pH 8 and decreased to 1.6 at lower pH values. A ratio of 2 indicates availability control, while a ratio of 1 indicates full solubility control. As the pH decreases, two processes are possible for Cr(VI) decrease in solution: (a) sorption on iron oxides and other positively charged surfaces and (b) reduction, if Fe(II) from chromite and ferrite in the solid is released at low pH (less than 4 or 5). The comparison between the Cr(VI) and total Cr (Supplementary Fig. S5) concentrations shows that Cr(III) is difficult to evaluate in this case because the measurement error associated with both parameters is higher than the potential Cr(III) concentration in solution.
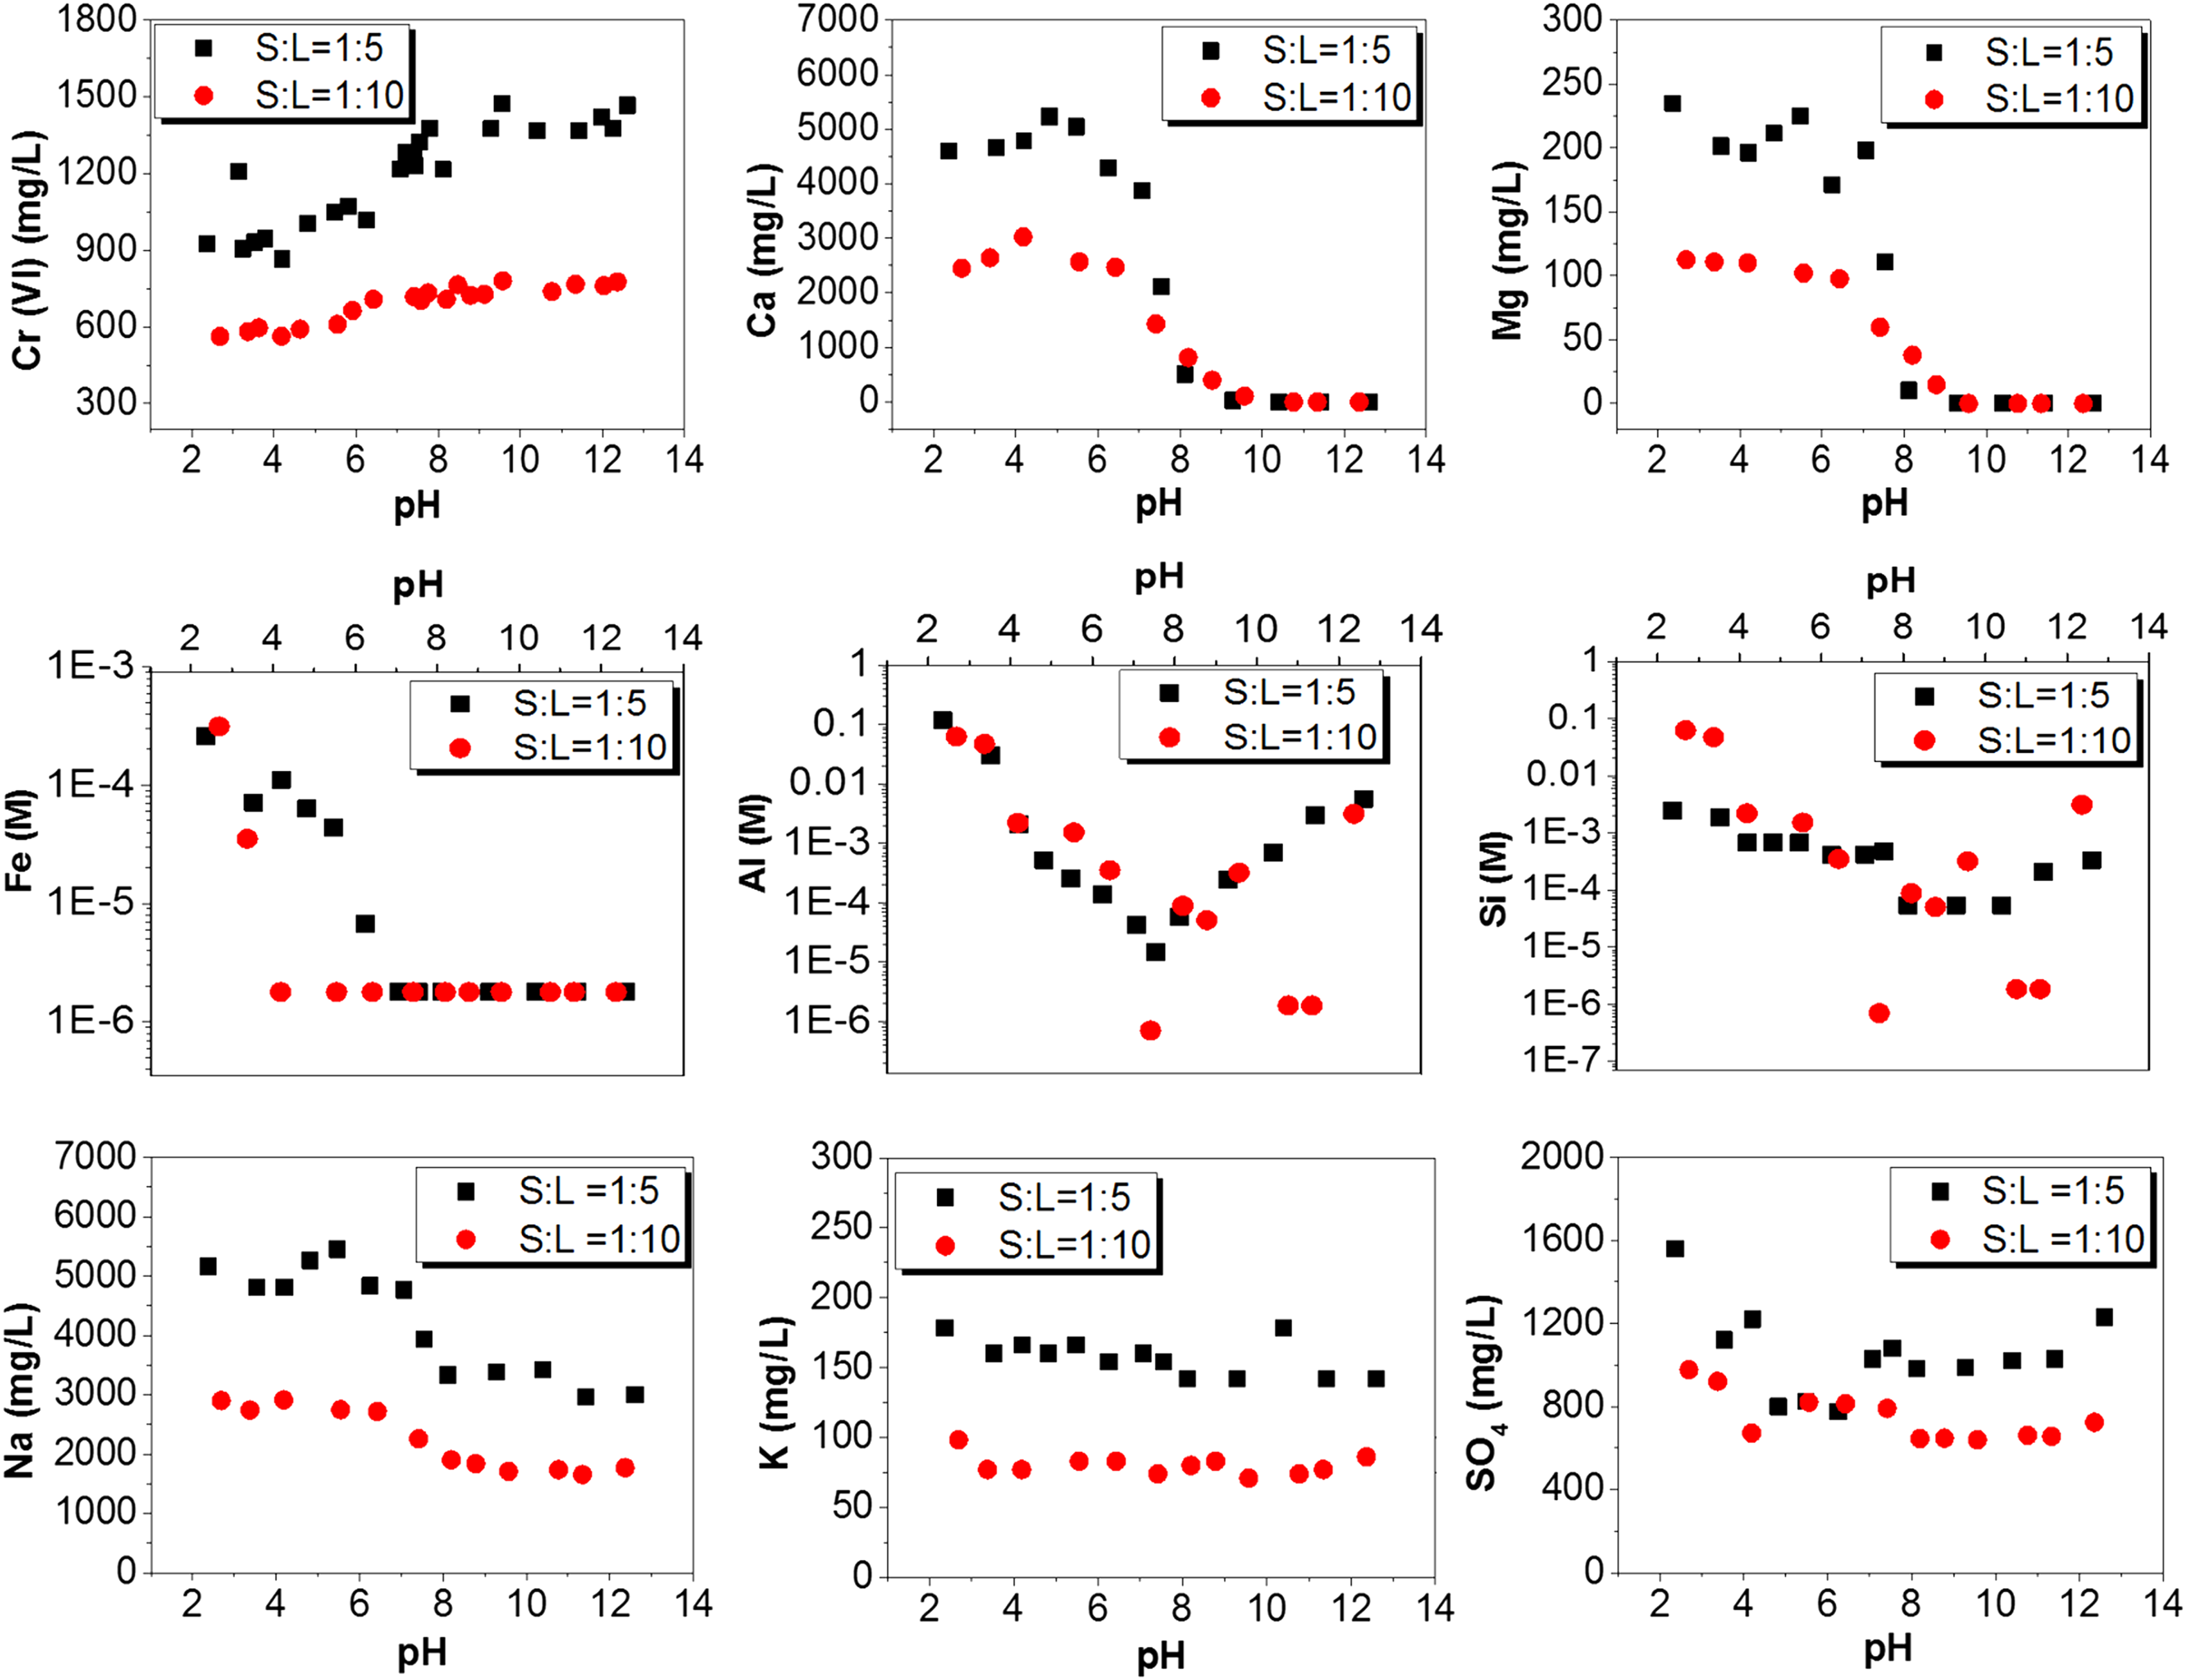
Aqueous concentrations of various elements in batch tests with LS 5 and 10 at 3 weeks of reaction time for original soda ash COPR.

Aqueous concentrations of various elements in batch tests with LS 5 and 10 at 3 weeks of reaction time for column-leached soda ash COPR.
Cr(VI) leaching behavior of the column-leached COPR is very different from the original COPR, and is in fact similar to the Cr(VI) leaching behavior of lime-based COPR (Geelhoed et al., 2002). Dissolved Cr(VI) is approximately constant in the pH range 8.8–10 and then quickly increases to reach 100% of the available Cr(VI) at pH 7.7, followed by a progressive decrease. This indicates the presence of solid Cr(VI) hosts that dissolve when the pH decreases below 10, as was the case with lime-based COPR. The decrease in Cr(VI) concentration below pH 8 can be similarly attributed to sorption and potentially also reduction at pH values lower than 4. A reversibility test was performed, in which the pH was lowered to 4 and then increased back to pH 12 using NaOH. The Cr(VI) concentration measured in the final solution was lower than the initial concentration, so that reduction appears to be the most likely process for Cr(VI) removal from solution.
Concentrations of Fe, Si, and Al exhibited solubility control, since the LS5 and LS10 curves are very similar. They are also very similar to the curves shown by Geelhoed et al. (2002) for lime-based COPR, both as curve shape and absolute values. The only observed difference is that Al in soda ash COPR showed amphoteric behavior, with increased solubility in both high and low pH, while lime-based COPR only showed Al in solution below pH 6.
The dissolution of Ca and Mg was essentially identical in original and column-leached COPR. Both elements exhibit solubility control down to pH 8. While lime-based COPR showed similar behavior, both Ca and Mg showed solubility control only at higher pH values (9 for Mg and 10.5 for Ca) (Geelhoed et al., 2002). This indicates differences in the mineralogical makeup of the two materials. The leaching pattern of both elements shifted to availability controlled dissolution below pH 8. About 75% of the totally available Ca leached at pH 2, while only 1% of Mg leached even at pH 2. This is because chromite is the main Mg host, which is recalcitrant to dissolution even in acidic pH. An analysis of original COPR after 1 day of equilibration (Supplementary Fig. S6) showed that Mg increased between 1 day and 3 weeks, while Cr(VI) and Ca remained the same. Chromite dissolution is kinetically controlled, slowly releasing Mg into solution so that thermodynamic equilibrium cannot be reached. Chromite persists in COPR deposited in the subsurface for decades, so that attainment of equilibrium under field conditions is not expected for environmentally relevant time frames.
The maximum sodium concentration in the soda ash COPR was 3,000 mg/L (original, LS10) and 1,500 mg/L (column leached, LS10), respectively. The ratio between the two LS ratios is ∼1.8 in the entire pH range for both materials, so that there is no solubility control and Na is always readily available to leach. The sodium concentration is much higher compared with the lime-based COPR (max 350 mg/L in Geelhoed et al., 2002), which is due to the replacement of lime by soda ash. In contrast to sodium, potassium leaching in original and column-leached COPR is much different. No solubility control is observed for original COPR in the entire pH range, while full solubility control is observed in the entire pH range for column-leached COPR. This shows that all available K+ was leached during the column leaching process and only a K-solubility controlling solid remained in the column-leached COPR. No data are available for comparison with the lime-based COPR.
Nickel (Supplementary Figs. S5 and S6) follows the expected geochemical behavior in that it is insoluble at pH above 8, and progressively becomes more soluble with decreasing pH. The maximum soluble concentration is ∼30% of the Ni measured in the solid by XRF. Ni may be present in Ni(OH)2 that dissolves at low pH and also be present as inclusion in chromite, which is not available even at low pH values.
For anions, sulfate, chloride, nitrate, phosphate, and carbonate were measured in solution in addition to chromate. The measured anion concentrations closed the charge balance with cations within 1% error, which provides confidence in the analytical results across the pH range and in the geochemical modeling. Nitrate and phosphate were either nondetect (for P) or very low (for NO3−) and are not shown. Chloride was primarily derived from HCl used to decrease the pH so that the measured concentration was in good correlation with the added amount in the batch solution. The sulfate leached from original COPR showed a relatively small variation in concentration as a function of pH (700–950 mg/L at LS 10) and the LS5/LS10 ratio was ∼1.5 through the pH range, exhibiting a mixed character between availability and solubility control. The sulfate concentration in the leached column showed clear solubility control in the pH range 12–8, indicating that the readily available sulfate had leached during the column leaching, leaving a precipitate in the solid. The carbonate concentration (Supplementary Fig. S7) was identical to the curve shown by Geelhoed et al. (2002), as it is controlled by the carbonate system and CaCO3 precipitation. These trends were further investigated through geochemical modeling.
Geochemical modeling
Figure 6 shows the saturation indices (SI) for selected precipitates that had values >0 and were thus potential solubility controlling phases for the elements involved. Additional results of the sensitivity analysis for the Fe-bearing phases are shown in Supplementary Fig. S8.
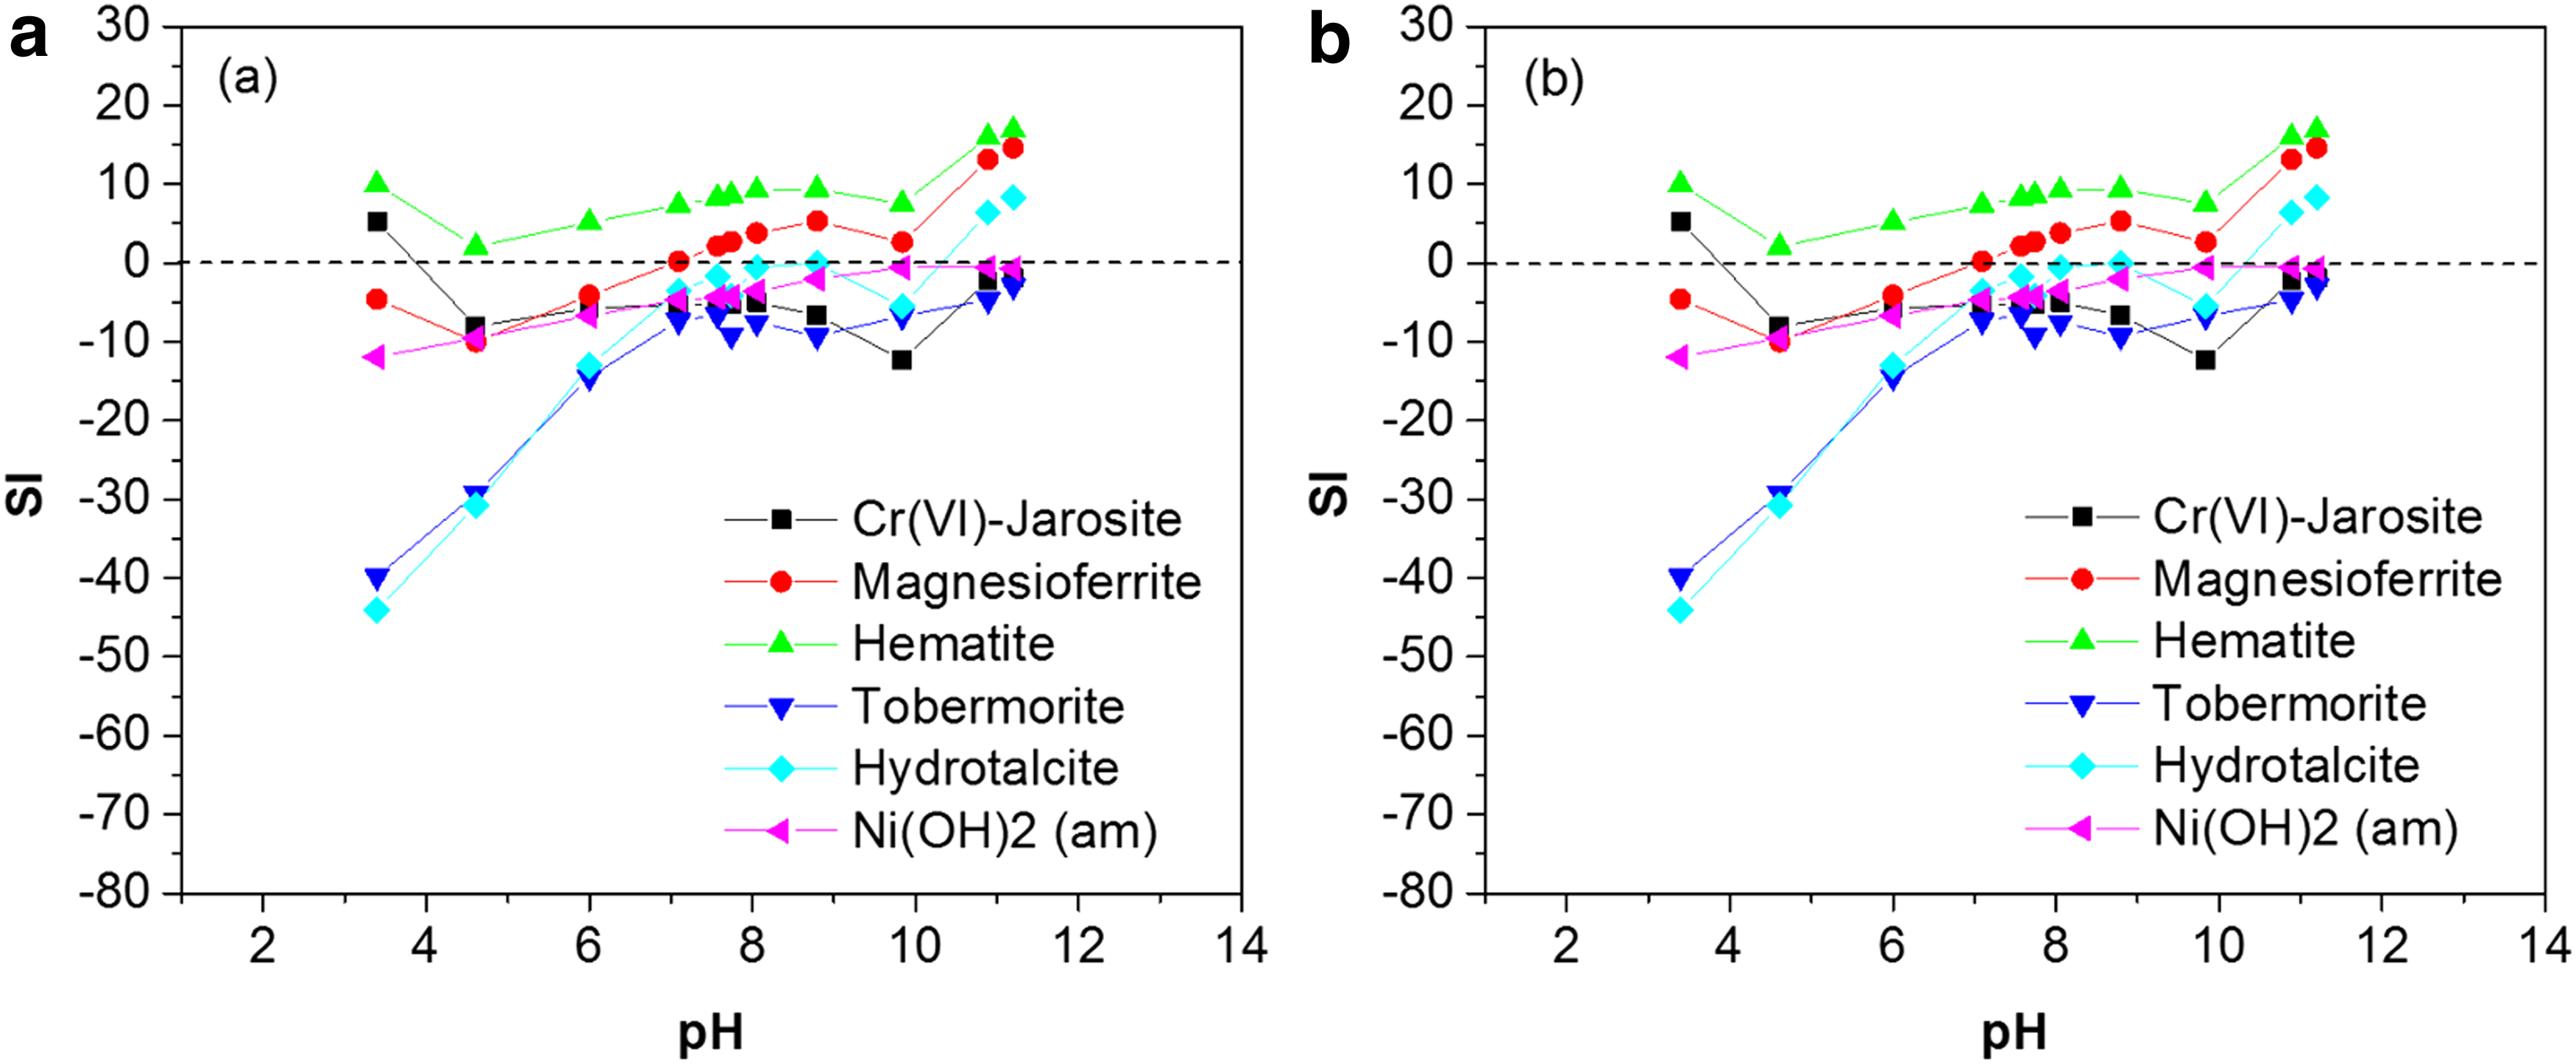
Saturation indices of selected potential solubility controlling phases in original
In terms of Cr(VI)-solubility controlling phases, the modeling results showed that the solution was highly undersaturated with respect to Cr(VI)-ettringite and Cr(VI)-hydrocalumite for both original and column-leached COPR. Hydrotalcite (Mg4Al2(OH)12(CO3)·2H2O) was found to be saturated approximately down to pH 8.7 and undersaturated at pH 8.1. Hydrotalcite is known to be a host for Cr(VI) (Frost et al., 2005) and has been reported by Chrysochoou et al. (2009) to have the ability to host Cr(VI) in lime-based COPR. Because of the presence of Mg in the structure, hydrotalcite is stable down to lower pH values (∼8) compared with Ca-bearing cementitious phases that dissolve around pH 10 and was thus thought to be responsible for the Cr(VI) fraction that was recalcitrant to reductive treatment (Chrysochoou et al., 2009). Thus, hydrotalcite is a viable candidate as Cr(VI)-host and solubility controlling phase for Cr(VI) in soda ash COPR as well.
Geochemical modeling results also indicated that Cr(VI)-jarosite is a potential solubility controlling phase for Cr(VI) below pH 4. Cr-jarosite (KFe3(CrO4)2(OH)6) is a structural analog of jarosite (KFe3(SO4)2(OH)6) (Bonnin and Lecerf, 1966; Powers et al., 1975), which SO42+ is substituted by CrO42+. Jarosite is stable in acidic pH (<3) and transforms to more stable Fe-phases such as goethite at higher pH values (Baron and Palmer, 1996); thus, it is unlikely to form in likely COPR pH environments.
Various Fe-bearing phases are oversaturated, with the pH range depending on the actual Fe concentration (Supplementary Fig. S8). The highest SI were calculated for hematite and magnesioferrite, which is a Cr-free analog of chromite. Hematite was observed by XRD and thus modeling correctly captures the phase assemblage of COPR, despite the uncertainty in the Fe concentration. Magnesioferrite is also likely to control Mg solubility, since it was predicted to become unstable at pH 7.4, that is, around the pH value at which Mg concentration increased sharply in solution. Brucite (Mg(OH)2), which was found to control Mg in lime-based COPR, was undersaturated across the entire pH range.
The only predicted solubility controlling phases for Ca in the pH range 9–12.5 was tobermorite ((CaO)0.83SiO2(H2O)1.3); all calcium aluminate hydrates were undersaturated across the entire pH range. Calcite and aragonite were predicted to be stable in a narrow pH range (7.5–9.5), on tobermorite dissolution. The Al concentration was most likely controlled by Al hydroxides (diaspore, boehmite, and gibbsite), which were saturated across the entire pH range. Similarly, Ni solubility was related to Ni(OH)2, which was saturated in the pH range for which Ni-solubility control was observed, that is, above pH 8. No solubility controlling phase for potassium could be identified in the column-leached COPR modeling results, despite that the leaching results clearly indicated the presence of one across the entire pH range.
Overall, the modeling results for the original and column-leached COPR were similar and did not reveal the reasons for the different leaching behaviors. There are two possible reasons for this: (a) if there was residual Na2CrO4 in the original COPR, this was likely undersaturated in the entire pH range, leading to availability control; and (b) processes other than precipitation, that is, sorption and reduction, controlled Cr(VI) behavior below pH 8, and these are not captured by the model.
Conclusions
Results of chemical, mineralogical, and leaching analyses of COPR derived from the soda ash process indicated both similarities and differences in the composition and behavior of the two materials. Specifically:
Both materials are highly alkaline (pH >12.5); however, soda ash COPR has significantly lower buffering capacity compared with lime-based COPR. The two materials have similar Cr2O3 concentrations (3–7 wt.%), taking into account the dilution imposed by the high amount of lime in lime-based COPR. Other major elements (Fe, Mg, Si, Al) are influenced both by dilution and by the composition of the source ore. Residual Cr(VI) in soda ash COPR (8,500 mg/kg) was found to be 90% soluble in water and thus easily exchangeable and recoverable by optimization of the leaching step in the process. Only about 850 mg/kg Cr(VI) was not leachable at natural pH, which renders residual Cr(VI) concentration in soda ash COPR generally lower compared with lime-based COPR. The residual Cr(VI) in soda ash was recovered 100% when an HNO3 solution was used to decrease pH to ∼8. XRD identified chromite as the main crystalline phase in soda ash COPR. Cr(VI)-hydrotalcite emerged as a potential solubility controlling phase for Cr(VI) in soda ash COPR above pH 8, a phase that was previously identified as Cr(VI) host in lime-based COPR. Other Cr(VI) precipitates in lime-based COPR were found to be highly undersaturated in soda ash COPR. Magnesioferrite, tobermorite, hematite, and calcite were other phases identified by XRD and/or geochemical modeling.
Based on these observations, although both lime-based COPR and soda ash COPR are hazardous waste, it is concluded that the soda ash process yields a residual waste that could be more environmentally friendly compared with the lime-based COPR, not only because of the lower amount of waste produced but also due to the lower buffering capacity and residual Cr(VI) that cannot be recovered by a simple leaching process.
Footnotes
Acknowledgment
The authors thank Prof. Dongyun Du for access and experimental support at the laboratory facilities in South Central University for Nationalities, Wuhan, China.
Author Disclosure Statement
No competing financial interests exist.
References
Supplementary Material
Please find the following supplemental material available below.
For Open Access articles published under a Creative Commons License, all supplemental material carries the same license as the article it is associated with.
For non-Open Access articles published, all supplemental material carries a non-exclusive license, and permission requests for re-use of supplemental material or any part of supplemental material shall be sent directly to the copyright owner as specified in the copyright notice associated with the article.