
Abstract
Abstract
Struvite crystallization, a chemical precipitation method for the recovery of nutrients, has been extensively studied. However, there is a lack of knowledge about the effect of different interacting factors on the purity of struvite. In this study, a central composite design using response surface methodology, scanning electron microscopy-energy dispersive X-ray spectrometry, and X-ray diffraction was employed to investigate the effects of pH, the Mg/P ratio and Ca2+ interactions on struvite purity. These characterization results showed that pure struvite was produced when the pH was lower than 8.5. When the pH increased from 8.5 to 10.0, the purity of struvite decreased, and a large amount of calcium carbonate appeared in the precipitate. A lower magnesium salt dosage (with an Mg/P molar ratio lower than 1.8:1) failed to compete with calcium for phosphate ions, which resulted in the formation of impurities in struvite. In addition, an excessive Mg dosage was found to not improve the purity. In consideration of the purity of the obtained struvite and the cost of the chemical reagents, the operation parameters were optimized. Results showed that the best conditions for the crystallization of pure struvite were pH 8.5 and an Mg/P ratio of 1.8:1. Furthermore, the recovery efficiencies of phosphate, ammonia nitrogen, and calcium were 88.9%, 9.6%, and 0.9%, respectively.
Introduction
W
AD is known to convert animal waste into profitable by-products to solve pollution problems, and it is also becoming a mature technology for highly polluted wastewater treatment (Yetilmezsoy and Sakar, 2008). However, owing to the intrinsic process characteristics, a large amount of anaerobically digested cattle manure wastewater (ADCMW) is produced simultaneously during the AD process (Güngör-Demirci and Demirer, 2004; Mähnert and Linke, 2009).
ADCMW is a typical wastewater product that contains a complex composition with a high concentration of nitrogen (N) and phosphorus (P) (Wang et al., 2010; Triger et al., 2012; Liu et al., 2013a; Huang et al., 2016a). When ADCMW is directly discharged into the environment, it can cause serious environmental problems such as eutrophication and groundwater pollution (Liu et al., 2013b, 2016). Current global reserves of phosphate ore, a crucial nonrenewable natural resource, were estimated to be available for approximately only the next 50–100 years (Jordaan et al., 2010).
Furthermore, according to strict environmental regulations, anaerobic digested effluents need to be further treated to reduce the phosphate concentration (Kumar and Pal, 2015). Based on the above considerations, finding a suitable technology for recovering phosphate from ADCMW is a very emergent area of research. Several phosphate removal methods, such as hybrid anion exchange resins (O'Neal and Boyer, 2013), biological phosphate removal (BPR), and chemical precipitation, have been widely studied. Conventional strong-base anion exchange resins have a higher selectivity for sulfate over phosphate, which results in limited applications (Sengupta and Pandit, 2011).
BPR is the most popular technology used presently (Kim et al., 2013; Liu et al., 2014; Semerci and Hasılcı, 2016). However, BPR can create phosphate waste without a proper method of sludge disposal, which causes difficulties in biological treatment to recover phosphate (Zhang et al., 2013). Taking the economic impact of increasing energy costs and limited natural nutrient resources into account, chemical precipitation shows many advantages (Uludag-Demirer, 2008; Moerman et al., 2009). From the perspective of sustainable development and owing to the abundant existence of mineral fertilizer from ADCMW, recovering dissolved phosphate through chemical precipitation can provide a new source of renewable mineral resources in a cost-effective way.
The struvite precipitate method (SPM), one of the most efficient methods for recovering nutrients, has attracted much attention (Wilsenach et al., 2007; Liu et al., 2011; Siciliano and De, 2014). NH4+-N and PO43−-P can be recovered from wastewater simultaneously by a simple struvite precipitation process (Bouropoulos and Koutsoukos, 2000; Chimenos et al., 2003; Uludag-Demirer and Othman, 2009). Struvite (MgNH4PO4·6H2O) is an insoluble double salt containing N and P that can be potentially used as a slow-release fertilizer (Huang et al., 2016b; Siciliano, 2016; Talboys et al., 2016). The reaction of struvite formation is described in Equation (1) (Doyle and Parsons, 2002):
Operating cost can be reduced $1.133 in Australia (Shu et al., 2006) and $0.74 in the United States (Booker et al., 1999) by recovering 1 kg of pure struvite from wastewater. Therefore, purity is an important parameter for saving operating costs because impurities will reduce the sale price (Zheng et al., 2004). The purity of struvite is affected by many factors, such as pH, Ca2+ concentration, and the Mg/P ratio (Le Corre et al., 2005; Song et al., 2011).
Yu et al. (2013) have investigated the effect of pH on struvite formation by using Mg(OH)2 as the pH regulator and magnesium source, and they found that struvite could hardly form when the pH was higher than 10.0. High concentrations of Ca2+ would interrupt struvite crystal nucleation and growth due to phosphate consumption and calcium phosphate formation. Mg2+ and NH4+ are indispensable in the formation of struvite, which results in efficient phosphate recovery.
The NH4+-N concentration has been found to be more than five times higher than the concentration of PO43−-P in ADCMW, and Mg2+ is the limiting chemical element in the formation of struvite (Suzuki et al., 2007). Phosphate recovery increases with an increase in the Mg/P molar ratio, but an excessive Mg dosage shows only slight effects on the efficiency of struvite crystallization (Le Corre et al., 2007; Rahaman et al., 2008; Shi et al., 2012). Therefore, the addition of a moderate amount of external Mg sources is necessary.
There are many related reports that focus on proving the influence of single-impact factors among pH, Ca2+ concentration, and Mg/P ratio on the formation of struvite. However, very little is known about the collective effect of pH, Ca2+ concentration, and Mg/P ratio. The effects of these interacting factors on the crystallization of struvite still need to be ascertained.
The objectives of this study are as follows: (1) to recover pure struvite from ADCMW by SPM; (2) to investigate the effect of pH, concentration of Ca2+, and Mg/P ratio on the formation of struvite; (3) to optimize the parameters of struvite precipitation with economic analysis by applying response surface methodology (RSM); and (4) to explore the effect of the impact factors' interactions on the struvite purity mechanism.
Materials and Methods
ADCMW was collected from the anaerobic fermentation pool of a biogas project in Harbin Heilongjiang province. Subsequently, the ADCMW was first centrifuged at 10,000 rpm (4°C) for 30 min using a high-speed refrigerated centrifuge (H2050R; Xiangyi, China) and then stored at 4°C for future experiments. The raw ADCMW characteristics are summarized in Table 1. NaOH and MgCl2·6H2O were used in the experiments as analytical reagents. All of the tests were performed in triplicate and the averaged results are provided in Table 1. The values after the plus and minus signs are standard deviations.
Test methods
Four consecutive steps were followed for the precipitation experiments: chemical addition, mixing, pH adjustment, and filtration. Based on the different initial Mg/P molar ratios of the samples, appropriate amounts of MgCl2·6H2O were added to the five beakers. Each beaker contained 1.4 L ADCMW, with different yield Mg/P ratios of 0.95:1, 1.2:1, 1.8:1, 2.4:1, and 2.7:1. After the reagent was added, the samples were mixed on magnetic stirrers for 30 min to dissolve the MgCl2·6H2O. Once the solutions were supersaturated, the crystallization process of struvite was not affected by temperature (Le Corre et al., 2007; Rahaman et al., 2008; Hanhoun et al., 2011; Shi et al., 2012) or stirring rate (Ronteltap et al., 2010). Thus, a rotating speed of 200 rpm/min and a temperature of 20°C were set.
The effluents of each beaker were evenly divided into seven new beakers so that each beaker contained 200 mL. 1.0 M NaOH was used to adjust the sample pH to 7.6, 8.0, 8.5, 9.0, 9.5, 10.0, and 10.4 (only pH of 7.6, 8.0, 9.0, 10.0, was 10.4 was used in RSM). Since the volume of NaOH added was very small, the dilution effect was negligible. The details are presented in Table 2.
After the pH adjustment, the reactor contents were allowed to settle for 1 h. After the completion of these reactions, the solutions were filtered through 0.45 μm cellulose acetate membranes and the filtrates were appropriately diluted and analyzed for NH4+-N, PO43−-P, Mg2+, and Ca2+. The residues were washed with distilled water to remove soluble salts before being dried at 45°C overnight. After drying, the precipitates were manually separated from the cellulose acetate membranes and kept at room temperature before X-ray diffraction (XRD) and scanning electron microscopy (SEM) analysis.
RSM design
Effects of the pH and Mg/P ratio on residual phosphate, ammonia nitrogen, and calcium were determined by modulating the variables according to a two-factor, five-level central composite design (CCD) with RSM. The 13 combinations used for the design were determined. The five coded factor levels for pH were 7.6 (−1.41), 8.0 (−1), 9.0 (0), 10.0 (1), and 10.4 (1.41), respectively; and for Mg/P, they were 0.9 (−1.41), 1.2 (−1), 1.8 (0), 2.4 (1), and 2.6 (1.41), respectively.
Data obtained from the CCD experiments were analyzed by Design-Expert 10 software and RSM; the F values and regression coefficients are shown in Table 3. Analysis of variance (ANOVA) was employed for the response function. The interactions of the variables were estimated by the second-order polynomial Equation (2):
where the predicted response Y is the dependent variable such as residual PO43− concentration, residual NH4+ concentration, and residual Ca2+ concentration. b0, bi, and bij are the offset term, the linear effect, and the interactive effect, respectively. When i < j, bii is the squared term and Xi is the ith variable, called the independent variable in coded values. Furthermore, a probability >0.05 is regarded as not significant in the final models. ANOVA for the entire quadratic model and the central point of the experimental domain is shown in Table 4.
Analytical methods
The pH was analyzed using a pH meter (PB-21, Germany). Inorganic ions were measured according to standard methods (APHA, 2005). NH4+-N and PO43−-P were analyzed according to standard methods for wastewater characterization using an ultraviolet spectrophotometer (Unico 2800A, China). The concentrations of NH4+-N in the filtrates were measured based on the Nessler method at a wavelength of 420 nm. The concentration of PO43−-P in the filtrate was examined according to the Molybdovanadate method at a wavelength of 700 nm. The concentrations of Ca2+ and Mg2+ were determined by an inductively coupled plasma-optical emission spectrometer under internal laboratory standard analytical conditions. In all experiments, phosphate and ammonia nitrogen recovery efficiency (R
i
) were calculated by the following Equation (3).
where Ci and Ce are ion concentrations in the influent and effluent, respectively. The chemical composition and morphology of the precipitates were analyzed with an SEM (ESEM, FEI Quanta 200FEG) equipped with energy dispersive X-ray spectrometry (EDS). The crystalline nature of the precipitate was analyzed with XRD (D8 Advance Bruker, Germany). All tests were performed in triplicate and the means of the results were calculated.
In the consideration of balancing the amount of pure struvite obtained and highest phosphate removal, economic evaluation of struvite crystallization was conducted based on the cost of reagents. The main calculation method is shown in Equation (4):
where the Income is the total price of struvite in both conditions and the Outcome is the cost of reagents, including NaOH and MgCl2·6H2O.
Results and Discussion
Effect of treatment parameters on formation of pure struvite
Phosphate removal
Figure 1 shows the residual phosphate concentration under different pH and Mg/P conditions. To explain the role of each variable and its second-order interactions in phosphate recovery, the following second-order polynomial model was used:
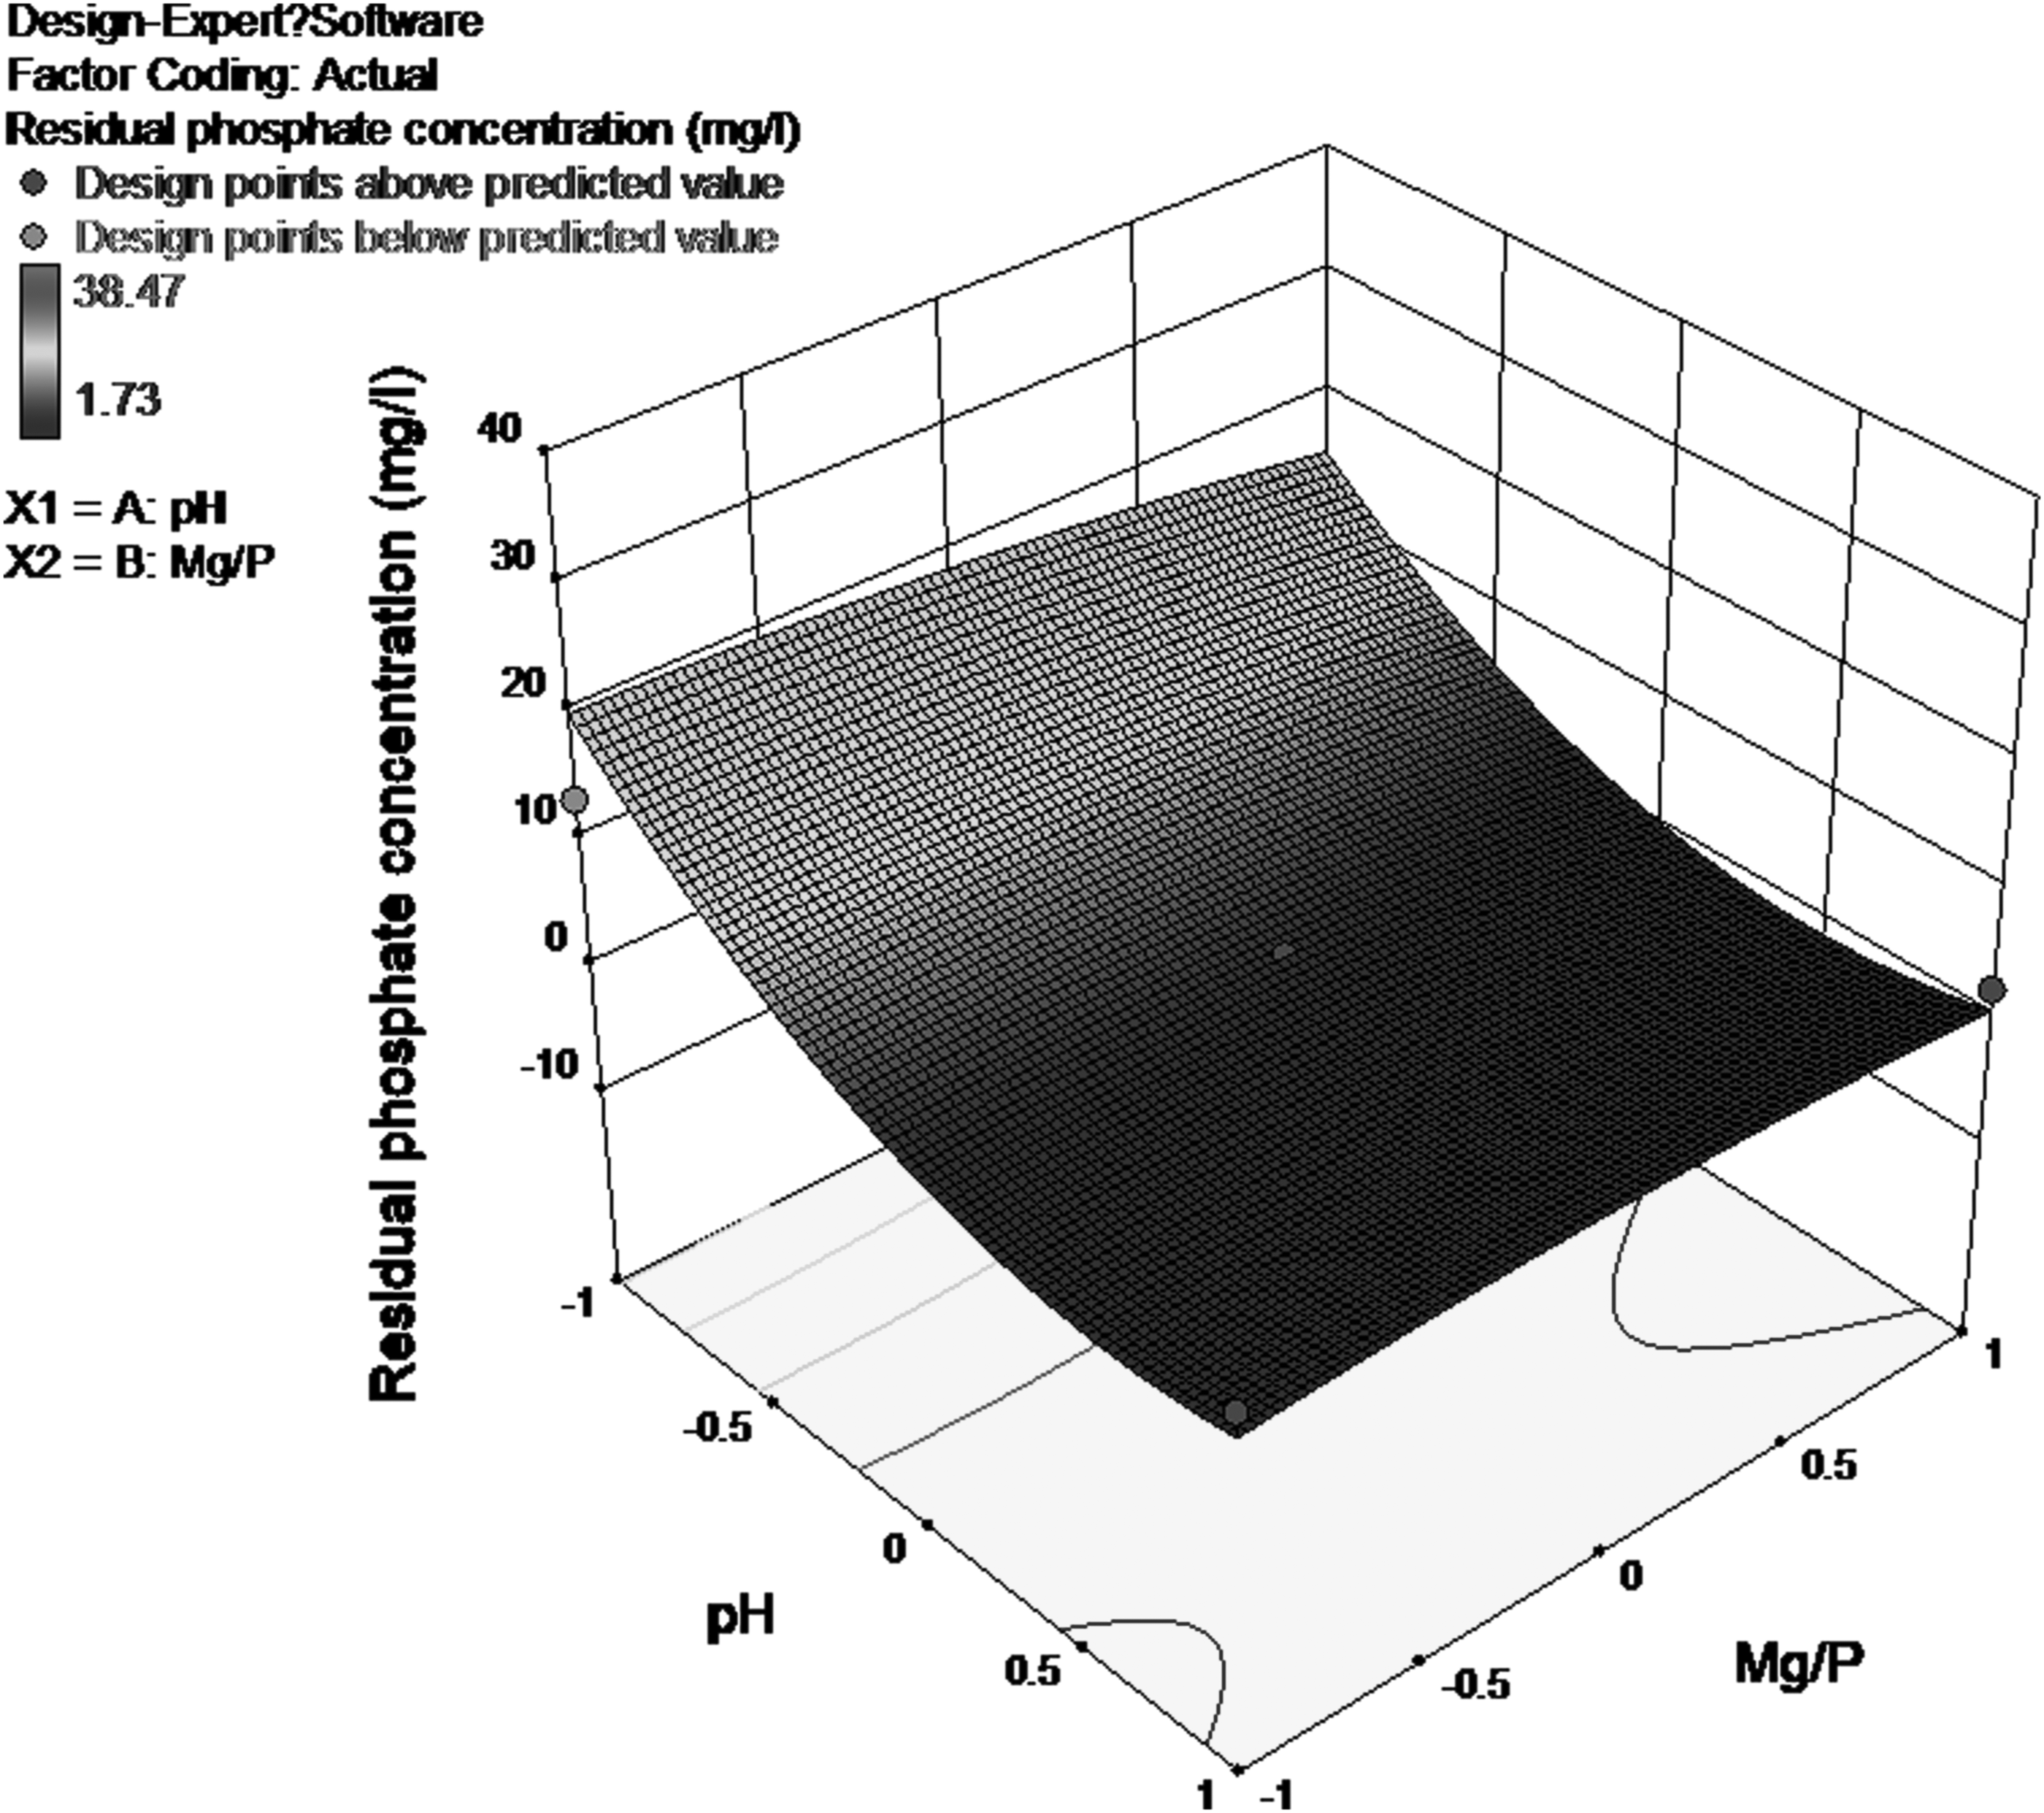
Residual phosphate concentration under different pH and Mg/P conditions.
According to Table 4, the F value of the total regression model was 6.94 and the probability was 0.0122, much smaller than 0.05. This result indicated that the application of the entire quadratic model was satisfactory for phosphate recovery from ADCMW. Furthermore, according to Table 3, the probability of pH for phosphate was 0.0027, which is lower than 0.05, and the probability of Mg/P was 0.5659, which is higher than 0.05. These results demonstrated that the effect of pH on the residual phosphate concentration is significant, but the effect of the Mg/P ratio is not significant.
In Fig. 1, the removal rate of phosphate increased significantly with increasing pH, and only 2 mg/L phosphate was left in the solution when the pH was greater than 9.0 (0 as the coded factor level in CCD). This result happened because more HPO42− and H2PO4− consumed the OH− and then converted it to PO43− as the pH increased. PO43− reacted with other ions such as Mg2+ and Ca2+, forming sediments that reduced the phosphate concentrations in the solutions. The residual phosphate concentration did not change significantly when the pH was greater than 9.5 (0.5 as the coded factor level in CCD) because the reaction shown below in Equations (6) and (7) had reached equilibrium. There were no more HPO42− and H2PO4− ions reacting with OH− and forming precipitates.
In terms of Mg/P, the removal of phosphate clearly increased with the increase in Mg/P ratio from 1.2 to 1.8 at pH = 8.0 (−1 as the coded factor level in CCD) and pH = 8.5 (−0.5 as the coded factor level in CCD). However, no significant phosphate removal occurred in different Mg/P ratios when the pH was higher than 9.0 (0 as the coded factor level in CCD). The phosphate gave priority to reacting with Ca2+, which resulted in the precipitation of amorphous calcium phosphate [Ca3(PO4)2·XH2O] at a low magnesium concentration. Ammonium magnesium phosphate formed with a stoichiometric ratio of [PO43−]/[Mg2+] (1:1), which was higher than the amorphous calcium phosphate stoichiometric ratio of [PO43−]/[Ca2+] (2:3). Therefore, a higher phosphate recovery rate was attained at high Mg2+ concentrations and low pH conditions due to the formation of ammonium magnesium phosphate.
When Mg/P exceeded 1.8, the excess Mg2+ held the advantage in the competition with Ca2+ for PO43− and could not further raise the removal efficiency of phosphate. In addition, the competition between Ca2+ and Mg2+ could also be observed under high pH conditions. No evident effect of the Mg/P ratio on the removal rate of phosphate was found under high pH levels. This result may be attributed to the fact that the major form of carbonate in water was CO32− when the pH was higher than 9.0 (0 as the coded factor level in CCD). CO32− reduced the calcium content by forming CaCO3, which weakened the competition with Mg2+ for PO43−. More phosphate was recovered when the pH was greater than 9.0 (0 as the coded factor level in CCD). However, many impurities such as CaCO3 were formed in the precipitates, which resulted in decreased struvite purity.
Meanwhile, the Mg/P ratio could be adjusted to 1.8 (0 as the coded factor level in CCD), not only obtaining a better recovery efficiency of phosphate but also reducing reagent costs.
Ammonia nitrogen removal
Residual ammonia nitrogen concentrations under different pH and Mg/P conditions are shown in Fig. 2. In addition, the following second-order polynomial model was employed to investigate the ammonia nitrogen:
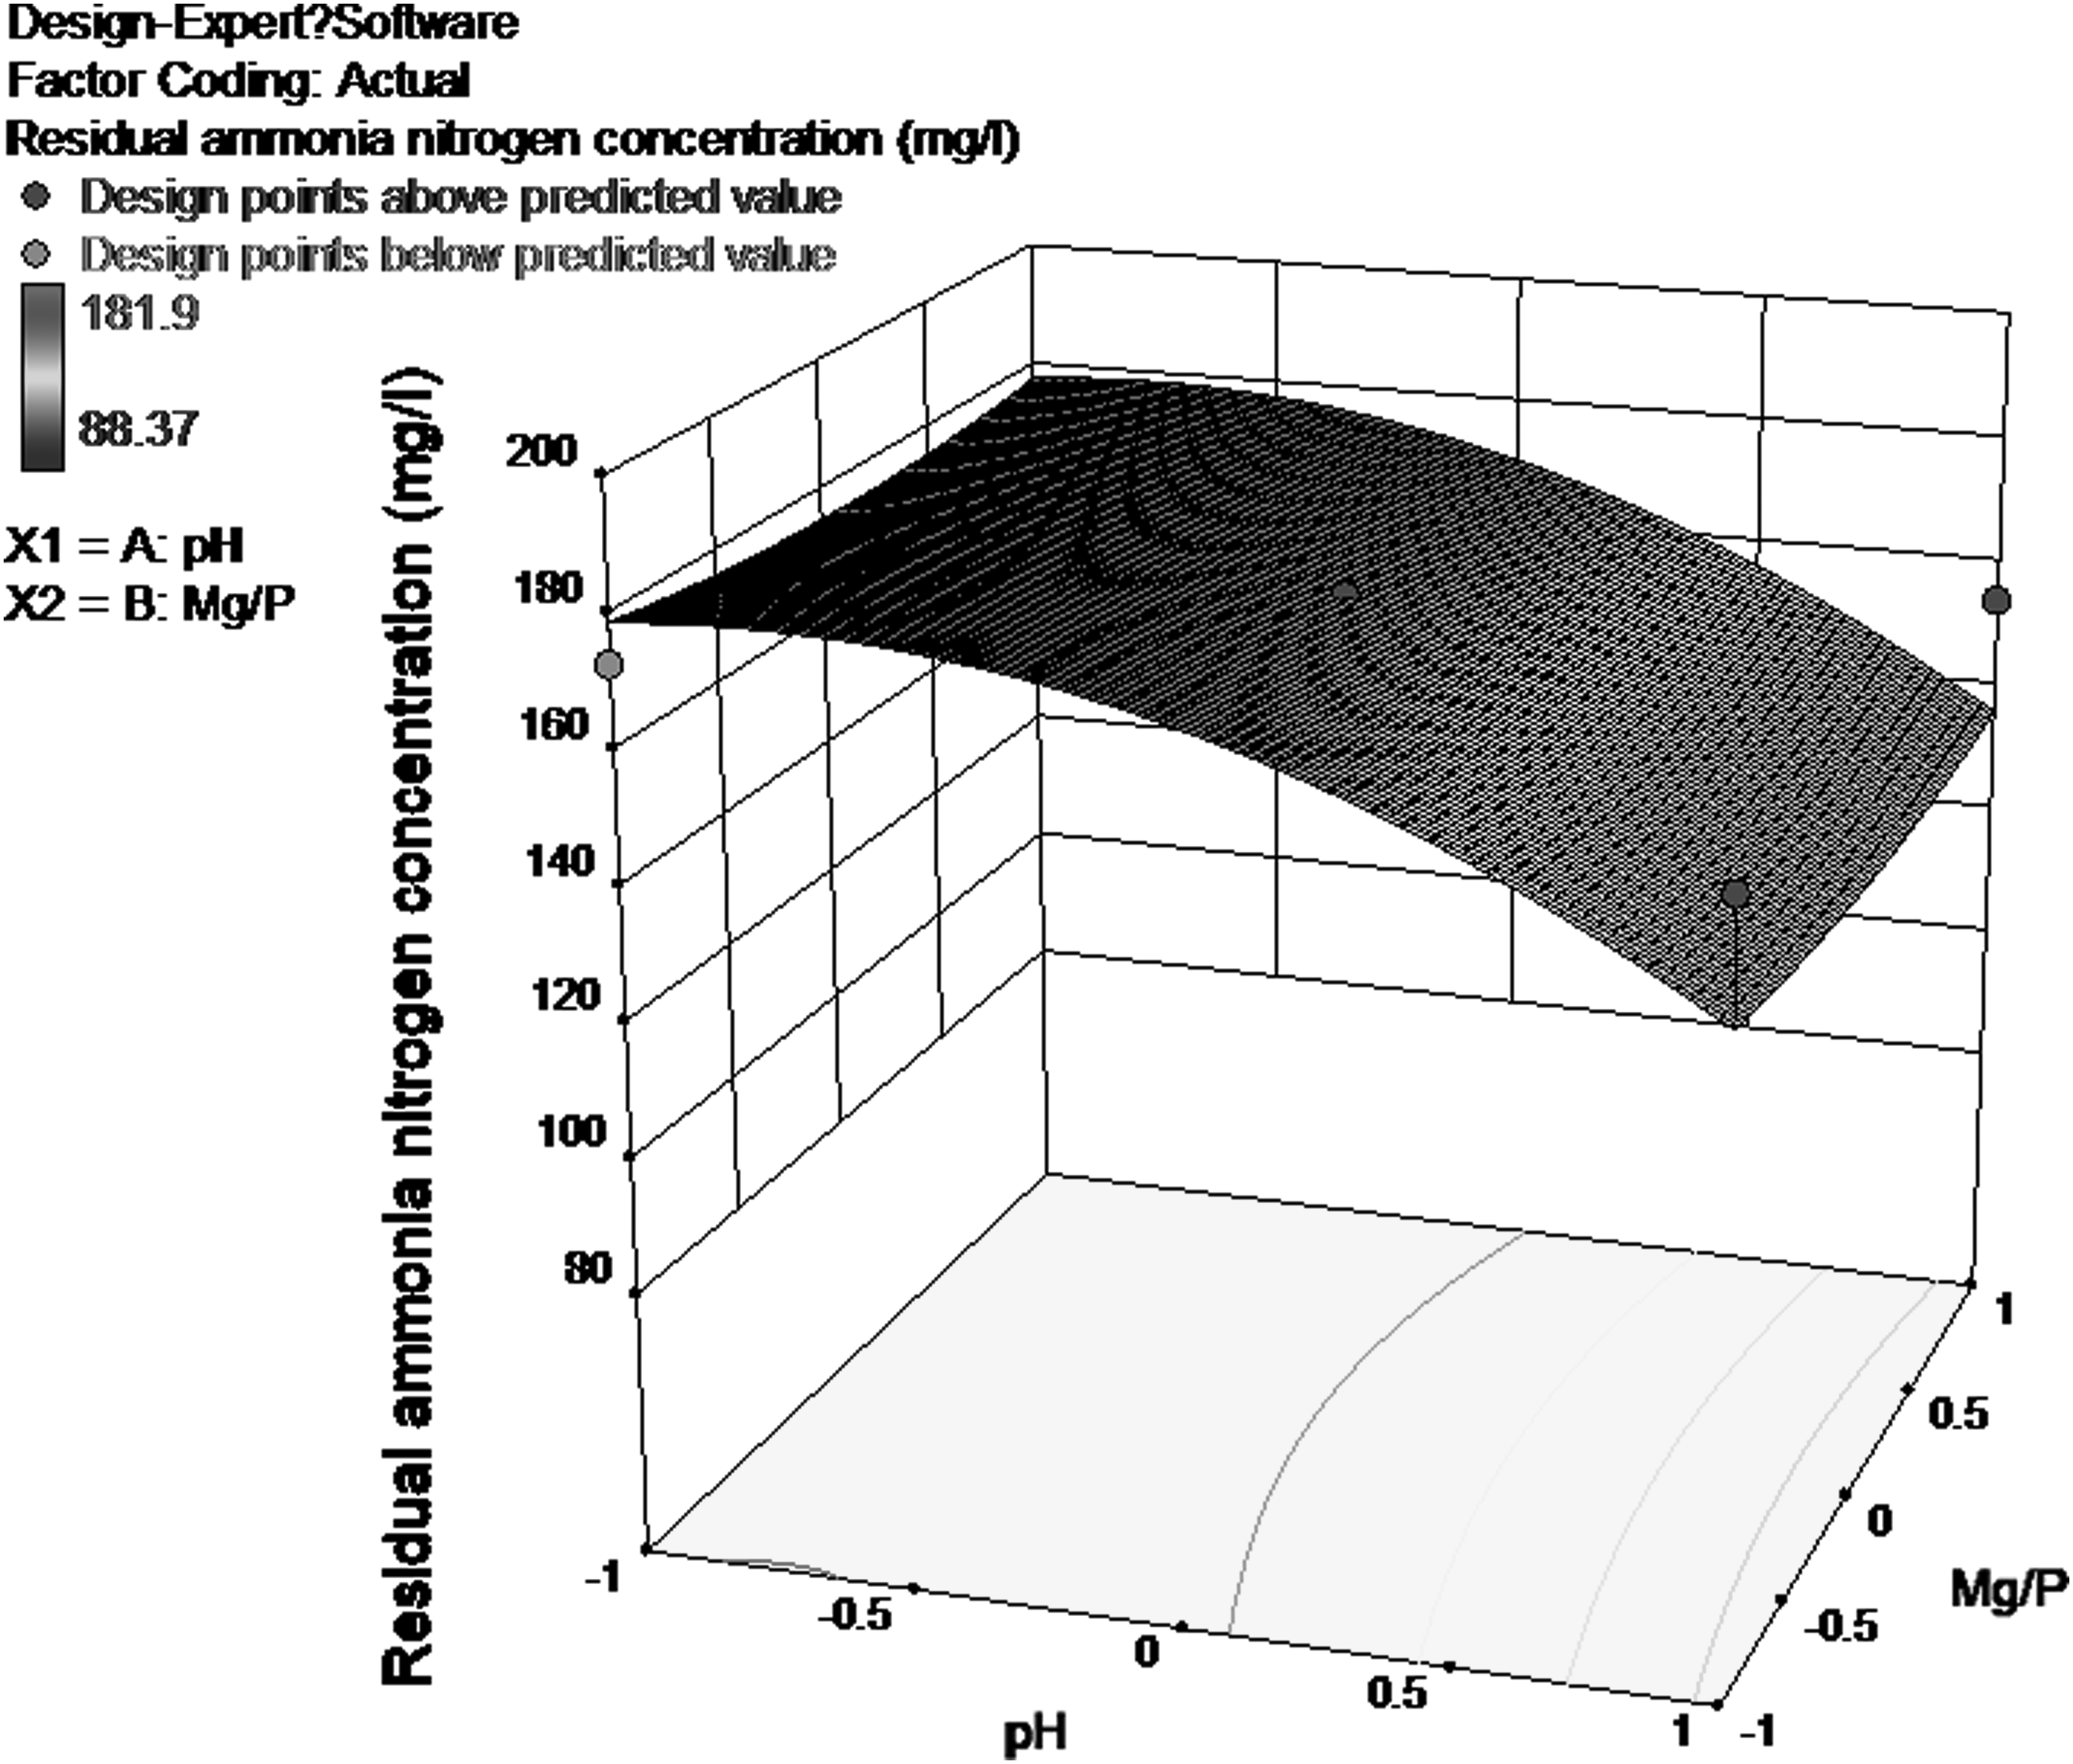
Residual ammonia nitrogen concentration under different pH and Mg/P conditions.
According to Table 4, the F value of the total regression model was 4.64 and the probability was 0.0346, much smaller than 0.05. This result indicated that the application of the entire quadratic model was satisfactory for ammonia nitrogen recovery from ADCMW. Furthermore, According to Table 3, the probability of pH for phosphate was 0.0052, which is lower than 0.05, and the probability of Mg/P was 0.9093, which is higher than 0.05. These results demonstrated that the effect of pH on the residual ammonia nitrogen concentration is significant, but Mg/P is not significant.
In Fig. 2, pH had pronounced positive effects on ammonia nitrogen removal in different Mg/P ratios, and the uptrend of removal of ammonia nitrogen began to slow down when the pH was raised to 9.0 (0 as the coded factor level in CCD) and 9.5 (0.5 as the coded factor level in CCD). The ammonium ions could not form other compounds, except for ammonium magnesium phosphate. Therefore, the removal of ammonia nitrogen should have stabilized when the removal rate of phosphate reached equilibrium.
However, the removal rate of ammonia nitrogen increased dramatically instead of achieving stability when the pH reached 10.0 (1 as the coded factor level in CCD). Based on the chemical equation NH4+ + OH− = NH3 + H2O, an increase in the concentration of OH− could accelerate the ammonia nitrogen transformation to NH3, which could lead to the release of ammonia from the solution under the current experimental conditions (ammonia stripping). Furthermore, the concentration of free ammonia in solution was a function of NH4+ concentration, pH value, and temperature (Lei et al., 2007), which is shown in Equation (9), where Ka is equilibrium constant of NH4+:
According to the above formula, when the pH value is 8.5 (−0.5 as the coded factor level in CCD) and the temperature is 20°C, only ∼2.1% of the ammonia nitrogen is in the form of free ammonia. When the pH is 10.0 (1 as the coded factor level in CCD), free ammonia can reach up to 22.4%. Therefore, the dramatically increased ammonia removal can be explained by the fact that the ammonia nitrogen escaped in the form of free ammonia instead of forming struvite. The chemical process is shown in Equation (10):
Mg3(PO4)2 in the precipitate decreased the purity of the struvite, which is consistent with the result that Mg3(PO4)2 forms when the pH is higher than 9.0 (0 as the coded factor level in CCD) (Hao et al., 2013). Therefore, choosing a lower pH is advisable to avoid the trap of producing massive quantities of impure precipitates.
The removal rate of ammonia nitrogen did not increase noticeably as the Mg/P ratio increased when the pH was higher than 9.0 (0 as the coded factor level in CCD). This outcome indicated that Mg dosage has no influence on the removal of ammonia nitrogen at higher pH levels.
Calcium ion removal
The effects of pH and Mg/P ratio on the effluent calcium ion concentration are shown in Fig. 3. The second-order polynomial model was as follows:
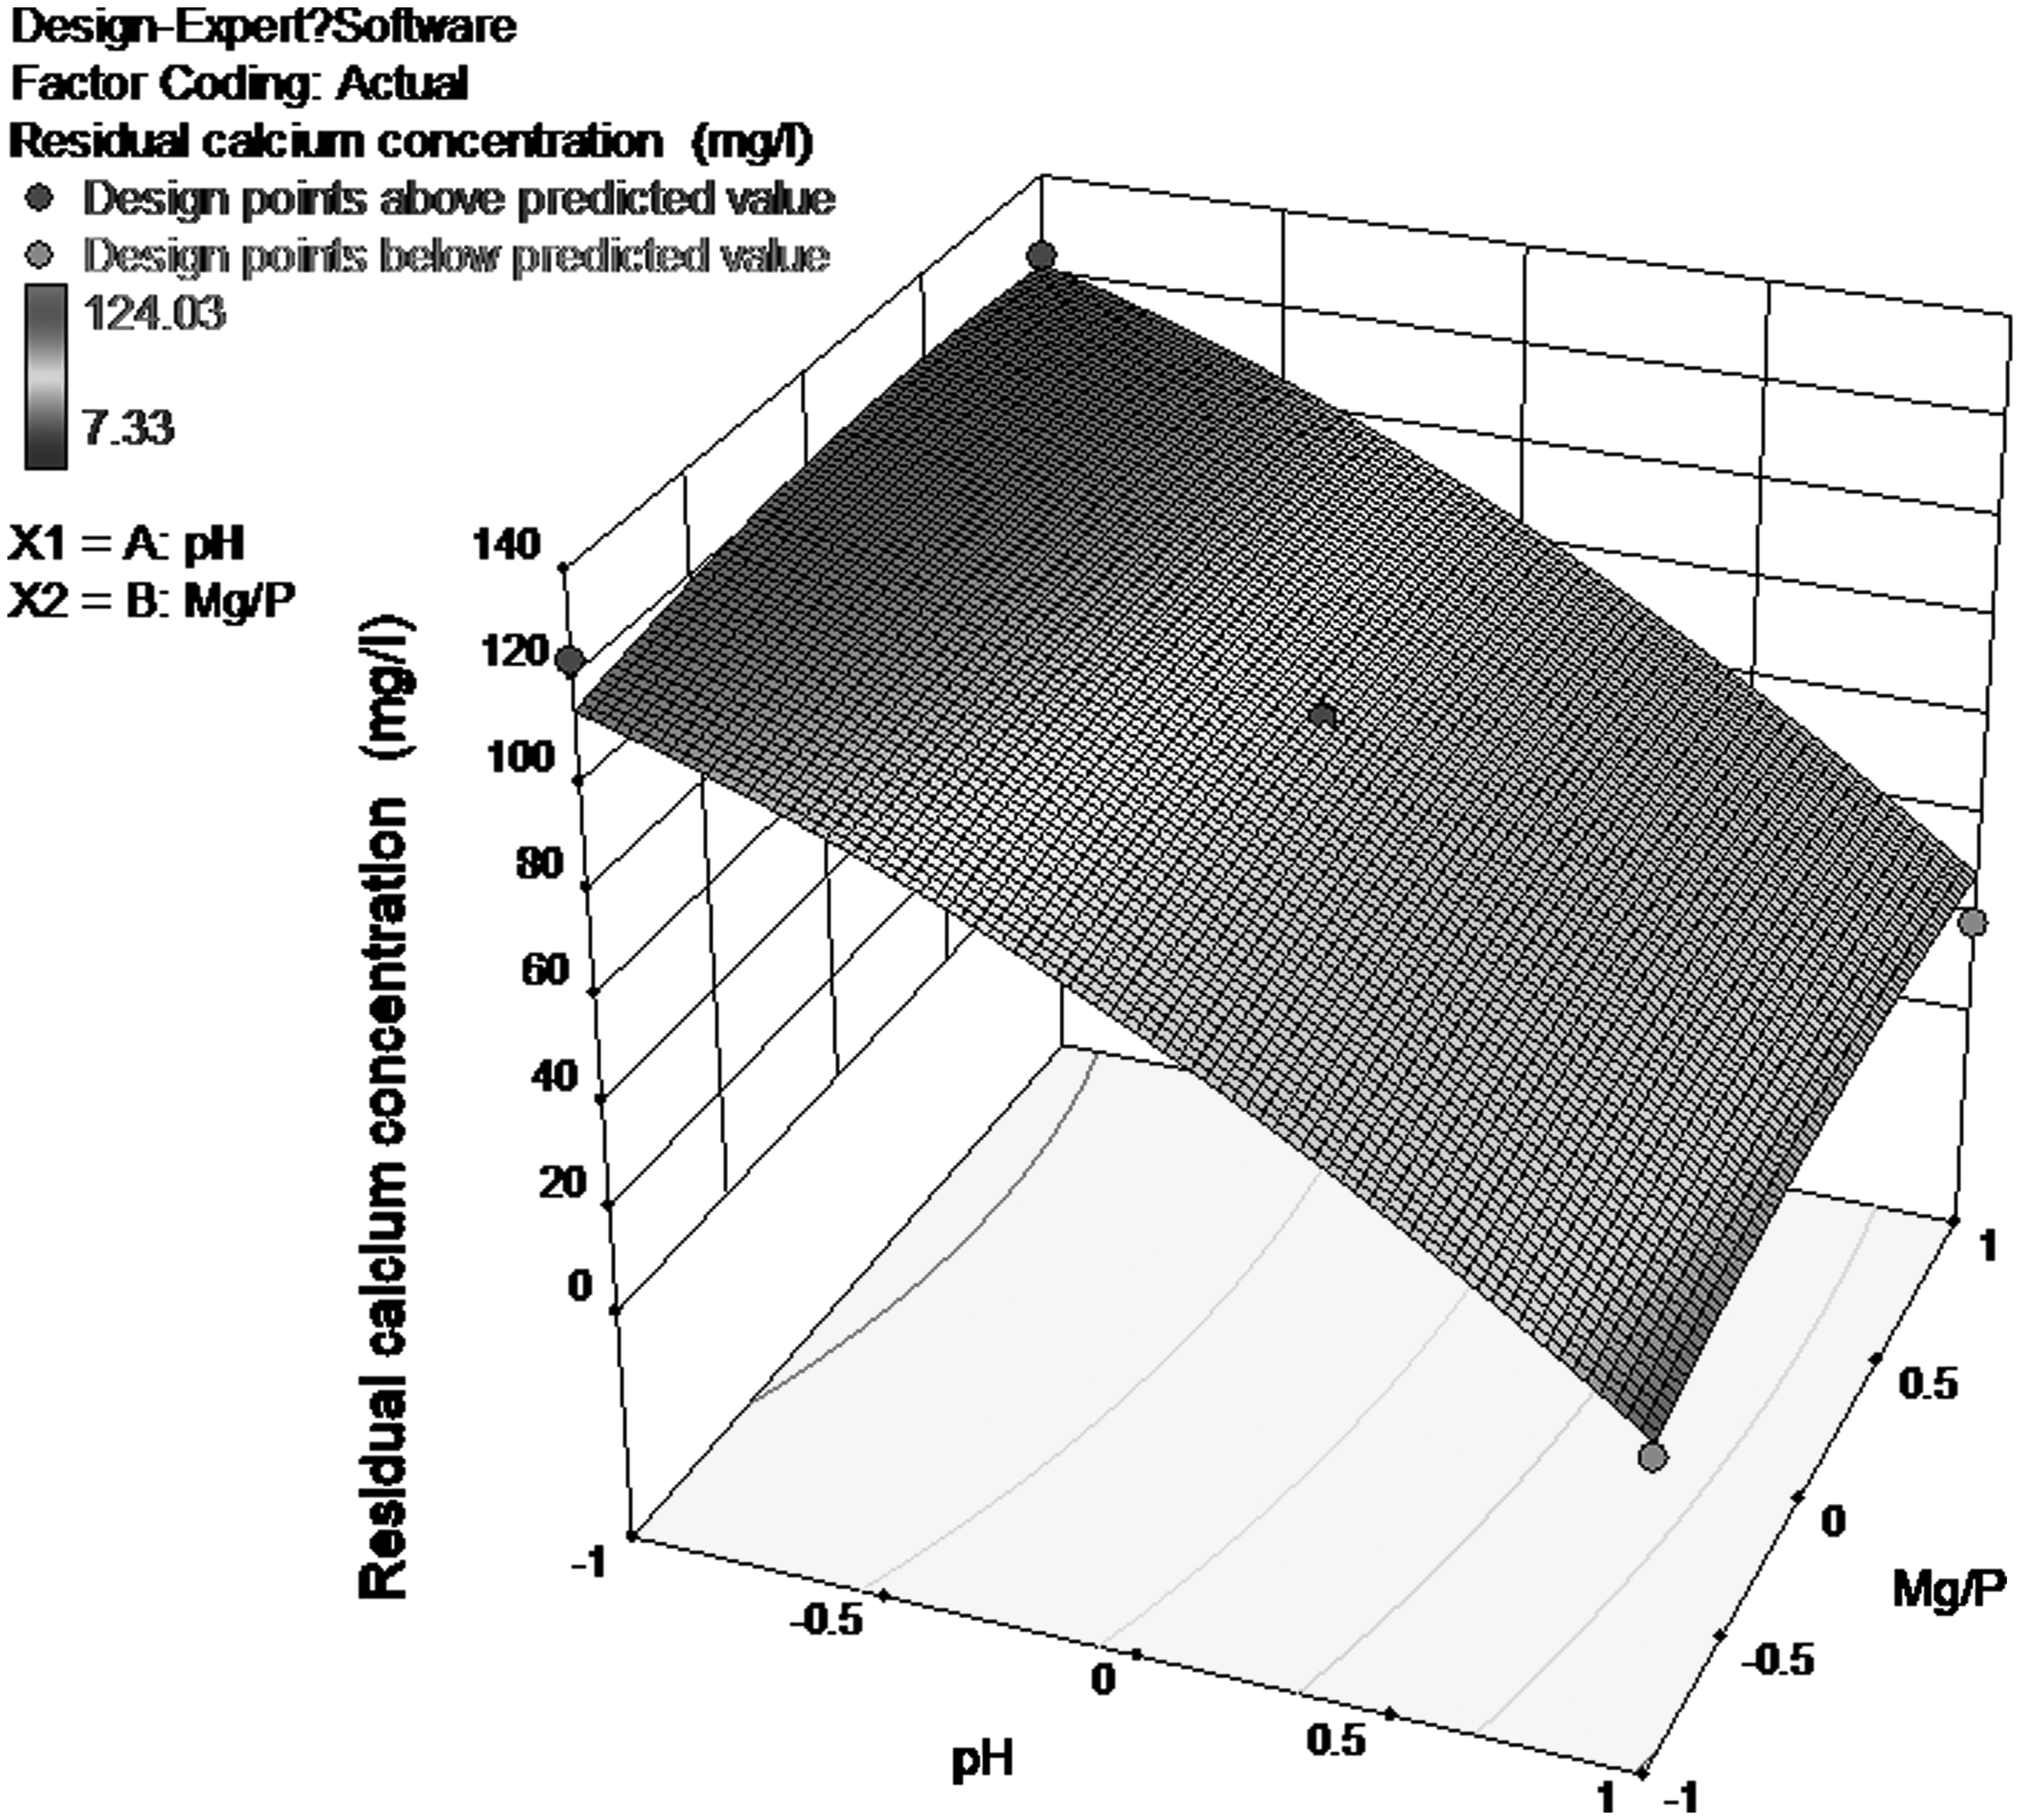
Residual calcium ion concentration under different pH and Mg/P conditions.
According to Table 4, the F value of the total regression model was 66.15 and the probability was lower than 0.0001, much smaller than 0.05. This result indicated that the application of the entire quadratic model was highly satisfactory for phosphate recovery from ADCMW. Furthermore, according to Table 3, the probability of pH for phosphate was lower than 0.0001, which is much lower than 0.05, and the probability of Mg/P was 0.0152, which is lower than 0.05. These results demonstrated that the effect of pH and Mg/P on the residual calcium concentration is significant, and pH is highly significant.
In Fig. 3, the calcium ion concentration did not have an obvious decrease when the pH was below 8.5 (−0.5 as the coded factor level in CCD). The concentration of calcium ion in the effluent, ∼120 mg/L, was almost consistent with the concentration of the influent. However, the concentration of calcium ions plummeted to ∼20 mg/L when the pH was higher than 9.0 (0 as the coded factor level in CCD). This phenomenon resulted from the formation of calcium compounds such as calcium carbonate and calcium phosphate, which reduced the calcium ion concentration. In this process, high concentrations of PO43− and CO32− appeared in solution, making a great contribution to the removal of calcium ions, as shown in Equations (12) and (13).
Therefore, under the higher pH condition, it was more difficult to achieve pure struvite because of the preferred reaction of calcium ions with carbonate or phosphate ions, which made it difficult to form pure struvite crystals.
In terms of Mg/P, it can be seen that the change of the Mg/P ratio did not have a significant effect on the effluent concentration of calcium ions. However, the residual calcium ion concentration had a tendency of slowly rising with the increase of Mg/P when the pH was lower than 9.0 (0 as the coded factor level in CCD). This result can be explained by the fact that when the Mg2+ concentration was low, phosphate preferentially reacted with Ca2+ and formed Ca3(PO4)2. With the increase in the amount of magnesium, the competition intensified, and less Ca2+ precipitated with PO43−, so the residual Ca2+ increased.
Analysis of recovered precipitate
According to the above discussion, the best molar ratio of Mg/P for high phosphate recovery and lower reagent costs is 1.8. Raising the pH can increase the recovery of nitrogen and phosphate, but impurities can also occur when the pH is too high. To investigate the composition of the recovered precipitate, SEM and XRD were employed to analyze the crystallized product from an Mg/P ratio of 1.8 under different pH conditions (pH of 8.5, 9.0, and 9.5).
SEM images of the struvite product crystals are presented in Fig. 4. Diverse sizes of precipitate particles were clearly observable. To determine the composition of the precipitate, the elemental content was investigated by EDS, and the results are shown in Table 5. The molar ratio (ni%) was calculated by Equation (14), and the Mi term included in the equation is the molar weight of the involved element.
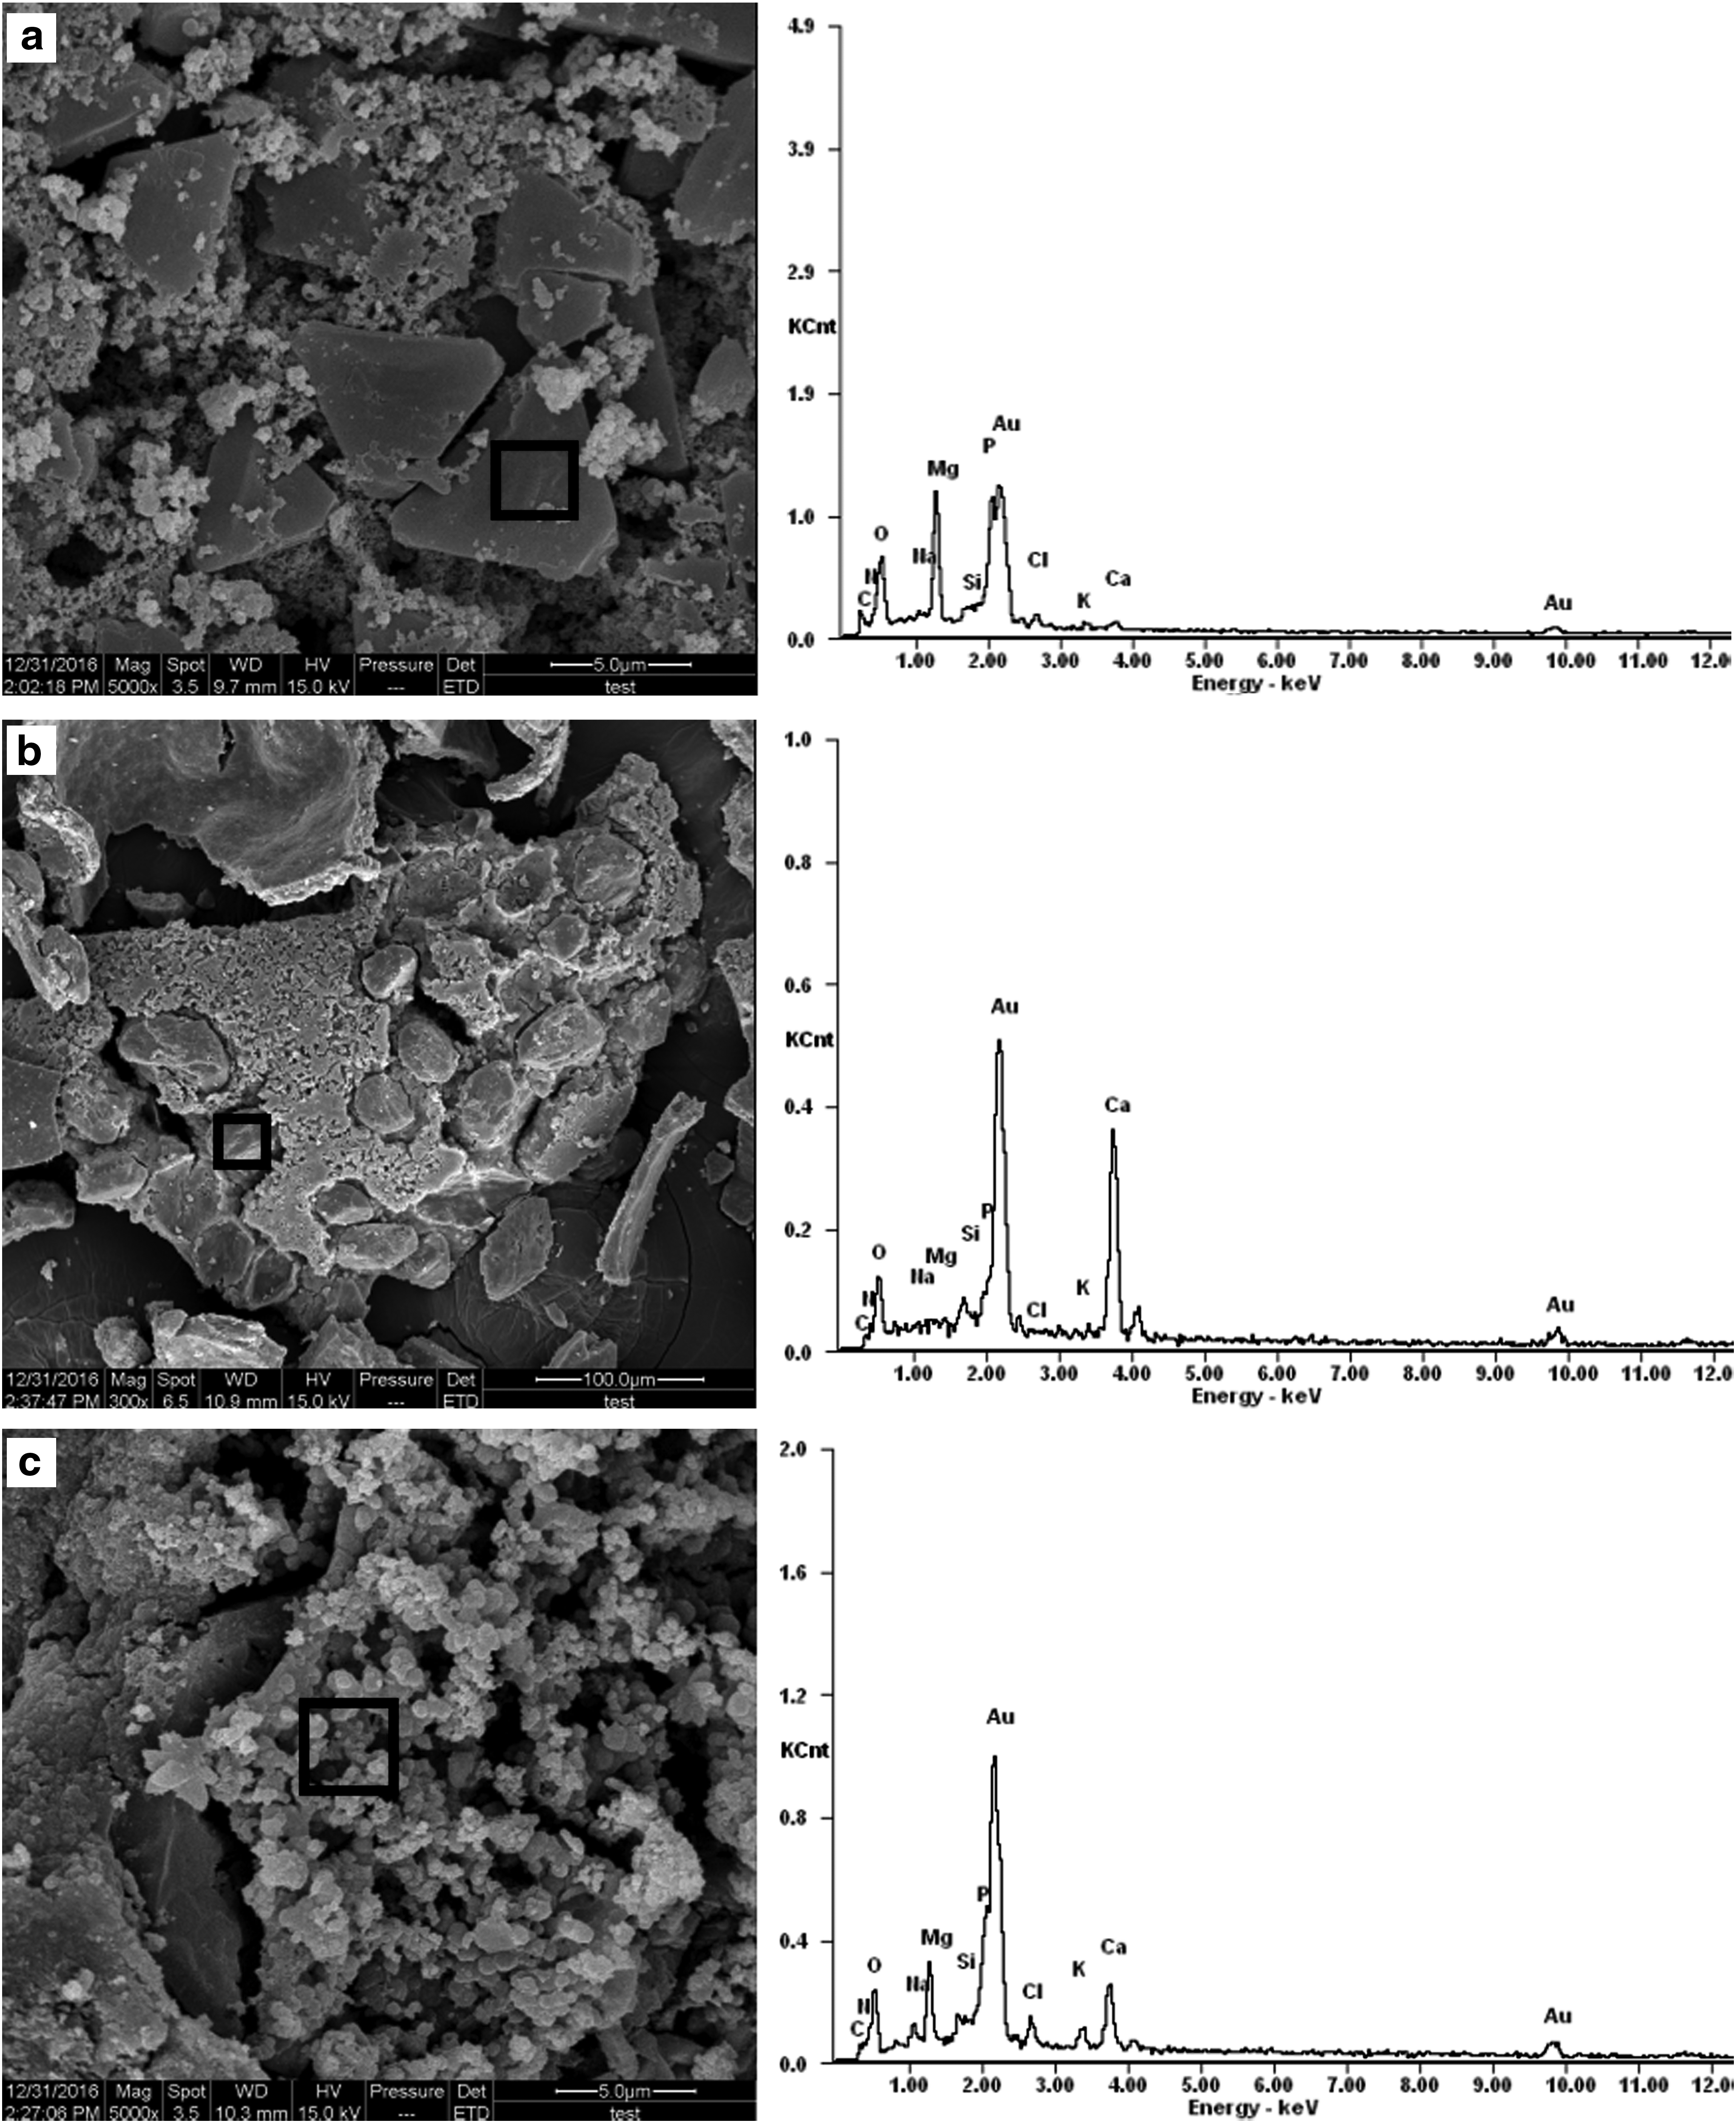
Figure 4a is the SEM image of the precipitated sample of pH = 8.5 (−0.5 as the coded factor level in CCD) and Mg/P = 1.8 (0 as the coded factor level in CCD), showing that sizes of the crystals were mainly 2 ∼ 5 μm. The molar ratio of Mg:N:P:O determined by EDS was 1:1:1:4, which was same as the molar ratio of the elements in struvite. The shape of the precipitate meets the features of orthorhombic configuration: three mutually symmetrical secondary symmetry planes (Md et al., 2014). The conclusion can be drawn that the precipitate in the solid was struvite.
Figure 4b is the SEM image of the precipitated sample of pH = 9.0 (0 as the coded factor level in CCD) and Mg/P = 1.8 (0 as the coded factor level in CCD). Large particles with sizes ranging from 50 to 70 μm were observed to be embedded in the middle of many small orthorhombic crystals. The contents of Ca and C increased and those of N and Mg decreased significantly according to the results of EDS. The molar content of Ca:C:O was 1:1:4, which indicated that most of the sediments were calcium carbonate, as the ratios were similar to the molar ratio of elements in calcium carbonate.
Figure 4c is the SEM image of the precipitated sample of pH = 9.5 (0.5 as the coded factor level in CCD) and Mg/P = 1.8 (0 as the coded factor level in CCD). It was clearly observed that the vast majority of the particles found in the precipitate were small particles instead of large orthorhombic crystals. These small particles were magnesium compounds, such as magnesium phosphate, which were indicated by stronger magnesium peaks according to EDS. The molar ratio in the EDS was Ca:Mg:P:O = 1:1.5:2:10. There was also a certain proportion of calcium in the precipitate, although the calcium content was not higher compared with Fig. 4b. Therefore, calcium phosphate was also included in these precipitates.
The crystalline phases in the precipitate were analyzed by XRD. The nature of the compound can be determined by the position of the peak instead of the intensity. Thus, higher ammonia nitrogen removal could result in higher peak intensities. In the discussion by Eldiwani et al. (2007), where ammonia nitrogen was recovered from an industrial wastewater treatment plant, an XRD diffractogram showed that the highest peaks appeared when ammonia nitrogen recovery efficiency reached a peak. Therefore, the XRD pattern generated from the precipitate matched the standard diffractogram card, which was related to the position of the peaks instead of the intensity.
Figure 5a shows the XRD pattern of the precipitate under the condition of pH = 8.5 (−0.5 as the coded factor level in CCD) and Mg/P = 1.8 (0 as the coded factor level in CCD). Five peaks with high-intensity values at 2,701, 3,639, 10,866, 2,924, and 6,504, corresponding to 2θ values of 14.99, 15.81, 20.85, 30.602, and 33.280, were detected. The diffraction peaks were consistent with the values of the standard card. No other crystalline phase was observed in the figure, indicating that high-purity struvite appeared in the residues. The shape of the precipitate was identified as belonging to orthorhombic crystals, which was consistent with the results of SEM.
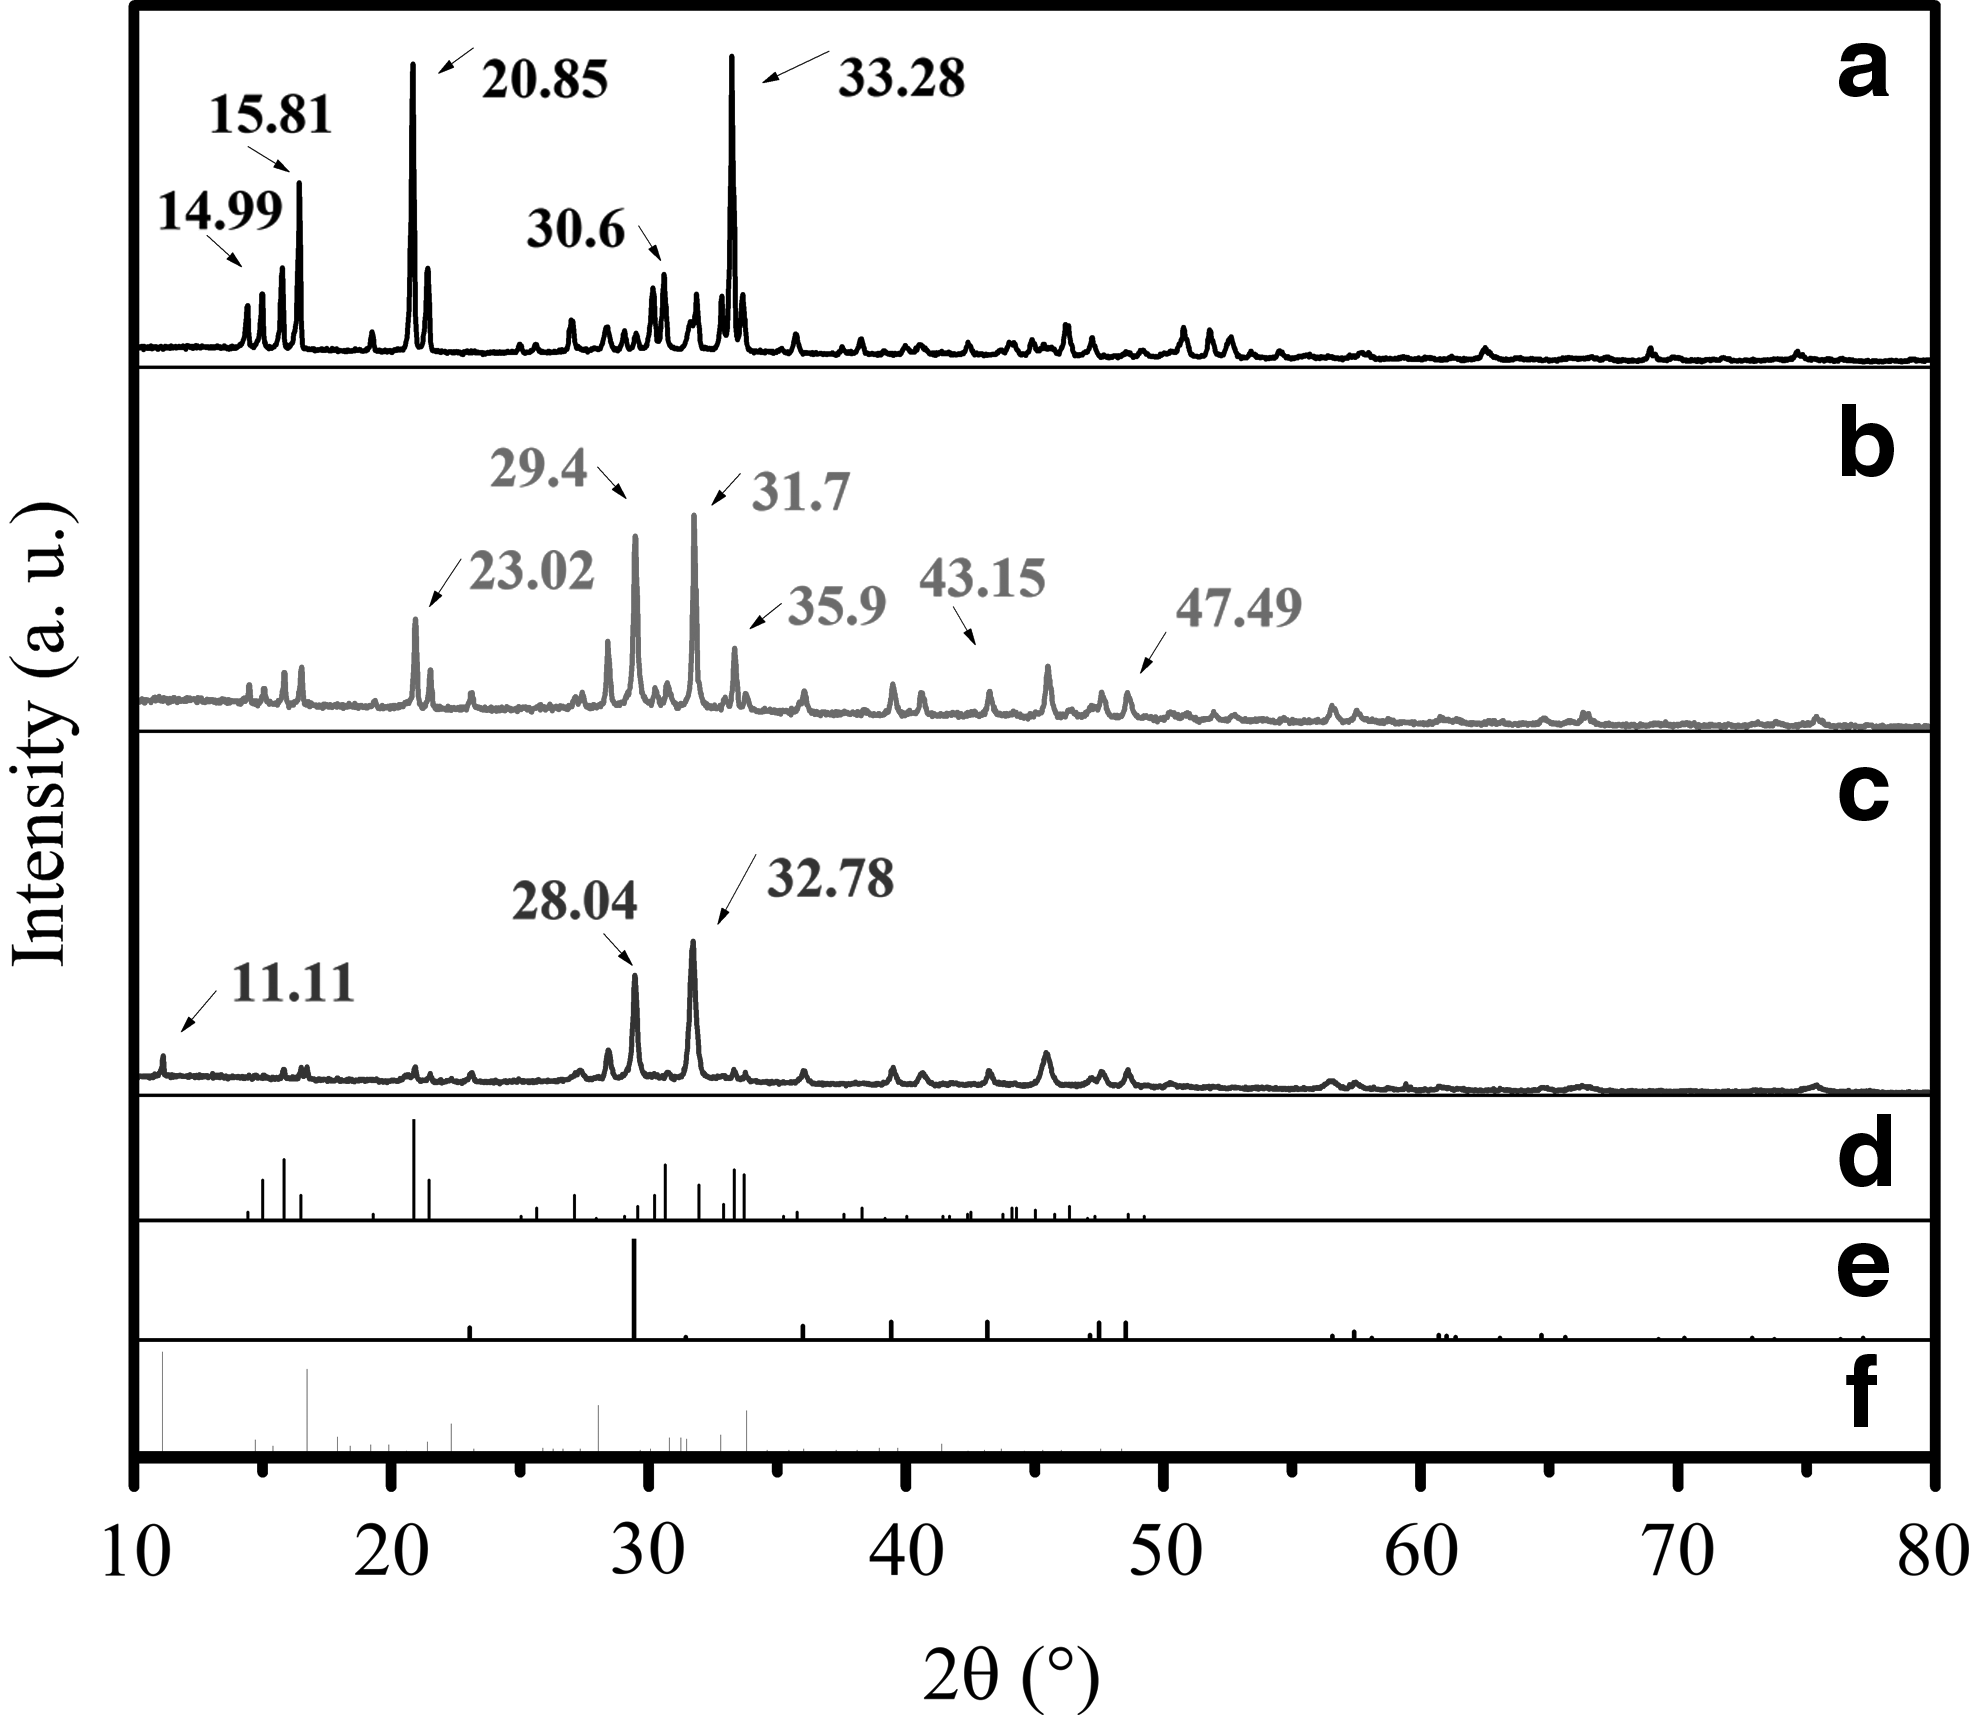
Figure 5b shows the XRD pattern of the precipitate under pH = 9.0 (0 as the coded factor level in CCD) and Mg/P = 1.8 (0 as the coded factor level in CCD). Peaks at 2θ values of 29.406 and 31.7 suggested the presence of other crystalline compounds. In addition, six peaks with high-intensity values appeared at 711, 3,803, 4,194, 862, 853, and 838, corresponding to 2θ values of 23.02, 29.406, 31.7, 35.9, 43.15, and 47.49, respectively. To identify these elements, the diffractogram of the formed precipitate was compared to the standard card of several compounds. This analysis demonstrated that 46.6% CaCO3 and 20.3% NaCl were contained in the precipitate.
Figure 5c shows the XRD pattern of the precipitate under pH = 9.5 (0.5 as the coded factor level in CCD) and Mg/P = 1.8 (0 as the coded factor level in CCD). A new strong peak appeared at 2θ of 11.11, which can be identified as Mg3(PO4)2 appearing in the sediment after comparing the results to the standard diffractograms of several compounds. In this case, the content of struvite was only 10.9%.
Economic analysis
With the improvement of experience and knowledge of the crystallization process, the profit of producing struvite is gradually maximized. Some reports estimated that the operating profit in forming struvite from a wastewater treatment plant would range from $9,700 to $11,000 annually (Crutchik and Garrido, 2011). In this experiment, it was reasonable to estimate that a wastewater treatment plant could recover 68 g of struvite from 1 m3 wastewater. The current price of struvite is $1.67/kg. Table 6 provides a comparison of the economic benefits between high-purity struvite recovery and highly efficient phosphate recovery.
ADCMW, anaerobically digested cattle manure wastewater.
According to Table 6, SPM can operate at a profit to cover the cost of reagents when effort is made to obtain pure struvite, while an economic loss may occur in the case of obtaining the highest phosphate removal efficiency. In addition, it is hard to separate the struvite from the complex precipitates, and this separate process can raise the cost. Based on these considerations, the purity of struvite and a high phosphate recovery ratio cannot be achieved at the same time in the process of recovering struvite. From an economic perspective, it is sensible to recover high-purity struvite.
Effect of Ca2+, pH, and Mg2+ interactions on struvite purity
Struvite precipitation was affected by various factors, such as pH, Mg/P ratio, and Ca2+ concentration. Based on previous reports and the results analyzed above, the three main factors, pH, Mg/P ratio, and Ca2+ concentration, significantly influenced the formation of struvite. The effects of single factors on the purity of struvite have been reported extensively. However, the mechanism of these interacting impact factors has not been previously explored. As shown in Fig. 6, the influences of these different factors on struvite purity are discussed.
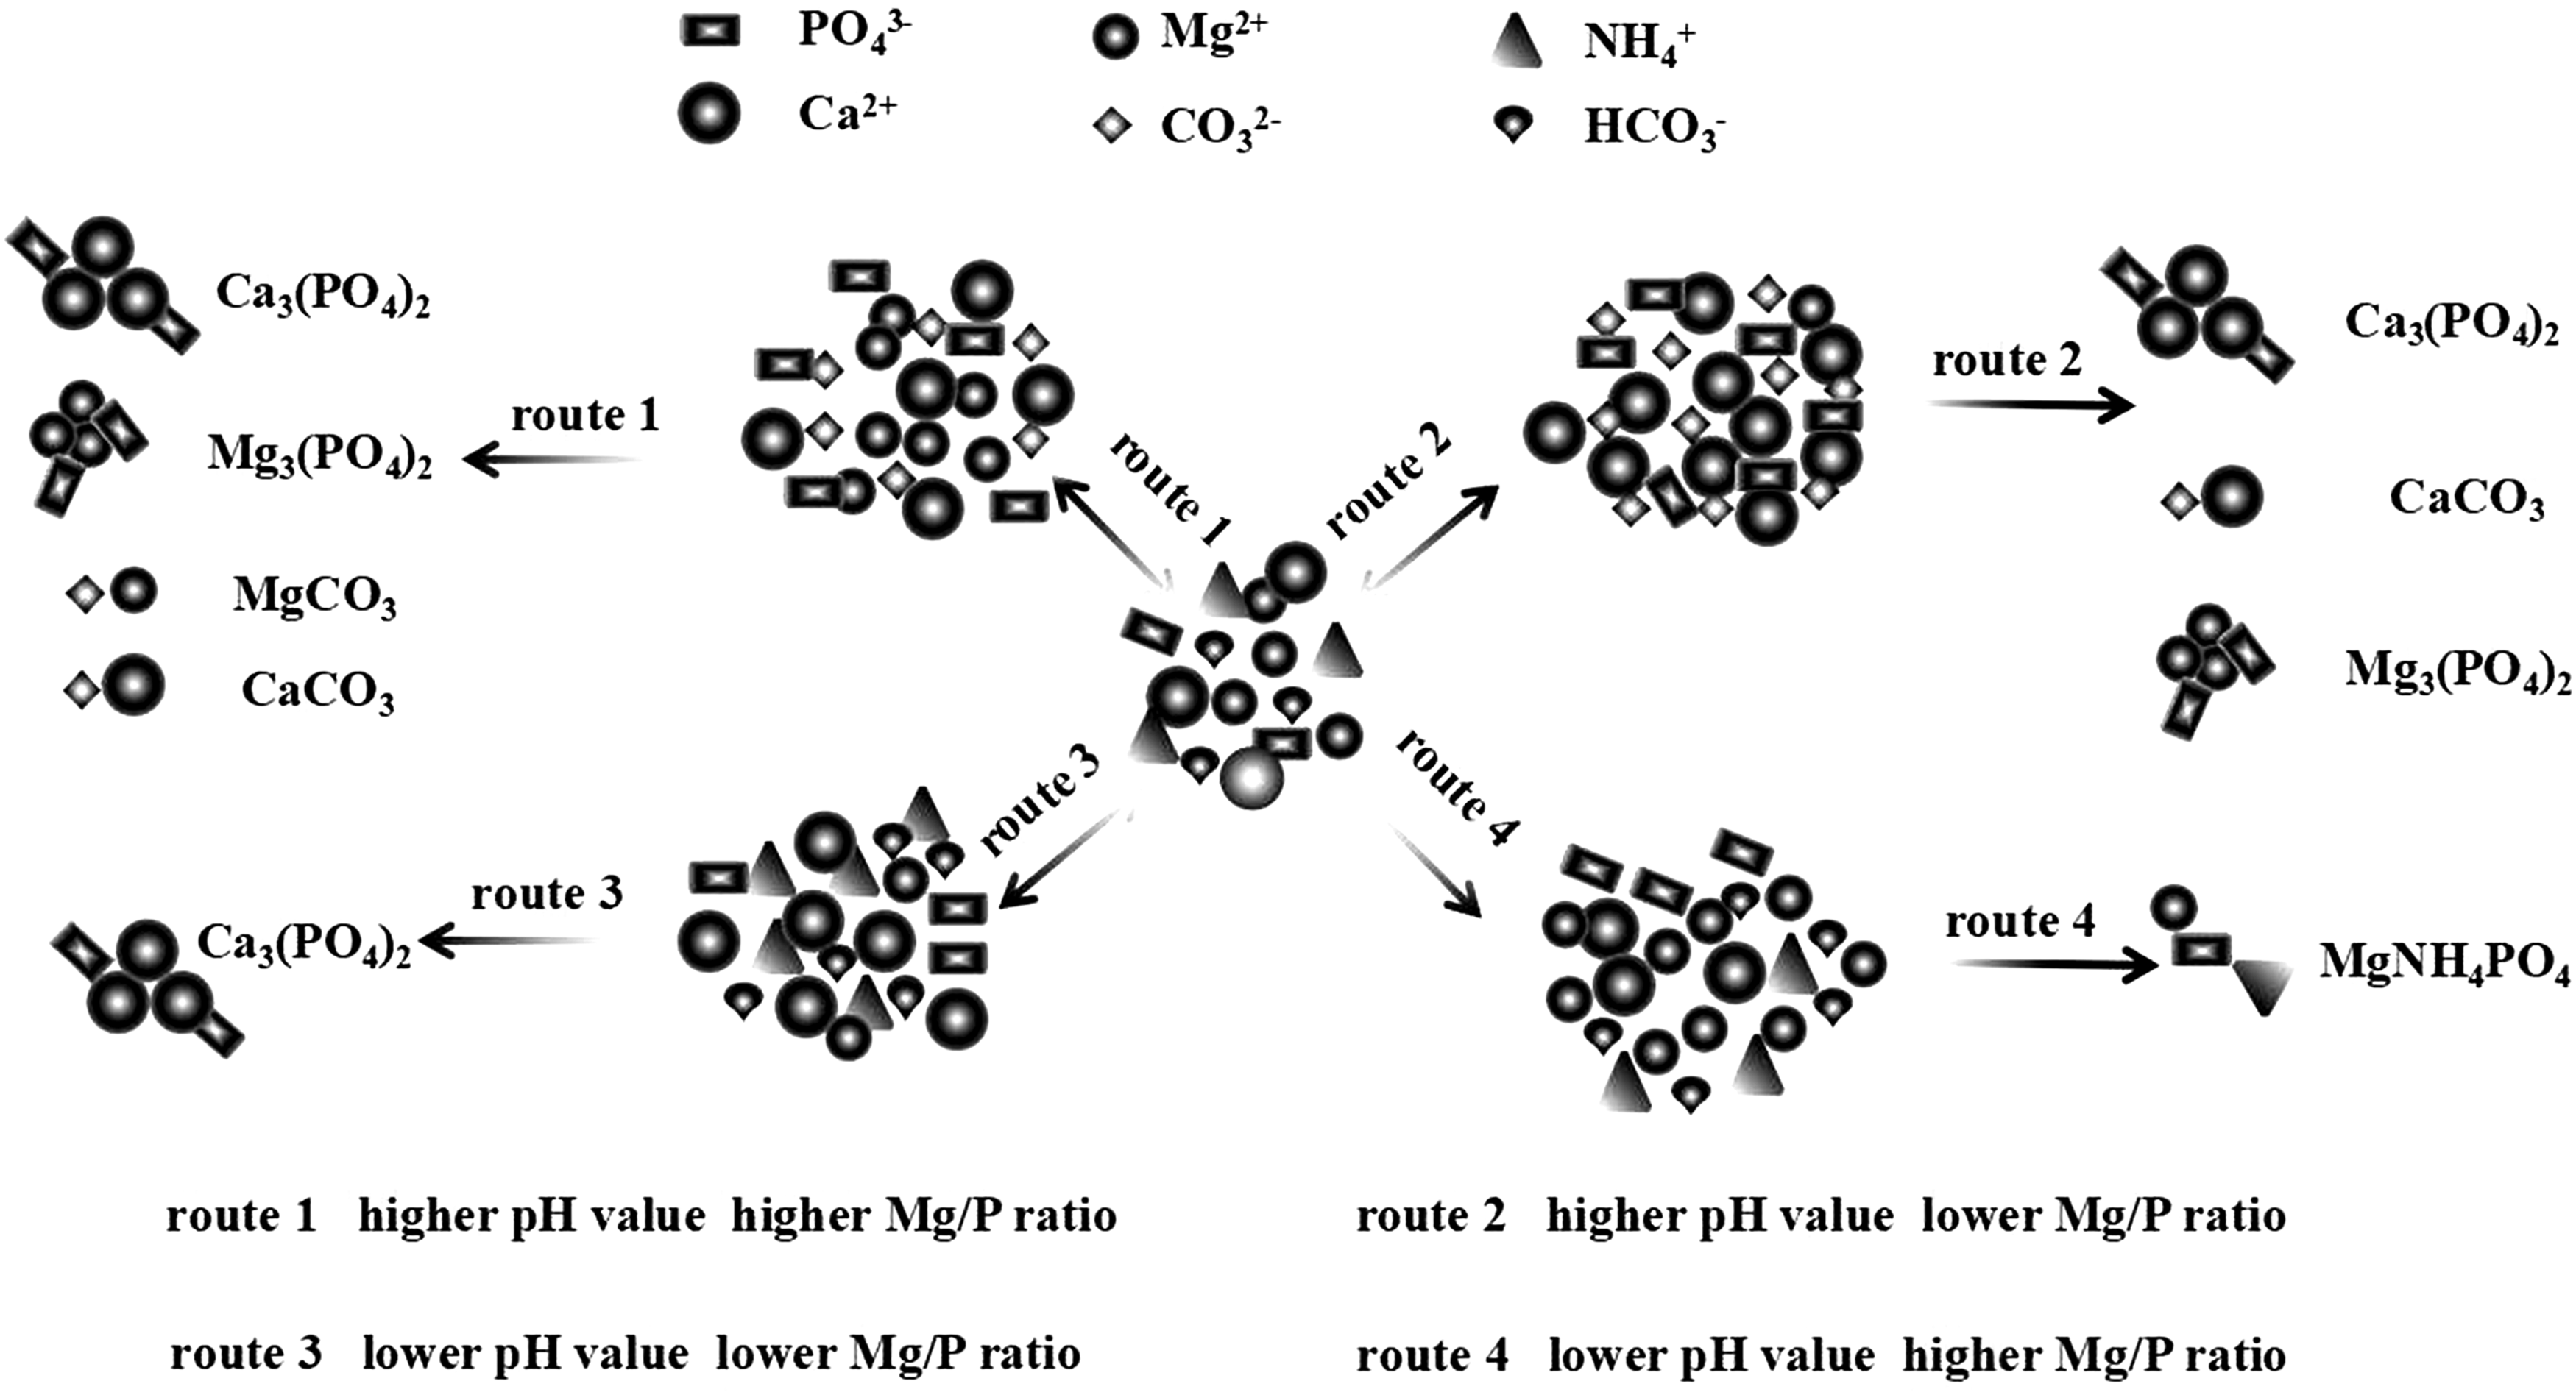
Effect of Ca2+, pH, and Mg2+ interactions on struvite purity.
The effect of Mg2+ and Ca2+ interaction on achieving pure struvite is shown in Route 2 and Route 3, where a high quantity of Ca3(PO4)2 was observed under a low Mg/P ratio. However, Route 4 demonstrated a decrease in the amount of Ca3(PO4)2 when the Mg/P ratio increased. As a result, Ca2+ affected struvite formation by competing for phosphate ions and forming calcium phosphate when there were few magnesium salts in the ADCMW. The saturation index is a better way to understand the influence of calcium on product purity. Pure struvite was obtained when the Ca2+/Mg2+ ratio was kept low because the driving force for struvite precipitation increased (Tao et al., 2016). This was consistent with the results of Lee, in which Ca2+ made a great contribution to the formation of struvite when the value of Ca2+/Mg2+ was higher than 0.5 (Lee et al., 2016).
The interaction of pH and Ca2+ played a crucial role in controlling the generation of impurities and achieving higher purity struvite. The dissociation of carbonic acid as a weak acid in water was determined by the pH. In Route 3 and Route 4, there was no CaCO3 in the sediment under lower pH conditions of 8.0 (−1 as the coded factor level in CCD) and 8.5 (−0.5 as the coded factor level in CCD), which was attributed to the formation of HCO3− instead of CO32−. However, in Route 1 and Route 2, CaCO3 was formed in the precipitate at higher pH due to the reaction of HCO3− with OH− and the production of considerable CO32−. Although many results were observed that indicated the effect of calcium on product purity was serious when the Ca2+/Mg2+ ratio was larger (Gunay et al., 2008), it was found the effect of calcium on product purity was negligible when the pH was in the range from 8.0 to 8.5.
The relationship between pH and Mg2+ was indicated in Route 1 and Route 2, where the formation of Mg3(PO4)2 instead of struvite occurred and resulted in a reduction in the struvite purity. It can be said that the ammonia nitrogen escaped in the form of ammonia at higher pH, resulting in struvite dissolution and Mg3(PO4)2 formation.
Conclusion
Experimental results in this study suggest that SPM can be used for the effective recovery of phosphate from ADCMW. The effects of the calcium ion concentration, pH, and Mg/P ratio on the purity of struvite were investigated. The following conclusions were drawn:
pH affected the purity of struvite by controlling the formation of CaCO3 and Mg3(PO4)2. Ca2+ and Mg2+ affected struvite formation by competing for phosphate ions. The Mg2+ and pH interaction influenced the struvite purity by preventing Mg3(PO4)2 formation. High-purity struvite was formed at lower pH levels and higher Mg/P ratios according to the RSM, and a higher phosphate recovery efficiency was achieved at higher pH levels. Economic analysis was introduced to determine the optimum parameters for reducing treatment costs, and the optimum operating parameters in RSM were pH = 8.5 and Mg/P = 1.8.
Footnotes
Acknowledgments
This research was jointly supported by the Nanqi Ren Studio, Academy of Environment & Ecology, Harbin Institute of Technology (HSCJ201701), Scientific Research Foundation for Returned Scholars of Heilongjiang Province (LC2016015), Young Talents Project of Northeast Agricultural University (14QC35), Specialized Fund Project for Harbin Innovative Talent in Science and Technology Research (2013RFQXJ094), and Starting Foundation for PhD of Northeast Agricultural University (2012RCB72).
Author Disclosure Statement
No competing financial interests exist.