
Abstract
Abstract
Performance of a new method for the deposition of metallic silver and metallic copper in ceramic water filters was investigated. Ceramic water filters were manufactured at two PureMadi filter production facilities in South Africa. Silver or copper was applied to the filters in solution as silver or copper nitrate [AgNO3 or Cu(NO3)2] and mixed with clay and sawdust. The mixture was pressed into a pot shape and fired in a kiln. During firing the ionic silver or copper is reduced to metallic nanopatches dispersed through the porous ceramic media. For comparison testing, filters were also manufactured using a conventional silver application method consisting of painting an aqueous suspension of silver nanoparticles (AgNPs) onto filters postfiring. Resulting filters were evaluated in flow-through experiments and in stagnant water experiments (to consider a worst-case scenario for silver release). Flow-through experiments quantified total coliform and Escherichia coli removal and metal concentration in the effluent. Total coliform and E. coli removal was greater for AgNO3 filters (log reductions of 4.06 and 4.11) relative to AgNP filters (log reductions of 3.85 and 3.92). AgNO3 filters also resulted in lower silver concentrations in the effluent, potentially increasing the effective life span of the filter. Filters made with Cu(NO3)2 performed slightly worse than AgNP filters, but were still effective with log total coliform and E. coli removals of 3.33 and 3.54, respectively. The new method of silver application could potentially reduce production costs, improve performance, and increase safety of production for workers.
Introduction
S
The ceramic filter is suspended inside a plastic bucket with a spigot on the bottom for personal use. Source water is poured into the ceramic filter and percolates through to the lower reservoir where clean water is dispensed through the spigot. The relatively small pore size (mean around 10 μm) of the ceramic filter decreases turbidity and removes suspended particles (Oyanedel-Craver and Smith, 2008). Silver nanoparticles (AgNPs) are applied to the filter using an aqueous suspension of the nanoparticles and a paintbrush. The silver provides effective disinfection of the source water. The silver release rate into the treated water generally results in silver concentrations below the secondary drinking water standard of 0.1 mg/L set by the USEPA (2018) and the World Health Organization (2011a). Life cycle assessments of the social, economic, and environmental impact of the filters have also shown them to be a sustainable alternative for drinking water treatment in a developing world setting (Ren et al., 2013a).
The AgNP solution is painted onto the inside and outside of the ceramic after the filter is fired (Oyanedel-Craver and Smith, 2008). The high nanoparticle surface-area-to-volume ratio leads to significant bactericidal activity (Praveena and Aris, 2015). The painted-on AgNPs also prevent biofilm formation in the filter (Morones et al., 2005; Oyanedel-Craver and Smith, 2008). Silver released into the treated water provides residual disinfection. This method of AgNP application is in use at many filter production facilities around the world, including the PureMadi Production Facility in Mukondeni, South Africa and the PureMadi Production Facility at Dertig, South Africa.
This method, however, has several disadvantages. First, AgNPs are typically not available for purchase in developing-world markets. Therefore, it must be imported by the production facility, which may be difficult for the local organization. Second, nanoparticles may be released from the filter, particularly in the early stages of filter use, which in turn can potentially result in silver concentrations in the treated water that are greater than the USEPA and World Health Organization drinking water standard of 100 μg/L (Ren and Smith, 2013b). Metallic silver released into the treated water is less effective for disinfection than a similar amount of ionic silver. Therefore, the released nanoparticles only shorten the life span of the filter and do not significantly improve residual disinfection. Third, application of the aqueous nanoparticle suspension is labor intensive, requiring facility workers to manually paint the solution on the surfaces of every filter. Fourth, the use of AgNPs during the manufacturing process may also be a health concern for workers manufacturing filters, as some research suggests that inhalation of silver particles may result in genotoxic effects (Aktepe et al., 2015; Fewtrell et al., 2017).
Recently, Jackson and Smith (2018) developed a new method of silver application to ceramic porous media. For this method, silver nitrate (AgNO3) is dissolved in water and uniformly combined with clay and sawdust, pressed into a ceramic disk, and fired in a kiln. During firing, the clay is sintered to form a ceramic medium, the sawdust combusts to create porosity, and the ionic silver is reduced to metallic silver nanopatches with mean diameters between 2 and 3 nm (Ehdaie et al., 2014). In subsequent filtration experiments in the laboratory, the ceramic media was highly effective at removing Escherichia coli from challenge waters. In addition, effluent silver concentrations were significantly lower than silver-ceramic filter cylinders manufactured with AgNPs as a precursor.
Copper is also a promising water disinfectant and may be a better viral disinfectant than silver (Esteban-Cubillo et al., 2006; Anyaogu et al., 2008; Ramyadevi et al., 2012). Copper is less expensive than silver and has a higher drinking water standard (1.0 mg/L, which is 10 times higher than the standard for silver) (USEPA, 2018). Therefore, it may be possible to use larger amounts of copper in filters relative to silver while maintaining a similar cost and performance.
The purpose of this article is to evaluate the silver-application method developed in Jackson and Smith (2018) and a similar copper-application method in full-size filters produced in real production facilities. Although tested in the laboratory, the method has not been evaluated in full-size filters. Filters were tested in the laboratory to compare the silver-nanoparticle, silver-nitrate, and copper-nitrate application methods. Filter performance was evaluated based on treatment efficiency of natural groundwater samples spiked with E. coli combined with measurement of effluent silver and copper concentrations. Total coliform and E. coli were measured due to their effects on human health. Silver and copper were measured to ensure effluent concentrations below the drinking water standards.
Experimental Protocols
Filters from two different filter production facilities managed by the nonprofit organization PureMadi (www.puremadi.org) were produced and tested in this investigation. The two production facilities are located in the communities of Mukondeni (in Limpopo Province, South Africa) and Dertig (in North West Province, South Africa). The Mukondeni facility manufactured AgNP filters and AgNO3 filters for this study. The Dertig facility manufactured AgNP and Cu(NO3)2 filters for this study. Influent and effluent water samples for these filters were tested in for total coliform bacteria, E. coli, and total silver.
Source water characterization
Filters were tested using untreated natural groundwater from a residential borehole in Makhado, South Africa. Groundwater samples were characterized at the University of Venda. Electrical conductivity, pH, total dissolved solids, and salinity were measured using an EC500 ExStik multimeter (Extech Instruments Corporation). Fluoride measurements were performed using an Orion Star A214 Fluoride Ion Selective Electrode (Thermo Scientific, South Africa). Ion Chromatography was performed using a Metrohm Ion Chromatograph, and trace metals were measured with a PerkinElmer Flame Atomic Absorption Spectroscopy. Turbidity was measured with a TB200TM Portable Turbidimeter from Orbeco-Hellige.
Ceramic filters
All filters evaluated in this investigation were manufactured at one of two PureMadi filter production facilities in South Africa. The Dertig production facility is located in the North West Province of South Africa about 50 km north of the city of Pretoria. The Mukondeni production facility is located in the Limpopo Province of South Africa about 40 km southeast of the city of Makhado. AgNP and AgNO3 filters were produced at the Mukondeni facility. Clay was collected from a natural clay deposit near the facility and ground in a hammer mill. White pine sawdust from a local lumber mill was sieved to 20 mesh. To produce 20 filters, 68 kg clay and 8 kg of sawdust were combined and mixed for 30 min in a mechanical mixer. Thirty-three liters of water were added to the clay and sawdust and mixed for an additional 30 min. The mixture was then molded into the pot shape using a filter press with a hydraulic jack. The filter was air-dried for 1–3 days. Filters were then fired with an electric kiln (Industrial Pyrometer Company Studio 3000) with the following temperature program: ramp at 130°C/h to 900°C, hold 1 h, and then gradual cooling. During the firing process, the sawdust combusts to form pore channels.
After cooling, the ceramic filters were pressure- and flow tested for quality assurance. For the pressure test, the external surfaces of each filter were submerged in water for 10 s. If the interior of the filter remained dry, the filter passed the test. If a wet spot was observed on the inside of the filter, it failed the test (as it is possible that there is a crack or macropore that would render the filter ineffective). For the flow test, each filter was saturated with water for 24 h. Each filter was then filled completely with water, and after 1 h, the water level position in the filter was measured using a flow-calibrated T-bar. To pass this second test, the flow rate was required to be between 1.5 and 3.0 L/h. Filters that failed either test were destroyed.
As a final step, 300 mL of a AgNP solution made with 0.56 g of powder form collargol (70% Ag by mass) from Laboratorios Argenol S.L. (Zaragoza, Spain) dissolved in water. This solution was painted first onto the inside of the filter, then the outside of the filter, then the inside again for a total of 0.4 g of silver in each filter.
For the AgNO3 method, the same natural clay and white pine sawdust were prepared as above. For a batch of 10 filters, 34 kg clay and 4 kg of sawdust were mixed mechanically for 30 min. A measure of 6.3 g or 31.5 g of 99.5% pure AgNO3 (Acros Organics) was dissolved in 11 L of water, added to the mixture, and mixed for 30 more min to produce filters with 0.4 or 2.0 g of Ag. This eliminates the need for painting on silver at the end. Like above, the mixture was then molded into the pot shape using a filter press with a hydraulic jack. The filter was air-dried for 1–3 days. Filters were then fired as described above. During the firing process, the sawdust combusts to form pore channels, and the ionic silver reduces to metallic silver. After cooling, the ceramic filters were subject to the same pressure and flow tests for quality assurance.
AgNP and Cu(NO3)2 filters were produced at the Dertig facility. To produce 10 AgNP filters, 26.4 kg of terracotta clay, 8.25 kg of sawdust, and 2.64 kg grog (a substance made by crushing fired filters that have failed the quality tests) were mechanically mixed for 30 min. Twenty liters of water was added to the mixture and mixed for 30 min. The filter was shaped using a mold and a press. The filters were air-dried for 1–3 days before being fired in a VEL50 front door kiln. The kiln temperature program increased at 150°C/h until 600°C and then 250°C/h until 1000°C. The kiln temperature ramped down gradually until it reached 400°C, where it held for 1 h. The temperature continued to drop gradually and was left to cool for about 2 h before it was opened. Pressure and flow rate tests as described previously were performed to confirm the quality of the filters. Filters that failed quality assurance tests were destroyed and saved for use as grog. Finally, a AgNP solution was applied to the filters as described previously for the Mukondeni filters.
To produce five Cu(NO3)2 filters, 13.2 kg of terracotta clay, 4.125 kg of sawdust, and 1.32 kg grog (a substance made by crushing fired filters that have failed the quality tests) were mechanically mixed for 30 min. Either 38 or 76 g of 99.5% pure copper (II) nitrate from Acros Organics was dissolved in 10 L of water, added to the mixture, and mixed for 30 min. Filters were shaped using the same mold and press and air-dried for 1–3 days before firing in the same kiln with the same pattern described for production at Dertig. Pressure- and flow tests were performed as above.
Table 1 summarizes the characteristics of the filters used in this investigation. Figure 1 is a picture of a filter produced at each production facility.

Filters produced at production facilities. Left is from the Mukondeni Pottery Cooperative, and the right is from the Dertig Production Facility.
Filter performance testing
All filters were tested in triplicate. Mukondeni and Dertig filters were compared over 36 and 17 days, respectively, for total coliform and E. coli removal efficiency. A nonpathogenic strain of E. coli was purchased from IDEXX Laboratories (cat. 982900700, Lot 042313) and cultured, used, and stored in the same method outlined in Ehdaie et al. (2014). Natural borehole water was spiked to a concentration of ∼4.6 × 10⁴ CFU/100 mL E. coli with the laboratory-grown nonpathogenic E. coli to create the influent test water. Tests were performed in an outside covered area, allowing for exposure to typical daily temperatures. Four liters of borehole water spiked with a nonpathogenic E. coli strain was poured into the top reservoir of each filter. Four liters of spiked borehole water was also kept in a covered bucket as a control.
After 14 h, samples were collected from the spigot from the lower reservoir of filters and from the control and tested for total coliform and E. coli removal using membrane filtration. Control concentration after the 14 h was used as the influent concentration for calculations. Since this method was used for all filters, it is appropriate to derive performance differences in this study, which was the primary purpose. These times were chosen to represent typical use patterns. Often, users fill their filters at the end of the day, so there is water to drink the following day. Letting the water sit for different times will likely impact performance results; longer contact times will improve performance. As in Kahler et al. (2016), manifold sample cups were placed in a hot water bath set to 100°C for a minimum of 20 min for disinfection. Filter paper disks (EMD Millipore, Billerica, MA) of 0.45 μm pore size were transferred to the surface of the manifold with forceps with an aseptic technique. A 100 mL water sample was passed through the filter. The filter paper was transferred to a sterile petri dish with absorbent pad. A sterile 2 mL ampule of selective growth media solution (m-ColiBlue24; EMD Millipore) was added to the petri dish. The petri dishes were incubated at 35°C for 23–25 h, before being counted for total coliform and E. coli.
Effluent samples were also taken and tested for total silver and total copper concentration using Graphite Furnace Atomic Absorption (GFAA). Seventy percent nitric acid (Fisher Chemical) was diluted to a concentration of 2% and added to samples to reduce silver ion chelation. Total silver was measured with a graphite furnace (HGA 900; Perkin-Elmer, Waltham, MA) atomic absorption spectrometer (AA2100; Perkin-Elmer).
No-flow conditions
An additional set of experiments was conducted to evaluate silver concentrations in treated water for a worst-case use scenario. It was hypothesized that relatively high silver concentrations can occur when the treated water is in contact with the silver-ceramic filter media for long periods of time. This may occur if the filter is filled and then the user does not withdraw water from the filter for an extended period of time (e.g., a family goes away from home for several days to a week). During this time period, water is in contact with the silver-ceramic filter medium, and silver may continue to be released into the treated water, potentially resulting in concentrations exceeding 100 μg/L.
Two AgNP and two AgNO3 filters were produced at the Dertig Production Facility. Filters produced at Dertig were used for these experiments since they produced the highest silver levels in previous tests. These filters were placed in 22 L filter receptacles. The filters were then filled with 4 L semi-hard synthetic groundwater solution (1.20 g of MgSO4, 1.92 g NaHCO3, 1.20 g of CaSO4, and 0.080 g KCl per 20 L) (USEPA, 2002) twice, according to directions for filter use. The filter receptacles were then filled to capacity with 20 L of synthetic groundwater and left stagnant for 7 days. Samples were taken daily and measured for silver levels with a graphite furnace (HGA 900; Perkin-Elmer) atomic absorption spectrometer (AA2100; Perkin-Elmer).
Results
Source water characterization
Results from the physicochemical characterization of natural groundwater used for the influent of the filters can be seen in Table 2.
Copper, lead, cadmium, chromium, iron, and nickel levels were all below the detection level of the Metrohm Ion Chromatograph.
Microbiological performance tests of filters
Table 3 presents the result of triplicate tests of the microbiological performance of filters manufactured at the PureMadi Production Facility at Mukondeni. The source water had an average coliform and E. coli concentration of 3 × 10³ and ≤1 CFU/100 mL, respectively. Since a log removal rate of greater than 3 was expected, laboratory-grown nonpathogenic E. coli was added to the influent water for filter testing. This increased the total coliform concentration so that coliform would be present in the effluent for accurate removal calculations. The membrane filtration method used measured the concentration of E. coli and of all other types of coliform separately. Since E. coli is a type of coliform bacteria, the E. coli concentration was added to the coliform concentration for the total coliform concentration. Log coliform and E. coli removals were consistently on the order of 4 with relatively low standard errors, suggesting effective and consistent performance for all filter types.
Figures 2 and 3 show the total coliform and E. coli removal (respectively) over time for filters produced at the PureMadi Production Facility at Mukondeni for each filter type tested. Performance is relatively consistent over the 36-day test period for all filter types.
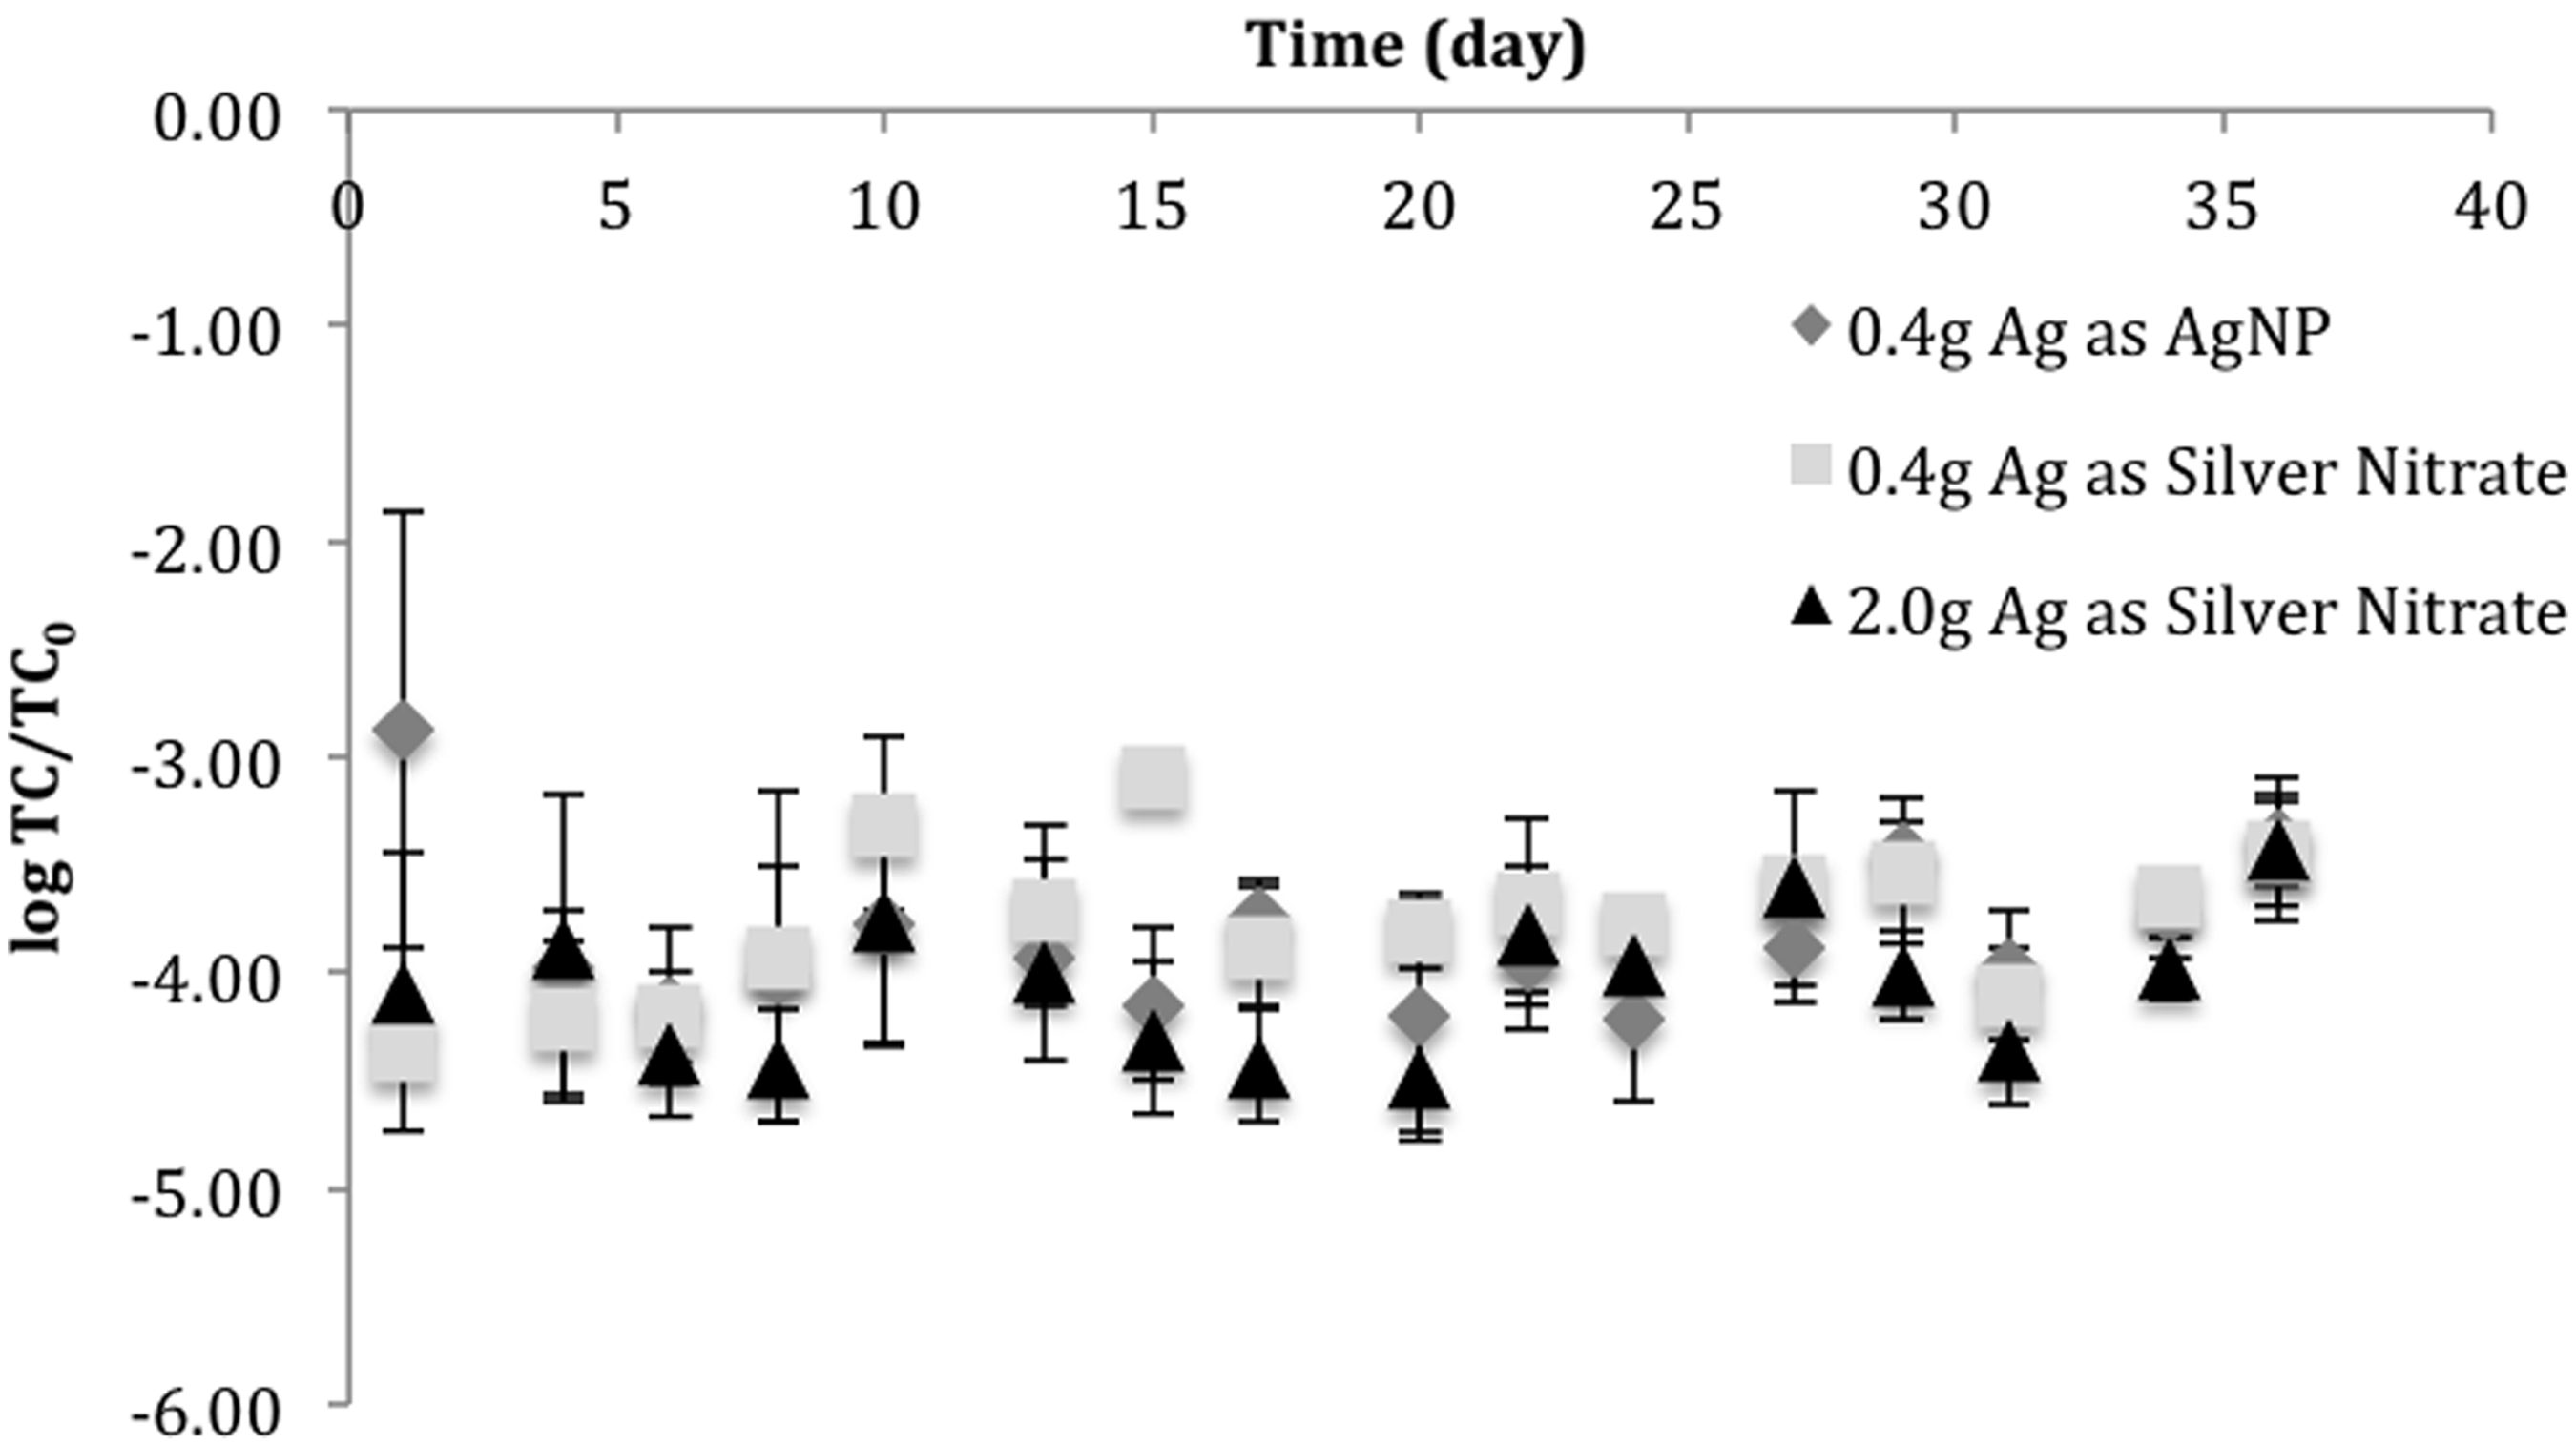
Mean values for log of total coliform concentration (TC) in the effluent over the influent (TC0) averaged for each production method over time for filters produced at the PureMadi Production Facility at Mukondeni. Error bars indicate one standard error above and below the mean.
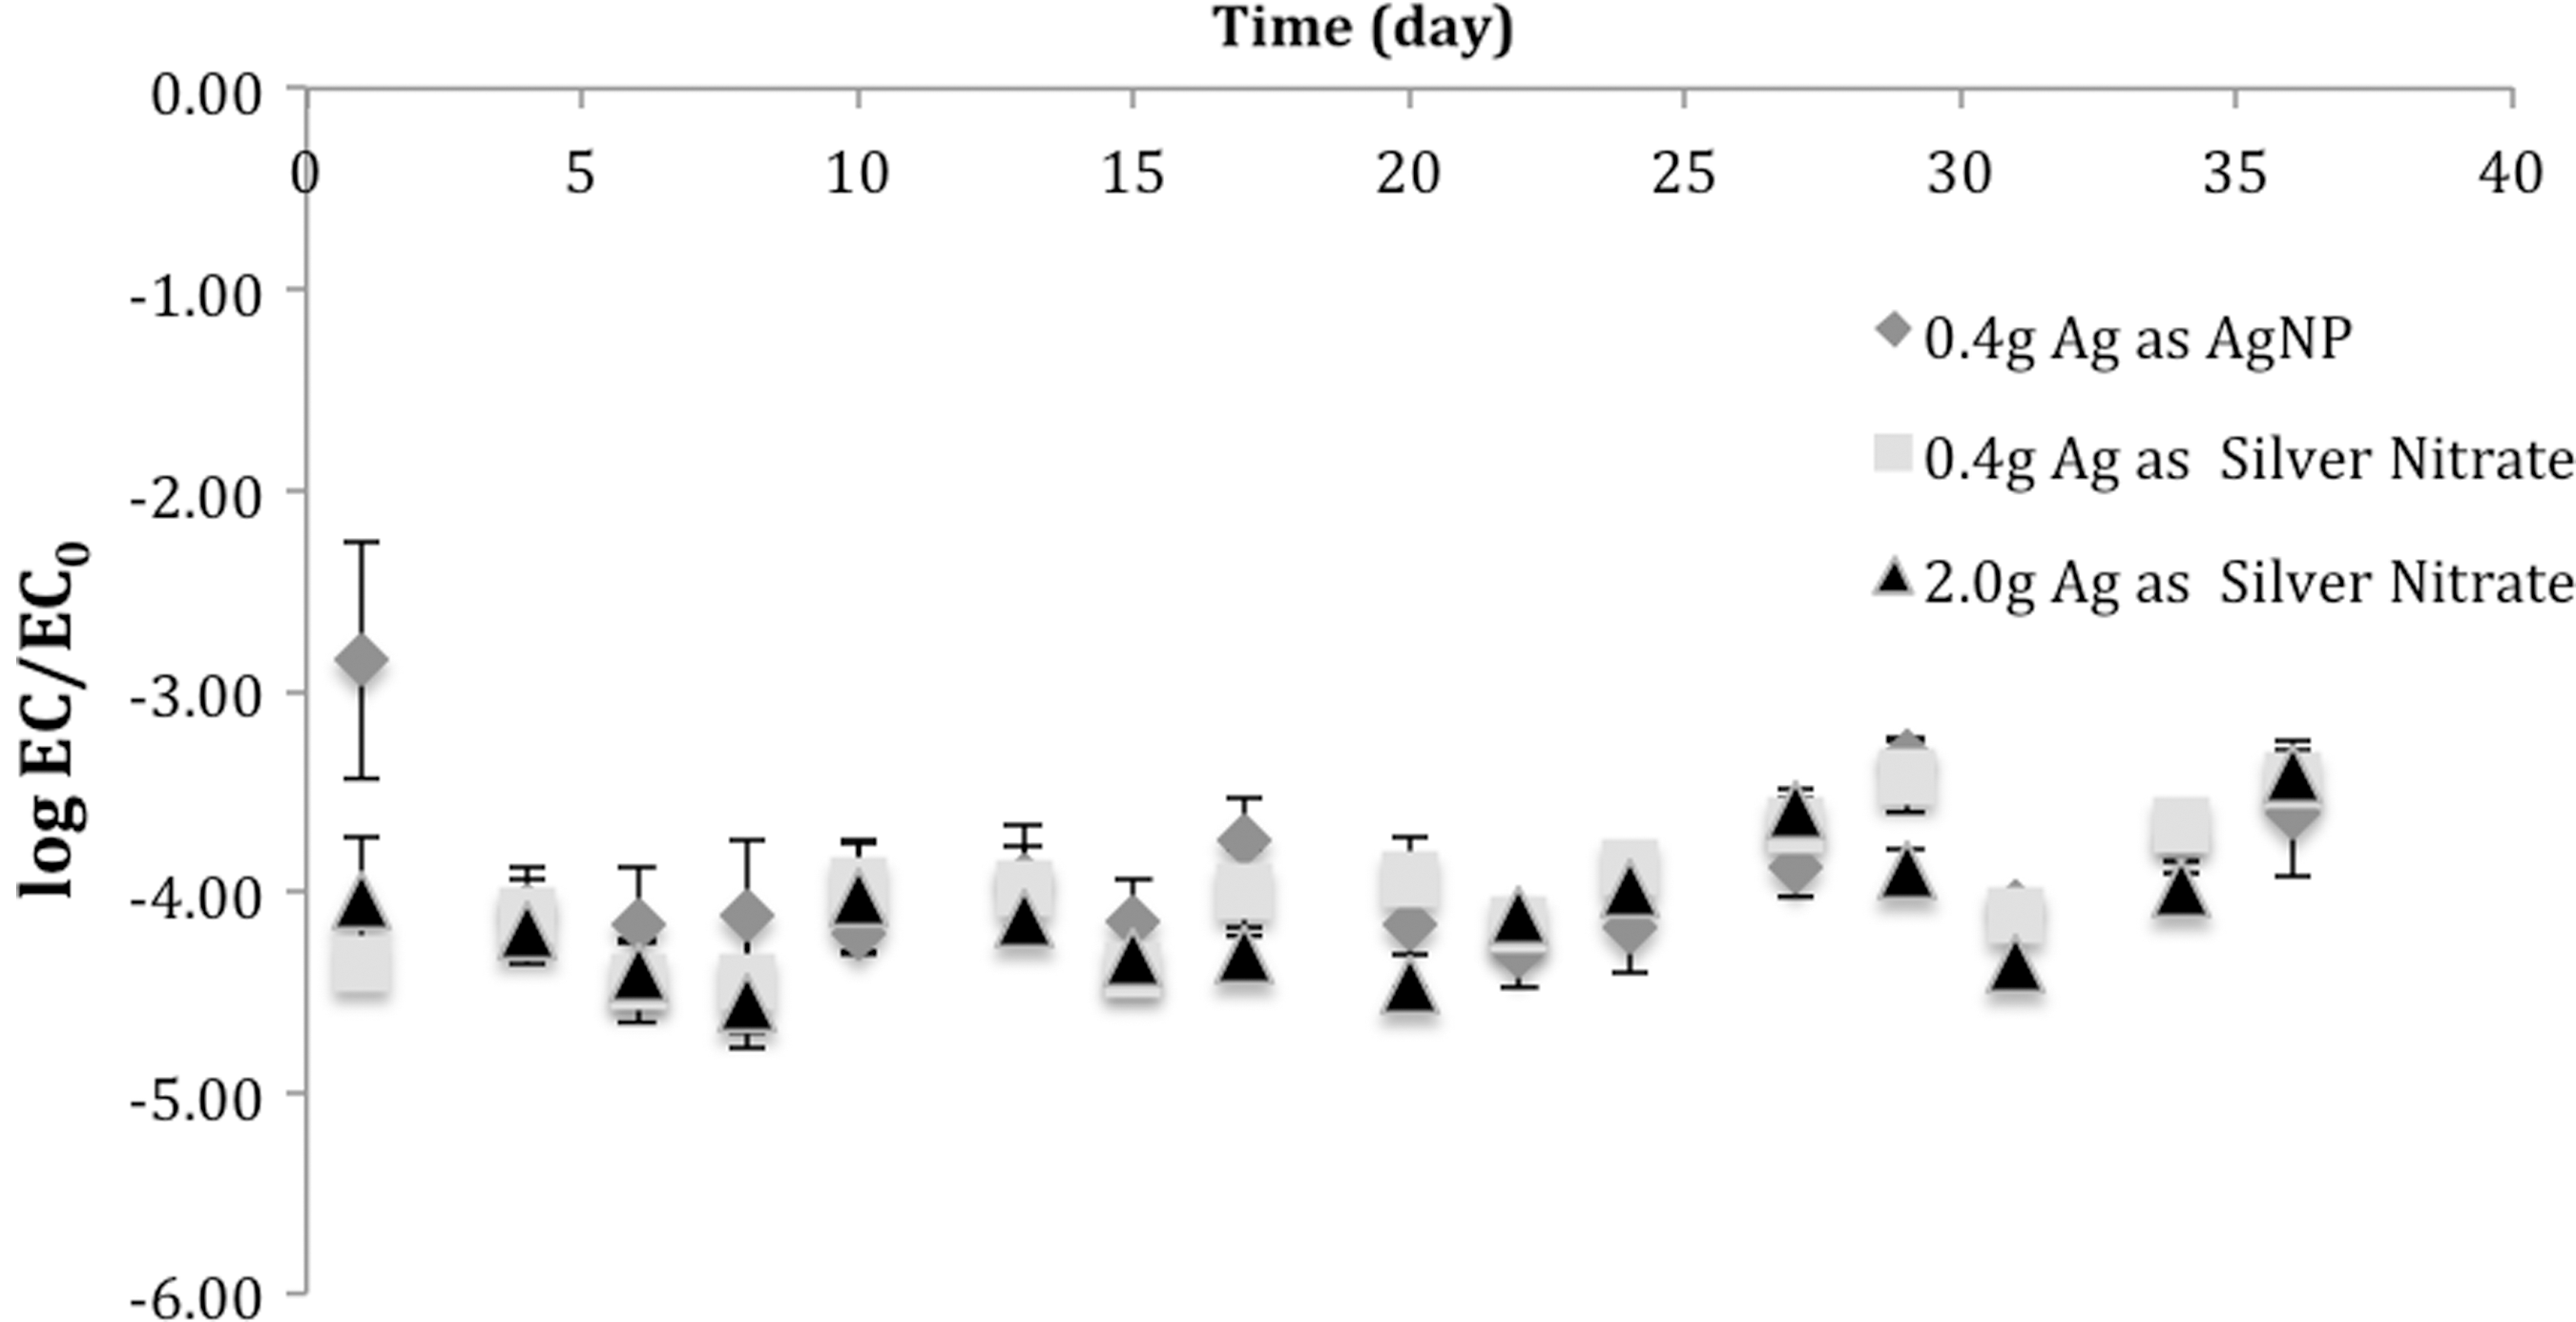
Mean values for log of E. coli concentration (EC) in the effluent over the influent (EC0) averaged for each production method over time for filters produced at the PureMadi Production Facility at Mukondeni. Error bars indicate one standard error above and below the mean.
Table 4 presents the result of triplicate tests of the microbiological performance of filters manufactured at the PureMadi Production Facility at Dertig. The source water was the same as used for the Mukondeni filters described above. Again, source water was spiked with laboratory-grown nonpathogenic E. coli for the influent water in filter testing. The same membrane filtration method was used to measure the concentration of E. coli and of all other types of coliform separately. The two concentrations added together is the total coliform concentration. Log coliform and E. coli removals were consistently greater than 3 with relatively low standard errors, suggesting effective and consistent performance for all filter types.
Figures 4 and 5 show the total coliform and E. coli removal (respectively) over time for filters produced at the PureMadi Production Facility at Dertig for each filter type tested. Performance is relatively consistent over the 17-day test period for all filter types.

Log of total coliform concentration (TC) in the effluent over the influent (TC0) averaged for each production method over time for filters produced at the PureMadi Production Facility at Dertig. Error bars indicate one standard error above and below the mean.
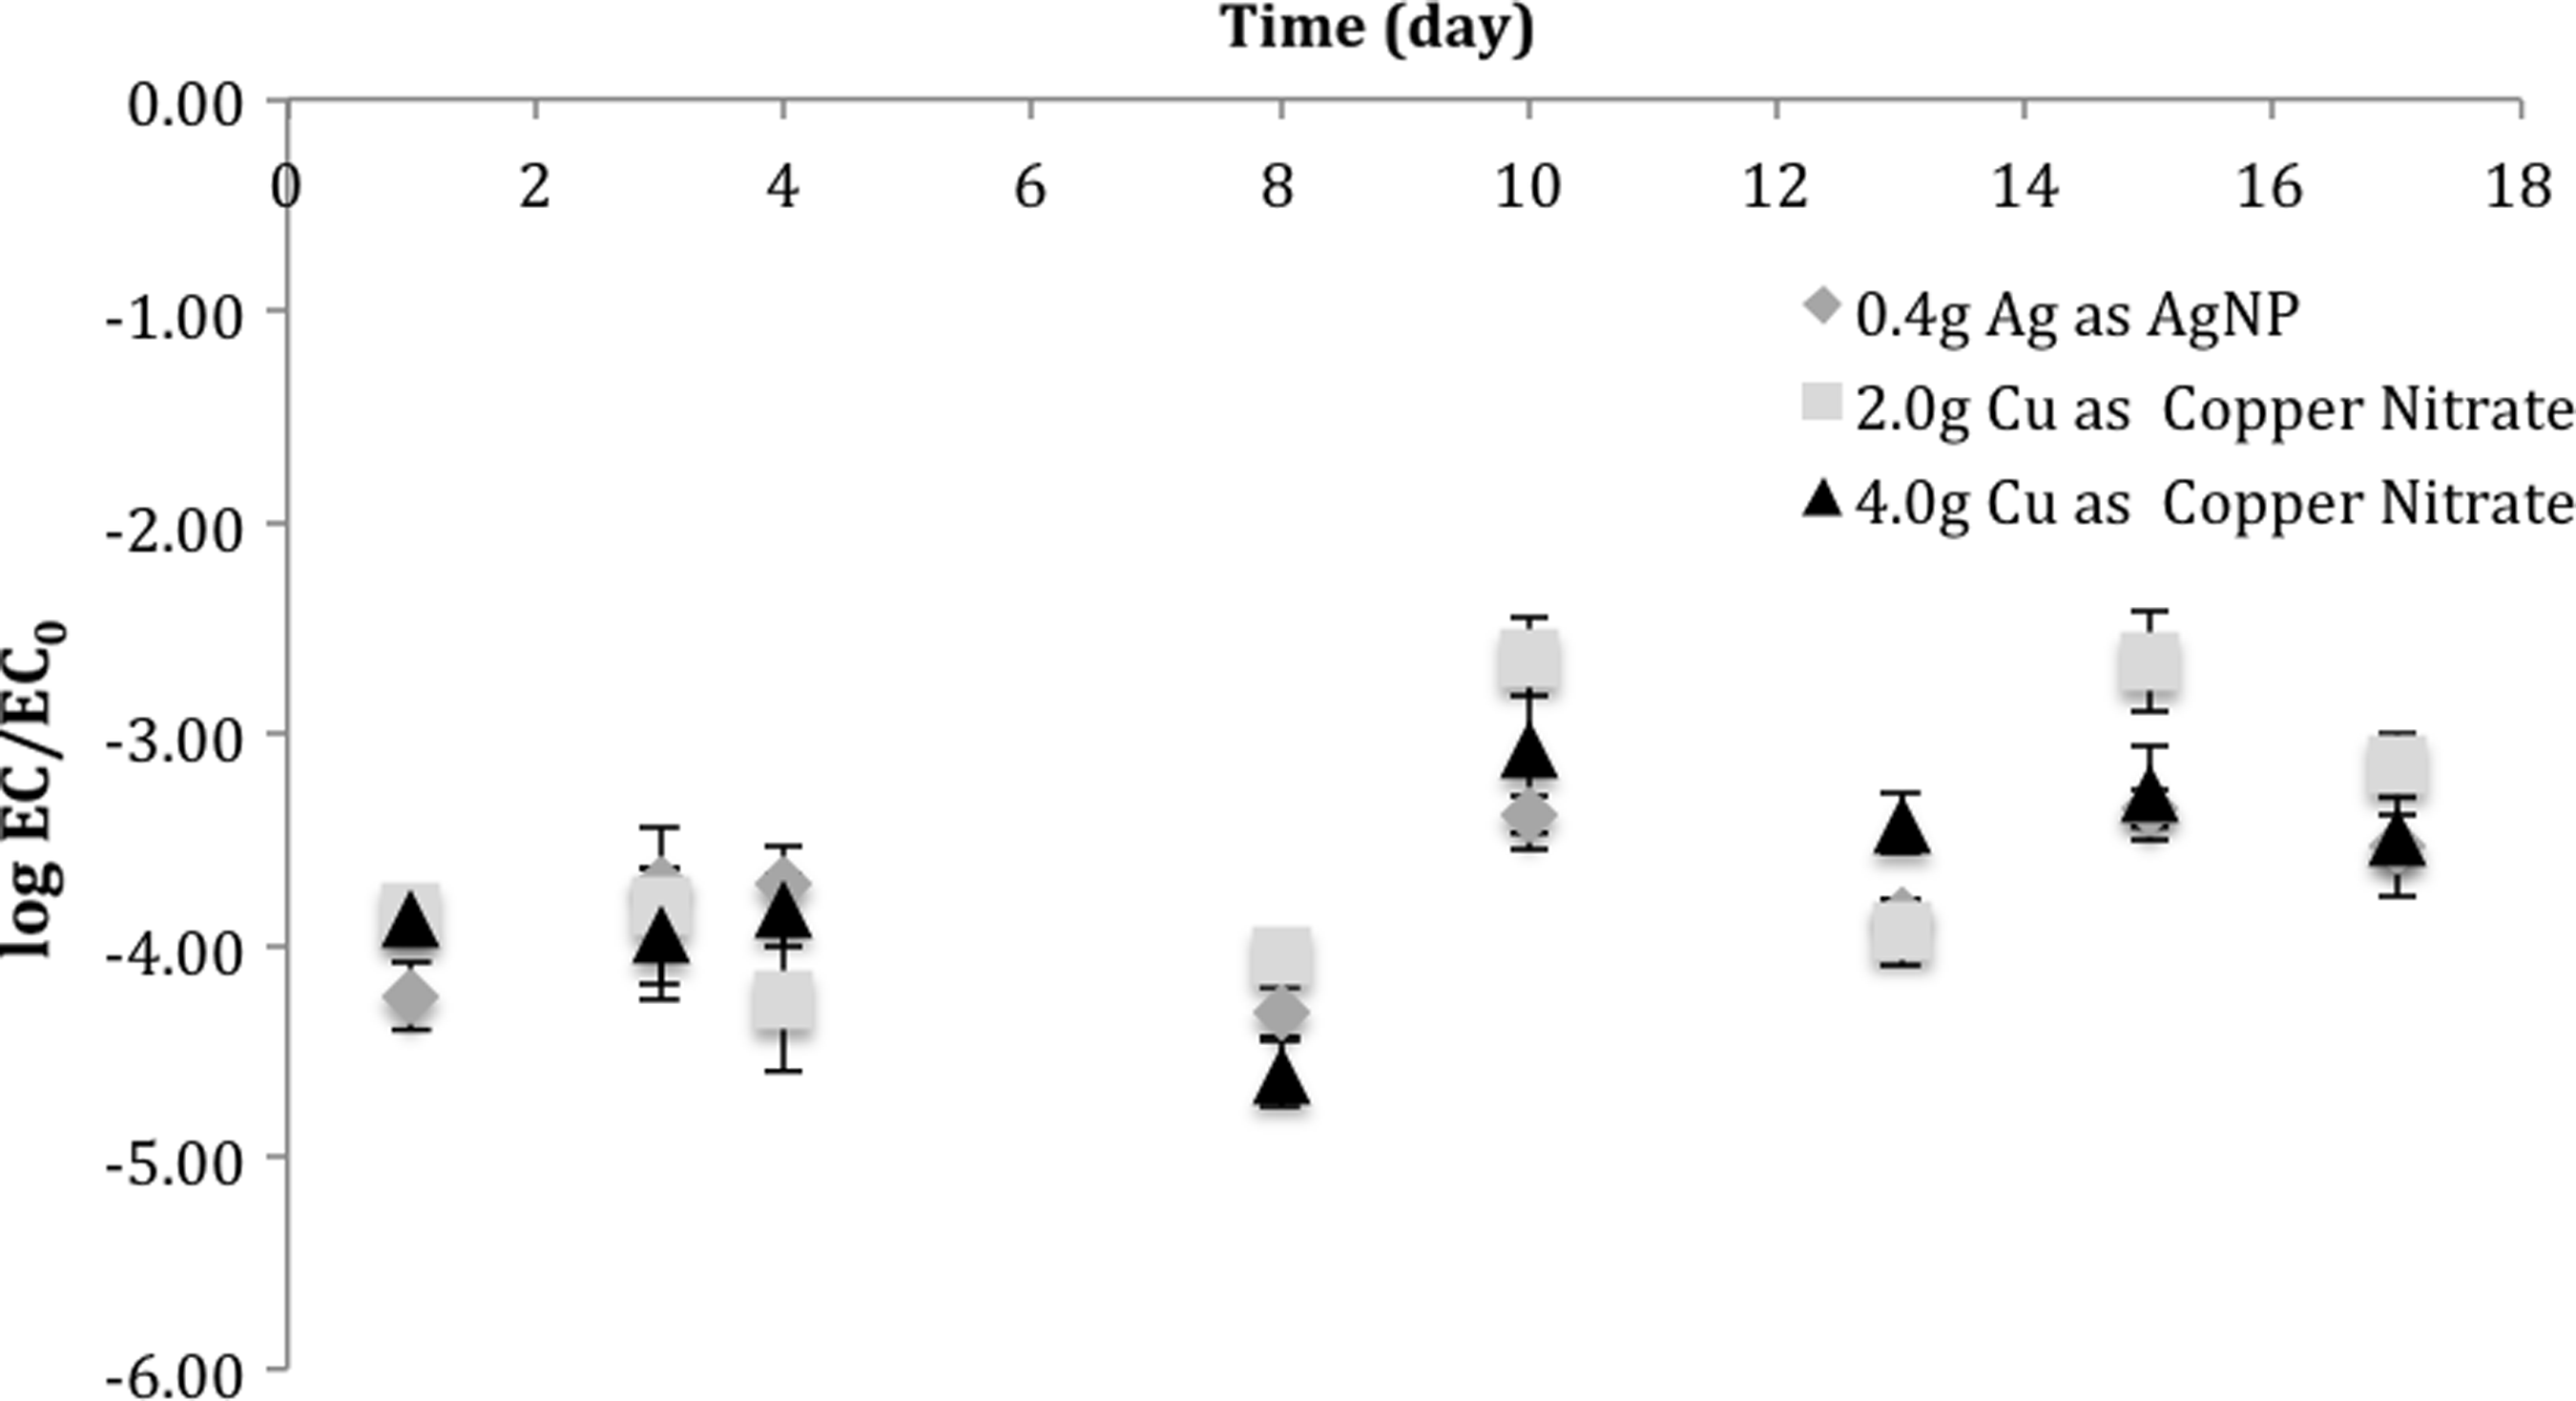
Log of E. coli concentration (EC) in the effluent over the influent (EC0) averaged for each production method over time for filters produced at the PureMadi Production Facility at Dertig. Error bars indicate one standard error above and below the mean.
Figure 6 graphically presents the average log of total coliform and E. coli removal by each type of filter. Results show that the Cu(NO3)2 filters have the lowest log removal of total coliform and E. coli compared to the silver filters, even with 5 or 10 times as much copper included in the filter, but also that all filters performed similarly.
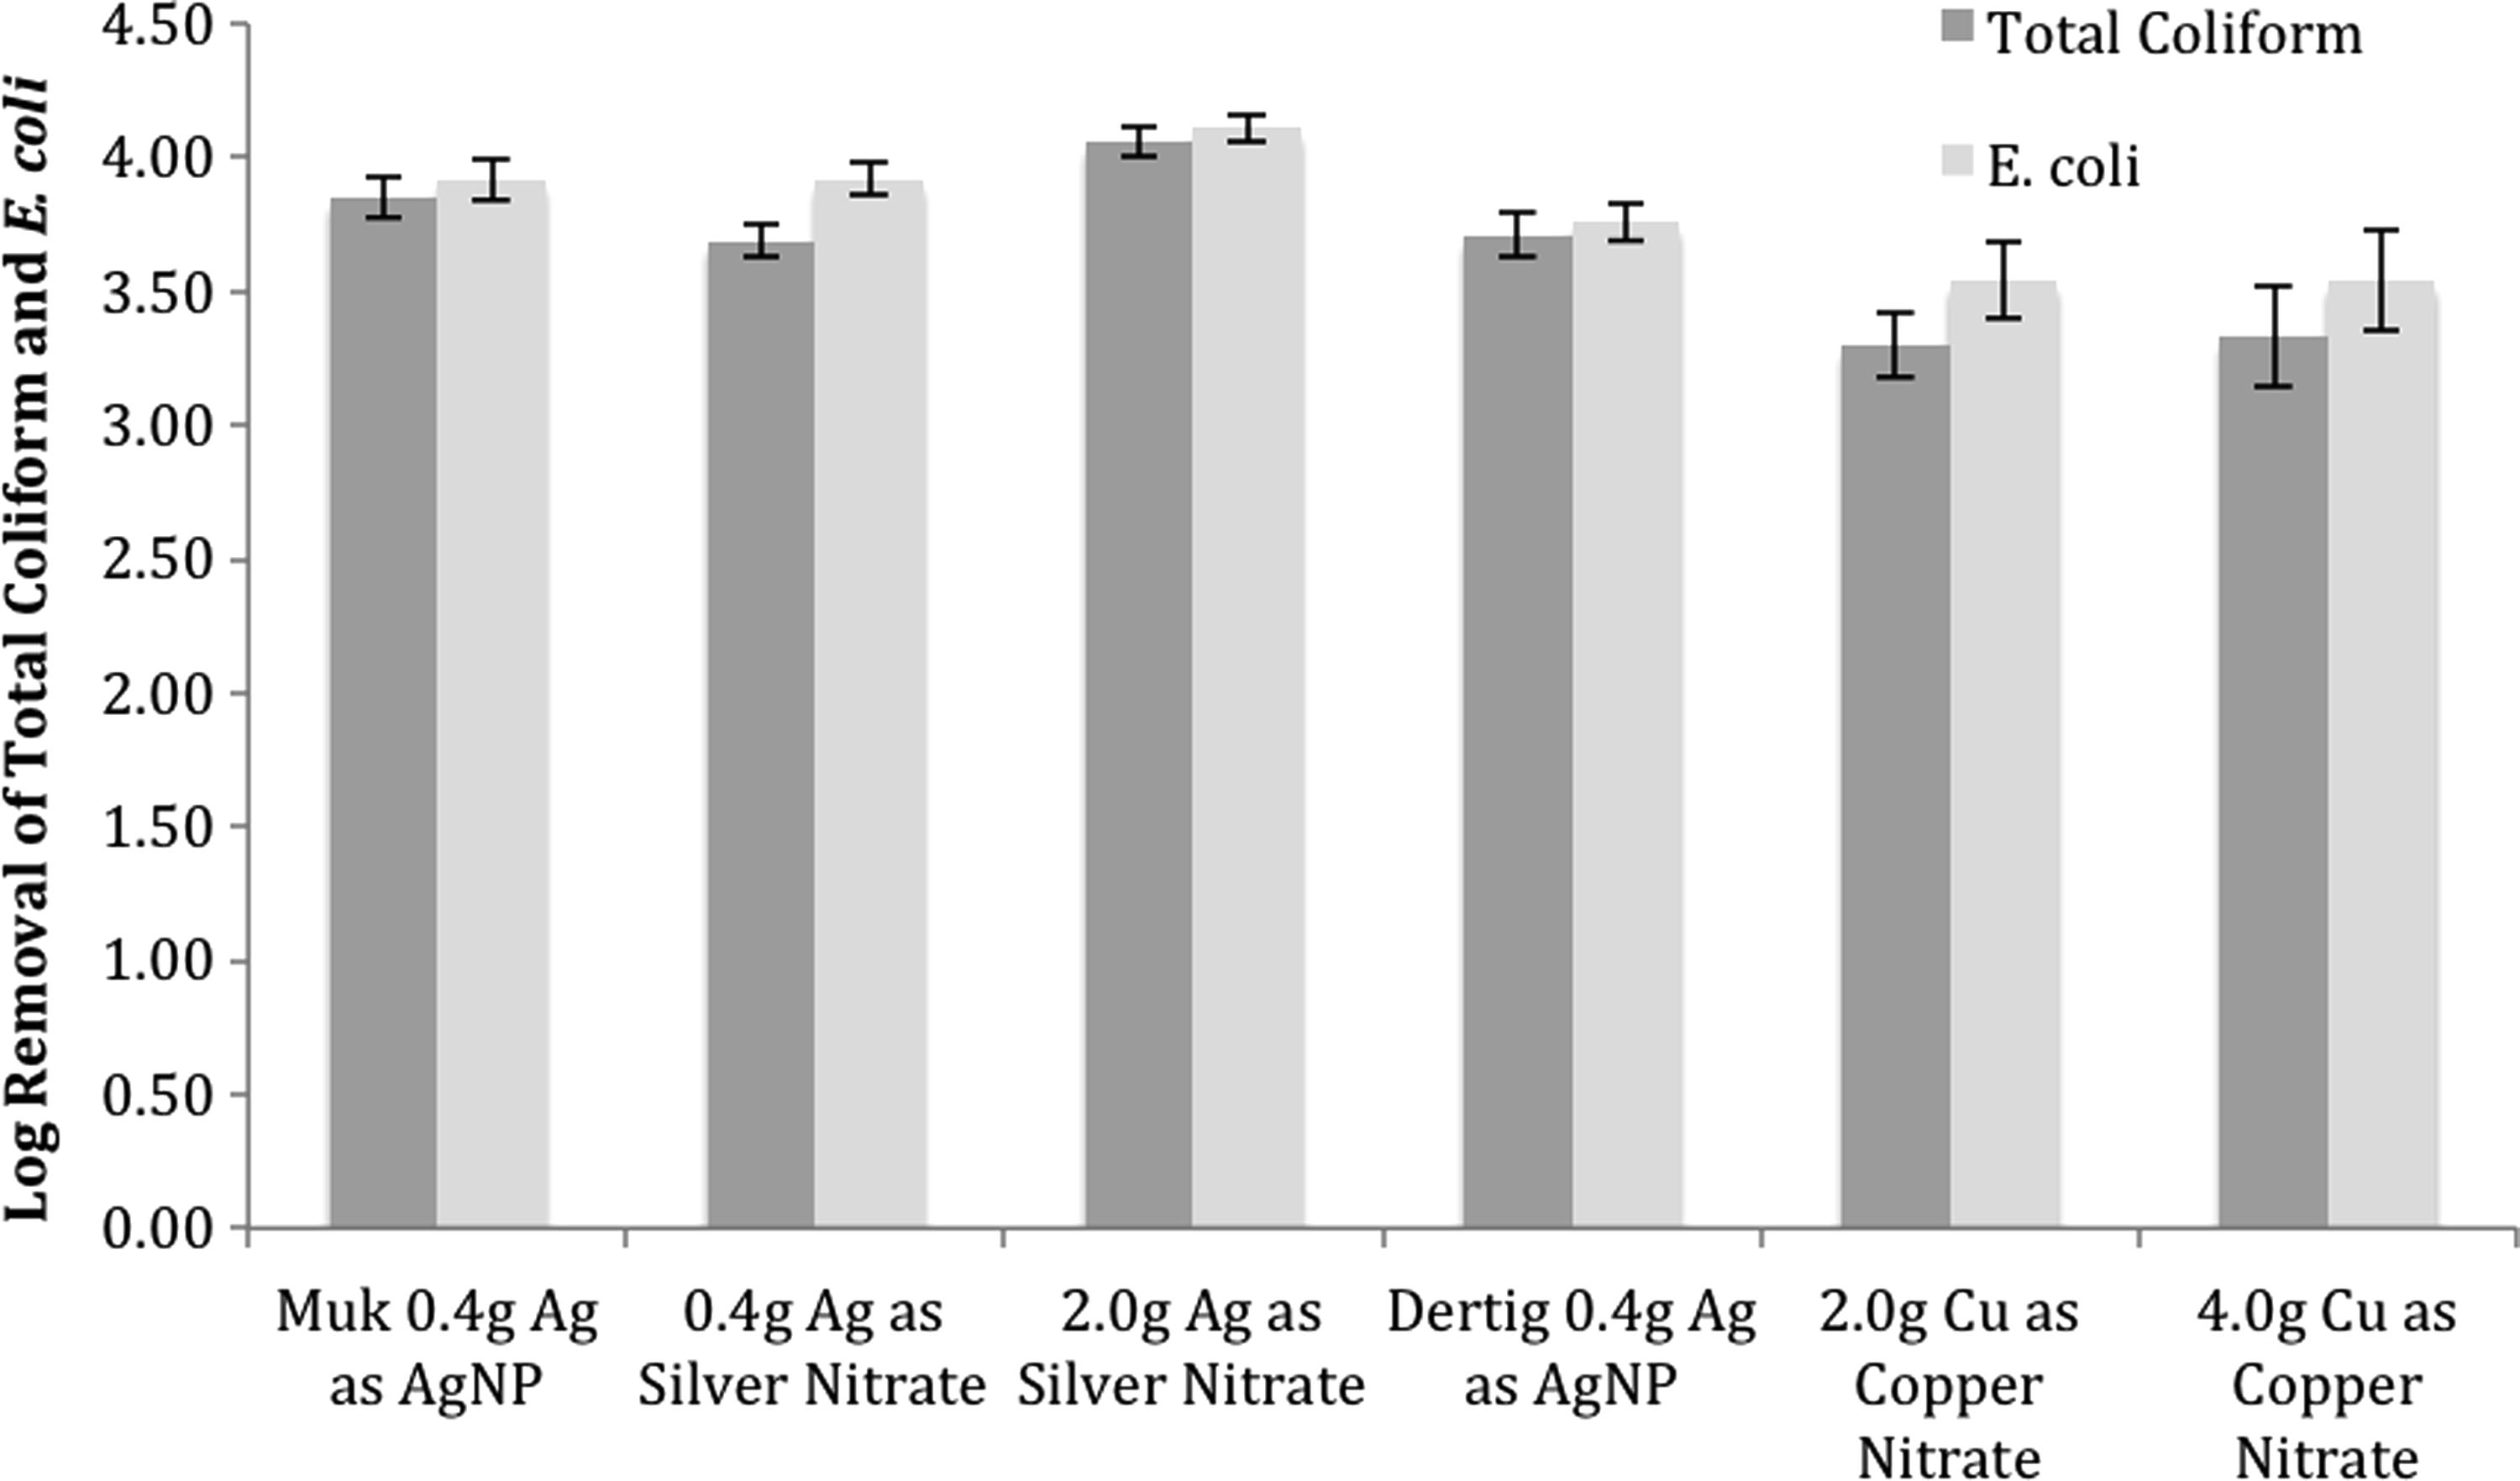
Results from fieldwork comparing full size filters for total coliform and E. coli removal over 36 days for Mukondeni (Muk) filters and 17 days for Dertig filters. Error bars indicate one standard error above and below the mean.
Figure 7 shows the average metal levels, measured using GFAA, in effluents from filters over time. The figure shows that the filters have constant effluent concentrations over the extent of the experiment and reasonable consistency between replicates.
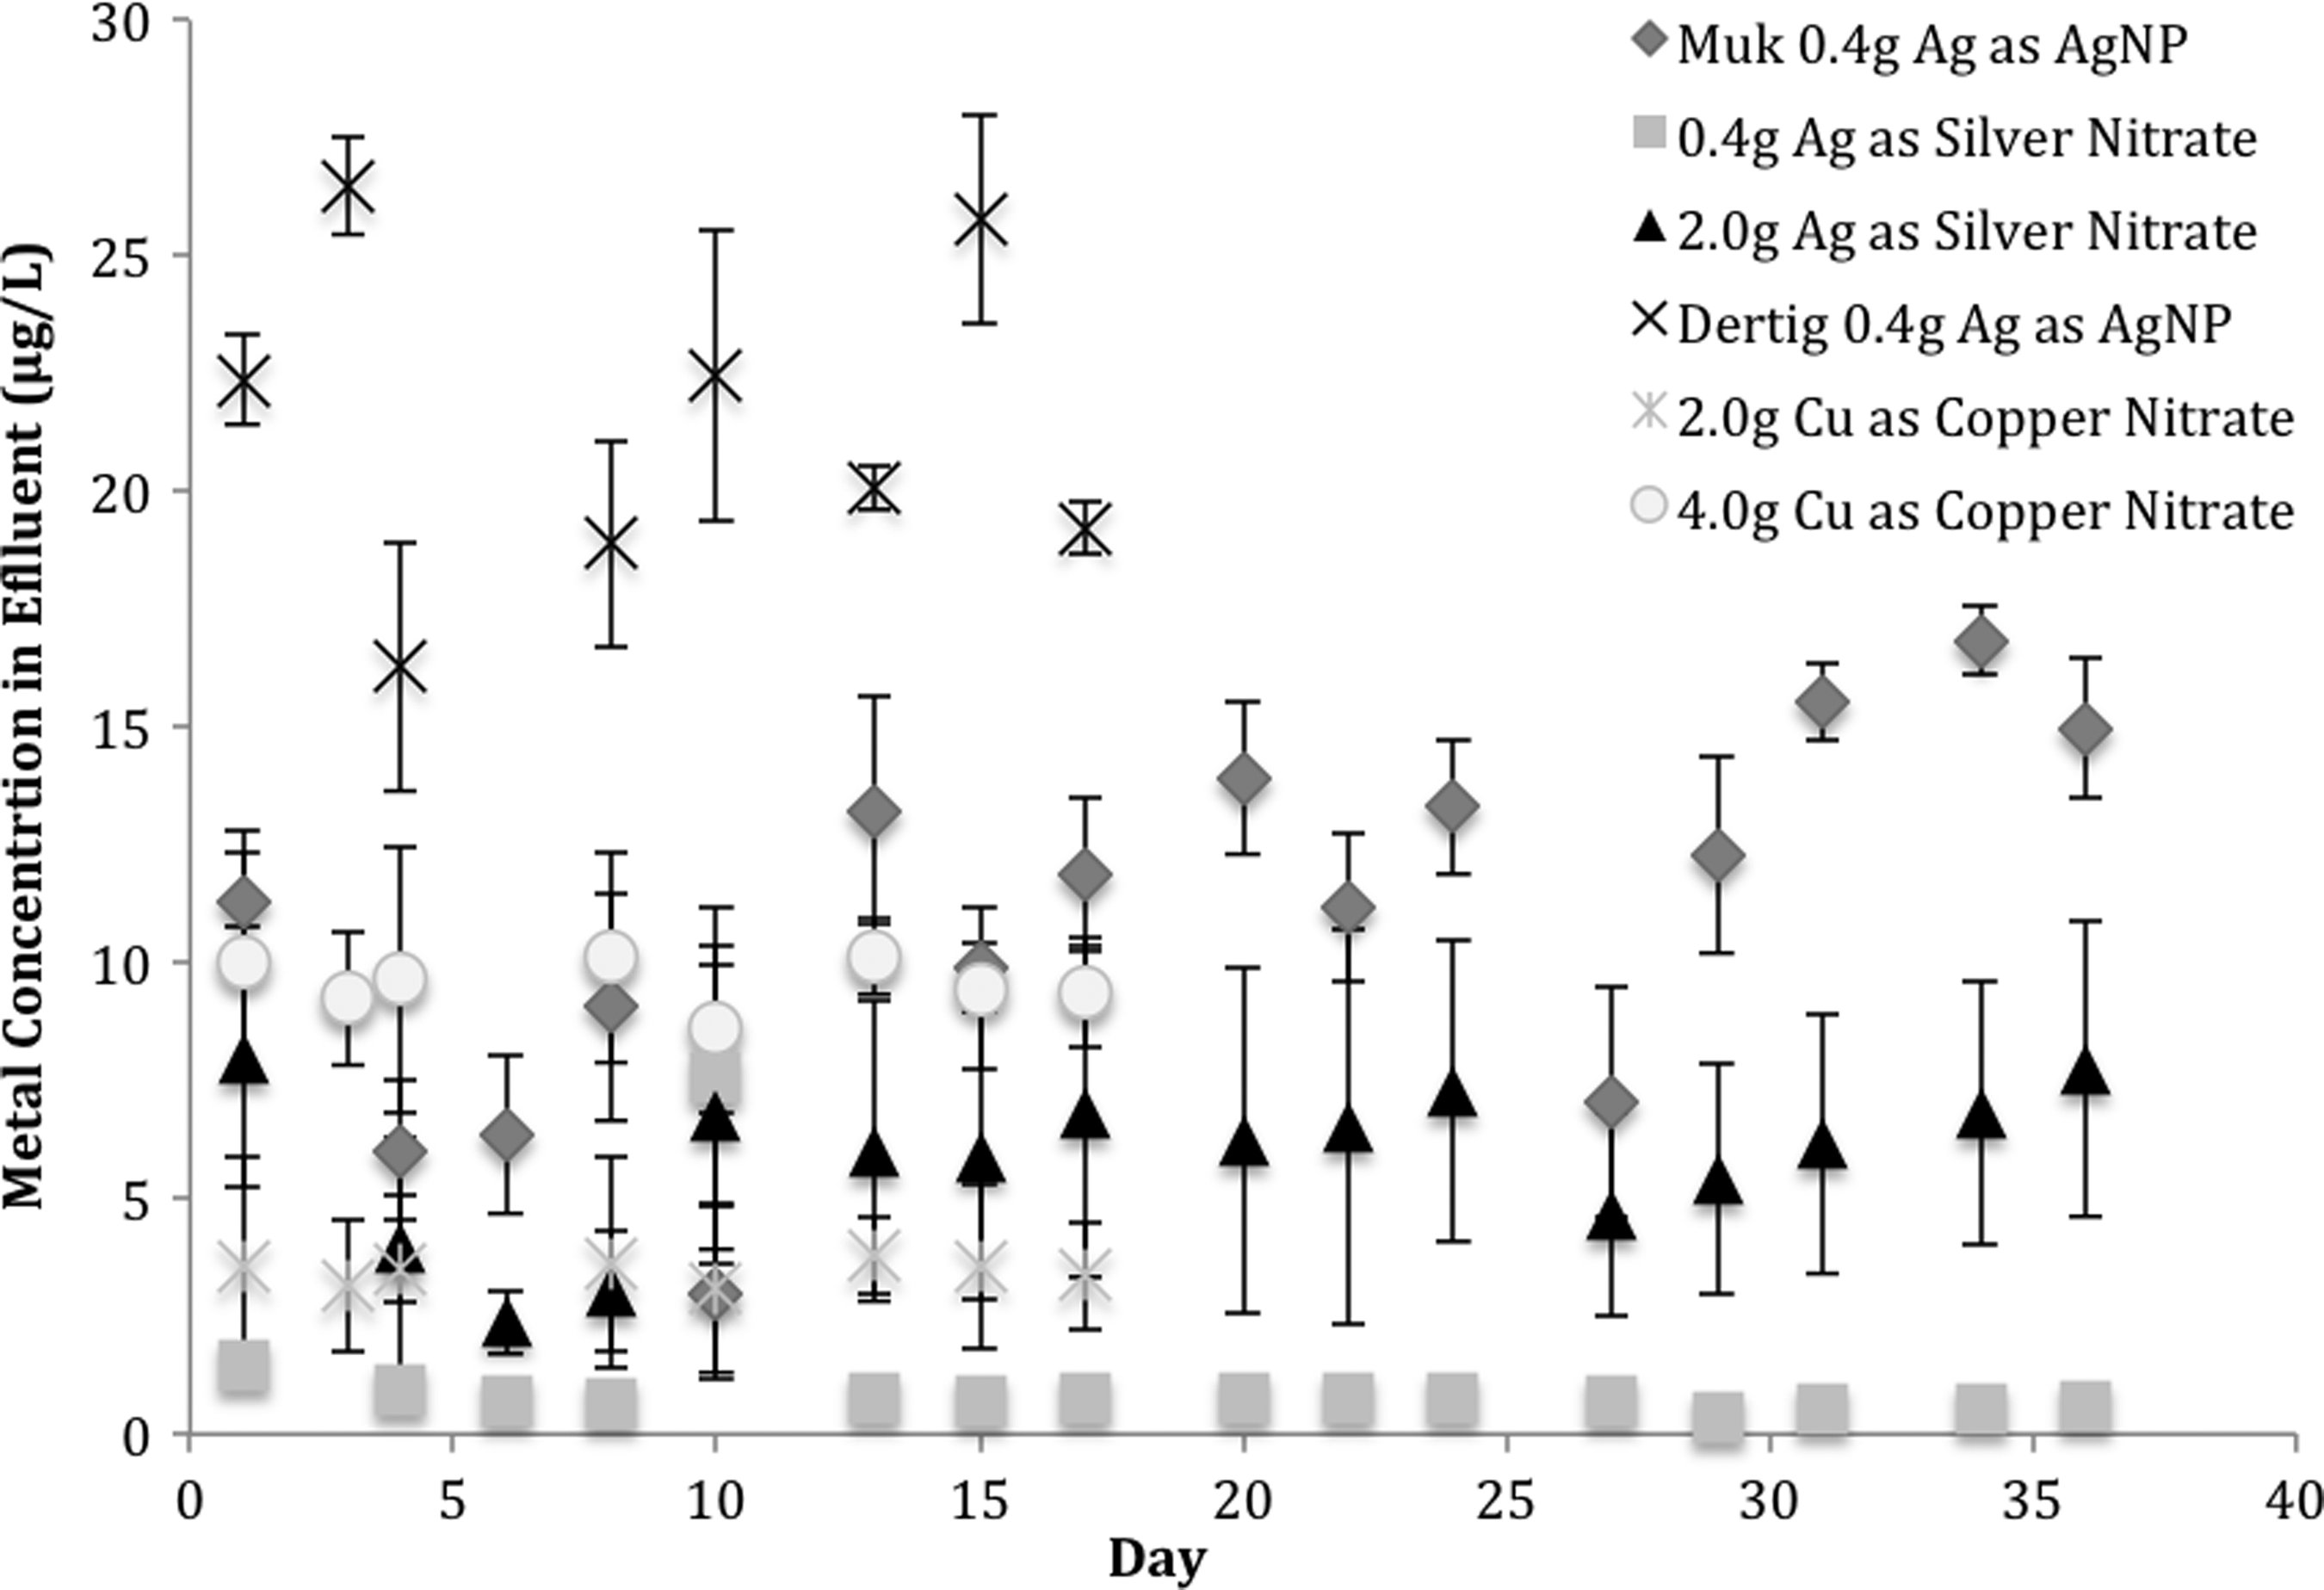
Total silver or copper levels in the effluent averaged by filter type over the time span of testing. Error bars indicate one standard error above and below the mean.
Figure 8 shows the metal levels in the effluent averaged over the length of the experiment. All of the concentrations are safely below the drinking water standard, but the Dertig AgNP filters produced silver concentrations twice as high as Mukondeni filters produced with the same amount of AgNP. AgNO3 filters with the same amount of silver as the AgNP filters have much lower concentrations.
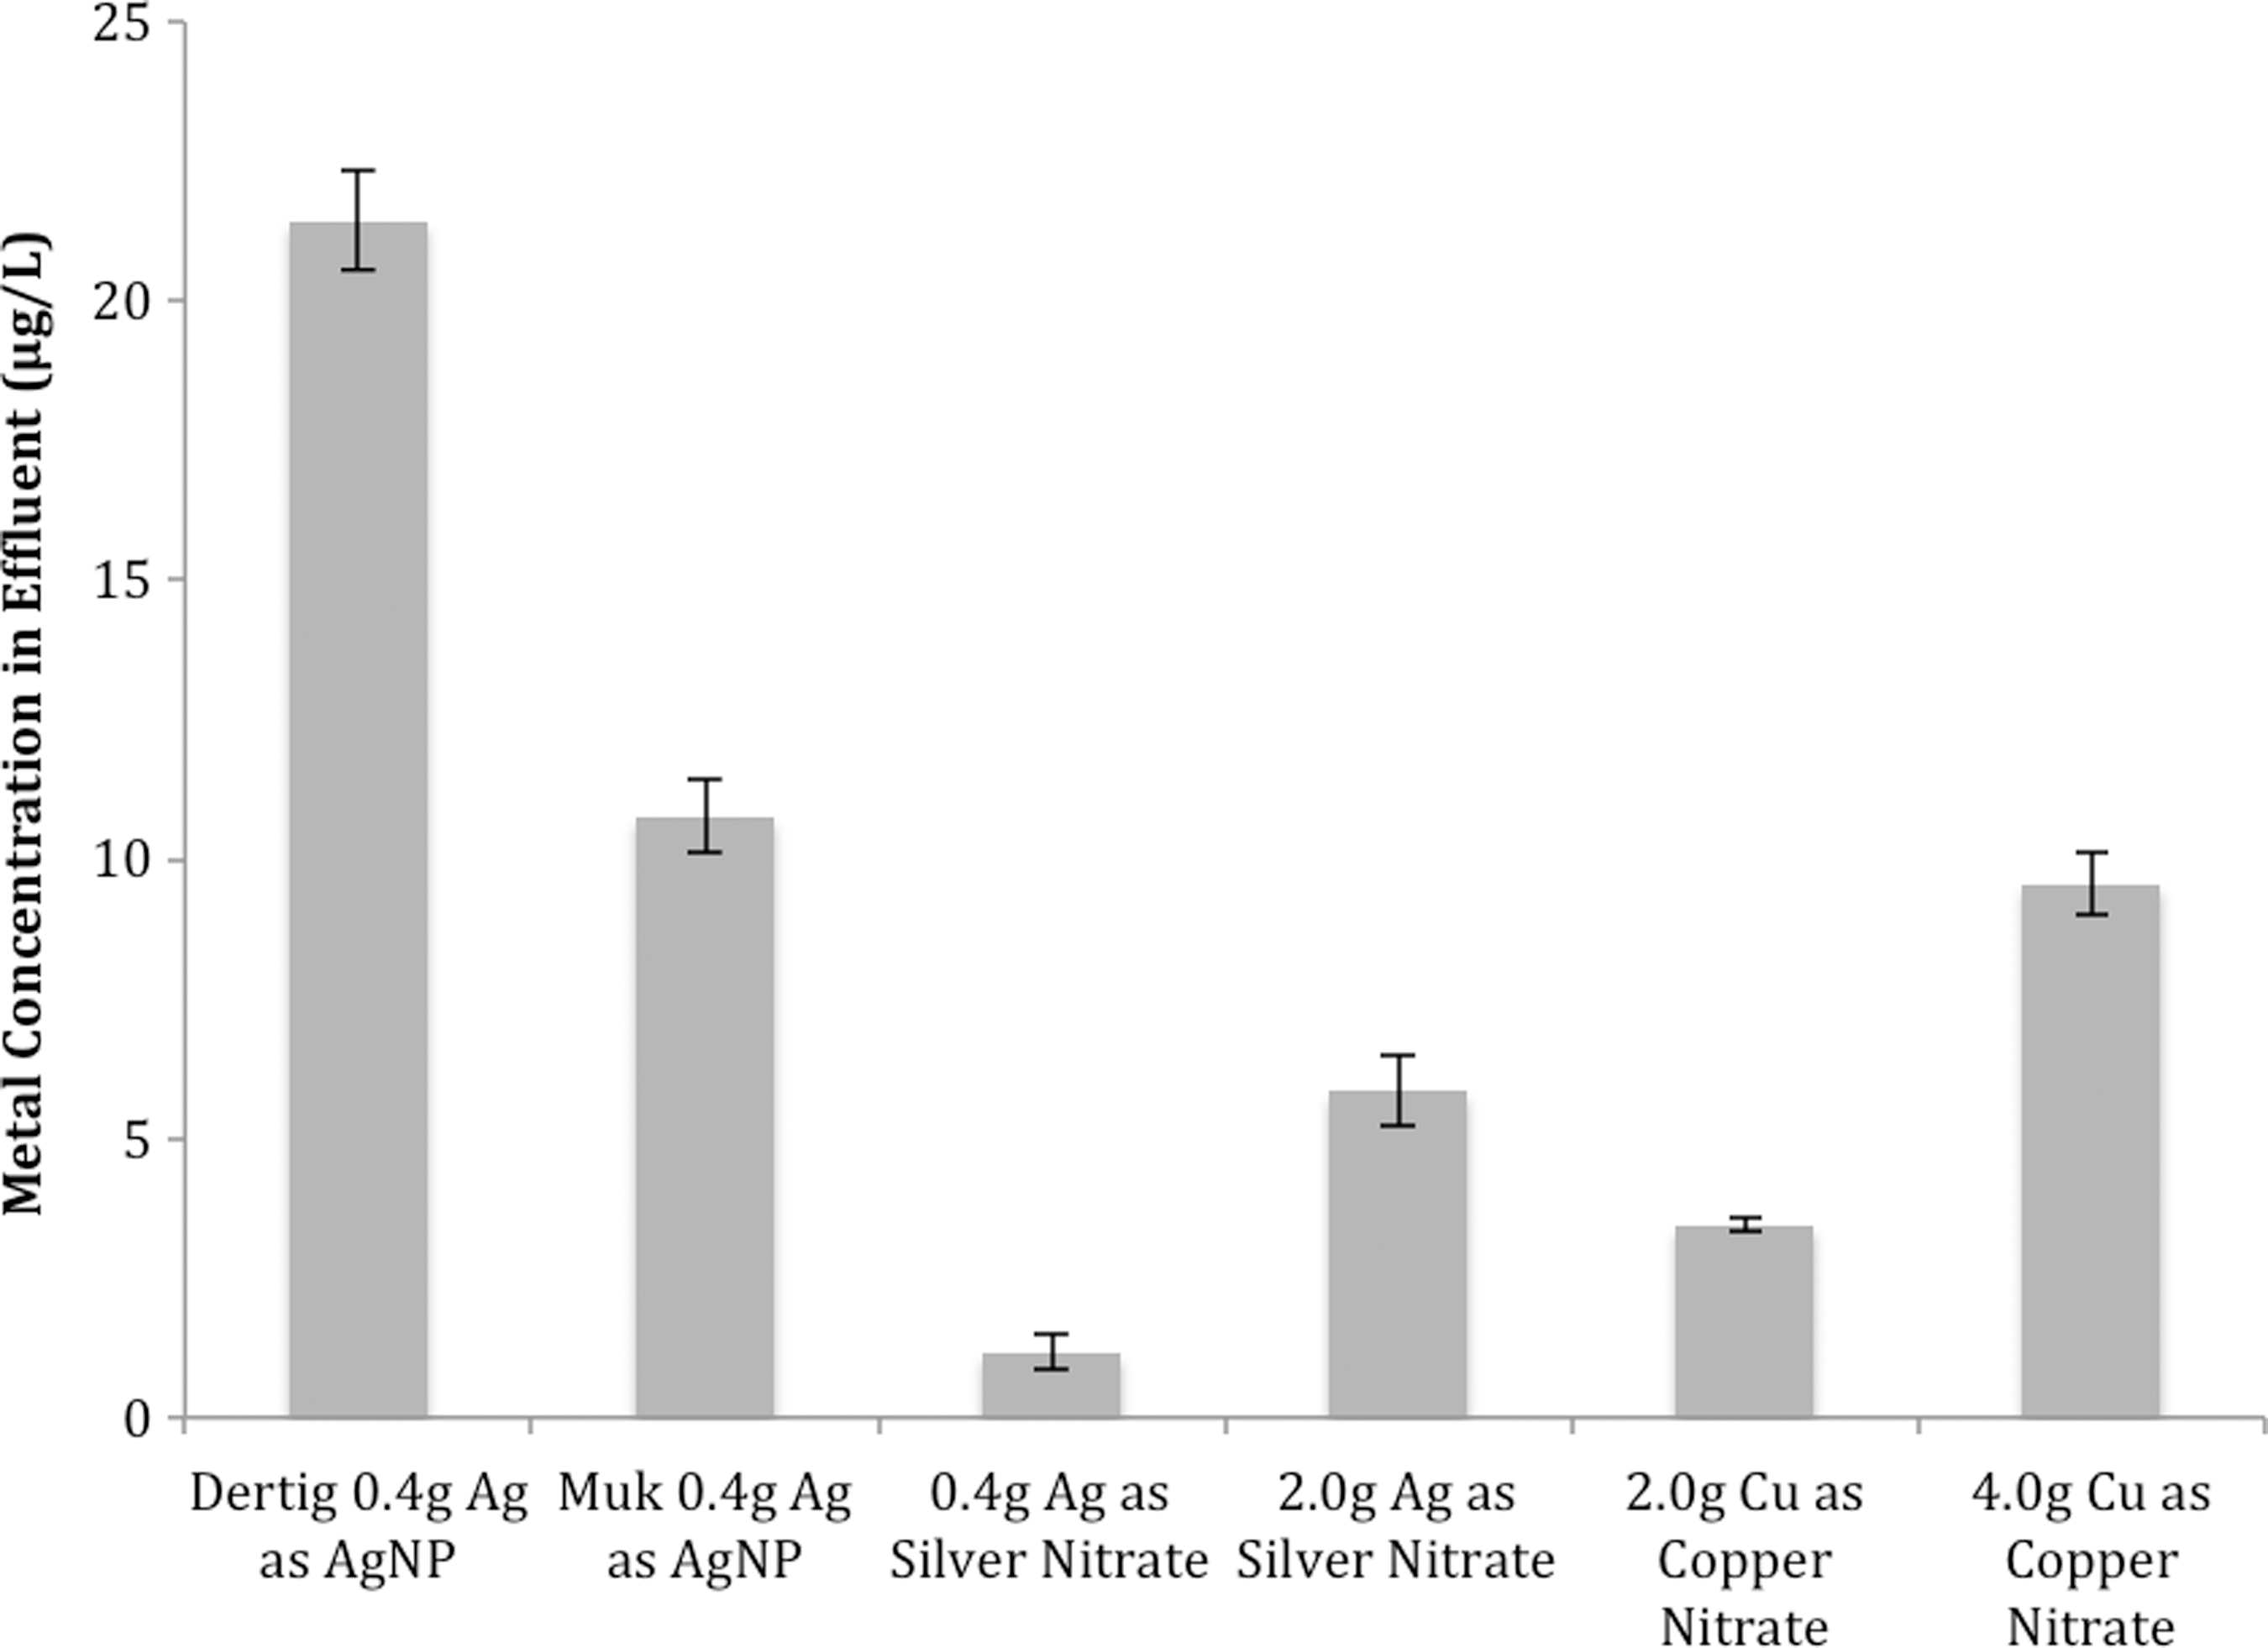
Results from fieldwork comparing full size filters for total silver or copper levels in the effluent.
No-flow conditions
Results of experiments to study a worst-case scenario with respect to silver release, where the storage container is filled with water to capacity to maintain maximum and continuous contact with the filter, are presented in Fig. 9 below. Results show that the silver-nitrate filters, even with stagnant conditions, maintain silver concentrations averaging 10 μg/L. This is well below the drinking water standard and a tenth of the average from AgNP filters (102 μg/L).
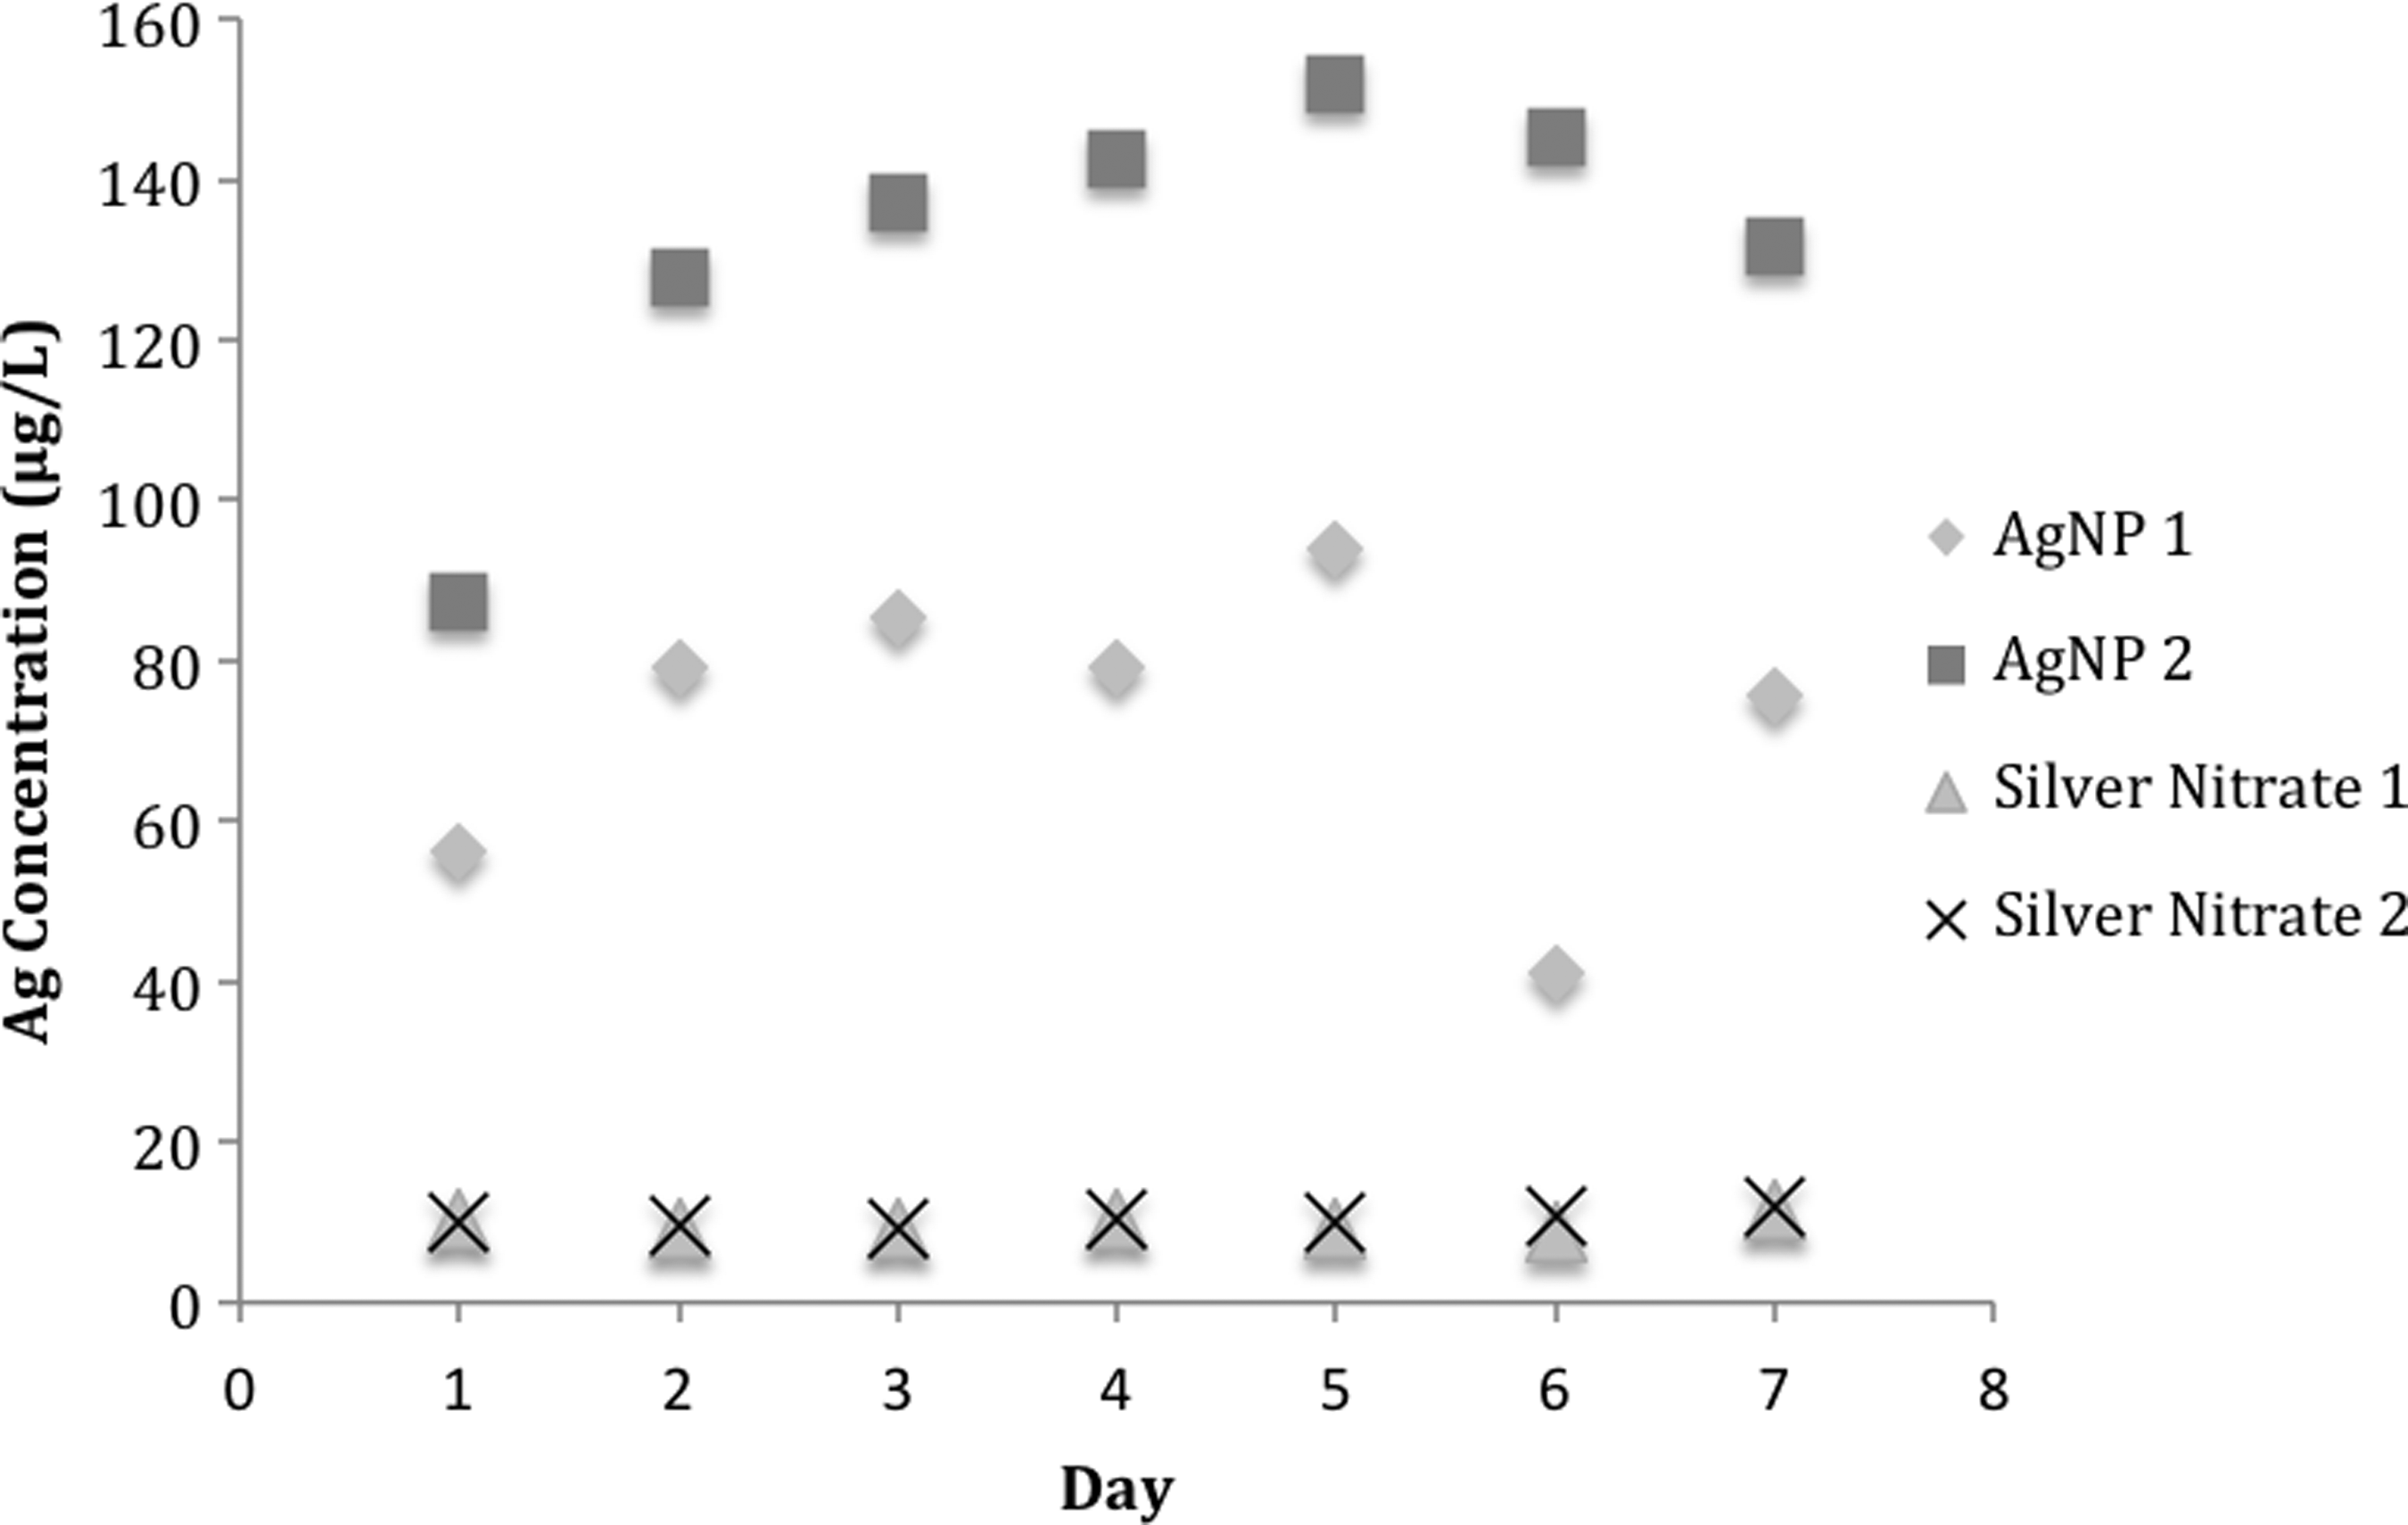
Results of duplicate experiments showing the silver concentration in effluent from filters over 1 week of stagnant exposure.
Discussion
Incorporating AgNO3 into ceramic water filters before firing results in filters that are equally or more effective at total coliform and E. coli removal relative to filters produced with painted-on AgNPs. Figures 2 and 3 show the average log removal of total coliform and E. coli for each filter type for each day over the 36-day span of the experiment. The different production methods result in similar levels of total coliform and E. coli removal, but the AgNP method results in greater variation in removal.
Table 3 shows the average log reduction of total coliform and E. coli for the filters produced at the Mukondeni facility. The 2.0 g Ag as AgNO3 filters produced the highest average log removal of total coliform and E. coli—with averages of 4.06 and 4.11, respectively. This represents more than 99.99% removal of both total coliform and E. coli and is also in the “highly protective” performance category for the World Health Organization (World Health Organization, 2011b). The 0.4 g Ag as AgNO3 filters had slightly lower average log removals of total coliform (3.69), but had the same log removal of E. coli (3.92), as the AgNP filter with a lower standard error. The average log removal of total coliform for the AgNP filter was 3.85, but its error bars overlap with the bars for the 0.4 g Ag as AgNO3 filters.
AgNO3 filters release smaller amounts of silver into the treated water than AgNP filters. For example, the mean effluent silver concentration for the Dertig and Mukondeni 0.4 g Ag as AgNP filters was 22 and 12 μg/L (respectively), compared to only 2 μg/L for the Mukondeni 0.4 g Ag as AgNO3 filter (Fig. 8). This corresponds to a 6–11-fold reduction in effluent silver concentration. AgNO3 filters' effluent silver concentrations are consistently lower over time, and even AgNO3 filters made with five times as much silver had effluent concentrations lower than the AgNP filters.
The precise cause for this result was unknown. The surface chemistry mechanism between the ceramic and the silver nanoparticle versus the silver nanopatch could have an effect on the differences in silver release. Filters produced using the same type and amount of silver nanoparticles at the two production facilities have different silver effluent concentrations. This could potentially be due to the different clay source used, but could also be affected by the different firing protocols used. During the kiln firing process, the clay is sintered to form the ceramic. Different temperature patterns could affect the ceramic formation and therefore the silver-ceramic interface. Van der Waals forces could be attracting the nanosilver to the ceramic and easily releasing during filter use. Physically, the nanopatch formation occurs on the textured ceramic surface, and this most likely holds the round nanopatch in place. There are potentially chemical forces occurring between the surfaces, but these should be the same for both the silver nanoparticle and the silver nanopatch. It is also potentially possible that silver ions are attaching to the surface through ion exchange during the mixing process. If clusters of highly negative charge density exist on the surface, multiple silver atoms could be attracted. This could cause a reaction and the formation of a metallic nanopatch during the kiln heating process.
It is likely related to the nature of metallic silver formation/deposition in the AgNO3 filters relative to the AgNP filters. For the AgNO3 filters, metallic silver “nanopatches” are formed with reduction during the firing process. These nanopatches have a mean diameter between 2 and 3 nm and are distributed relatively uniformly throughout the ceramic porous media as detailed by Ehdaie et al. (2014). Since the silver reduction occurs under dry high-temperature conditions, the metallic silver appears to form a tight bond with the ceramic pore surface. For a ceramic tablet infused with silver in this manner, Ehdaie et al. (2014) demonstrated that only silver ions are released from the porous ceramic under stagnant water conditions.
Conversely, AgNPs are applied to ceramic water filters using an aqueous suspension of the nanoparticles. The suspension is drawn into the ceramic media by capillary action during the painting process, and the nanoparticles presumably lodge in the pore space. When the filter begins to be used, it is reasonable to assume that many of these nanoparticles will be mobilized. Indeed, this has been quantified previously in the laboratory by Ren and Smith (2013a). It is also possible that some of the silver applied using the AgNO3 method is isolated in pores not connected to the flow system, since the filters are pressed and fired after application of AgNO3. However, this silver isolation, if it is significant, does not appear to have any significant effect on filter performance in terms of coliform bacteria or E. coli removal relative to AgNP filters (Fig. 6).
One prior study has considered the alternative method of AgNPs in the ceramic before firing for a higher retention rate and longer life span, but this study did not test that method for bacterial removal in laboratory or field experiments (Ren and Smith 2013b). Brown and Sobsey (2010) tested the use of AgNO3 in ceramic water filters in Cambodia, but applied the AgNO3 after firing and did not test silver levels in the effluent. Mittelman et al. (2015) also addressed the use of AgNO3 compared to AgNP, but applied both by painting on the silver after firing which actually resulted in higher silver levels in the effluent from AgNO3 filter disks. Abebe et al. (2014) and Ehdaie (2015) both measured average total silver in the effluent from ceramic water filters produced in South Africa painted with colloidal silver of 11.7 μg/L and average ranges from 46.4 to 6.94 μg/L, respectively. Kallman et al. (2011) studied filters painted with AgNPs produced in Guatemala and found that the average ionic silver concentration was 20 μg/L with a maximum of 90 μg/L seen during the first 12 h of use.
It is also important to note that for all the flow-through experiments conducted in this investigation, the silver concentration in the effluent filter water never exceeds 30 μg/L, which is significantly below the USEPA and WHO standards of 100 μg/L. The highest effluent silver levels were observed for the AgNP filters from Dertig 22 μg/L; Fig. 8), which is significantly higher than the effluent silver concentrations observed for the Mukondeni AgNP filters (12 μg/L; Fig. 8). The Dertig and Mukondeni AgNP filters both use the same silver application method, so this difference is likely caused by differences in the raw filter materials (clay and burnout material).
AgNO3 filters with 0.4 g of silver produced an average concentration of 1.2 μg/L. This is less than a tenth of the average concentration of silver in the Mukondeni AgNP filters (11 μg/L) produced with the same amount of silver. The 2 g AgNO3 filters produced an average concentration of 5.9 μg/L. This filter type also provided the most effective removal of coliform bacteria and E. coli.
Figure 9 addresses the issues found during no flow use of filters, where water may be in contact with the sides of the filters for an extended period of time before consumption. This leads to more metal washout and higher effluent concentrations. This figure shows the silver concentrations in the effluent monitored over 7 days, with stagnant water in the filter. Filters produced at Dertig were used to establish a “worst-case” scenario, since they produced the highest silver levels in previous tests. Silver concentrations are much higher in the AgNP filters than the AgNO3 filters. The silver concentrations on average are 102 and 10 μg/L for the AgNP and AgNO3 filters, respectively. These results show that AgNP filters can produce silver concentrations above the drinking water standard, although in a worst-case scenario. By contrast, AgNO3 filters consistently result in silver concentrations in the treated water well below the drinking water standard. The AgNO3filter silver concentrations do slightly increase over time (slopes of 0.30 and 0.12), but remain fairly stable and low across the 7-day experiment.
Cu(NO3)2 filters also demonstrated effective performance and relatively low copper concentrations in the treated water. Figures 4 and 5 show the average log removal by each Dertig filter type for each of 17 consecutive days. Table 4 presents the average log reduction of total coliform and E. coli for the filters produced at the Dertig facility. The AgNP filters performed significantly better than the Cu(NO3)2 filters—with average log reduction of total coliform and E. coli of 3.71 and 3.76, respectively, for the AgNP filters versus 3.33 and 3.54 for the 4.0 g Cu as Cu(NO3)2 filters. The copper filters also exhibited greater variability between filters based on the larger standard errors. The filters with 2.0 g of copper and 4.0 g of copper performed almost identically, indicating that higher amounts of copper do not improve filter performance of these 17-day experiments. While the copper filters performed slightly worse than those made with silver, they still removed more than 99.9% of total coliform bacteria.
Figure 7 shows the average metal levels, measured using GFAA, in effluents from filters over time—17 days for Dertig filters and 36 days for Mukondeni filters. Figure 8 shows the average metal concentrations (μg/L) for each type of filter over the extent of the experiment. The average copper concentrations of 3 and 10 μg/L in the effluent of filters produced with 2.0 or 4.0 g of copper are less than 1% of the drinking water standard. The copper filters represent an effective alternative as the cost of Cu(NO3)2 is approximately one-tenth of the cost of AgNO3, and the drinking water standard is 1.0 mg/L for copper versus 100 μg/L for silver (USEPA, 2018). Despite this observation, it should be noted that there is much less laboratory and field data on the use of copper in ceramic filter media relative to silver.
Application of silver or copper to ceramic water filters as AgNO3 or Cu(NO3)2 before firing represents a promising new production method. In addition to good bacterial removal and lower silver levels, the AgNO3 method offers distinct economic and safety benefits over filters made with AgNPs. AgNO3 is less expensive, costing only $1 per gram of silver compared to $2.71 per gram of silver in the form of AgNPs based on 2018 pricing. The result is that the same amount of silver can be used per filter at reduced material cost or more silver could be added to improve filter performance while maintaining the same price. The same holds true for the use of Cu(NO3)2. The painting step is also removed, saving on labor costs. AgNO3 and Cu(NO3)2 are also more readily available in developing world markets relative to AgNPs.
The use of AgNO3 during the manufacturing process also eliminates certain health risks for workers manufacturing filters, as some research suggests that inhalation of AgNPs may result in genotoxic effects (Aktepe et al., 2015; Fewtrell et al., 2017). The lower metal concentrations in the effluent indicate better retention of metals in the filters. This would likely increase the filter's effective life span. The use of copper is particularly promising, given its higher safe drinking water standard, and it is less expensive, which means more copper could be used to improve efficacy against viruses while keeping similar costs.
One drawback to note is that since AgNO3 filter production requires the application of silver or copper before pressure and flow testing, if the filter fails to pass one or both tests, that silver or copper will be wasted. Field tests with actual in-home use with real source water are necessary to confirm before switching to the new production method. In the long run, as suggested in Ruparelia et al. (2008), a combination of silver and copper nanoparticles may produce a more complete bactericidal effect against mixed bacterial populations that would be more common in actual use.
Summary
In summary, the use of AgNO3 or Cu(NO3)2 in ceramic water filters shows promising results. Total coliform and E. coli removal was greater for AgNO3 filters (log reductions of 4.06 and 4.11) relative to AgNP filters (log reductions of 3.85 and 3.92). The AgNO3 filters also resulted in lower silver concentrations in the effluent, 12 μg/L versus 2 μg/L from filters produced at the same production facility with the same amount of silver in the filter. Filters made with Cu(NO3)2 were also effective with log total coliform and E. coli removals of 3.33 and 3.54, respectively. Copper effluent concentrations averaged 10 μg/L from filters produced with 10 times as much copper as the AgNP filters produced. This is less than 1% of the drinking water standard for copper, potentially increasing the safety of filter use compared to silver. The new method of silver application or the use of copper could potentially reduce production costs, improve performance, and increase safety of production for workers.
Footnotes
Acknowledgments
This research was supported, in part, by the U.S. National Science Foundation (Award CBET-1438619) and the Fulbright Research Fellows Program of the U.S. State Department. The authors thank N. Ndebele, B. Thangoane, E. Lesmez, C. Kim, and the workers at the two PureMadi production facilities for their help producing filters.
Author Disclosure Statement
No competing financial interests exist.