




Abstract
Abstract
As one of the most important elements in the environment, carbon dictates the transport and fate of hydrophobic organic pollutants. Adsorption is the most common mechanism of organic pollutant attachment to carbonaceous materials, a process that can be illustrated by an adsorption isotherm. In this study, a series of adsorption–desorption experiments have been carried out to investigate the desorption hysteresis and modeling fitting of naphthalene and 1,2-dichlorobenzene with three types of carbonaceous materials, including fullerene C60, activated carbon, and soil organic carbon. Sorption models evaluated include Freundlich, Langmuir, two-compartment dual-equilibrium desorption, and Polanyi–Manes isotherms. Results of model fitting of adsorption–desorption data with each isotherm were compared and discussed. Moreover, the possible mechanism controlling the adsorption process can be deduced according to the Polanyi–Manes model. This is the first report concerning the comparison of model fitting of these four different adsorption isotherms based on experimentally obtained organic pollutant adsorption–desorption data. This reported study can expand our knowledge of sorption and especially desorption characteristics of organic pollutants with different forms of carbonaceous materials.
Introduction
C
The process of organic adsorption to carbonaceous materials is usually described by adsorption isotherm as the amount of adsorbate onto the surface of adsorbent as a function of concentration at constant temperature (Adamson and Gast, 1997; Atkins and de Paula, 2001). The sorption of hydrophobic organic contaminants by carbonaceous materials in soils and sediments is reported to be predominated by partitioning of dissolved solute between water and naturally occurring organic matter (Schwarzenbach et al., 2003). Therefore, linear partitioning models have been used to describe the sorption processes (Stumm and Morgan, 1996; Weber and Digiano, 1996; Sawyer et al., 2002; Schwarzenbach et al., 2003). However, this simple partitioning model has been shown to be inconsistent with the observed sorption behavior. For example, nonlinear sorption isotherms and hysteretic desorption are often observed in laboratory sorption studies (Kan et al., 1994, 1998; Weber and Huang, 1996; Huang et al., 1998). In these cases, the relationship between the adsorbed concentrations and dissolved concentrations of each hydrophobic organic contaminant cannot be described by a single linear isotherm. Therefore, more complicated models of Freundlich isotherm and Langmuir isotherm have been proposed to characterize the adsorption process with additional considerations of surface distribution of adsorption energies and limited adsorption capacities, respectively (Stumm and Morgan, 1996; Adamson and Gast, 1997; Atkins and de Paula, 2001; Sawyer et al., 2002). A major drawback of all of these more complicated adsorption models is that, to date, there is no theory capable of predicting the required constants or exponents. Therefore, each chemical and adsorbent combination must be measured experimentally (Schwarzenbach et al., 2003).
Researchers are also interested in the desorption process of the adsorbed hydrophobic organic pollutants from the adsorbent materials (Fu et al., 1994; Huang et al., 1998; Weber et al., 1998; Chen et al., 1999, 2000). Such process determines the kinetics and thermodynamics of the release of pollutants back into the environment after the adsorption process. Desorption hysteresis is the phenomenon that stems from the deviation of the desorption process from the adsorption process in terms of the shape of the isotherms during these two consecutive processes (Fu et al., 1994; Kan et al., 1994, 1998; Weber and Huang, 1996; Huang et al., 1998; Weber et al., 1998; Chen et al., 1999, 2000). The existence of desorption hysteresis is attributed to the fact that a certain amount of the adsorbed pollutants resists desorption from adsorbent. Adsorption hysteresis has been observed by many researchers on studying adsorption and desorption of various compounds to and from a wide range of adsorbent materials. Particularly, carbonaceous materials, such as ACs, have been extensively investigated concerning the desorption hysteresis with hydrophobic organic pollutants (Fu et al., 1994; Weber et al., 1998; Rathousky and Zukal, 2000; Braida et al., 2003). In light of the presence of desorption hysteresis, additional isotherms have been proposed to account for the irreversibility of desorption of organics from their corresponding adsorption process. Some notable isotherms derived to characterize desorption hysteresis include dual-equilibrium desorption (DED) model (Kan et al., 1998; Chen et al., 2002) and dual reactive domain model (Xing and Pignatello, 1996, 1997; Weber et al., 1998).
In the previous studies, desorption hysteresis was observed for the adsorption and desorption of two common hydrophobic organic pollutants, that is, naphthalene and 1,2-dichlorobenzene (1,2-DCB), with two forms of carbons, that is, C60 and AC (Cheng et al., 2004, 2005b). In one study, the adsorption experiment employed C60 particles in the form of large aggregates, thin film, and small aggregates, as well as AC (Cheng et al., 2004). In another study, organic adsorption experiment was carried out using nano-C60 suspension (Cheng et al., 2005b). As a result, the obtained experimental data cannot be fitted well with a single linear isotherm, as a consequence of desorption hysteresis. In this study, a series of adsorption–desorption experiments were conducted using three different types of carbonaceous materials of AC, C60, and soil organic carbon (OC). The AC and C60 materials were further processed to produce nanomaterial suspensions for adsorption–desorption experiments. The hydrophobic organic compounds used in this study were naphthalene and 1,2-dichlorobenzene, two common organic contaminants. The obtained experimental data were fitted with a number of adsorption isotherms, including Freundlich, Langmuir, two-compartment DED, and Polanyi–Manes isotherms. Model fitting is compared for different models. To the best of our knowledge, this is the first report concerning the comparison of model fitting of aforementioned four different adsorption isotherms based on experimentally obtained organic pollutant adsorption–desorption data. This reported study can expand our knowledge of sorption and especially desorption characteristics of organic pollutants with different forms of carbonaceous materials.
Experimental Protocols
Materials
In this study, three carbon-based adsorbents were employed: AC, fullerene (C60), and Anacostia river sediment (ARS). AC particles were originally purchased from Calgon Carbon Corp. (Pittsburgh, PA). C60 solids (purity >99.5%) were purchased from SES Research (Houston, TX). ARS used in this study was obtained from Anacostia River in Washington D.C. area. The sediment sample was first dried at room temperature followed by pulverization with a pestle and mortar. The soil OC content of the ARS was measured to be ca. 3.7% (Shimadazu Corp.).
14C-radiolabeled naphthalene and 14C-radiolabeled 1,2-DCB were purchased from Sigma-Aldrich (St. Louis, MO) and diluted in methanol (high performance liquid chromatography grade) to make stock solutions. The specific activities of naphthalene and 1,2-DCB are 8.1 and 8.6 μCi/μmol, respectively. Liquid scintillation cocktail for scintillation counting was supplied by Beckman Coulter, Inc. (Fullerton, CA). Biological grade sodium chloride and sodium azide (>98%) were purchased from Fisher Scientific and Eastman Kodak, respectively. Sodium azide (0.02 M) was used to inhibit bacterial growth. Anodisc membrane filters (20 nm pore size; Whatman) were used to separate nanoscaled C60 and nanoscaled AC particles from aqueous solution. The 20 nm membrane filter has a precise pore structure with no lateral crossovers between individual pores, allowing a sharp molecular weight cutoff. Deionized (DI) water was prepared by reverse osmosis followed by a four-stage ion exchange water purification process, consisting of a high-capacity cation/anion column, two ultra pure ion exchange columns, and an organics removal column (Barnstead Internationals, Dubuque, IA).
Adsorption and desorption experiments using AC
As-received AC particles
To study naphthalene adsorption and desorption with as-received AC particles, five sample vials were used, each filled with 40 mg of AC and 42 mL of DI water. 14C-radiolabeled naphthalene/methanol stock solution was injected into each sample vial with a microsyringe so that the initial naphthalene concentrations in the vials were 0.97, 1.94, 2.93, 4.86, and 9.55 μg/mL, respectively. The headspace in each vial was less than 0.1 mL. The advantage of injecting a naphthalene/methanol solution into DI water is to facilitate a uniform distribution of naphthalene into aqueous solution. Solution phase methanol volume fraction in each vial was less than 0.5%, which was not expected to materially impact the adsorption experiment. Another five control vials were set up the same way as the sample vials, except that no AC particle was added. Control vials were designed to account for the loss of naphthalene from the aqueous phase due to volatilization or adsorption to the vessels. The samples were then stirred mildly on magnetic stirrers for at least 3 days for the adsorption equilibrium in the dark at room temperature (25 ± 1°C). At the end of the adsorption experiment, samples were centrifuged at 6,000 rpm on a centrifuge and the supernatants were analyzed on a liquid scintillation counter (Beckman Coulter, Inc.) to determine the aqueous naphthalene concentrations. The scintillation counter detection limit for naphthalene is ca. 1.4 × 10⁻⁴ μg/mL. Over 95% of the supernatants were then removed from each sample vial. Subsequently, naphthalene-free DI water was filled into each vial (headspace <0.1 mL) to induce the first step of desorption. Multistep desorption experiments were induced in a similar manner by successively removing supernatants and refilling with DI water. At the end of each desorption step, solution-phase naphthalene concentrations were analyzed on the liquid scintillation counter. The equilibrium time for each desorption step varied from 3 days for the first desorption step to 14 days for the last desorption step. The control experiments suggest that about 7.5% of naphthalene was adsorbed onto the 20 nm membrane filters. Thus, the experimentally obtained sorption data were corrected for adsorption of organics to the 20 nm membrane filter.
Nano-AC particles
In the laboratory, the purchased AC particles were first added into DI water to a concentration of about 0.5 mg/mL, and the suspension was then subjected to sonication for about 1 – 2 h with a high-energy sonication probe (Sonifier Cell Disruptor; Heat Systems-Ultrosonics, Inc., Farmingdale, NY). A portion of the AC particles was broken into nanometer-sized particles after a prolonged sonication process. The resulting suspension was filtered through a 0.45 μm pore size membrane filter (Millipore Corp.). The nanometer-sized AC particles in the filtrate were used as adsorbent for sorption of naphthalene and are referred to as nano-AC particles. The concentration of the obtained nano-AC particles in water was measured by total organic carbon analyzer to be 12.35 mg/L.
Water suspensions containing ca. 0.2 mg of nano-AC particles were added into each of four 16 mL glass vials. 14C-radiolabeled naphthalene/methanol stock solutions were injected into each vial to make the initial naphthalene concentrations to be 0.45, 1.40, 1.87, and 2.36 μg/mL, respectively. Sample vials were closed tightly with a headspace of less than 0.1 mL. Methanol volume fraction in each vial was less than 0.2%, which was not expected to materially impact the adsorption experiment. Another four control vials were set up the same way as the sample vials, except that no nano-AC particle was added. Sample vials and control vials were stirred mildly on magnetic stirrers in the dark at room temperature (25 ± 1°C) for at least 3 days. At the end of the adsorption experiment, the suspension in each sample vial was filtered using the 20 nm membrane filter. One milliliter of filtrate was analyzed on the liquid scintillation counter to determine naphthalene aqueous concentration. About 1 mL of the solution in each control vial was also analyzed for aqueous-phase naphthalene concentrations by the liquid scintillation counter. The solid-phase naphthalene concentration in each sample vial was calculated from the difference between the solution-phase naphthalene concentration in the sample vial and that in the corresponding control vial. Another two sample vials, containing 0.1 mg of nano-AC particles in 8 mL water and 0.2 mg of nano-AC particles in 16 mL water, respectively, were set up the same way as that of the prior four samples. The initial naphthalene concentrations are 10.02 and 9.15 μg/mL, respectively. Upon completion of the adsorption, the suspension in each sample vial was filtered and the filtrates were analyzed for naphthalene aqueous concentrations, as discussed above. After filtration, the membrane filters containing AC solids were put into clean sample vials and naphthalene-free DI water was added into each of the clean vials to induce desorption for these two samples. The vials were then sealed tightly and put into a sonication bath (Solid State/Ultrasonic; Fisher Scientific) for 15 min to redisperse nano-AC particles into aqueous phase. Membrane filters were then removed carefully from the sample vials. Next, DI water was added to each sample vial (with headspace <0.1 mL) and samples were stirred in the dark at room temperature for 5 days for naphthalene desorption. At the end, the suspension in each sample vial was filtered with a 20 nm membrane filter and the aqueous-phase naphthalene concentration was determined by the liquid scintillation counter. Three steps of naphthalene desorption were conducted for each of the two samples. The retention of naphthalene to the 20 nm filter was accounted for by comparing the organic solution concentrations after being filtered through the filter with the stock solution concentrations. By the end of the desorption experiments, the values of the removal of naphthalene from the surface of nano-AC particles were ca. 63% and 50%, respectively, for the two desorption samples.
Adsorption and desorption experiments using C60
The preparation of nanoscaled C60 particles (hereafter referred to as nano-C60, or nC60) follows the sonication method, similar to the previous study (Cheng et al., 2005b). Essentially, a volume of C60/toluene/DI water mixture was subjected to 4 h of continuous sonication by the use of a high-energy sonication probe, similar to the preparation of nano-AC particles. The resultant solution was in a yellowish color with the purple toluene layer evaporated. Subsequently, the nC60 solution was produced by filtering the yellowish solution through a 0.45 μm membrane filter to remove large aggregates. The procedure of the nC60 adsorption/desorption experiments with naphthalene and 1,2-DCB is detailed in Cheng et al. (2005b). Similar to naphthalene adsorption/desorption experiments with nano-AC particles, aliquots of 14C-radiolabeled naphthalene or 14C-radiolabeled 1,2-DCB were added to vials containing nC60 solutions. Subsequently, adsorption and three-step desorption were conducted for each sample in the dark at room temperature (25 ± 1°C). The initial naphthalene concentrations were 1.10, 1.97, 2.20, 2.51, 3.30, 4.26, and 5.11 μg/mL, respectively. The initial 1,2-DCB concentrations were 0.89, 4.65, and 8.23 μg/mL, respectively. By the end of each adsorption experiment, nC60 particles were separated from the solution using a 20 nm filter. Similar to the nano-AC experiments, control vials were employed to account for organic volatilization or adsorption to the vessels. The control experiments suggest that about 7.0% of 1,2-DCB was adsorbed onto the 20 nm membrane filters. Thus, the experimentally obtained sorption data were corrected for adsorption of organics to the 20 nm membrane filter. Moreover, the scintillation counter detection limit for 1,2-DCB is ca. 1.2 × 10⁻⁴ μg/mL.
Adsorption and desorption experiments using ARS
Similar to the aforementioned experiments using as-received AC particles, adsorption and desorption experiments were carried out using dried ARS powder. Two grams of dried ARS powder was added to a 40 mL glass vial and the vial was filled with 0.01 M NaCl and 0.01 M NaN3 electrolyte solution (headspace <0.1 mL). 14C-radiolabeled naphthalene/methanol stock solution was injected into the vial to an initial concentration of 8.69 μg/mL. The sample was stirred mildly in the dark at room temperature (25 ± 1°C) for at least 3 days for adsorption. At the end of the adsorption experiment, the sample was centrifuged at 6,000 rpm on a centrifuge and the supernatant was analyzed on the liquid scintillation counter to determine the aqueous-phase naphthalene concentration. Over 95% of the supernatant was removed from the sample vial and naphthalene-free DI water was filled (headspace <0.1 mL) to induce multistep desorption. At the end of each desorption step, the sample was centrifuged and the aqueous-phase naphthalene concentration was analyzed on the liquid scintillation counter. The equilibrium time for each desorption step varied from 3 days for the first desorption step to 7 days for the last desorption step.
Sorption models
Freundlich sorption model
Freundlich model (isotherm) is an empirical relationship that is commonly used to fit experimental adsorption data with a minimum of adjustable parameters (Adamson and Gast, 1997; Atkins and de Paula, 2001; Schwarzenbach et al., 2003). It generally takes the following form:
where KF [(μg/g) (μg/mL)−n] is the Freundlich sorption coefficient; n denotes the Freundlich exponent; and Cw (μg/mL) represents the adsorbate concentration in aqueous solution at equilibrium. The term q (μg/g) is the mass of adsorbed adsorbate per unit mass of adsorbent at equilibrium. The Freundlich model assumes a distribution of adsorption energies on the surface of adsorbent particles (Weber and Digiano, 1996; Adamson and Gast, 1997).
Langmuir sorption model
Langmuir model (isotherm) was originally applied to the adsorption of gases or vapors on a plane surface that contains a fixed number of identical active sites (Adamson and Gast, 1997; Atkins and de Paula, 2001; Schwarzenbach et al., 2003). The amount of the adsorbate increases monotonically until it reaches a limiting value that corresponds theoretically to the completion of a surface monolayer. In aqueous solutions, Langmuir model can be mathematically expressed as follows:
where b (mL/μg) is the Langmuir constant, qm (μg/g) is the limiting (monolayer) adsorption capacity (the amount of the adsorbed adsorbate per unit mass of the adsorbent at the time when the adsorbent surface is covered with a complete monolayer of the adsorbate), and q (μg/g) and Cw (μg/mL) are defined as above.
Combined sorption model: DED model
A combination of two types of models has been proposed by a number of researchers to account for the observed sorption behavior (Kan et al., 1994, 1998; Xing and Pignatello, 1996, 1997; Chen et al., 2002). Kan et al. (1998) have proposed a “dual-equilibrium desorption” model (isotherm) to describe sorption–desorption hysteresis observed experimentally. The sorption of hydrophobic organic compounds to soils or sediments can be illustrated by two compartments with different equilibrium and kinetic characteristics. The first compartment characterizes mainly the adsorption and desorption at high initial concentrations. The second compartment accounts for the adsorption and desorption at lower concentration ranges. According to this model, adsorption/desorption of organic contaminants to/from adsorbents can be described by the following isotherm (Kan et al., 1998):
where
where
Polanyi–Manes sorption model
The Polanyi adsorption potential theory (Polanyi, 1916; Adamson and Gast, 1997; Atkins and de Paula, 2001) has been considered the most powerful model (isotherm) in describing gas (or vapor) adsorption on energetically heterogeneous solids. Polanyi theory defines the existence of an (attractive) adsorption potential between the adsorbate molecule and the solid surface. At a particular location within the adsorption space, the adsorption potential may be viewed as the energy required to remove the molecule from that location to a point outside the attractive force field of the solid. According to the Polanyi theory, the following relationship holds for ideal gas (vapor) adsorption to porous adsorbents:
where ɛ (J/mol) represents the adsorption potential; Pg (Pa) is the vapor pressure in equilibrium with the adsorbed phase; P0 (Pa) is the saturation vapor pressure; R [J/(mol·K)] is the ideal gas constant; and T (K) is the absolute temperature. The original Polanyi model has been extended to a wide range of vapor-phase and liquid-phase systems by Manes (1998) and the effective adsorption potential can be defined as follows:
where S (μg/mL) is the solubility of the adsorbate, and C (μg/mL) is the aqueous concentration of the adsorbate. The following empirically derived relationship between adsorbed volume and adsorption potential was proposed for sorption on ACs (Crittenden et al., 1987; Xia and Ball, 1999):
where ɛ (J/mol) is the net adsorption potential of the adsorbate in aqueous solution; Q0′ (cm3/kg) is the maximum adsorption capacity; ρ (kg/cm3) is the liquid or solid density; a′ and b′ are fitting parameters; and Vs (cm3/mol) is the molar volume of the solute. Dubinin (1960) suggested that for a given adsorbent, a plot of the adsorbed volume (q′) against adsorption potential density (ɛ/Vs) would yield similar curves for a wide range of adsorbate chemicals and these curves were called “correlation curves.” The detailed descriptions of the DED and Polanyi–Manes sorption models can be found in the Supplementary Data.
Results and Discussion
Adsorption and desorption experimental results
The mean particle size of the as-received AC particles was reported to be about 1 μm by the supplier. Data of naphthalene adsorption to the AC particles are fitted with a Freundlich isotherm (Fig. 1) in the form of
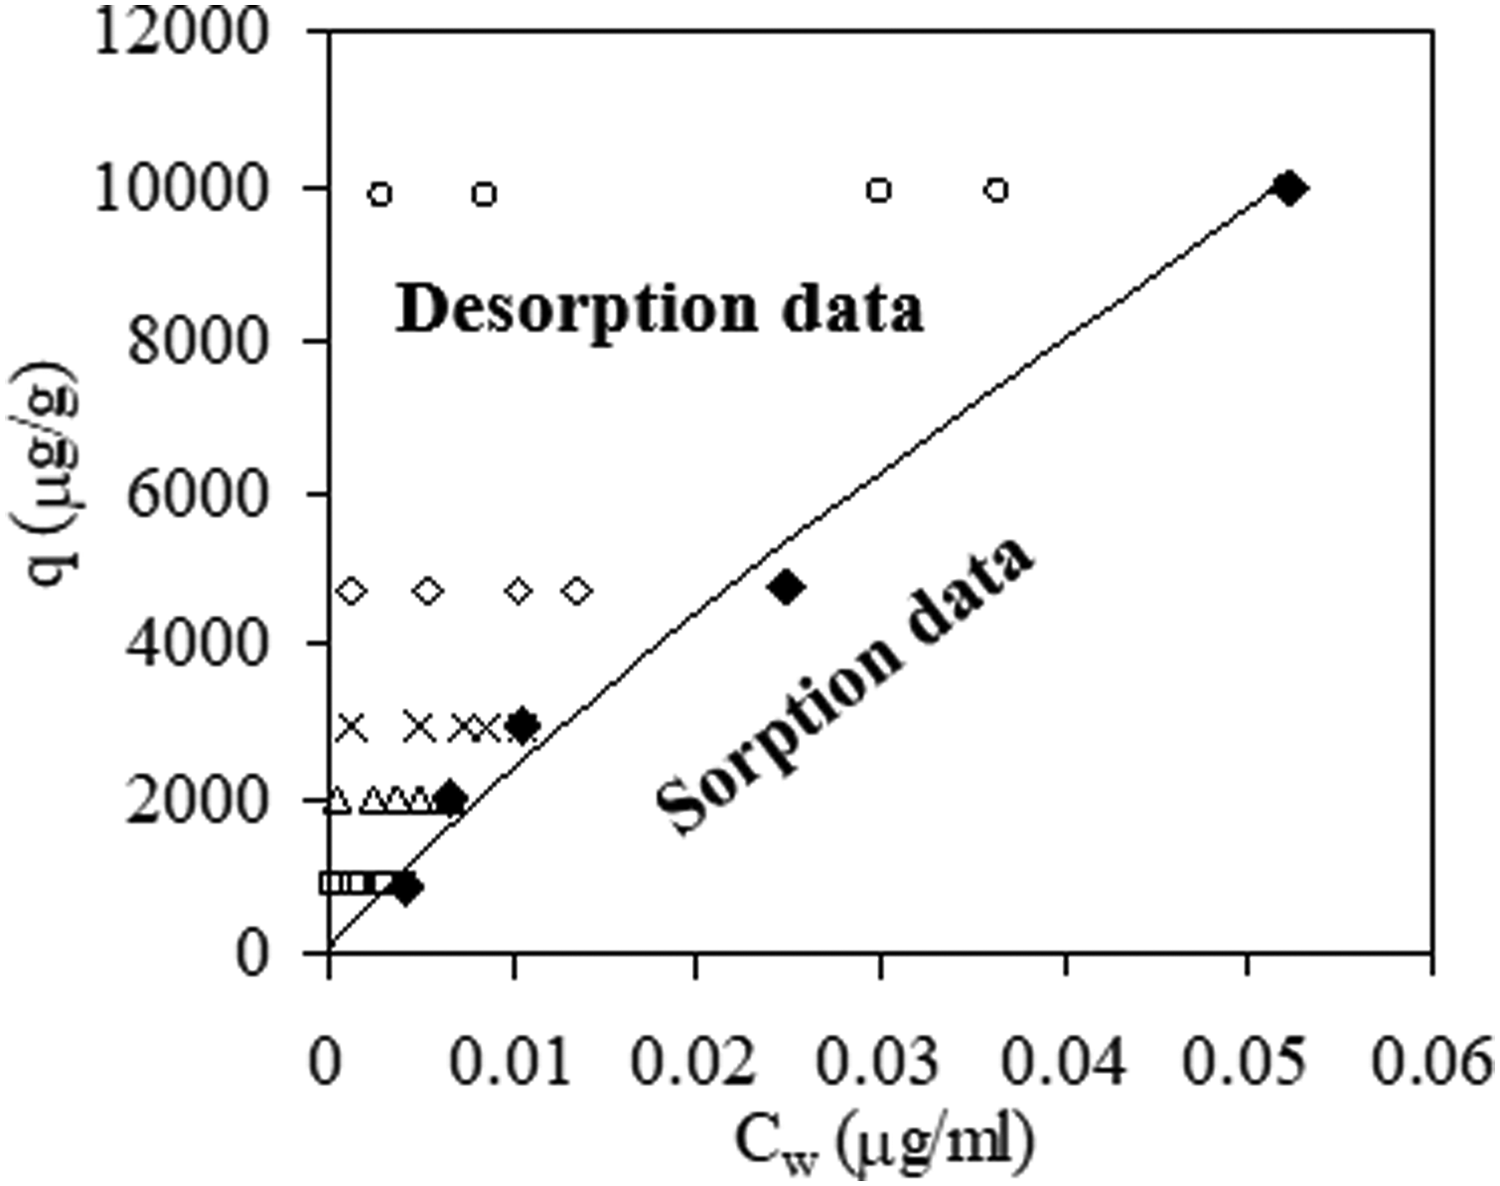
Adsorption and desorption of naphthalene to and from “as-received activated carbon” particles (five samples). ♦, adsorption data for five samples; □, Δ, × , ⋄, and o represent four steps of desorption data for each of the five samples.
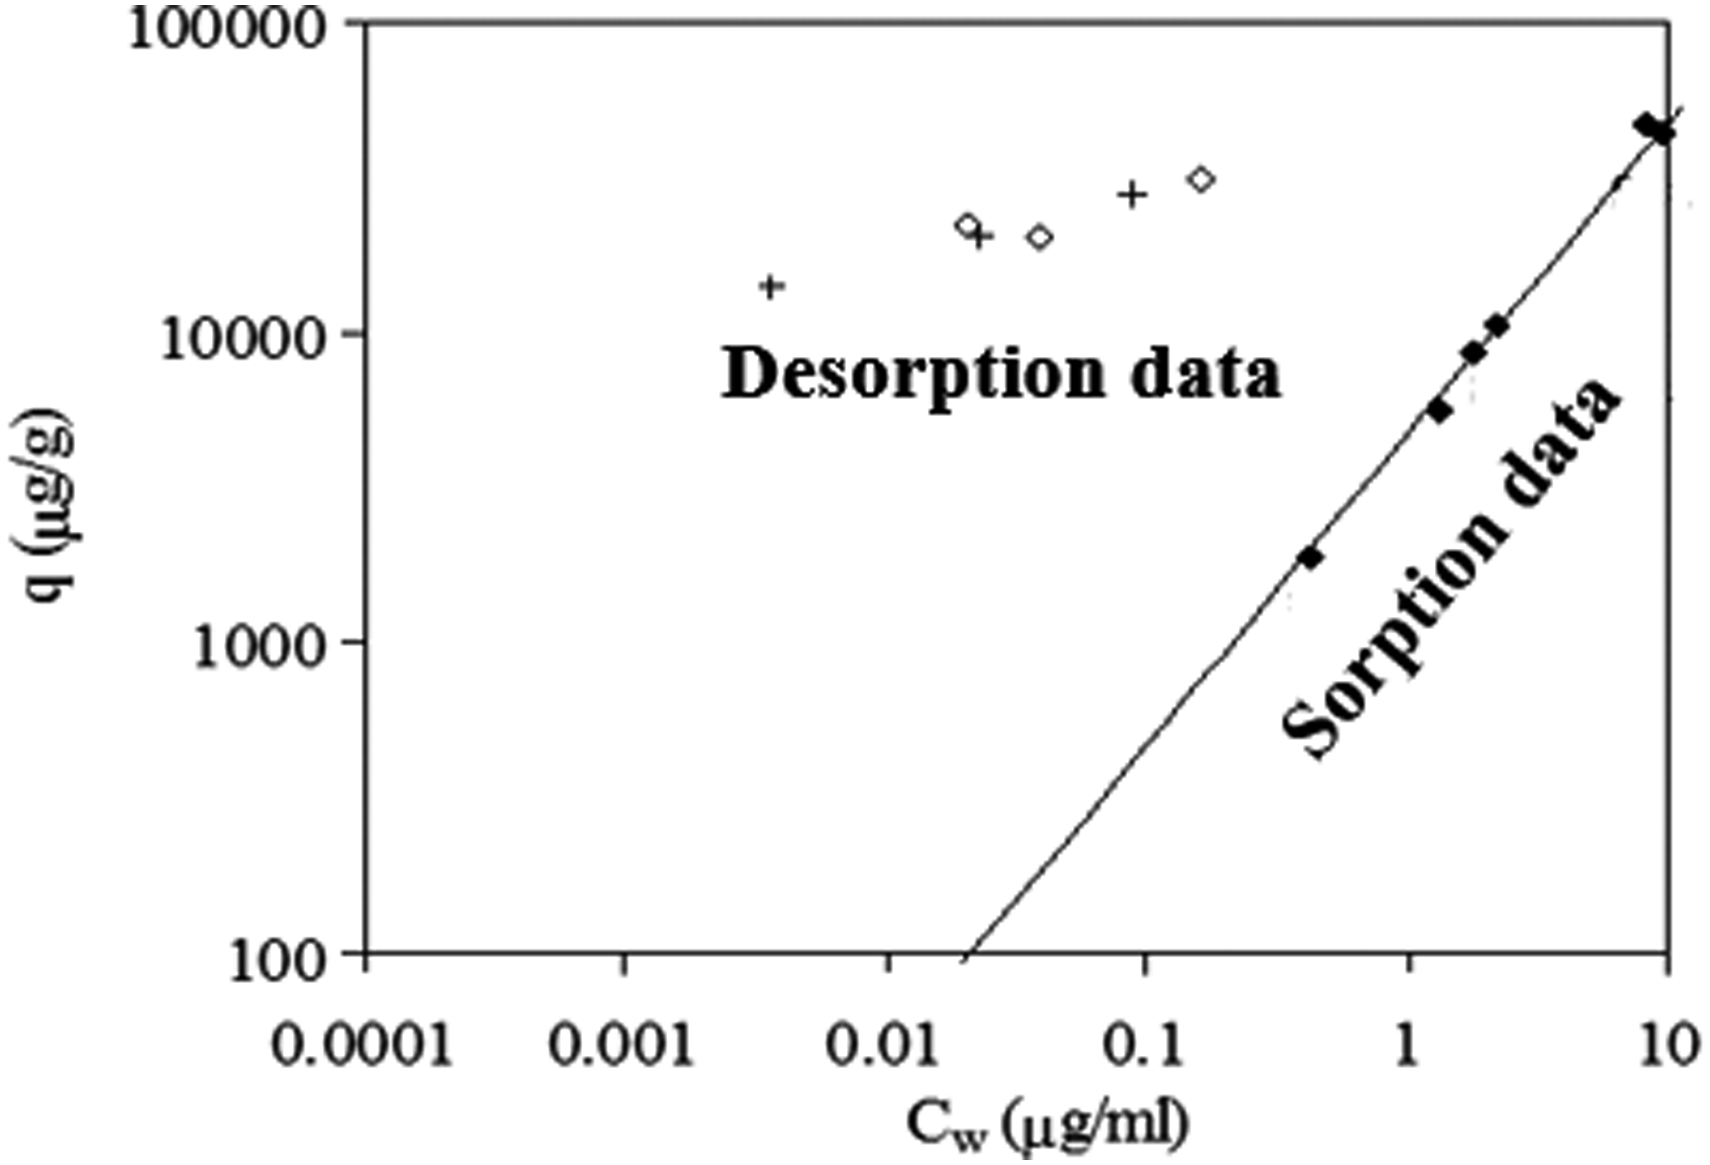
Adsorption and desorption of naphthalene to and from nano-AC particles. ♦, adsorption data; +, desorption data for the first desorption sample; ⋄, desorption data for the second desorption sample. AC, activated carbon.
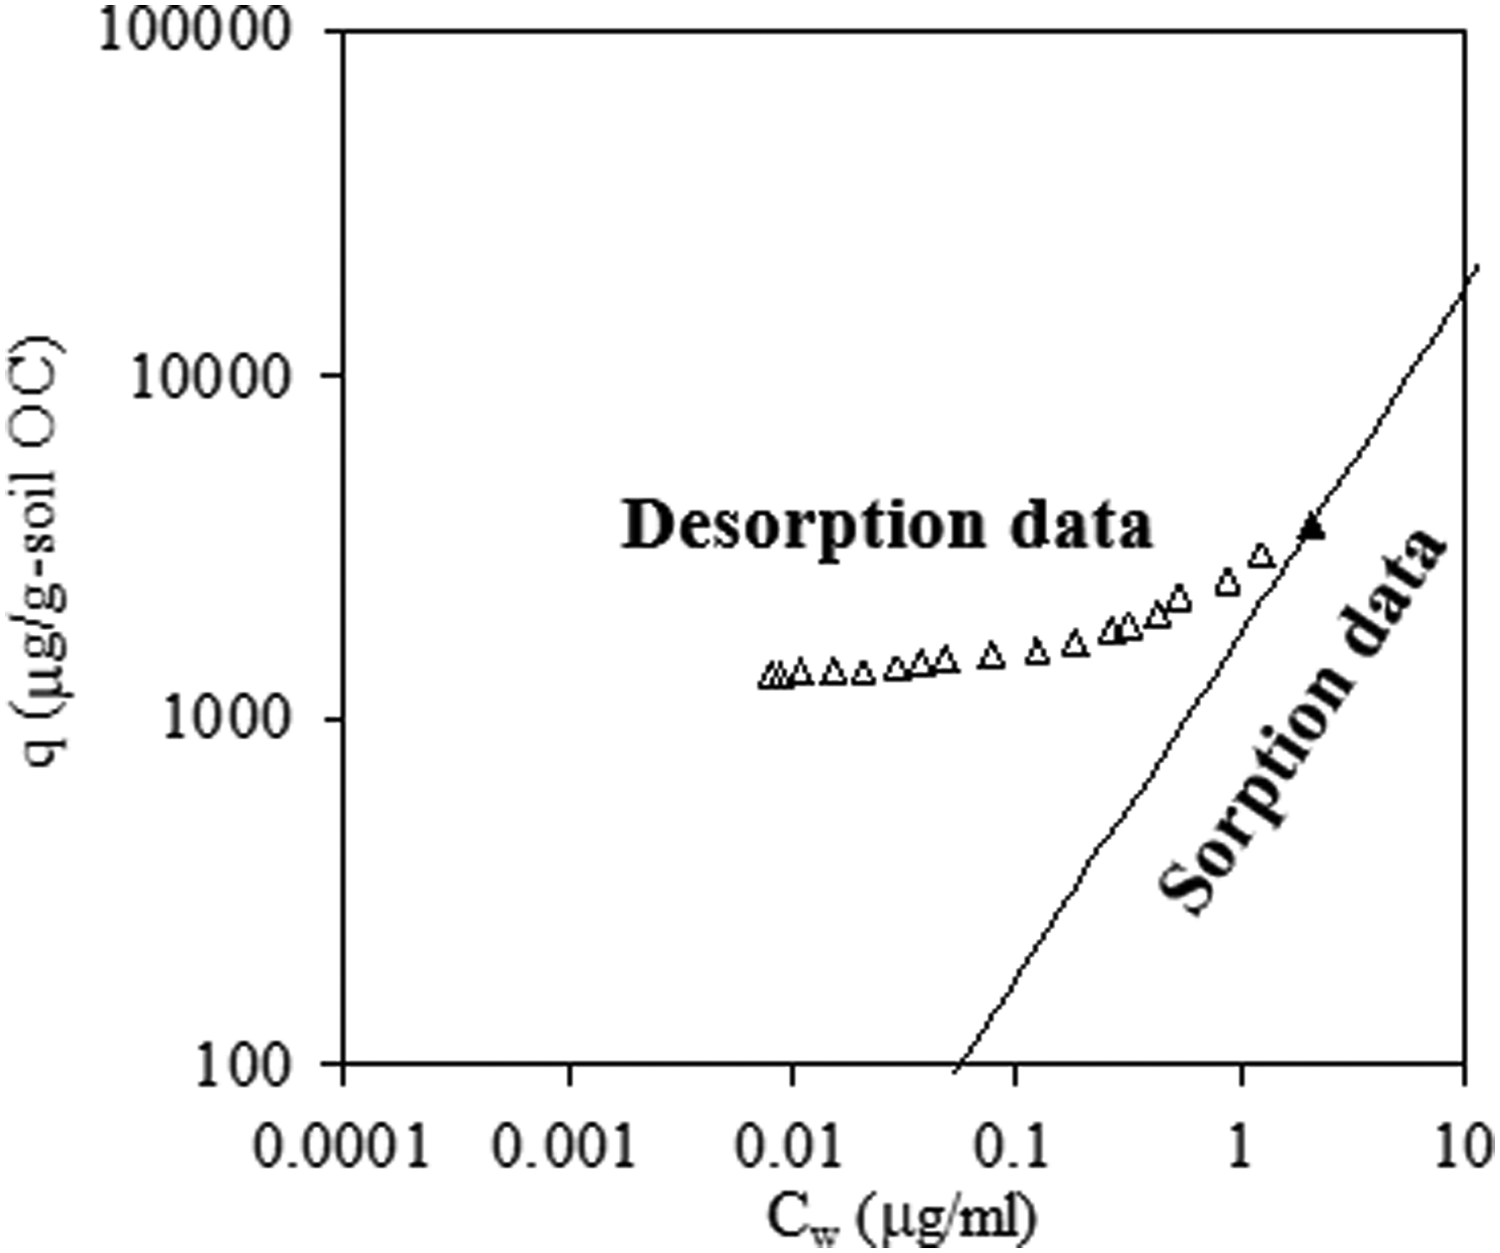
Adsorption and desorption of naphthalene to and from Anacostia sediment. ▴, adsorption data; Δ, successive desorption data.
Model fitting for experimental data
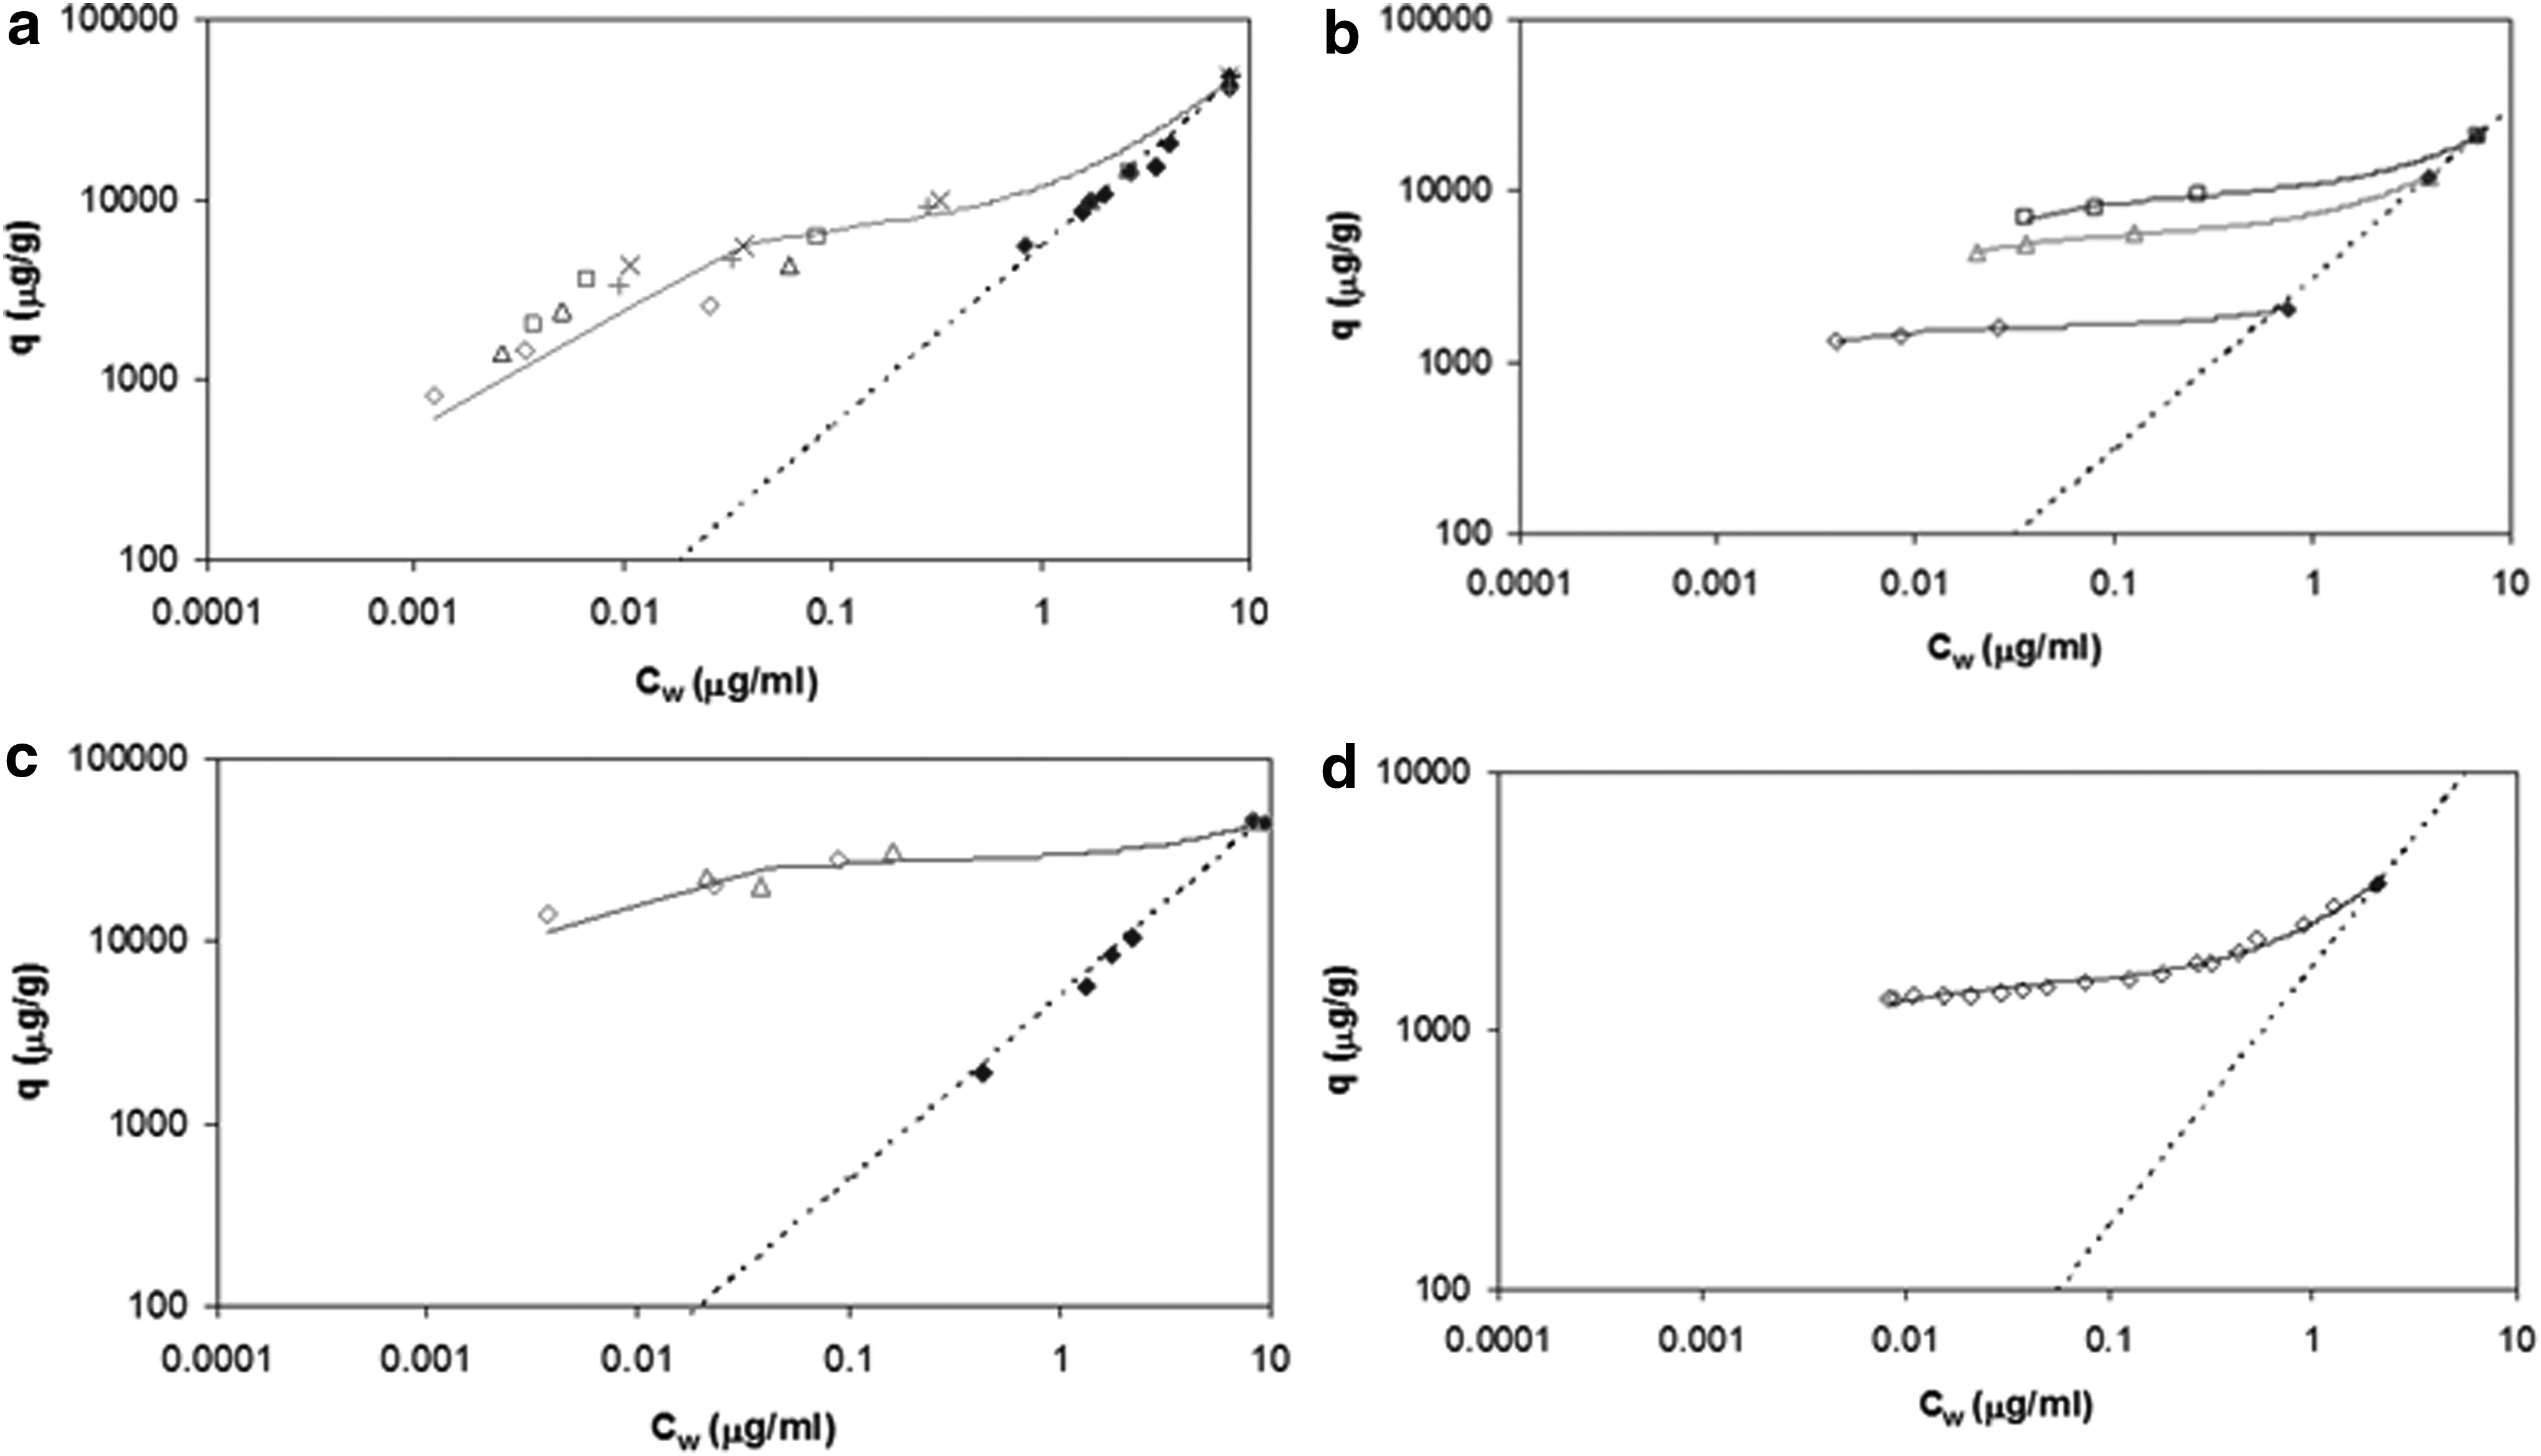
Experimental data of sorption and desorption of naphthalene and 1,2-DCB with nC60, naphthalene with AC, and naphthalene with soil OC in ARS are fitted with the above described four sorption models and are shown in Figs. 4–7: Freundlich model (Fig. 4), Langmuir model (Fig. 5), DED model (Fig. 6), and Polanyi–Manes model (Fig. 7). Values of model predicted parameters were determined using the software of SigmaPlot and are listed in Table 1 with the R2 values for each model fit. The linear isotherms (dashed lines in Figs. 4–7) for the adsorption of naphthalene to nC60, 1,2-DCB to nC60, naphthalene to nano-AC particles, and naphthalene to soil OC are q (μg/g) = 103.74Cw (μg/mL), q (μg/g) = 103.48Cw (μg/mL), q (μg/g) = 103.70Cw (μg/mL), and q (μg/g) = 103.25Cw (μg/mL), respectively. As can be seen from Figs. 4 to 7 that, for the three forms of carbon tested in this study (nC60, AC, and soil OC), the linear isotherms fail to predict the desorption data. This is because the adsorbed adsorbate concentration for each desorption datum point is one to two orders of magnitude higher than that predicted from the reversible linear isotherm, indicating the occurrence of sorption hysteresis. This means that the simple linear isotherm may not be appropriate to predict the observed sorption/desorption behavior. By comparing the R2 values obtained from different model fits and the model fitting curves in Figs. 4–7, it can be argued that the Polanyi–Manes model fits most desirably with the experimental data (Fig. 7). On the other hand, the overall data are not well described by the Langmuir model, indicated by the low R2 values and the deviation of experimental data from model predicted values illustrated in Fig. 5. The poor performance of Langmuir model is probably due to the failure of this model to predict the high sorption affinity of all three forms of carbon at low aqueous adsorbate concentration ranges.
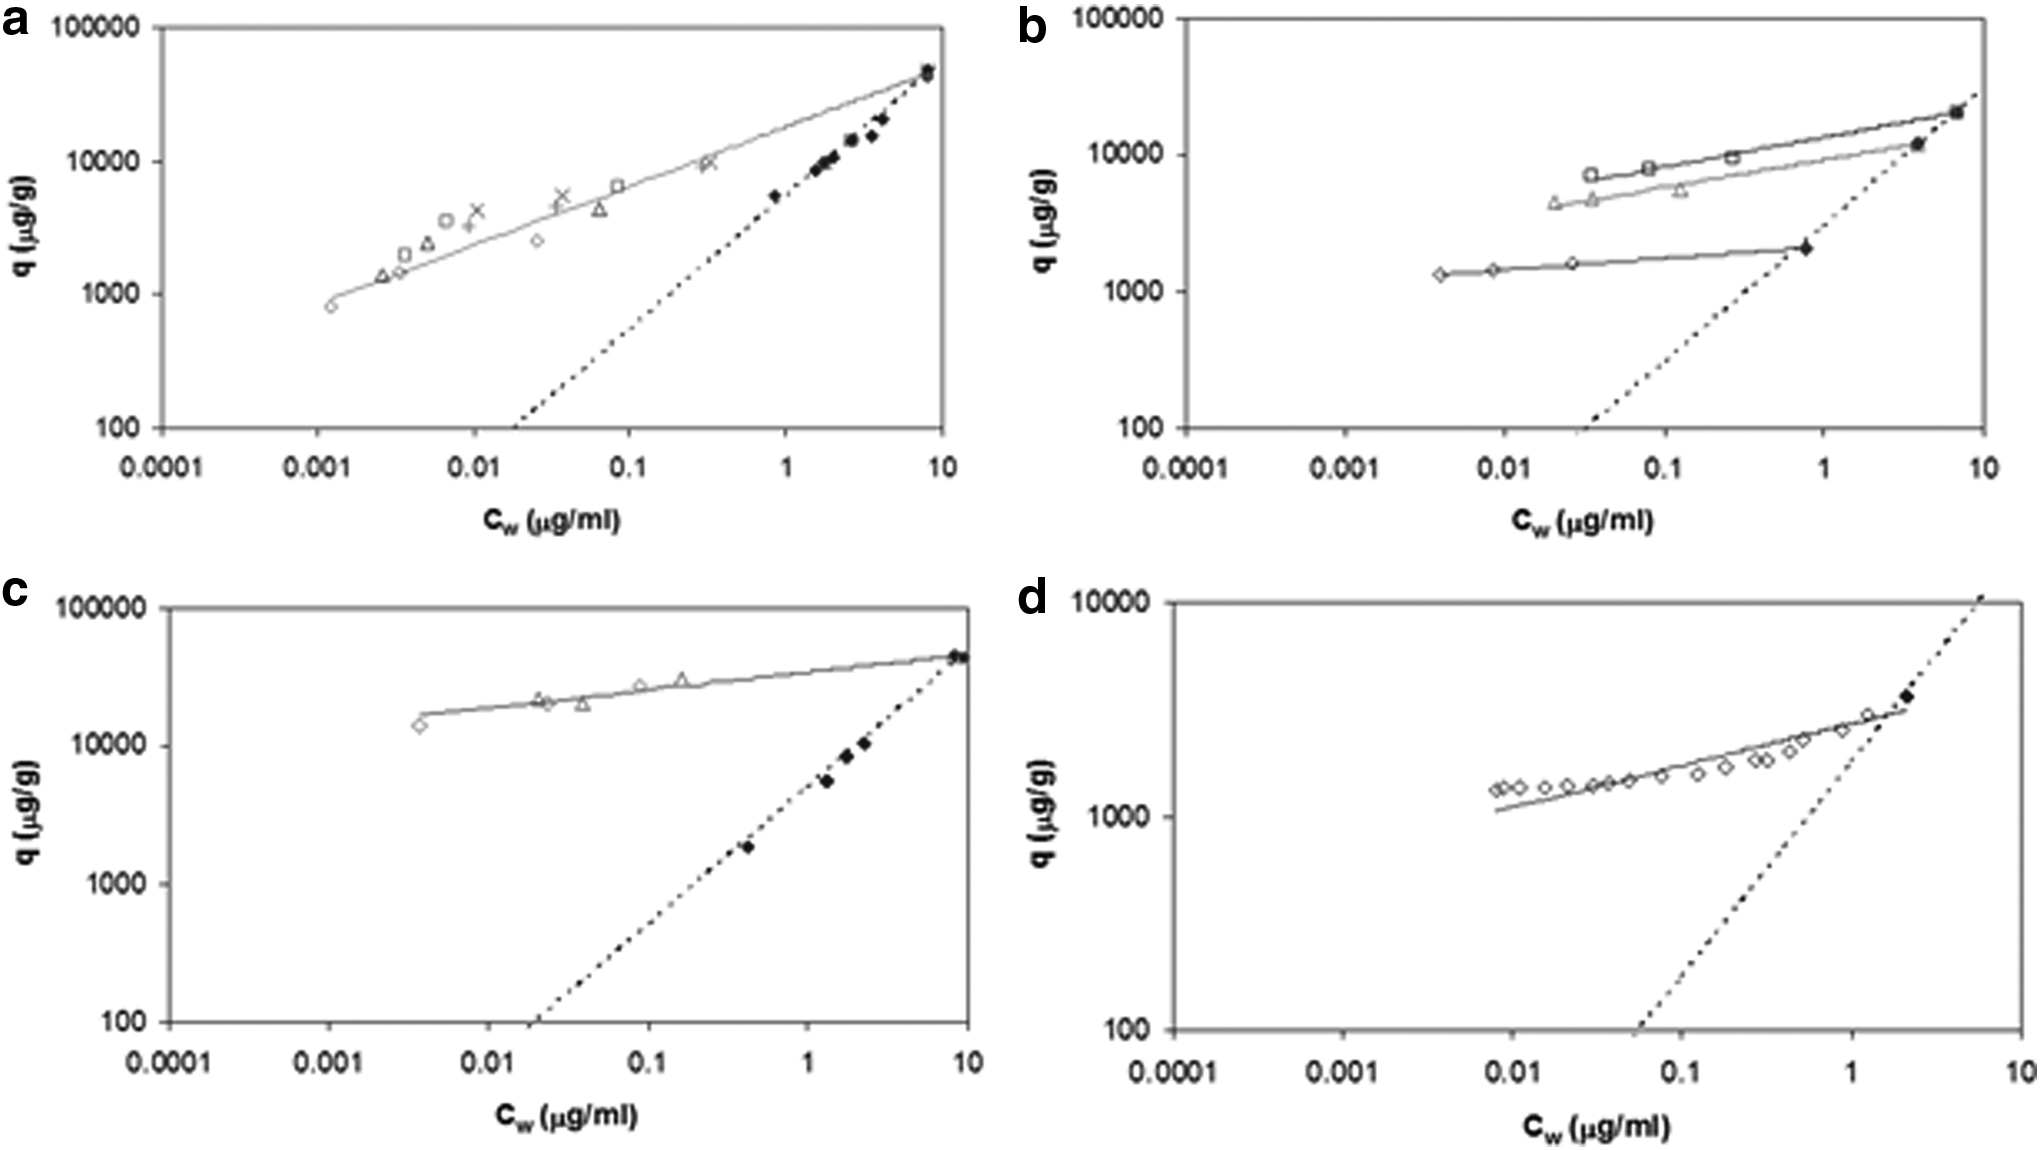
Freundlich model data fitting. Adsorption and desorption of

Langmuir model data fitting. Adsorption and desorption of
DED model data fitting. Adsorption and desorption of

Polanyi–Manes model data fitting. Adsorption and desorption of
1,2-DCB, 1,2-dichlorobenzene; AC, activated carbon; ARS, Anacostia river sediment; DED, dual-equilibrium desorption.
In Fig. 6, adsorption and desorption data of naphthalene with nC60, nano-AC particles, and soil OC, and 1,2-DCB with nC60 were fitted with the DED model. This model describes the sorption of organic compounds as the combination of two different processes. Sorption of the compound to the labile compartment obeys linear isotherm and desorbs reversibly, while sorption to the resistant compartment tends to be stronger and desorption hysteresis was normally observed due to the irreversible change of the pore structure of the adsorbent and/or the entrapment of adsorbate molecules in the adsorbent (Kan et al., 1998; Lu and Pignatello, 2002; Braida et al., 2003). As is shown in Fig. 6, this model can predict the overall sorption data satisfactorily with reasonably high R2 values. As is listed in Table 1, the range of the
Model fits of experimental sorption/desorption data with the Polanyi–Manes sorption model [Eq. (7)] are illustrated in Fig. 7. In the model fitting calculation, the molar volume (Vs) values for naphthalene and 1,2-DCB were estimated as the ratio of the molecular weight and the density of the chemical in its pure form (Farrell and Reinhard, 1994). Parameters of a′, b′, and Q0′ are obtained from model fitting and listed in Table 1. By comparing the R2 values obtained from this model to those of other models, it shows that the Polanyi–Manes model is the best to describe experimental nC60 and AC sorption data. As discussed above, the sorption isotherm of adsorbed volume per unit mass of adsorbent versus the adsorption potential density (“correlation curve”) is expected to fall on a single line for all liquid adsorbates studied, if there are no specific interactions between adsorbate and the adsorbent surface (Manes, 1998; Xia and Ball, 1999). This is mostly the case for sorption of nonpolar organic adsorbates in aqueous solutions (Manes and Wohleber, 1971). Therefore, the maximum volume of nonpolar hydrocarbons on the surfaces of carbon is commonly calculated to be the same for all liquids investigated (Xia and Ball, 1999). The adsorbed volume per unit mass of nC60 (q′, cm3 10−3 kg) versus the adsorption potential density (ɛ/Vs, J/cm) is plotted for the adsorption and desorption of naphthalene and 1,2-DCB with nC60 in Fig. 8. The obtained parameters of a′, b′, and Q0′ are also listed in Table 1. Data can be fitted with one single characteristic curve reasonably well with an R2 value of 0.987. The desirable fitting of experimental data with Polanyi–Manes sorption model, as illustrated in Figs. 7a–d and 8, probably provides some evidence for the mechanism underlying the sorption of hydrophobic organic compounds to nC60 particles. It can be proposed that the sorption uptake of naphthalene and 1,2-DCB by nC60 may be the result of adsorbate condensation into intraparticle micropores in nC60, as depicted in Fig. 9. This proposed mechanism may also explain the observed sorption hysteresis since “capillary condensation” has long been believed to be one important cause for hysteretic sorption (Adamson and Gast, 1997). Note that, according to classical aquatic chemistry definitions, adsorption refers to a surface sorption phenomenon, while absorption corresponds to a bulk (volume) sorption phenomenon (Stumm and Morgan, 1996). In light of the fact that the entrapped organic molecules in the micropores were retained by the exterior surfaces of the micropores, it is thus more appropriate to designate the observed sorption phenomenon in this study as “adsorption” to emphasize the surface sorption characteristics. In addition, considering the sorption/desorption with soil OC data, the fit of Polanyi–Manes model underperforms the DED model, judged by the R2 values. This is probably because soil OC is composed of both normal OC and high sorption affinity carbon, such as black carbons, leading to a more desirable data fitting with the two-compartment DED model. Moreover, it is noted that the Freundlich model fits experimental data of naphthalene and 1,2-DCB adsorption to nC60 pretty well. This is not surprising since sorption sites on nC60 particles are not expected to be homogeneous and the Freundlich model is most suitable for the scenario with multiple types of sites on the heterogeneous adsorbent surface (Weber and Digiano, 1996; Chiou, 2002; Schwarzenbach et al., 2003).
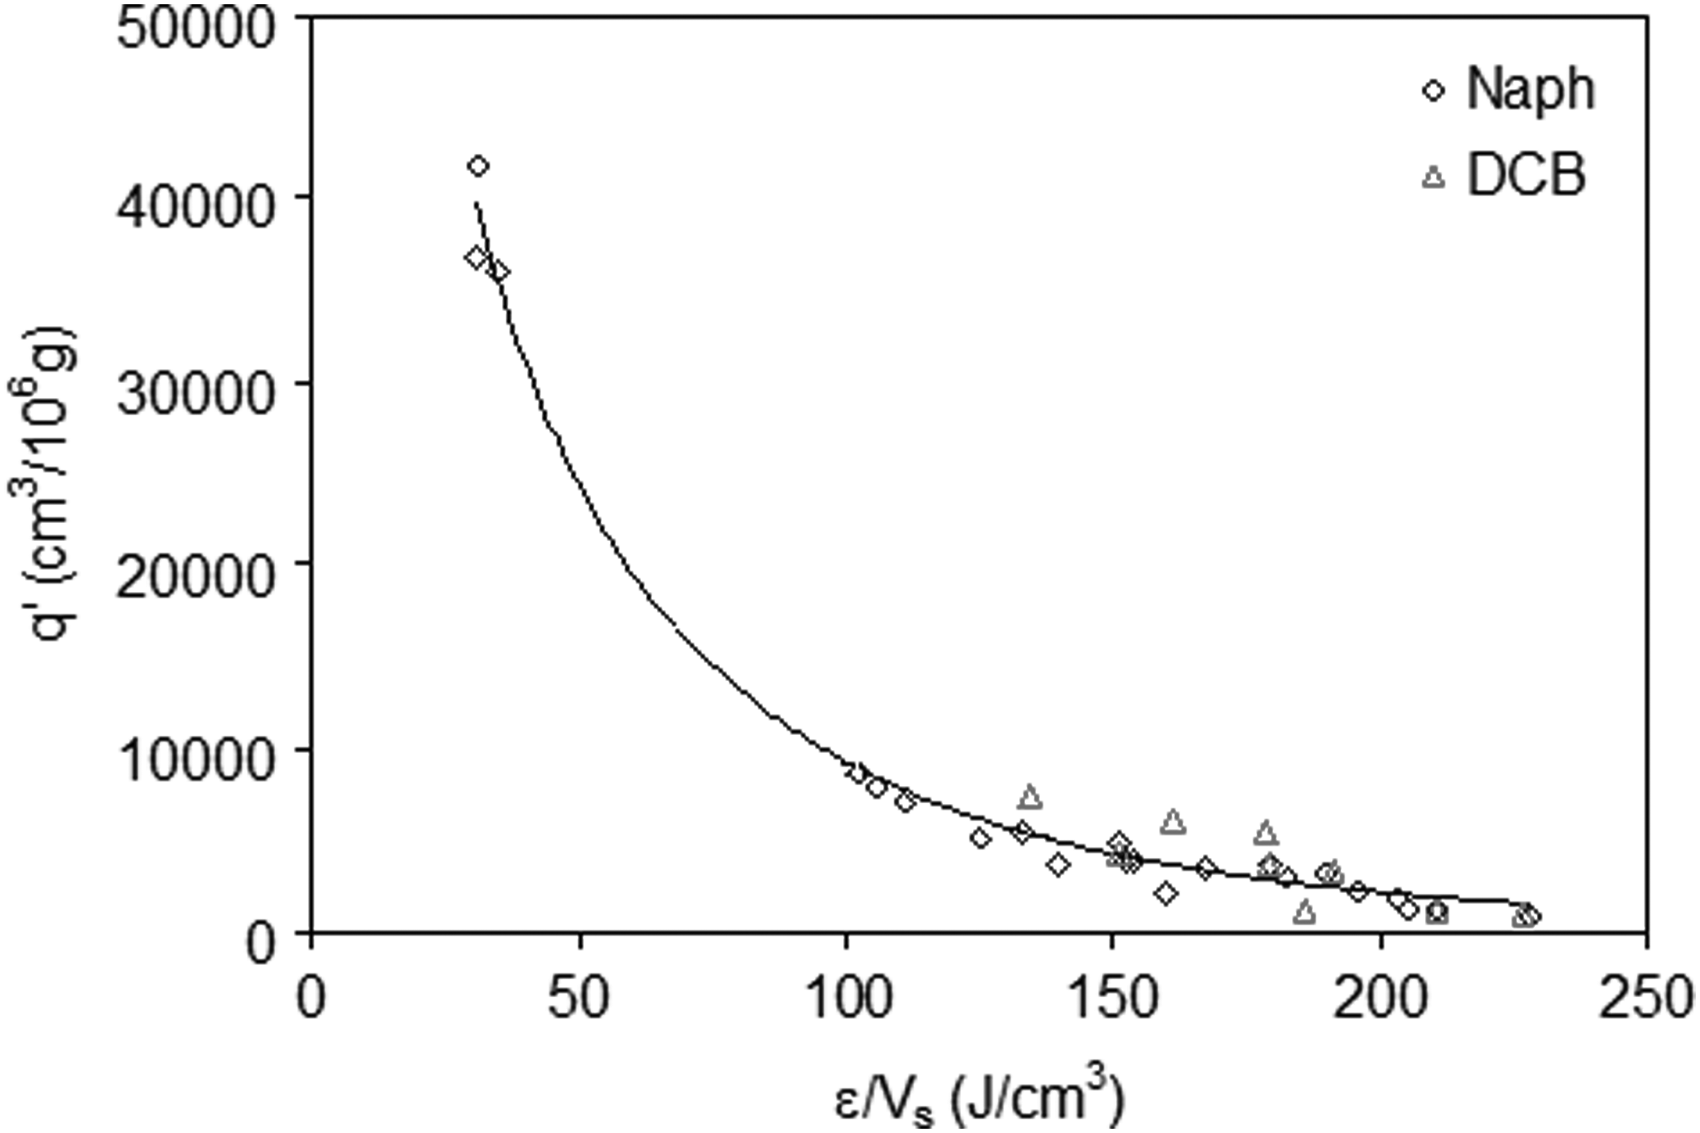
Polanyi–Manes sorption isotherm for naphthalene and 1,2-dichlorobenzene desorption from nC60. Data are plotted as adsorbed volume (q′) versus adsorption potential density (ɛ/Vs).
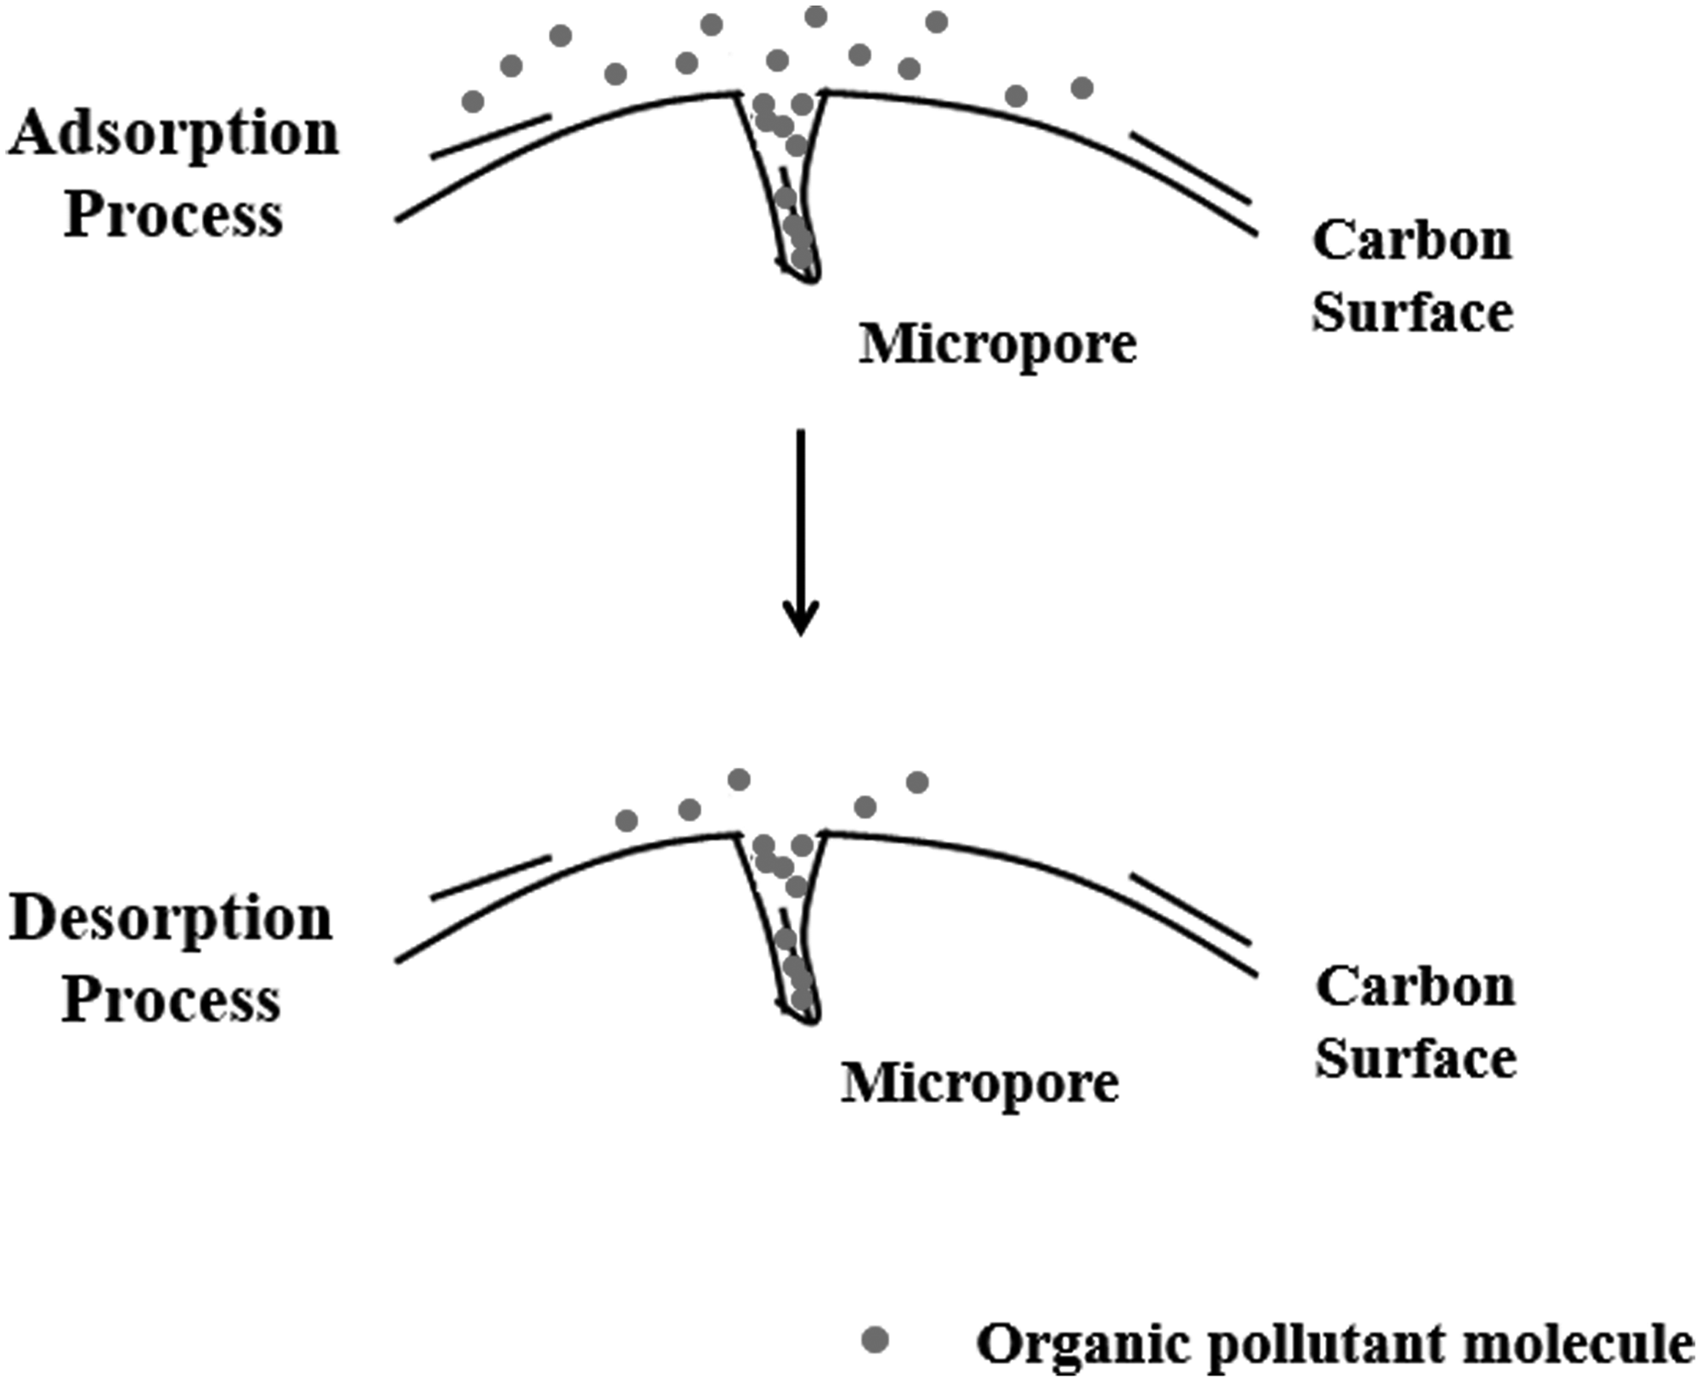
Pictorial illustration of adsorption and desorption processes based on mechanism suggested by Polanyi–Manes model. The adsorption process can be viewed as condensation of organic pollutants into the micropores of carbonaceous material surface.
In summary, the DED model and Polanyi–Manes model both simulate experimental data presented herein reasonably well. Although three apparent parameters need to be optimized in the DED model, model fitting results showed that the values of each parameter,
Summaries
In this study, sorption hysteresis is observed for the adsorption and desorption of naphthalene and 1,2-dichlorobenzene with C60, AC, and soil OC, that is, desorption data deviate substantially from forward-constructed adsorption isotherm. As a consequence, experimental adsorption–desorption data cannot be fitted with a single linear isotherm. Instead, they were fitted with four different sorption models, including Freundlich model, Langmuir model, DED model, and Polanyi–Manes sorption model. Results show that DED model and Polanyi–Manes model fit data reasonably well, while the overall data are not well described by the Langmuir model. Each DED model obtained parameter has similar values for different carbon forms, indicating that this model can possibly be used to predict the sorption and desorption behavior of new carbonaceous materials from that of other known carbon forms. The desirable fitting of data with the Polanyi–Manes model implied that the intraparticle pore-filling might be the mechanism controlling the adsorption of organic compounds to nC60 and AC particles.
Footnotes
Acknowledgments
This work was financially supported by Brine Chemistry Consortium companies of Rice University, including Aegis, Apache, BHGE, BWA, Chevron, ConocoPhillips, Coastal Chemical, EOG Resources, ExxonMobil, Flotek Industries, Halliburton, Hess, Italmatch, JACAM, Kemira, Kinder Morgan, Nalco, Oasis, Occidental Oil and Gas, Range Resources, RSI, Saudi Aramco, Schlumberger, Shell, SNF, Statoil, Suez, Total, and the NSF Nanosystems Engineering Research Center for Nanotechnology-Enabled Water Treatment (ERC-1449500). The authors also appreciate the financial support of Start-Up Research Grant provided by University of Macau (SRG2018-00112-FST) and the sponsorship of Science and Technology Development Fund, Macao S.A.R (FDCT) (0063/2018/A2).
Author Disclosure Statement
No competing financial interests exist.
References
Supplementary Material
Please find the following supplemental material available below.
For Open Access articles published under a Creative Commons License, all supplemental material carries the same license as the article it is associated with.
For non-Open Access articles published, all supplemental material carries a non-exclusive license, and permission requests for re-use of supplemental material or any part of supplemental material shall be sent directly to the copyright owner as specified in the copyright notice associated with the article.
