
Abstract
Abstract
External input of nutrients through point and nonpoint discharges is considered critical to supporting eutrophication of surface waters. This study investigated internal recycling of nutrients, measured the ambient sediment oxygen demand (SOD) and nutrient fluxes, in a fresh water shallow alkaline lake. The lake has been experiencing frequent Harmful algal blooms. Provo Bay in the lake, which receives treated point discharges and flows from tributaries, was found to have the highest SOD (4.61 g O2/m2/day) and water column respiration (−6.66 g O2/m3/day) among seven sampled sites. A linear correlation was plotted between SOD and percentage of volatile solids (%VS) in sediments (r = 1.59, R2 = 0.97). Lake sediments (excluding Provo Bay, site 1) were continuously adding nutrients to the water column at an average rate of 0.057 ± 0.057 g N/m2/day and 0.016 ± 0.027 g P/m2/day. The isolated Provo Bay has a sediment nitrogen flux of 1.44 g N/m2/day and phosphorus flux of 0.01 g P/m2/day. Most nutrients released were bioaccumulated by phytoplankton to compensate for water column nutrient limitations. It was also concluded that ammonia, rather than ortho-P, had significant flux rates under ambient conditions. Internal P-cycling was supported by P-rich sediment (up to 1,767 mg P/kg dry mass) and continuous external loading. This accounted for 1,500 tons P per year, which was 5 times higher than the external P loading. Inorganic P was the dominant P species in this carbonate-rich sediment. Ambient sediment P concentration was rich in the order of Ca-P > Fe/Mn-P > residual-P > Al-P > loosely-sorbed P for most sites. After changing pH and dissolved oxygen conditions, results showed that loosely sorbed-P and Fe/Mn-P were reactive and possibly released ortho-P at decreased pH values under anaerobic condition in the sediments.
Introduction
L
HABs have often been linked with anthropogenic nutrient supplies (Heisler et al., 2008; Conley et al., 2009). To effectively prevent HABs, nutrient-reduction strategies (especially phosphorus) have been adopted for freshwater ecosystems, such as Lake Erie phosphorus reduction strategies (International Joint Commission, 2014). However, recent evidence has questioned the relationship between external nutrient loading and HABs (Gowen et al., 2012). The internal cycling of nutrients between the water column (WC) and sediments has been considered to be a major factor in preventing water quality improvement (Søndergaard et al., 2003; Slomp, 2011; Wu et al., 2017). Many physical, chemical, and biological factors have been reported to impact nutrient release. These factors include pH, redox conditions, organic matter, mineralogy, speciation, and others (Holdren and Armstrong, 1980; Christophoridis and Fytianos, 2006). For example, the release of phosphorus from sediments, especially during periods of anoxia, serves as an important source of internal phosphorus that contributes to HABs (Davidson et al., 2012). For example, under reducing conditions (low dissolved oxygen [DO] and low pH), manganese and iron bound P could be released in the water column due to increased solubility of manganese and iron minerals.
Sediment oxygen demand (SOD), defined as the rate of chemical and biological oxygen consumption in the bottom sediment, is found to contribute significantly to oxygen depletion and nutrient flux (Chau, 2002; Rong et al., 2016). Higher SOD values generally indicate organically rich decaying sediments with a greater potential of nutrient release (Lee et al., 2018). Although relatively less reported, ammonia and nitrate were also released from sediments (Beutel, 2006; Beutel et al., 2008). It is found that the release of ammonia was mostly achieved under anoxic conditions due to a loss of nitrification and low ammonia assimilation by autotrophic bacteria (Hansen and Blackburn, 1991; Rysgaard et al., 1994). In addition, the release of nitrate was reported to enhance the eutrophic status and sediment phosphorous release rates (Foy, 1986; Nowlin et al., 2005; Hou et al., 2013). The internal recycling of nutrients, their speciation, and prevailing environmental conditions are crucial to understand to implement nutrient reduction strategies.
Utah Lake is the largest natural freshwater lake in the western United States, with a maximum length of 24 miles and a maximum width of 13 miles. Its surface area is roughly 145 square miles and has a storage capacity of nearly a million acre-feet (902,400 ac-ft). It is a shallow lake, with an average depth of ∼9–10 feet during normal reservoir operating conditions, and primarily contains calcium-rich sediments. Utah Lake does not undergo seasonal stratification/turnover. Roughly 42% of the water is lost to evaporation before discharging to the Jordan River, which drains to the terminal Great Salt Lake (PSOMAS and SWCA, 2007). It is considered hypereutrophic in terms of its trophic status, and extreme algal blooms appear in the late summer and fall (PSOMAS and SWCA, 2007). It is important as it serves varieties of recreational purpose such as boating and fishing to local people.
Similar to other eutrophic surface waters, cyanobacteria are one of the major components of the overall phytoplankton found during intense phytoplankton blooms. The nutrients that triggered algal blooms come both internally and externally into Utah Lake. Internally, the shallow nature of the lake makes it vulnerable to rapid evaporation and sediment disturbance during windstorms and summer seasons (U.S. Fish and Wildlife Service, 2010). This process results in more nutrient release from sediments. Externally, Utah Lake receives continuous treated discharges from surrounding wastewater treatment plants (WWTPs) (PSOMAS and SWCA, 2007). It is expected that the population increase over the next 40 years will add to more nutrient loads associated with storm water, municipal, and industrial wastewater discharges (Utah Foundation, 2014).
The major concern of Utah Lake's eutrophication is related to overloading phosphorus into the lake. In recent years, over 75% of the 297.6 tons per year of phosphorus that is loading into the lake was attributed to WWTP discharges (PSOMAS and SWCA, 2007). Eight WWTPs near the eastern shore discharge effluent to tributaries (Powell Slough, Mill Race Creek, Spring Creek, Dry Creek, Benjamin Slough, and Beer Creek) (Fig. 1) and wetlands or directly into the lake. However, the report did not consider the potential impact of internal phosphorous cycling and atmospheric deposition. The lake also acts as a sink for over 70% of the phosphorus loading with only 30% (83.5 tons/year) being known to exit the lake through the Jordan River. Low concentrations of phosphorus in the water column are believed to be associated with high amount of calcium in the sediment (Brimhall and Merritt, 1981). It primarily exits in the forms of phytoplankton and sestonic matter during the summer months (PSOMAS and SWCA, 2007). Thus, total phosphorus (TP) concentrations in the Utah Lake water column are typically found to be higher than 0.025 mg P/L. This is a pollution indicator of excessive phosphorus entering or sediment phosphorous fluxing into the lake (PSOMAS and SWCA, 2007). It is reasonable to hypothesize that other nutrients, organic matter, and phytoplankton debris will also sink into the sediment. Under certain conditions, those nutrients could also be released to the water column, intensifying eutrophication.
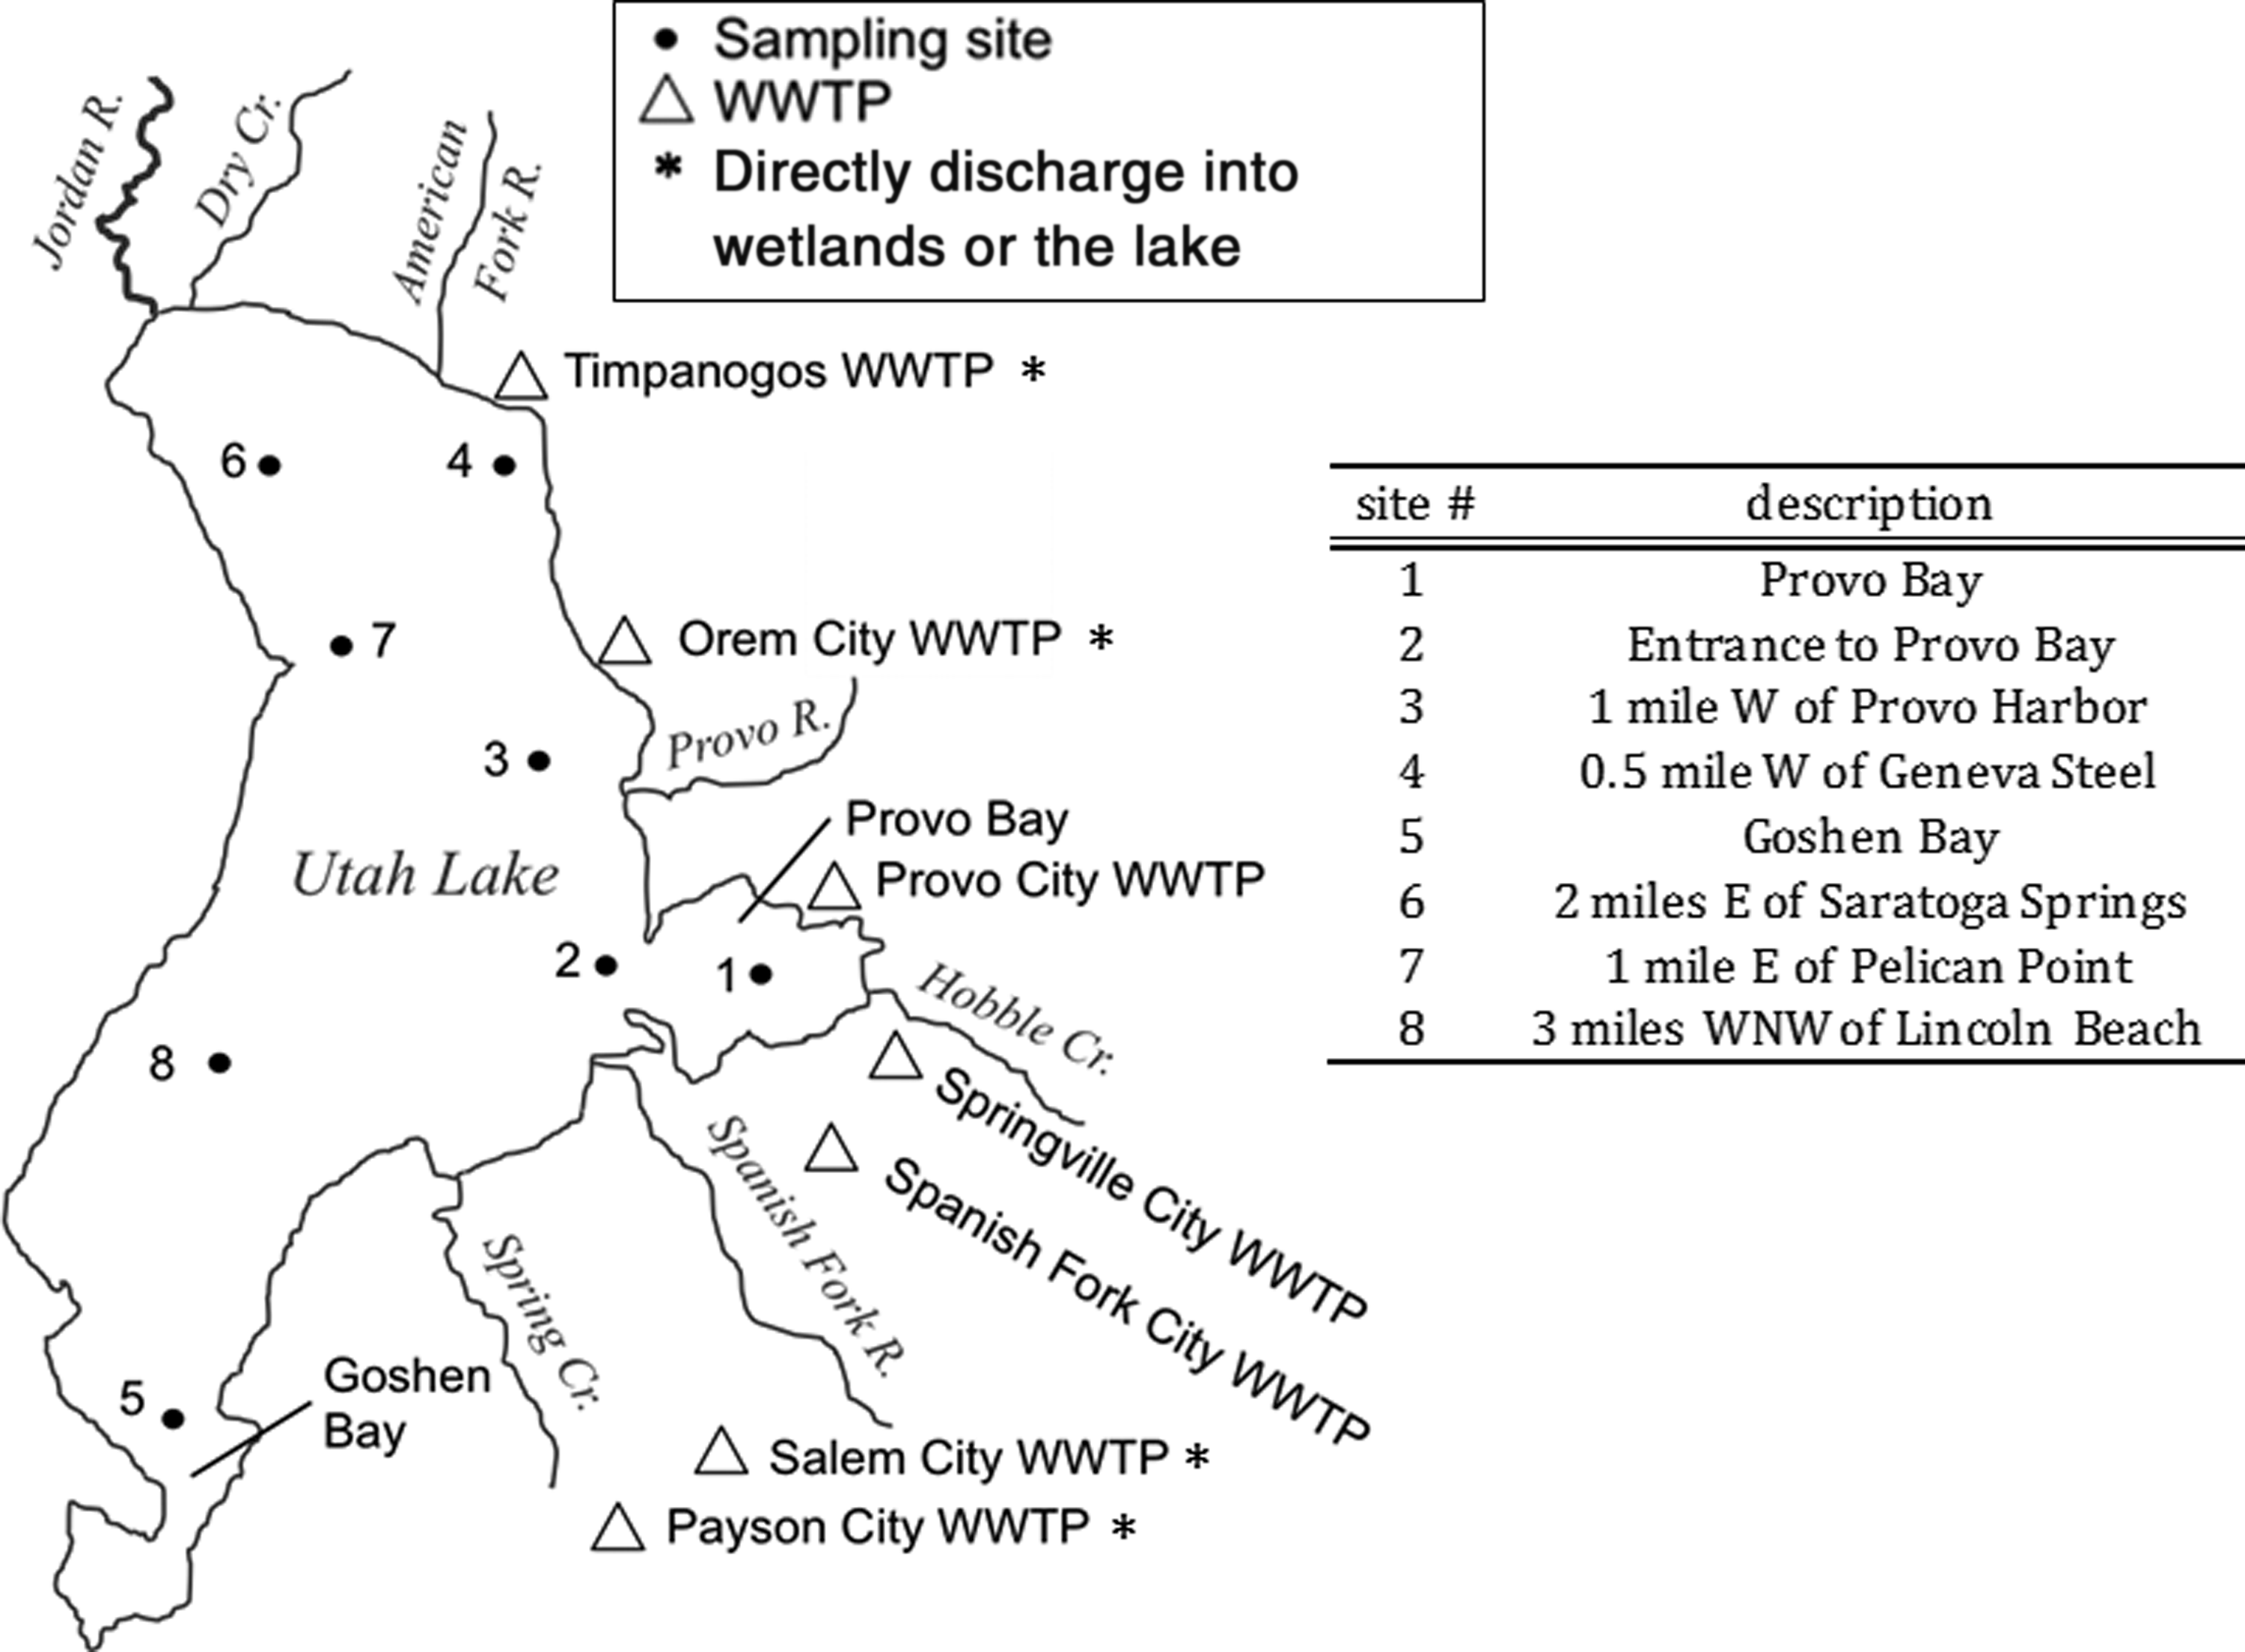
Overview of Utah Lake with sampling sites and WWTP locations. WWTP, wastewater treatment plant.
As stated earlier, the lake acts as a sink for the majority of the phosphorus load; interactions between sediments and the water column may play a major role in releasing/adsorbing nutrients. However, little information was available about the contributions of internal phosphorus loading to eutrophication of the Utah Lake. The triggering factors of recycling on other nutrients in the lake were also unclear. For example, most of Utah Lake sediments are calcium rich, and calcium is a great scavenger of phosphorus. However, mineral-bound phosphorus can be released under varying DO and pH conditions. Consequently, this study was initiated to understand internal nutrient recycling and its triggering factors by determining (1) the oxygen demands associated with the water column and sediment, (2) nutrient fluxes under ambient conditions and changing dissolved-oxygen and pH scenarios, and (3) sediment characteristics and their effects on SOD and nutrient flux.
Materials and Methods
Location and field sites
A general overview of Utah Lake, the surrounding tributaries, SOD, and sediment sampling locations, along with other details, are provided in Fig. 1. Eight sampling sites were selected based on the regular sampling locations used by the Utah Division of Water Quality (UDWQ). Sites were chosen both near the tributaries (sites 1, 2, 3, 4, and 5), as well as in deep water offshore (sites 6, 7, and 8). The sampling was conducted in later summer of 2013. The WWTP either discharging directly (only Timponos) or through wetlands and tributaries is also shown in Fig. 1.
Measurement of ambient water conditions
Water quality parameters were measured both in situ and in the laboratory. Temperature and pH were measured using an on-field environmental monitoring system (YSI SONDE 600 XL). DO was measured using a portable DO meter (Hach HQ40D Portable Multi Meter). Water samples were collected at 2–3 inches below surface with HDPE bottles following the Standard Operating Procedure for the collection of lake water samples by Utah's Division of Water Quality (UDWQ, 2014). They were filtered using a 0.45 μm filter right after collecting them, stored on ice in a cooler, and analyzed within 24 h at the Environmental Engineering and Microbiology Lab at the University of Utah, Salt Lake City, Utah. Nutrients (nitrate-N, nitrite-N, and orthophosphate-P) were analyzed by ion chromatography (IC) (Merohm 883 Basic IC plus) for anion detection (EPA method 300) (Pfaff, 1993). Ammonia was measured using the Hach TNT 830 Ammonia Kit. The nonpurgeable dissolved organic carbon (NPDOC) was measured using a total organic carbon (TOC) analyzer (Shimadzu SSM-5000A) for liquid-sample analysis.
Sediment oxygen demand
SOD and the dark respiration rate of the water column (WCdark) were measured at eight sites to characterize ambient oxygen demands. Sampling occurred during August and September, when large cyanobacteria blooms typically occur. Utah Lake SOD sampling required the use of the following three instruments: (1)self-contained breathing apparatus (SCUBA) gear, (2) a custom-made sampling barge to deploy the chambers, and (3) an anchored float tube to carry the deep-cycle 12 V battery that powers the SOD chamber pumps. The barge was lightweight, durable, constructed in a way to be easily used by one person, and would not cause any disturbance to sediments during chamber deployment. The chamber design, deployment, and calculations were carried out based on a previously published protocol (Hogsett and Goel, 2013). In the study, SOD was measured for a total of 90 min with DO readings taken every 5 min to evaluate the change of DO within the chambers. The percentage of ambient oxygen demand associated with the sediments (%SOD) represents the contribution of SOD to total DO depletion under ambient conditions. It was calculated accordingly:
where d = lake depth at the sampled site and WCdark = water column oxygen consumption under dark conditions.
Nutrient fluxes under ambient conditions
At each sampling site, three SOD chambers were installed; two testing chambers (SOD 1 and SOD 2 with working volume of 38 L each) measured DO consumption in the sediment and the water column collectively; one control chamber with a volume of 44 L (WC) measured respiration (WCdark) in the water column only.
Sediment nutrient fluxes and water column rates were measured in the SOD chambers over a 3-h time period. A submersible pump was installed and immersed in each chamber for the purpose of internal water cycling and slow mixing. Similar to the SOD measurement, nutrient flux was calculated using the normalization equation for SOD calculations (Chiaro and Burke, 1980). The rate of change in nutrient concentration was calculated using the slope of concentration change with time [mg/(L·day)]. The WC nutrient release rate was calculated as follows:
where dCc = change of nutrient concentrations in the control chamber (mg/L)
dt = change of sampling time (h)
The sediment was calculated by subtracting the activity in the control chamber and convert to the nutrient flux per area of the sediment:
where dCe = change of nutrient concentrations in the experimental chamber (mg/L)
V = volume of water within the chamber (L)
A = sediment surface area within the chamber (0.16 m2)
In addition, 20 mL water samples were collected every 45 min, taken with a syringe from the surface and filtered through the 0.45 μm filter paper immediately. Nitrate, nitrite, and orthophosphate were measured using IC (USEPA method 300.0). Ammonium was measured using the HACH method 10205 (Loveland, CO).
Nutrient flux at changing pH and DO conditions
After establishing baseline SOD rates and nutrient fluxes under ambient conditions over a 90-min period, pH was dropped to 7 using 4 N hydrochloric acid (HCl) in the SOD testing chamber 1 to simulate seasonal and diurnal pH changes as recorded in the past by regular UDWQ monitoring. Historically, it usually fluctuated between mid-7s and mid-9s according to the data in Ambient Water Quality Management System (AWQMS) collected by the UDWQ and its partners. The amount of acid needed to accomplish the exact pH drop was predetermined by a sediment core sample and was then normalized to the SOD chamber volume. The effects of altering the pH in the chambers were measured 30 min after lowering the chamber pH to estimate the initial abiotic release of nitrogen and phosphorus, according to the diurnal and annual pH swings. Sediment core analysis was conducted to reveal the effects of pH on P release as discussed later in this article.
DO concentrations were manipulated in SOD chamber 2 by adding a predetermined amount of the oxygen-scavenging Na2SO3 to the chamber to achieve anoxic conditions, with the aim of dropping DO to 0 mg/L in the chamber (Park et al., 2011). Sodium sulfite is primarily used as an oxygen scavenge agent for water systems. The amount of sodium sulfite was calculated based on the saturated oxygen concentrations during the experimental time. Typically, 7.88 mg/L pure sodium sulfite is required for each mg/L of oxygen. The salt was mixed into a slurry with 30 mL of lake water in a syringe before being injected into SOD chamber 2. The effects of DO were measured 30 min after oxygen concentration dropping to 0 mg/L to estimate the abiotic release under anoxic conditions.
Sediment core collection
Sediment samples were collected with an open barrel sediment core sampler using either a snorkel or SCUBA gear. The sediment core sampler was used to extract the sediment; it was then securely sealed and transferred to the Environmental Engineering and Microbiology Laboratory for further analysis.
Sediment core analysis for solids, TOC, mineralogy, and phosphorus speciation
Sediment total solids (%TS) and volatile solids (%VS) were measured using USEPA Method 1684 and Standard Methods (APHA et al., 2005), respectively. Sediment TOC was measured with a Shimadzu SSM-5000A solids sampling module, where samples were initially subjected to a 5% HCl pretreatment to remove inorganic carbon (Leipe et al., 2011).
Whole-rock and clay X-ray diffraction (XRD) analyses were performed on each sample in the XRD laboratory at the Energy & Geoscience Institute at the University of Utah, using a Bruker D8 Advance X-ray diffractometer. According to the Rietveld method, phase quantification was performed using TOPAS software developed by Bruker AXS®. The Rietveld method fitted the peak intensities calculated from a model of the crystalline structure to the observed X-ray powder pattern by a least-squares refinement method. The following operating parameters were used when analyzing the powdered samples: Cu-K-α radiation at 40 kV and 40 mA, 0.02°2θ step size, and 0.4 and 0.6 s per step, for clay and bulk samples, respectively. Clay samples were examined from 2°2θ to 45°2θ and the bulk samples from 4°2θ to 65°2θ. Three analyses were conducted on each sample, two or more on the clay-sized fraction, and one on the bulk sample. The clay fraction was separated from the bulk sample using Stokes Law for particle sedimentation. The resulting slurry was applied to a glass slide, dried, and then scanned. The samples were then allowed to interact with ethylene glycol vapors to induce swelling of smectite-bearing clays and then scanned again using the same parameters. The air-dried and glycolated patterns were then compared to determine which, if any, smectite-bearing clays were present. Clay abundances were measured from the whole-sample XRD scans.
Phosphorus (P) speciation was conducted according to the methods detailed by Jensen and Thamdrup (1993). Loosely-sorbed phosphorus was extracted in 50 mL polyethylene tubes under oxygen-free conditions using 0.46 M nitrogen-purged NaCl. Iron- and Manganese-bound P fractions were extracted under oxygen-free conditions using a pH 7.0 buffered solution of 0.11 M Na2S2O4 and 0.11 M NaHCO3. Calcium-bound P was extracted using 0.5 M HCl. After each extraction, multiple washing steps were performed to extract any remaining P. Residual P was estimated by drying the sediment sample at 105°C and igniting it at 520°C. Next, the residue was boiled in 25 mL of 1 M HCl for 10 min. TP was measured using EPA method 365.3. In this method, both organic and inorganic phosphorus were digested into orthophosphates using concentrated sulfuric acid and ammonium persulfate. Next, it was combined with mixed reagent into a blue complex and then measured by a spectrophotometer at 880 nm.
Data analysis
The relationship between sediment %VS and SOD was found by linear correlations. Sediment %TS and %VS were plotted to compare the organic content among Utah Lake, the Provo Bay area, and downstream Jordan River. One-way ANOVA was applied for a test of nutrient flux data under ambient and changing pH/DO conditions. Principle Component Analysis (PCA) was performed to observe the directions of maximum variations through nutrient flux and ambient environmental parameters using the R package. Biplots were plotted for the visualization of the two most significant principle components Dimension 1 (Dim 1) and Dimension 2 (Dim 2). Spearman correlation was also used to find relationships between nutrient flux and environmental factors, with a confidence level of 95%.
Results and Discussion
Water quality under ambient conditions
All the sites visited during the afternoon hours (sites 1, 2, 4, and 7), including sites at the center of the lake, had supersaturated ambient DO concentrations. This was consistent with a previously found diurnal DO cycle (Schwartz, 2005). The elevated pH and supersaturated DO at Provo Bay (site 1) were a result of primary production by phytoplankton in the isolated bay that was receiving water from Hobble Creek and Mill Race (Table 1). The ambient water in the middle of Utah Lake reached 200% saturation by the end of the experiment, highlighting the degree of primary production occurring in Utah Lake's water column. A midafternoon rise of phytoplankton in the water column was observed during the late afternoon. The rising phytoplankton was assumed to be cyanobacteria, as this phenomenon has been reported in other lakes (Graham et al., 2009). The pH values were greater than 8.6 at all the sites. Values greater than 9.0 were coupled with supersaturated ambient DO and were also associated with water column phytoplankton primary production (Khan and Ansari, 2005; O'Neil et al., 2012). The highest pH values were observed in shallow sites where water column depths were only 3.28 feet.
Ambient Conditions at Time of Sampling
DO, dissolved oxygen; NPTOC, nonpurgeable total organic carbon; TIN, total inorganic nitrogen.
SOD and water column respiration under ambient conditions
Four parameters determined the oxygen depletion rates in both the water and sediment phases. These were the two-chamber average SOD value, WCdark (which accounted for water column respiration under dark conditions), chamber calculated nighttime ambient DO depletion rates, and %SOD. Table 2 shows average SOD values for all sampled sites. A negative SOD value represents a sink of DO in sediments due to various biogeochemical activities. As seen in Table 2, the determined SOD values were all negative because they revealed a sink of DO in the sediments. Typically, sediment was considered as a larger sink for DO than water column, due to the various pathways of oxygen consumption in the sediment (MacPherson et al., 2007). On average, the %SOD was below 50% for all sites in dark conditions, suggesting a higher water column respiration by phytoplankton and its significant impact on system hypoxia development (McCarthy et al., 2013).
Sediment and Water Column Ambient Dissolved Oxygen Depletion Rates
SOD, sediment oxygen demand; WC, water column.
Provo Bay (site 1) was found to be highly productive because it had the highest SOD flux (4.61 g O2/m2/day) in Utah Lake (Table 2). In addition, the visually greenish water in this isolated hypereutrophic bay had the highest WCdark rate. The WCdark rates measured in Utah Lake were 2–10 times higher than what was typically measured in the downstream Jordan River (Hogsett and Goel, 2013). According to DWQ, the average Chlorophyll a concentrations at each site at the sampling time were in the range of 21–82 μg/L. It indicates a eutrophic to hypereutrophic status in the late summer time. The settling and decay of phytoplankton debris and phytoplankton respiration that created this extremely high WCdark oxygen demand could be the cause of long-term high SOD in Provo Bay (Doyle and Lynch, 2005). It is noted that the summer's hypolimnetic anoxia caused by phytoplankton decay could probably result in larger SOD values (Beutel, 2009).
Sites located near the shores of Utah Lake (sites 2, 3, 4, and 5) had SOD fluxes ranging from 1.42 to 2.04 g O2/m2/day. The deep-water sites located offshore (sites 6, 7, and 8) had decreased SOD fluxes ranging from 0.9 to 1.06 g O2/m2/day. The decreased SOD in the middle of Utah Lake, compared to locations near townships, suggested that sediment organic matter enrichment was ongoing and more pronounced near civilization. It is important to note that these high rates of oxygen consumption could cause severe hypolimnetic anoxia in the bottom layer if the lake experiences temporary stratification, as hypoxia is defined as DO concentrations below 2 mg/L (Diaz, 2001).
Sediment TS and VS
In general, the lake sediments are rich in calcite and quartzes, with the entrance to Provo Bay particularly sandy in nature. More sediment characteristics are discussed in Sediment Mineralogy and Its Implication to Nutrient Dynamics section. Percent total solids (%TS) and volatile solids (%VS) were measured for all sites sampled for SOD. As a good indicator of organic matter, %VS were found to have a significant correlation with organic carbon and SOD fractions (Barcelona, 1983). The most organically enriched sediments were found in Provo Bay (7.2%VS), where the largest SOD flux was measured. All the sites, except at the entrance to Provo Bay (site 2), had very fine sediments with high water content (70% water by mass). The total solids (%TS) of 71% at the Provo Bay Entrance (site 2) were the result of the sediments being sandy and more consolidated than at other sites.
Measured %VS as a function of SOD are plotted in Fig. 2a. The SOD values and SOD fluxes were higher in sediments that had higher %VS. The nearly-linear correlation (r = 1.59, R2 = 0.96) supported the relationship between them. It appeared that the %VS could be more or less related to WCdark in Utah Lake (r = 1.84, R2 = 0.47) (Fig. 2b), because the phytoplankton would eventually die and settle to the sediment, contributing to the sediment organic matter content. The decay of that organic matter in the sediment would create a future SOD and was considered to be a major contributor of potential anoxic conditions (Beutel, 2009).

Utah Lake drains into Jordan River. Hence, a comparison between Utah Lake and Jordan River sediments is presented here. By comparing Utah Lake sediment with that in Jordan River (Hogsett and Goel, 2013), sediment collected from Utah Lake is less organic rich, except at the Provo Bay area (Fig. 2). In general, most sites in Jordan River have bulk %VS below 10%, while the %VS can be as high as 20%, especially in the lower Jordan River. The sites within Utah Lake proper were very similar in terms of %VS. Compared with other sites, the Provo Bay entrance had a much higher %TS and lower %VS due to its sandy nature (Fig. 2c). This type of sediment typically contained less than 1% organic matter (Cooperband, 2002). The general assumption when measuring %VS is that all burnable matter is organic and is composed of roughly 50% carbon by dry mass. The average sediment TOC:VS relationship was measured as 0.37 for sites located in Utah Lake proper, which is less than the assumed 50%. This was attributed to the degradation of calcium carbonate associated with combustion during the %VS analyses.
Utah Lake nutrient fluxes under ambient conditions
Table 1 provides the ambient dissolved nutrient concentrations at the sampling time. The highest ambient ammonia-N concentration (0.31 mg N/L) was measured in Provo Bay, compared to other sites (0.02–0.03 mg N/L). This could be due to high decomposition of settled algal biomass. The dissolved total inorganic nitrogen (TIN):ortho-P molar ratio of 9.8, coupled with the high ammonium concentrations measured in Provo Bay, supported the hypothesis that large amounts of organic matter decomposition and nutrient cycling are occurring in the isolated Provo Bay (Molongoski and Klug, 1980). Ambient nitrate-N concentrations were mostly between 0.05 and 0.06 mg N/L, except at the Provo Bay (site 1) and Geneva Steel (site 4). Low nitrate concentrations despite high ammonium concentrations in the bulk water column signify the presence of simultaneous nitrification and denitrification. No nitrite was detected from any of the sites. Ortho-P concentration was observed slightly higher in Provo Bay (site 1) and Geneva Steel (site 4) (0.07–0.08 mg P/L) than any others (0–0.05 mg P/L). The historic DWQ data indicated average TP concentrations in the range of 0.58–0.121 mg P/L and dissolved phosphorus (DP) in the range of 0.011–0.038 mg P/L. The NPDOC was in the range of 5.1–6.3 mg C/L for detectable samples.
Fluxes of dissolved nitrogen and orthophosphate from the sediments under ambient conditions are shown in Table 3. As measured during the nutrient flux experiment, nitrite was nondetectable in all samples, while ammonia, nitrate, and orthophosphate concentrations were measurable, but were relatively low. Since SOD was reported to contribute significantly to DO depletion and lake hypoxia conditions, a positive correlation was observed between TIN release and ambient SOD (r = 0.39, R2 = 0.90). These results were consistent with a recently completed study by Lee et al. (2018), where these researchers obtained sediment samples from a river and conducted laboratory scale incubation tests. The results by Lee et al. (2018) indicated that there was indeed a direct correlation between pore water nutrient concentrations and SOD. The oxygen depletion caused by ambient SOD conditions was not found to greatly affect the release of orthophosphates from sediments (R2 = 0). One of the key forms of nitrogen released from the sediment was ammonia nitrogen, which was reported in earlier research (Chau, 2002; Lee et al., 2018). In addition, ammonia release was positively correlated with SOD values (r = 0.40, R2 = 0.92), and nitrate release was negatively correlated (r = −0.01, R2 = 0.11).
Averaged Nutrient Fluxes from Water and Sediment Column
Specifically, the sediments were a source of ammonia in all but sites 3 and 6 and produced small amounts of nitrate at all sites except at sites 1, 4, and 7, where ammonia was released at high rates (Table 3). The production of nitrate suggests that autotrophic nitrification was occurring and that the sediment-water interface was not completely oxygen-depleted at the time of sampling (Bodelier et al., 1996). The high ammonia flux (1.44 g N/m2/day) at Provo Bay (site 1) may be the result of organic matter decomposition (e.g., proteins, amino acids, and urea) or high dissimilatory nitrate reduction to ammonium activities under higher-oxygen depletion conditions (Molongoski and Klug, 1980; Hardison et al., 2015). The sediments were a source of orthophosphates in all locations except at sites 3, 5, and 7 (Table 3). The water column acted as a large sink for nutrients except at Provo Bay (site 1), where the water column had positive ammonia flux rates and could have been released from phytoplankton debris decomposition. These nutrient fluxes resulted in a constant cycling of nutrients between biotic and abiotic substrate.
The positive fluxes meant that the sediments were adding N and P to the water column during dark conditions (Darrowa et al., 2003). Apart from site 1, the average flux of TIN and orthophosphate from sediments was calculated as 0.057 ± 0.057 g N/m2/day and 0.016 ± 0.027 g P/m2/day, respectively. These average nutrient fluxes accounted for 85% of TIN and 40% of orthophosphates measured in ambient water. It should be noted that phytoplankton photosynthesis consumed the ambient and sediment-released nutrients during daytime conditions. At most sites, the ambient-available nutrient content was lower than the 24-h nutrient removal from the water column. The sediment flux could compensate for the nutrient limitation conditions of the water column, which also had a relatively higher TIN:ortho-P ratio. All of these factors indicated diurnal nutrient limitation for phytoplankton growth.
Assuming a year-round lake average orthophosphate sediment flux of 0.01 g P/m2/day and a TIN flux of 0.05 g N/m2/day, roughly 1,500 tons P per year and 7,500 tons N per year were internally cycled between the sediments and water-column biota. This internal cycling loading was five times greater than the current estimated annual external TP loading (297.6 tons/year) into Utah Lake (PSOMAS and SWCA, 2007). In general, the WC acted as a sink for nutrients, and it suggested that phytoplankton and/or other microbes were bio-assimilating nutrients (Litchman et al., 2004). In addition, nutrients in the water column were limited for microbial uptake. It appeared that additional nutrient loads would likely increase phytoplankton growth in Utah Lake, at least in late summer. As ambient water was a sink for both N and P, the reduction of one nutrient alone would probably result in the increase of the other nutrient concentration, as previously modeled in other lakes (Wu et al., 2017).
Nutrient fluxes under changed DO and pH conditions
After collecting SOD and nutrient flux data under ambient conditions, SOD chamber 1 and SOD chamber 2 were applied to measure SOD and nutrient fluxes under changed conditions. No SOD was expected in the SOD chamber that was subjected to anoxic conditions. Furthermore, no change in SOD values was observed in the SOD chamber that was subjected to pH lowering. This demonstrated that small pH changes were not typical factors affecting respiration and other DO consuming processes in the sediments (Utley et al., 2008; Li et al., 2013).
Similarly, nutrients were measured under changed pH and DO conditions for the calculation of sediment nutrient flux. Although the pH was dropped in increments larger than 0.5 units, additional fluxes associated with pH changes were normalized to 0.5 units for ease of comparison. No significant differences were found among the flux of ammonia, nitrate, and ortho-P, according to one-way ANOVA (Fig. 3). The flux rate of nitrogen (ammonia-N and nitrate-N) was more or less decreased, while ortho-P observed a slight increase under pH-decrease conditions.
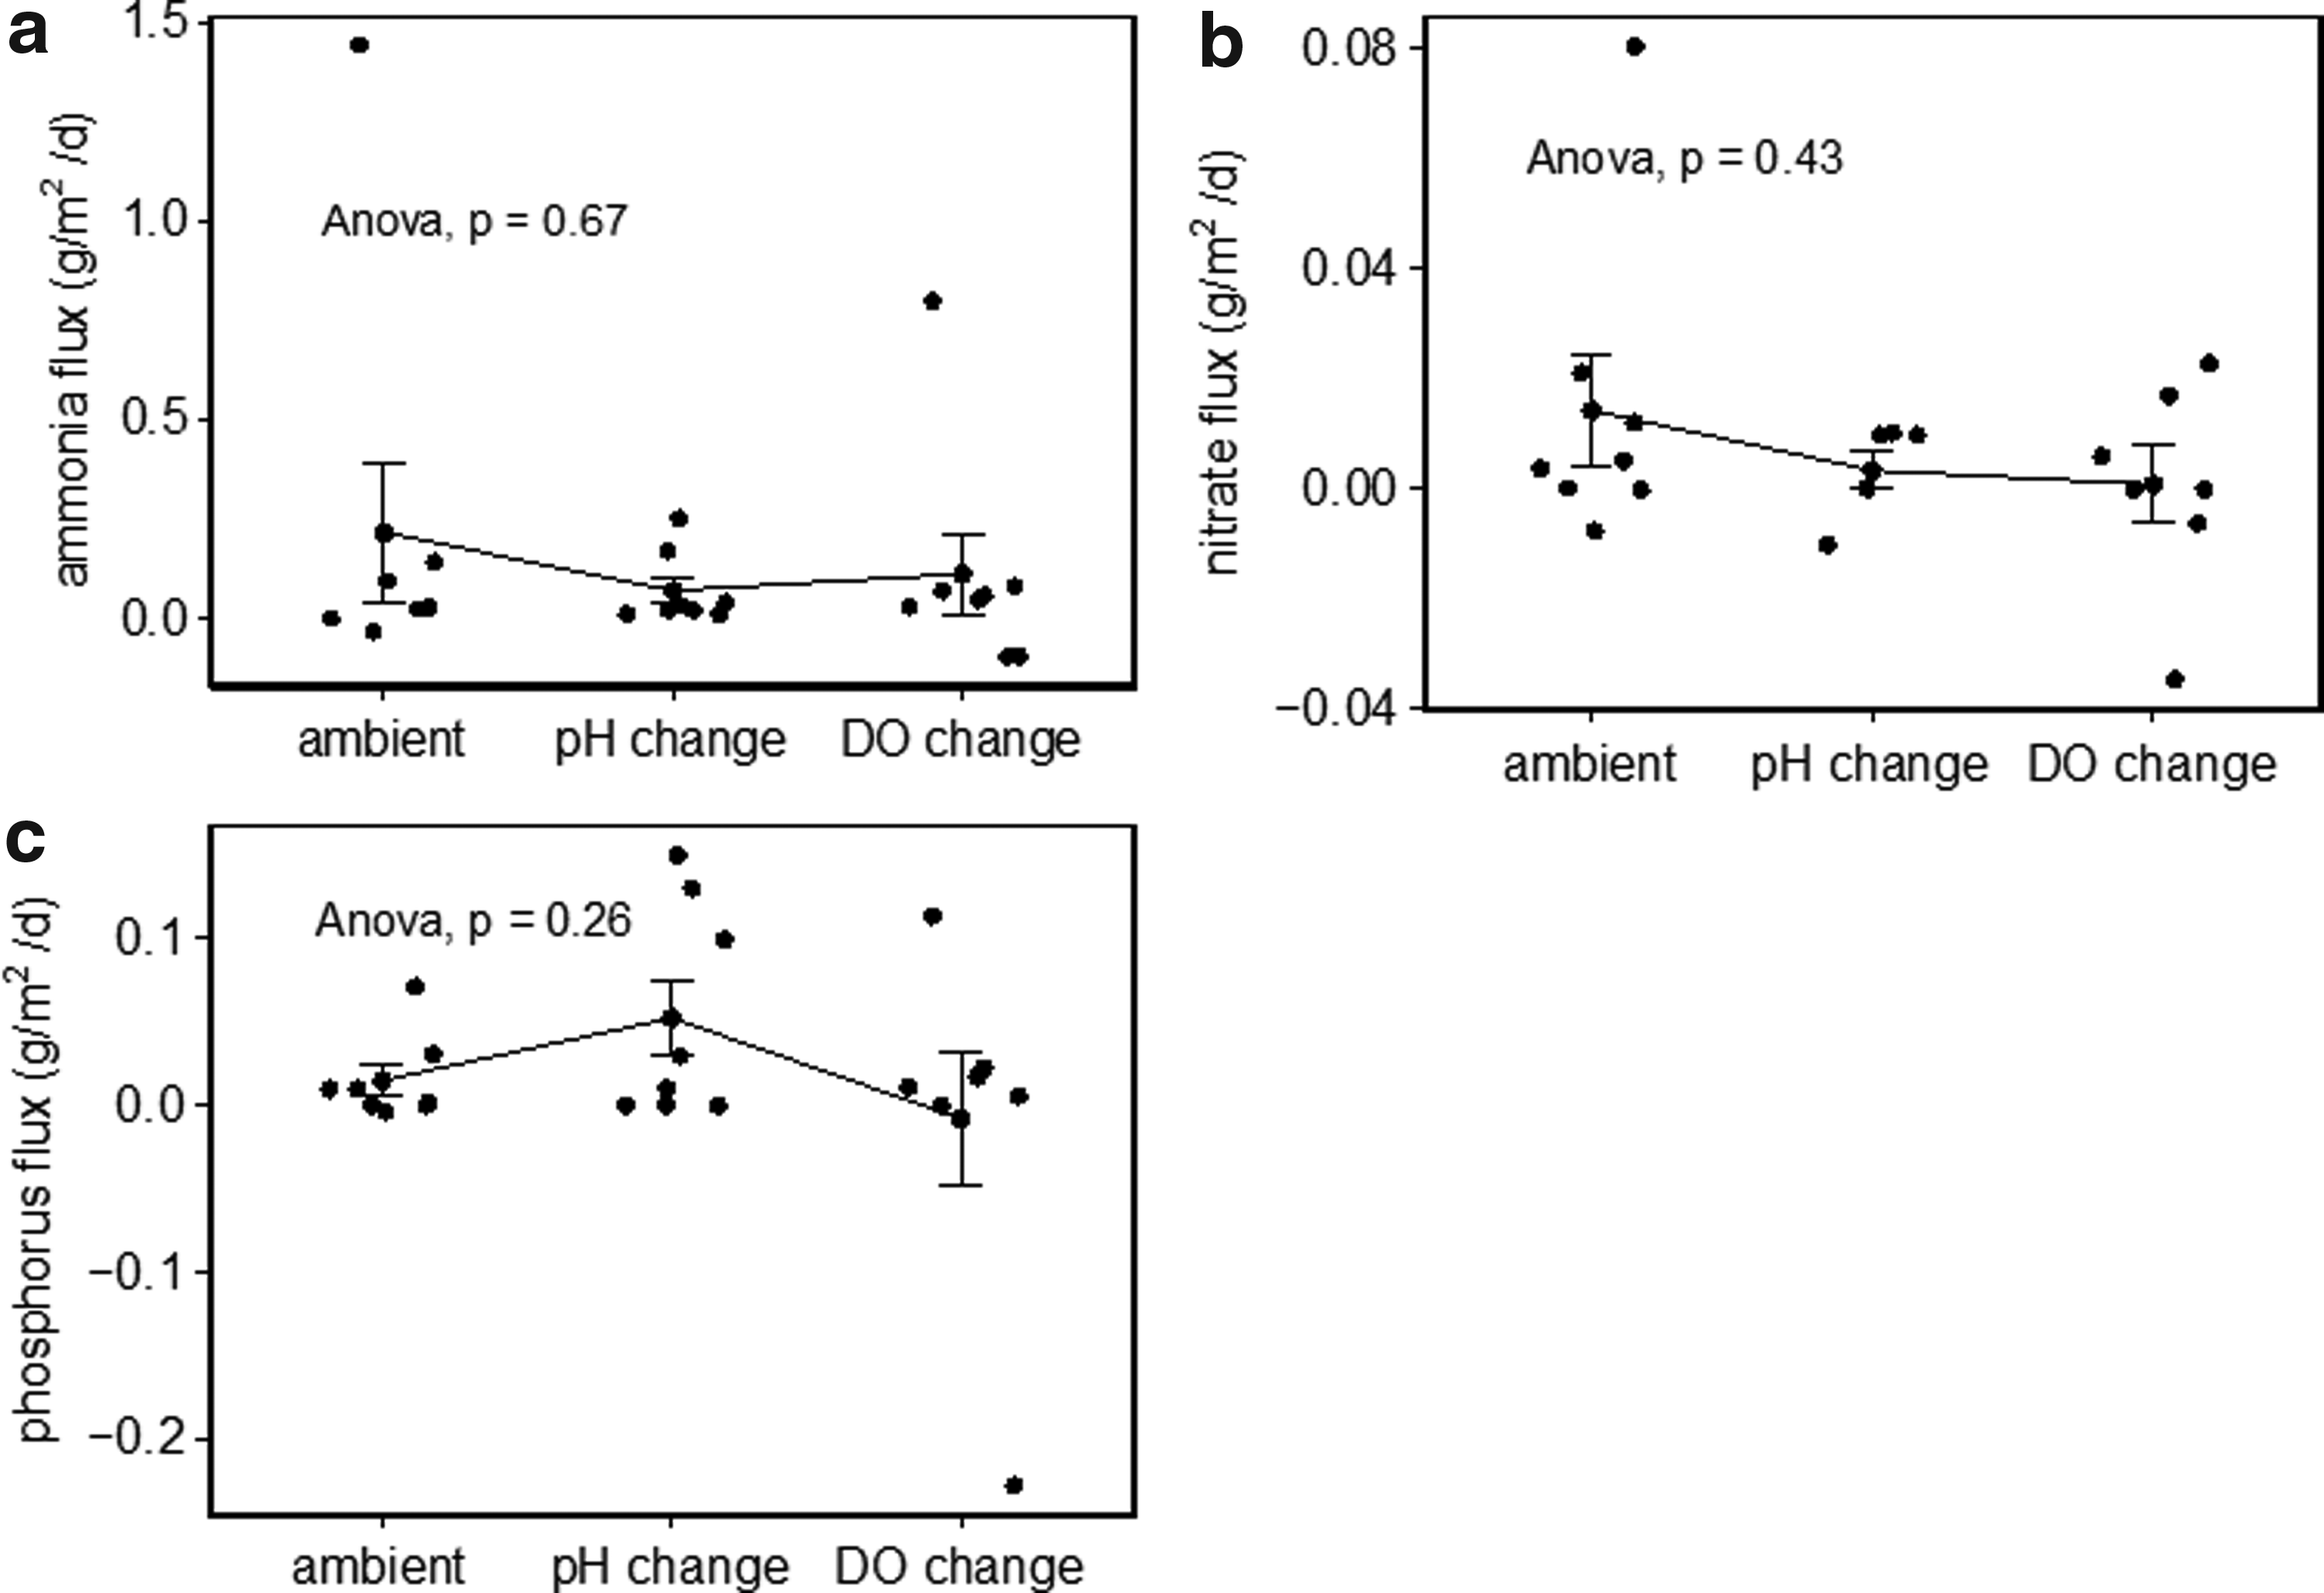
Comparison of nutrient flux at ambient, pH, and DO decrease conditions.
As for ammonia flux, significant differences were observed between Provo Bay (site 1) and the rest of Utah Lake proper. Most sites have flux rates in the range of −0.10 to 0.40 g N/m2/day, except for site 1. As for site 1, the release of ammonia was much higher under DO depletion (0.80 g N/m2/day) than pH change (0.25 g N/m2/day). The organic matter decomposition and loss of nitrification under anoxia conditions could be the main reason for ammonia release from organic-rich sediment (Molongoski and Klug, 1980; Hansen and Blackburn, 1991). By contrast, ammonia adsorption occurred more at sandy sites (where there is more inert matter) due to bio-assimilation by anaerobic ammonia oxidization bacteria (Beutel, 2006; Sieczka and Koda, 2016), such as the entrance to Provo Bay (site 2) and Saratoga Springs (site 6). Theoretically, ammonia flux should decrease with lowered pH due to less free ammonia volatilization (Gao et al., 2012). The high release of 0.25 g NH4-N/m2/day per decrease in pH of 0.5 units at the Provo Bay (site 2) was most likely a result of loosely bound ionic exchanges in the organically enriched sediments (Kadlec and Wallace, 2009). The results showed that the pH in the chambers remained relatively stable with a slight increase over the testing period, except for the Goshen Bay entrance (site 5). At this site, the chamber pH nearly rebounded to the original value over the 45-min testing period. We assumed that the rebounding of pH at Goshen Bay could have been due to the high buffering capacity of sediments at this site, which contained high carbonate minerals (Ryan and Kahler, 1987) (>60% sediment dry weight).
The flux of nitrate was minimal compared with ammonia, probably due to low nitrification and high denitrification under low oxygen conditions (Fig. 3). Relatively lower nitrate flux rates (−0.04 to 0.03 g N/m2/day) were observed under DO depletion (Fig. 3); however, denitrification rates could still be limited by the low benthic metabolism in the nitrogen-limited lake (Arango et al., 2007). Lincoln Beach (site 3) had the highest nitrate flux rates with low organic matter content. Lowered nitrate fluxes (−0.01 to 0.01 g N/m2/day), and probably the resulting higher denitrification activities, were also observed after the pH change. This was consistent with the known alkaline inhibition on denitrifying activities and limited nitrate supply at high pH (Čuhel et al., 2010).
Ortho-phosphate release was relatively more affected by changed pH and DO conditions (Fig. 3). Under ambient conditions, the ortho-P flux rate was measured to be 0.071 g P/m2/day at the entrance to Provo Bay (site 2). Provo Harbor (site 3) and Goshen Bay (site 5) were sites that had phosphorus flux rates higher than 0.1 g P/m2/day under pH decrease. It should be noted that the effects of pH on phosphorus release was highly dependent on mineralogy compositions and phosphorus fractions of surface sediments. Although the adjusted pH was not low enough to simulate winter pH values, a greater correlation was observed for phosphorus release with an overlying pH change than with oxygen depletion (Borovec, 2000). In addition to pH lowering, site 1 also released a significant amount of phosphorus (0.114 g P/m2/day) under DO changes. The ortho-P release under DO depletion could have been a combination of both abiotic release due to changed redox conditions and bacterial P release (Hupfer and Lewandowski, 2008). Low levels of nitrate (∼0.1 mg N/L) could be one of the factors affecting P release under anoxic conditions.
Sediment mineralogy and its implication to nutrient dynamics
Sediment mineralogy within the top 0.4–0.8 inches of the sediment column is provided in Table 4. Calcite was the predominant mineral in samples located in Utah Lake proper. Site 2 (located near the entrance of Provo Bay) was composed mainly of sand, which explained the low carbonate concentration and high concentrations of quartz (sand) and feldspars (cooled magma). The percentage of clay minerals was consistent throughout the lake, ranging from 11% to 17%. The exception was the sandy sediment found near the outlet of Provo Bay (site 2). Phosphorous release was found to be closely related to the phosphorous content and P adsorption capability of subsoils (Djodjic et al., 2004). With more macropores and rapid transportation of particles, the risk of P loss was found to be much higher in clay loam than in sandy loam (Jarvis, 2007). However, it could not explain the higher P release from sandy sediments (site 2) in Table 4. In addition, the high release rate at site 2 was slowed down under lowered pH and DO depletions. Apatite, a phosphate mineral precipitation with the general formula Ca10(PO4)6(OH, F, Cl, Br)2, was not measured in any of the samples. In a lake with calcium-rich sediment and high pH, it was unexpected as the adsorption of phosphorus to calcium carbonate (CaCO3) and gradual formation of apatite are main pathways for phosphorus retention.
Utah Lake Surface Sediment Mineral Composition
Sediment phosphorus speciation
Results of the sediment phosphorus speciation analysis are provided in Table 5. Utah Lake has P-enriched sediment, but the majority of the TP was found in stable mineral forms, not as organic P (mostly presented in the residual P). Utah Lake sediments were known to be rich in carbonate-related minerals, and an average 60% of the sediment-bound phosphorus was found to be attached with calcium. The most reactive P (loosely-sorbed P) only accounted for 7% of total P. Specifically, the initial concentrations of phosphorus were in the order of calcium-bound P (Ca-P) > iron and manganese-bound P (Fe/Mn-P) > Residual P (R-P) > aluminum-bound P(Al-P) > loosely sorbed P (LP). The distribution order was similar to other carbonate-rich water bodies (Sun et al., 2009; Nguyen and Maeda, 2016).
Phosphorus Speciation in Utah Lake Sediments
Under ambient conditions, the release of orthophosphates was more closely related to loosely-sorbed P than any other fractions. It was shown that the release of phosphorus was elevated after adding acid to the overlying water under anaerobic conditions (Nguyen and Maeda, 2016). Although Utah Lake was not traditionally considered to stratify, hypoxia could occur at some sites (e.g., site 1) in late summer due to high SOD. Fractions of loosely-sorbed P and Fe/Mn-bound P were the main potential sources of P released into overlying water after adding acid. The possibility of Fe-bound releasing was due to the change of redox that converts Fe (III) to Fe (II) (Gomez et al., 1999). It appeared that the pH manipulations performed in the SOD chambers were not low enough to release the Ca-bound pool of phosphorus, which was previously reported to be released at pH 3 (Gao, 2012). The residual P (containing organic P) was not easily released without significantly enhanced microbial activities. In this study, sites 1 and 3 were rich in loosely-bound and Fe/Mn-bound P, where sediments had a high potential to release ortho-P under changed conditions. By contrast, ortho-P was mostly released from site 2 under ambient conditions.
Sediment TP of each site was measured and can be seen in Table 5. The sum of the TP was highest in Provo Bay (site 1), suggesting that there was probably a large P loading to this area. Roughly 930 mg P/kg of dry mass was found in the sediment column of a Danish estuary known to experience periodic anoxia (Jensen and Thamdrup, 1993). The terrestrial phosphorus content of soils typically ranges from 300 to 2,000 mg P/kg dry mass depending on various factors, including organic content and historical P loadings (Kadlec and Wallace, 2009). This was consistent with the findings for TP in the lake sediment. Assuming a sediment P concentration of 925 mg P/kg dry sediment, 30% TS, and a sediment wet density of 1.2 kg/L, an estimated 13,770 tons of P are present in the top 4 inches of the surface sediments. This would account for roughly 66 years of external phosphorus loads, assuming that 30% of external P loads exited the lake through the Jordan River. This suggested that the lake sediment was a large sink for P, and the reductions in external TP loadings would result in less sediment P. Combating eutrophication would take time with the phosphorus-rich sediments and the continuous external loading that support greater internal phosphorus cycles.
Environmental factor effects on nutrient flux
Finally, PCA plots were created to find correlations between nutrient flux and ambient environmental conditions (Fig. 4). The fluxes of different nutrients and ambient parameters were plotted in Figure 4a. Surprisingly, ammonia, rather than phosphorus, was the major nutrient released from sediment under ambient conditions. The release of ammonia was highly correlated with eutrophication conditions. Sites with higher DO (r = 0.29, p < 0.05, Spearman), SOD (r = 0.46, p < 0.05, Spearman), and pH (r = 0.44, p < 0.05, Spearman) were found to have the most ammonia flux and the highest ambient ammonia concentrations. It can be inferred that ammonia flux from sediment was one of the sources for ambient ammonia-N. The settling and decay of phytoplankton debris would add to organic sediment matter, which created nutrient cycling in the lake proper (Grant and Hargrave, 1987). In addition, nitrate flux was not found to highly correlate with ambient conditions (p > 0.1, Spearman). It could be a result of low-nitrate flux rates and nitrate conversion to other forms (Arango et al., 2007). Rather than correlating with ambient water conditions, the phosphorus release was more related to sediment P content and speciation (Fig. 4b). To specify, the release of loosely-sorbed P (r = 0.22, p < 0.05, Spearman) and Fe/Mn-bound P (r = 0.17, p < 0.05, Spearman) was more correlated with DO depletion. This could be a result of P compound formation change for P release with the acid adding under anoxic conditions (Nguyen and Maeda, 2016). Not sufficient acid addition could be the reason for no significant correlations found with pH changes.
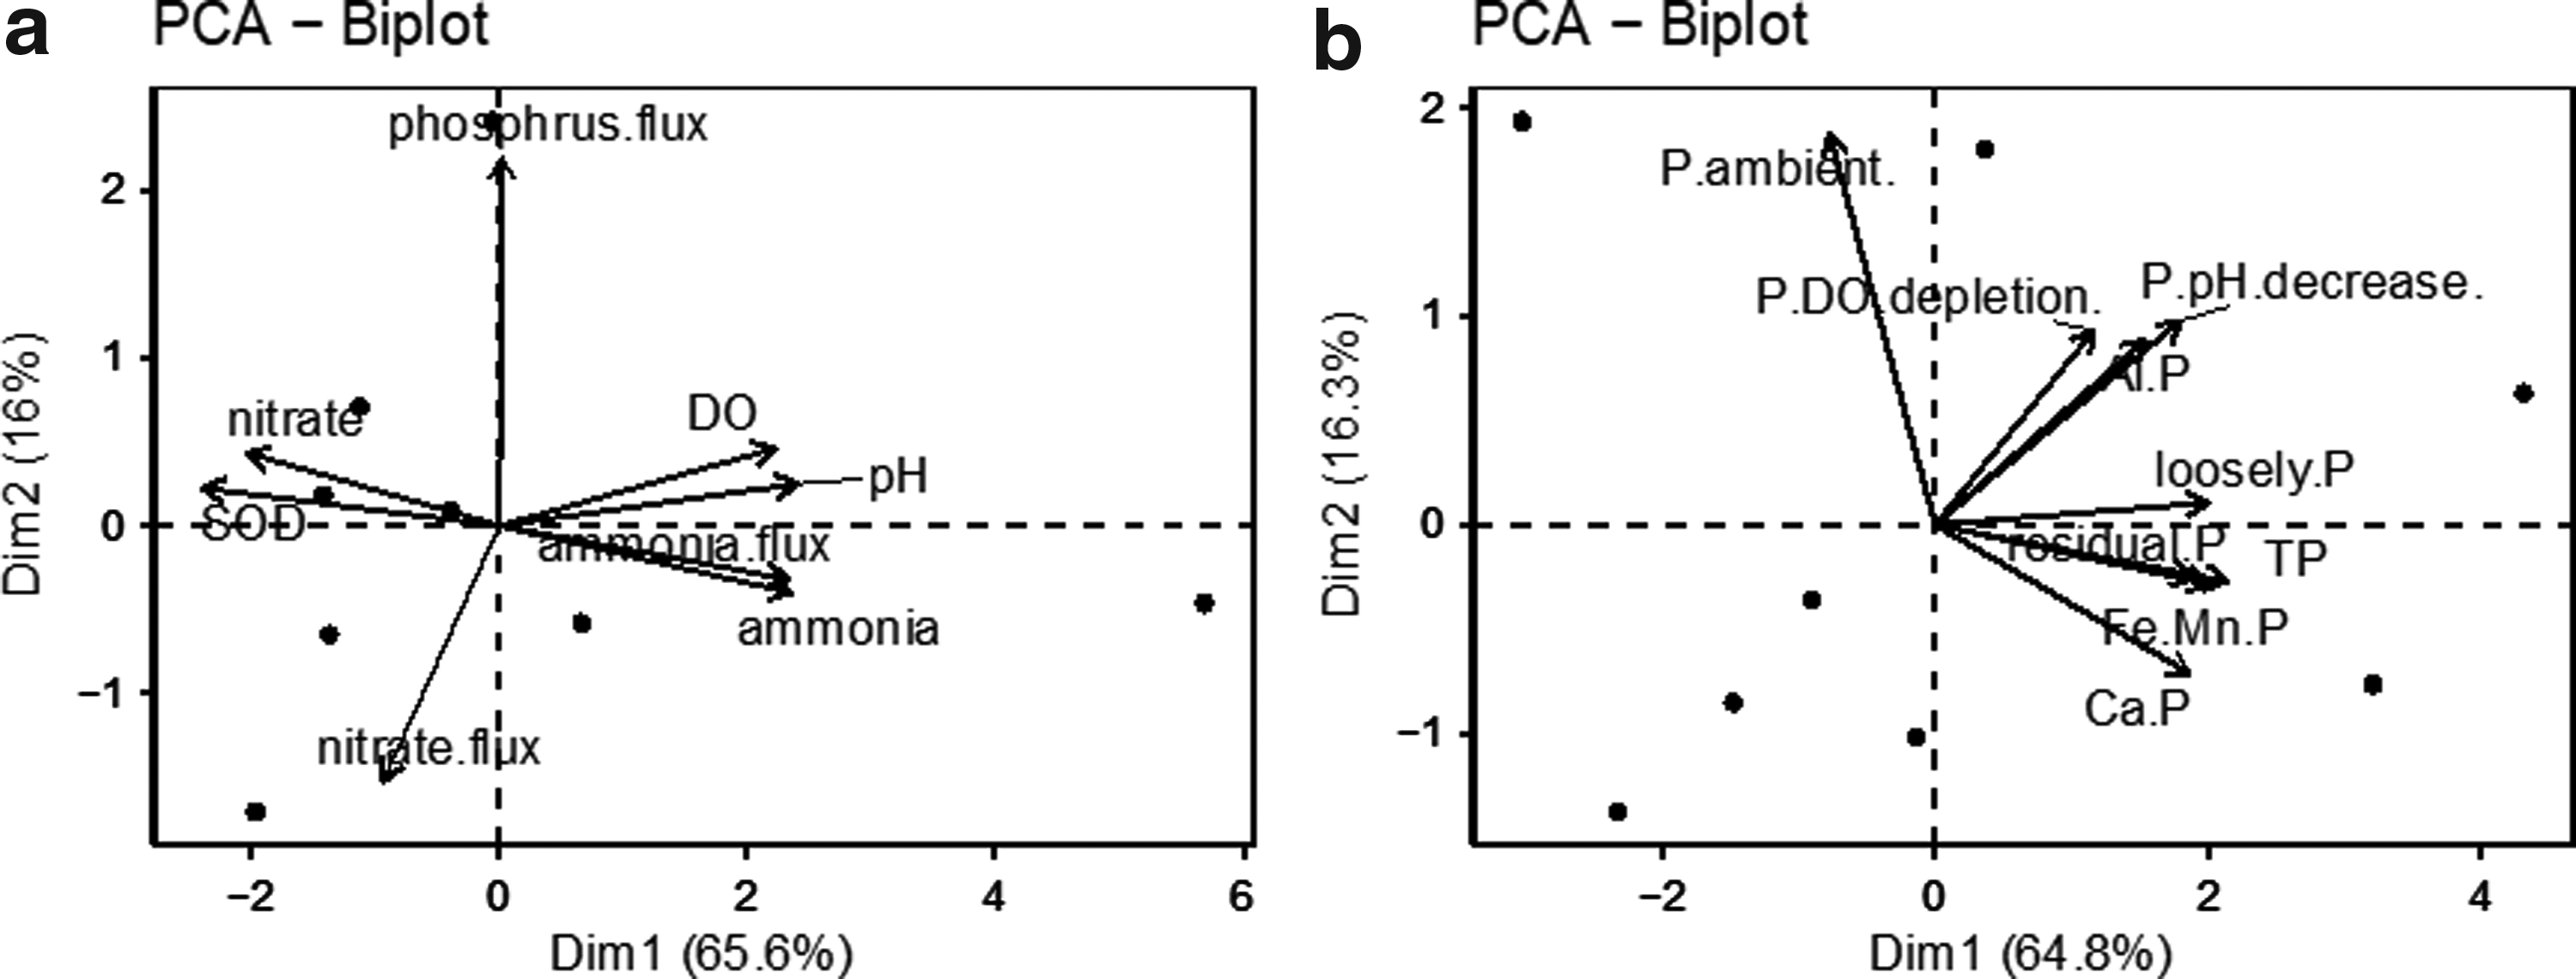
PCA analysis of environmental factors on nutrient flux.
Conclusions
Internal cycling of nutrients and SOD in Utah Lake was measured using SOD chambers. The effects of SOD on lake nutrient flux were found through the study. Provo Bay had the most productive sediment; SOD, nutrient flux, and sediment P content increased in the shallow areas near anthropogenic nutrient discharges. This research revealed that sediments released nutrients into the water column under both ambient conditions and changed DO/pH conditions. The following seven major factors were measured to evaluate the effects on nutrient flux: (1) the SOD, (2) pH and DO, (3) ambient nutrient conditions, (4) sediment mineral composition, (5) organic content, (6) total P content, and (7) P speciation. It was found that ammonia, rather than P, had the highest flux rates under ambient conditions in summer. In addition, the nutrient load that builds up in sediments in winter can contribute to nutrient fluxes in summer. By contrast, the release of P responded slightly more to pH-decrease conditions and correlated with sediment P characteristics. The study also suggested that the lake sediment was a biotic sink for external P loading, and the majority of P was combined with calcium. In addition, it revealed that the water column was nutrient limited for phytoplankton growth in late summer. Sediment nutrient flux could be a good source compensating water column nutrient limits and promoting phytoplankton growth. With significant phytoplankton respiration, the water column in Utah Lake was found to be responsible for the majority of the ambient oxygen demand, instead of the sediment. The settling and decay of phytoplankton would contribute to sediment organic content and nutrient cycling.
Most importantly, these results indicate the importance of implementing nutrient reduction strategies designed to decrease sediment nutrient content, nutrient flux, and water column phytoplankton biomass. Next, research needs to be conducted to compare the economic input and outcome of the nutrient-reduction strategies. This would determine the feasibility of implementing such strategies. In addition, the methods used in this study could be applied to study similar shallow alkaline lakes with nutrient-rich sediment.
Footnotes
Acknowledgments
This study was supported by a research grant from the Utah Division of Water Quality. The authors greatly appreciate their support. The views expressed in this article are those of the authors and do not necessarily reflect the opinions of the funding agency.
Author Disclosure Statement
No competing financial interests exist.