
Abstract
Abstract
Fixed-bed columns filled with modified corn stalk (CS-AE) were developed to remove Cr(VI) from aqueous solution and electroplating wastewater. Effects of height–diameter ratio (H/D), flow rate, and Cr(VI) concentration on breakthrough curves were investigated, and different models were adopted to describe the dynamic adsorption performance. Experimental results showed that both breakthrough time and exhaustion time increased with the increase of bed H/D and with the decrease of flow rate and influent Cr(VI) concentration. Thomas model agreed well with experimental data under different conditions, and the rate constant kTh increased with the increase of flow rate and with the decrease of initial Cr(VI) concentration and H/D, whereas the dynamic adsorption capacity q0 showed a reverse trend. At suitable operation conditions (H/D 3.75 and flow rate 15 min/L), q0 could reach 55.4 mg/g and kTh was in range of 8.6–10 × 10−4 mL/[min·mg]. The CS-AE column can be easily regenerated by 1.0 M HCl in about 20 min. It was found that Cr(VI) was partially reduced to Cr(III) in CS-AE column, which also showed ability to retain Cr(III) ions. The breakthrough time of sulfate ion (30 min) was much shorter than that of Cr(VI) (80 min) in experiment with electroplating wastewater, suggesting that CS-AE column has the potential to selectively remove Cr(VI) under real wastewater conditions.
Introduction
Widespread use of chromium in modern industry, such as electroplating, leather tanning, and textile dying, generated large volumes of Cr-containing wastewater (Miretzky and Cirelli, 2010; Barrera-Díaz et al., 2012). In aqueous solution, Cr exists mainly in two oxidation states, including hexavalent Cr (Cr(VI)) and trivalent Cr (Cr(III)). Cr(VI) is considered highly toxic, carcinogenic, and mutagenic while the toxicity of Cr(III) is much lower than that of Cr(VI) (Ral et al., 1989; Jain et al., 2013). The discharge of Cr(VI)-containing wastewater is strictly regulated worldwide. For example, the permissible level of Cr(VI) content in wastewater is 0.5 mg/L according to Integrated Wastewater Discharge Standard of China. Therefore, it is necessary to remove Cr(VI) from Cr-containing wastewater as preferential pollutant.
The most popular way for Cr(VI) removal is chemical reduction–precipitation technology (Barrera-Díaz et al., 2012). Various methods have been developed to remove Cr(VI) from wastewater, such as coagulation (Lu et al., 2016), microbial treatment (Singh et al., 2011), membrane separation (Korus and Loska, 2009), freeze desalination (Melak et al., 2016), photocatalytic reduction (Marinho et al., 2017), solvent extraction, constructed wetland (Liu et al., 2014), ion exchange (Cao et al., 2013), and adsorption (Natale et al., 2015). However, high cost and secondary pollution remain challenges by now.
Biosorption based on low-cost biomaterial is considered economically favorable to separate Cr(VI) from aqueous solutions (Gadd, 2009; Hlihor et al., 2017). A lot of biomaterials, such as rice straw (Cao et al., 2013), wheat straw (Yao et al., 2016), sunflower stem and head biomass (Jain et al., 2013), coconut coir pith (Suksabye et al., 2008), green tea waste, oak leaf, walnut shell, peanut shell, rice husk (Park et al., 2008), and fungal biomass (Deng and Ting, 2005), have been studied for Cr(VI) removal. Cellulosic biomass could be chemically modified into anion adsorbent by introducing positive-charged groups such as amine and quaternary ammonium groups into cellulose structure (Gao et al., 2009). In our previous study, a strong basic anion exchanger has been prepared from corn stalk, which exhibited high Cr(VI) removal performance in batch adsorption experiments (Cao et al., 2018).
Although biosorption of Cr(VI) was proposed years ago, there are little reports of practical application until now. To narrow the gap, plenty of column adsorption studies with different biomaterials are needed in our opinion. Column experiments are helpful to understand the dynamic adsorption performance of Cr(VI) on biosorbent and to obtain parameters related to process design. Previous studies on Cr(VI) biosorption claimed that column adsorption of Cr(VI) was affected by initial Cr(VI) concentrations, bed depth, flow rate, and pH, and the breakthrough curves can be predicted by models such as Thomas model and Bohart–Adams model (Kumar and Chakraborty, 2009; Chen et al., 2012). However, the regeneration of biosorbent column and the selectivity of Cr(VI) were rarely discussed, which are important for the practical utilization of biosorbent. However, it has been found in batch adsorption experiment that Cr(VI) was reduced to Cr(III) on surface of biosorbent, which plays a role in removal mechanism of Cr(VI). In case of dynamic adsorption, it was not known yet that whether reduction transformation of Cr(VI) occurs and how does the yielded Cr(III) flow out.
In this study, biosorbent corn stalk based anion exchanger (CS-AE) that was previously prepared from corn stalk was used to pack a fixed-bed column. The effects of height–diameter ratio (H/D), influent Cr(VI) concentration, and flow rate on breakthrough curves were investigated. The Thomas model, bed depth service time (BDST) model, and Bohart–Adams model were used to analyze the breakthrough curves and to calculate the dynamic adsorption parameters. The regeneration performance of CS-AE column was tested in adsorption–desorption cycles. The reduction of Cr(VI) to Cr(III) was determined both with artificial Cr(VI) solution and real electroplating wastewater. Breakthrough curves of sulfate ion and Cr(VI) were measured simultaneously in experiment with electroplating wastewater to evaluate the selectivity of CS-AE column to Cr(VI) under conditions of complicated water quality.
Materials and Methods
Raw materials and chemicals
Raw corn stalk was collected from Yunyang, Hubei province, China. All the primary chemicals in this study were purchased from Sinopharm Chemical Reagent Co. Ltd (Shanghai, China). The stock solution of Cr(VI) was prepared by dissolving a certain weight of dried K2Cr2O7 in deionized water. Cr(VI) solutions of different concentrations were diluted from this stock solution. Hydrochloric acid (0.1 M) was used to adjust the pH of the Cr(VI) solution. All the reagents were of analytical grade.
Preparation of CS-AE
Biosorbent CS-AE was prepared by using a chemical modification method that was reported in our previous study (Cao et al., 2016). Raw corn stalk was washed with tap water followed by deionized water. After being dried at 60°C, it was grinded and sieved to obtain particles with size from 0.2 to 0.9 mm. Corn stalk particles (50 g) were treated with 10% (w/v) NaOH solution to improve the reactivity of cellulose in biomass. After removal of water, the above product was mixed with 500 mL epichlorohydrin in a four-neck flask. This mixture was stirred for 6 h at 65°C to obtain epoxypropyl cellulose. Then, excess epichlorohydrin was removed from reaction system, and 500 mL of 33% trimethylamine solution was added into the flask for quaterization reaction that lasted for 3 h at 80°C. The product was collected and subsequently washed with 1:1 ethanol and 0.1 M HCl solution to convert it into chloride-loaded form. The final product as anion exchanger, CS-AE, was rinsed with plenty of deionized water and dried at 60°C in an oven to a constant weight. According to previous study (Cao et al., 2016), quaternary ammonium and hydroxyl groups are the dominant groups in CS-AE surface, and the former provides adsorption sites for anionic species.
Column adsorption experiments
The fixed-bed column was developed by using a laboratory-scale glass tube that has a sand core plate at bottom to prevent the loss of CS-AE adsorbent. Multichannel peristaltic pump was employed to deliver Cr(VI) solution into the head of column under room temperature, and effluent water was collected from the bottom outlet. The effects of bed H/D, flow rate, and initial Cr(VI) concentration on Cr(VI) breakthrough curves were measured.
Effect of H/D. There were three columns with different internal diameters (20, 25, and 30 mm). Each column was filled with 3.0 g CS-AE adsorbent. The heights were recorded and the column H/D was calculated as 3.75, 2.68, and 1.43, respectively. Cr(VI) breakthrough curves were measured at flow rate of 15 mL/min and influent Cr(VI) concentration of 50 mg/L.
Effect of influent Cr(VI) concentration. Cr(VI) solutions with different concentrations (25, 50, and 75 mg/L) were respectively pumped into three columns, which have same adsorbent mass (3.0 g) and H/D value (3.75). Cr(VI) breakthrough curves were determined at flow rate of 15 mL/min.
Effect of flow rate. The flow rates of three columns were controlled at 10, 15, and 20 mL/min, respectively. Columns have same adsorbent mass (3.0 g), H/D value (3.75), and influent Cr(VI) concentration(50 mg/L).
Breakthrough and exhaustion time was defined as the effluent Cr(VI) concentration reached 5% and 95% of influent Cr(VI) concentration, respectively. Based on mass balance principle, the experimental dynamic adsorption capacity (q0,exp) can be calculated by using Equation (1).
where Q (mL/min) is the volumetric flow rate; C0 is Cr(VI) concentrations of influent water; Cn and Cn+1 (mg/L) are the effluent Cr(VI) concentration at tn and tn+1 (min) readings, respectively; and m (g) is mass of adsorbent packed in the column.
Column regeneration experiments
A fixed-bed column was prepared by using 3.0 g CS-AE biosorbent, and its H/D value was 3.75. For adsorption step, Cr(VI) solution of 75 mg/L was pumped into the column at flow rate of 15 mL/min. After saturation, the column was in situ regenerated by 1.0 M HCl solution at flow rate of 10 mL/min. The regeneration operation was repeated for three times, and the adsorption was conducted for four times. The adsorption breakthrough curves and desorption curves were obtained, respectively.
Column adsorption experiment with real electroplating wastewater
The real-world electroplating wastewater was collected from an electroplating product factory (Lota Group) in Xiamen, Fujian Province, China. The original wastewater quality was analyzed before column adsorption experiment. A fixed-bed column was prepared by using 5.0 g CS-AE biosorbent, which was packed into a glass tube with internal diameter of 20 mm. Electroplating wastewater was pump into the column at flow rate of 10 mL/min until effluent Cr(VI) concentration reached 95% of initial level. Cr(VI), Cr(III), and sulfate ion in effluent samples were determined to evaluate the potential of CS-AE for practical application.
Modeling analysis of breakthrough curves
In this work, the Thomas model, Bohart–Adams model, and BDST model were employed to analyze experimental Cr(VI) breakthrough curves.
Thomas model. It was based on the assumption that adsorption process follows Langmuir kinetics without axial dispersion (Chen et al., 2012). In addition, the rate-driving force obeys second-order reversible reaction kinetics. The linear form of the model is presented by Equation (2).
where kTh (mL/[min·mg]) is the Thomas rate constant; Q (mL/min) is the flow rate; q0 (mg/g) is the dynamic adsorption capacity; m (g) is the mass of adsorbent; and t (min) is operation time. The model constants, kTh and q0, can be calculated by plotting ln(Ct/C0 − 1) against t.
Bohart–Adams model. This model describes the relationship between Ct/C0 and t in a continuous system. Presupposition of the model is that adsorption equilibrium is not instantaneous, and the rate of adsorption is proportional to both the residual capacity and the concentration of adsorbate. The simplified linear equation of the model is shown in Equation (3) (Baral et al., 2008).
where k BA is the kinetic constant (L/[mg·min]); N0 is the volume adsorption capacity (mg/L); Z is the bed height (cm); C0 and Ct (mg/L) are Cr(VI) concentrations of influent and effluent solution at time t, respectively; and u is the superficial velocity(cm/min). Bohart–Adams model usually are applied for initial stage of breakthrough curve, and in this work, the data range for modeling analysis was selected from the beginning to the time when the effluent Cr(VI) concentration reached 20% of initial concentration. Accordingly, kBA and N0 can be calculated by plotting ln(Ct/C0) against t.
The BDST model. In a fixed-bed column, time before the column get breakthrough point is the BDST (t). The BDST model assumes that intra-particular diffusion and external mass transfer resistance are negligible, and the rate of the adsorption is controlled by the reaction between adsorbate and adsorbent. The mathematic equation of the BDST model is shown in Equation (4) (Kundu and Gupta, 2005).
where ka (L/[mg·min]) is the kinetic constant, and the parameters N0, Z, C0, Ct, and u have the same meanings with that in Equation (3).
Chemical analysis
Cr(VI) in aqueous solution was determined by using ultraviolet (UV)-visible spectrophotometer (TU-1901, PERSEE, China) at λ 540 nm after reacting with 1,5-diphenylcarbazide (Marinho et al., 2017). Cr(III) concentration was also measured when there is a need. The difference between total Cr and Cr(VI) concentration was used as Cr(III) concentration. Total Cr concentration was determined by using inductively coupled plasma optical emission spectrophotometer (ICP-OPTIMA 5000; PerkinElmer) (Pehlivan and Cetina, 2009). To analyze water quality of electroplating wastewater, CODCr, NH3-N, total nitrogen, Cu, Zn, Ni, and sulfate concentration were also determined by using methods such as atomic adsorption spectroscopy (PinAAcle 900; PerkinElmer), ion chromatography (930 Compact IC Flex; Metrohm, Switzerland), and UV-visible spectrophotometer (TU-1901; PERSEE, China).
Results and Discussion
Effect of H/D on breakthrough curve
The breakthrough curves obtained at different H/D ratios are shown in Fig. 1. As shown, both the breakthrough time (tb) and exhaustion time (te) increased with the increase of H/D ratio. Moreover, the experimental Cr(VI) adsorption capacities (q0,exp) were calculated to be 29.04, 39.57, and 50.08 mg/g at H/D of 1.43, 2.68, and 3.75, respectively. This result showed that larger H/D led to better removal of Cr(VI) by CS-AE column under certain adsorbent dose. To understand the effect of column H/D on breakthrough curves, contact time and hydraulic condition need to be considered. First, the fixed-bed with larger H/D ratio had greater bed depth, resulting relatively sufficient contact time for Cr(VI) adsorption when influent water passed through the column, whereas the column with smaller H/D has shorter contact time between adsorbent and Cr(VI) ions, which led to a smaller Cr(VI) adsorption capacity. Second, column with lower H/D value has larger diameter and cross-sectional area that are disadvantages to even distribution of water (Chen et al., 2012). As a result, decrease of breakthrough time and dynamic Cr(VI) adsorption capacity were observed at lower H/D condition. Furthermore, the slope of breakthrough curve reflects the height of mass transfer zone (adsorption zone) in a fixed-bed column, and the larger the slope, the narrower the mass transfer zone (Chen et al., 2012). In this study, the slope of breakthrough curve at H/D of 1.43 was obviously lower than that of H/D of 2.68 and 3.75, implying that higher H/D ratio resulted narrower mass transfer zone, which favored the column adsorption operation. Generally, the bed H/D has significant effect on the breakthrough curve, and the H/D ratio of 3.75 offered an optimum Cr(VI) removal under experimental conditions. It should be pointed out that the filtration resistance will enhance with the increase of the H/D ratio, which have to be considered in practical utilization.
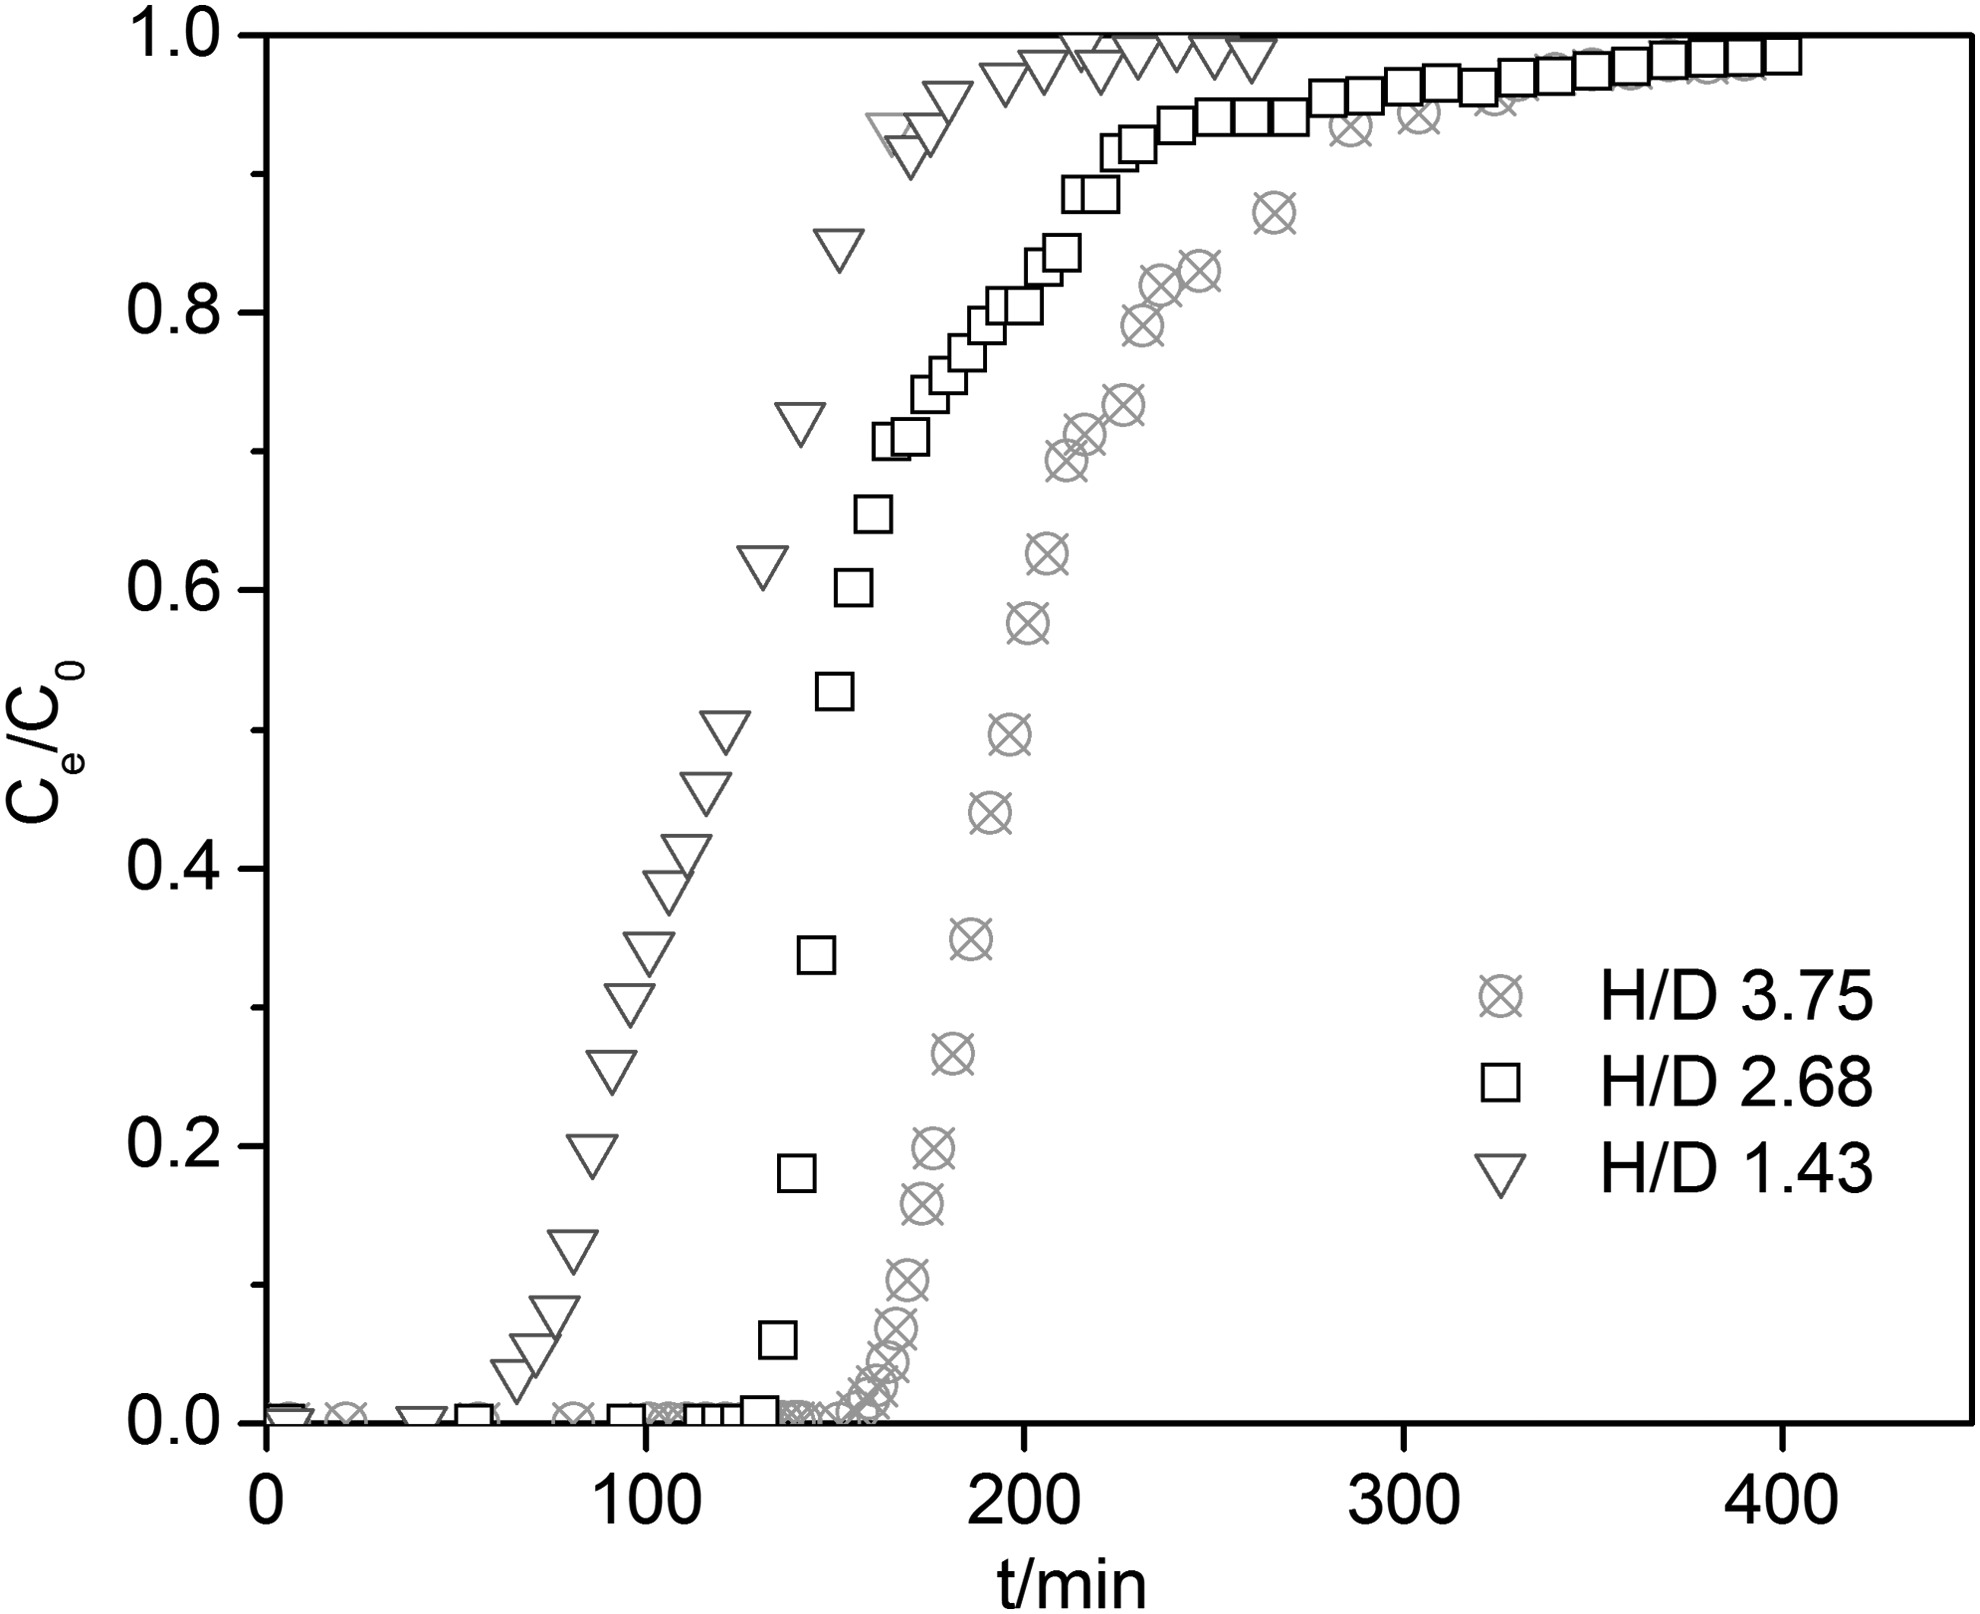
Effect of height–diameter ratio on breakthrough curves of Cr(VI).
Effect of influent Cr(VI) concentration on breakthrough curve
Breakthrough curves at different influent Cr(VI) concentrations are plotted in Fig. 2. It showed that both tb and te decreased as the influent Cr(VI) concentration increased from 25 to 75 mg/L. This may be due to the fact that higher concentration generates greater concentration gradient, which could enhance the mass transport rate during adsorption process (Chen et al., 2011). As a result, CS-AE biosorbent in the bed was faster saturated at higher influent Cr(VI) concentrations. Moreover, the q0,exp observed from breakthrough curves was 54.98, 50.57, and 43.04 mg/g at initial Cr(VI) of 75, 50, and 25 mg/L, respectively. It meant that better adsorption was achieved at higher influent Cr(VI) concentration. This result agreed with previous reported study (Chen et al., 2012), and it can be attributed to that higher Cr(VI) concentration provided larger driving force for adsorption process, rendering that more Cr(VI) ions occupied adsorption sites on CS-AE during a relatively shorter period. In addition, the breakthrough curve became sharper along with the increase of influent Cr(VI) concentration. According to the relation between breakthrough curve slope and adsorption zone, it can be inferred that the height of mass transfer zone decreased as Cr(VI) concentration increased.

Effect of influent Cr(VI) concentration on breakthrough curves of Cr(VI).
Effect of flow rate on breakthrough curve
The breakthrough curves of different flow rates are presented in Fig. 3. It is obvious that both tb and tb decreased as the flow rate increased from 10 to 20 mL/min. It can be explained by the change of empty bed contact time (EBCT). As the flow rate increased from 10 to 20 mL/min, EBCT correspondingly decreased from 2.2 to 1.1 min, which led to an insufficient contact between Cr(VI) ion and CS-AE biosorbent at higher flow rate condition. The q0,exp was decreased from 53.55 to 42.03 mg/g along with the increase of flow rate. Additionally, the slope of breakthrough curve became larger as the flow rate increased, suggesting that the adsorption zone tended to be narrower as flow rate increased. The main reason was that higher flow rate led to higher water flow velocity and thinner liquid film around the adsorbent particle, which decreased the resistance of external film mass transfer (Chen et al., 2012). Considering that high flow rate could increase filtration resistance and decrease Cr(VI) adsorption capacity, 15 min/L (EBCT 1.5 min) may be the optimal flow rate for the experimental columns.
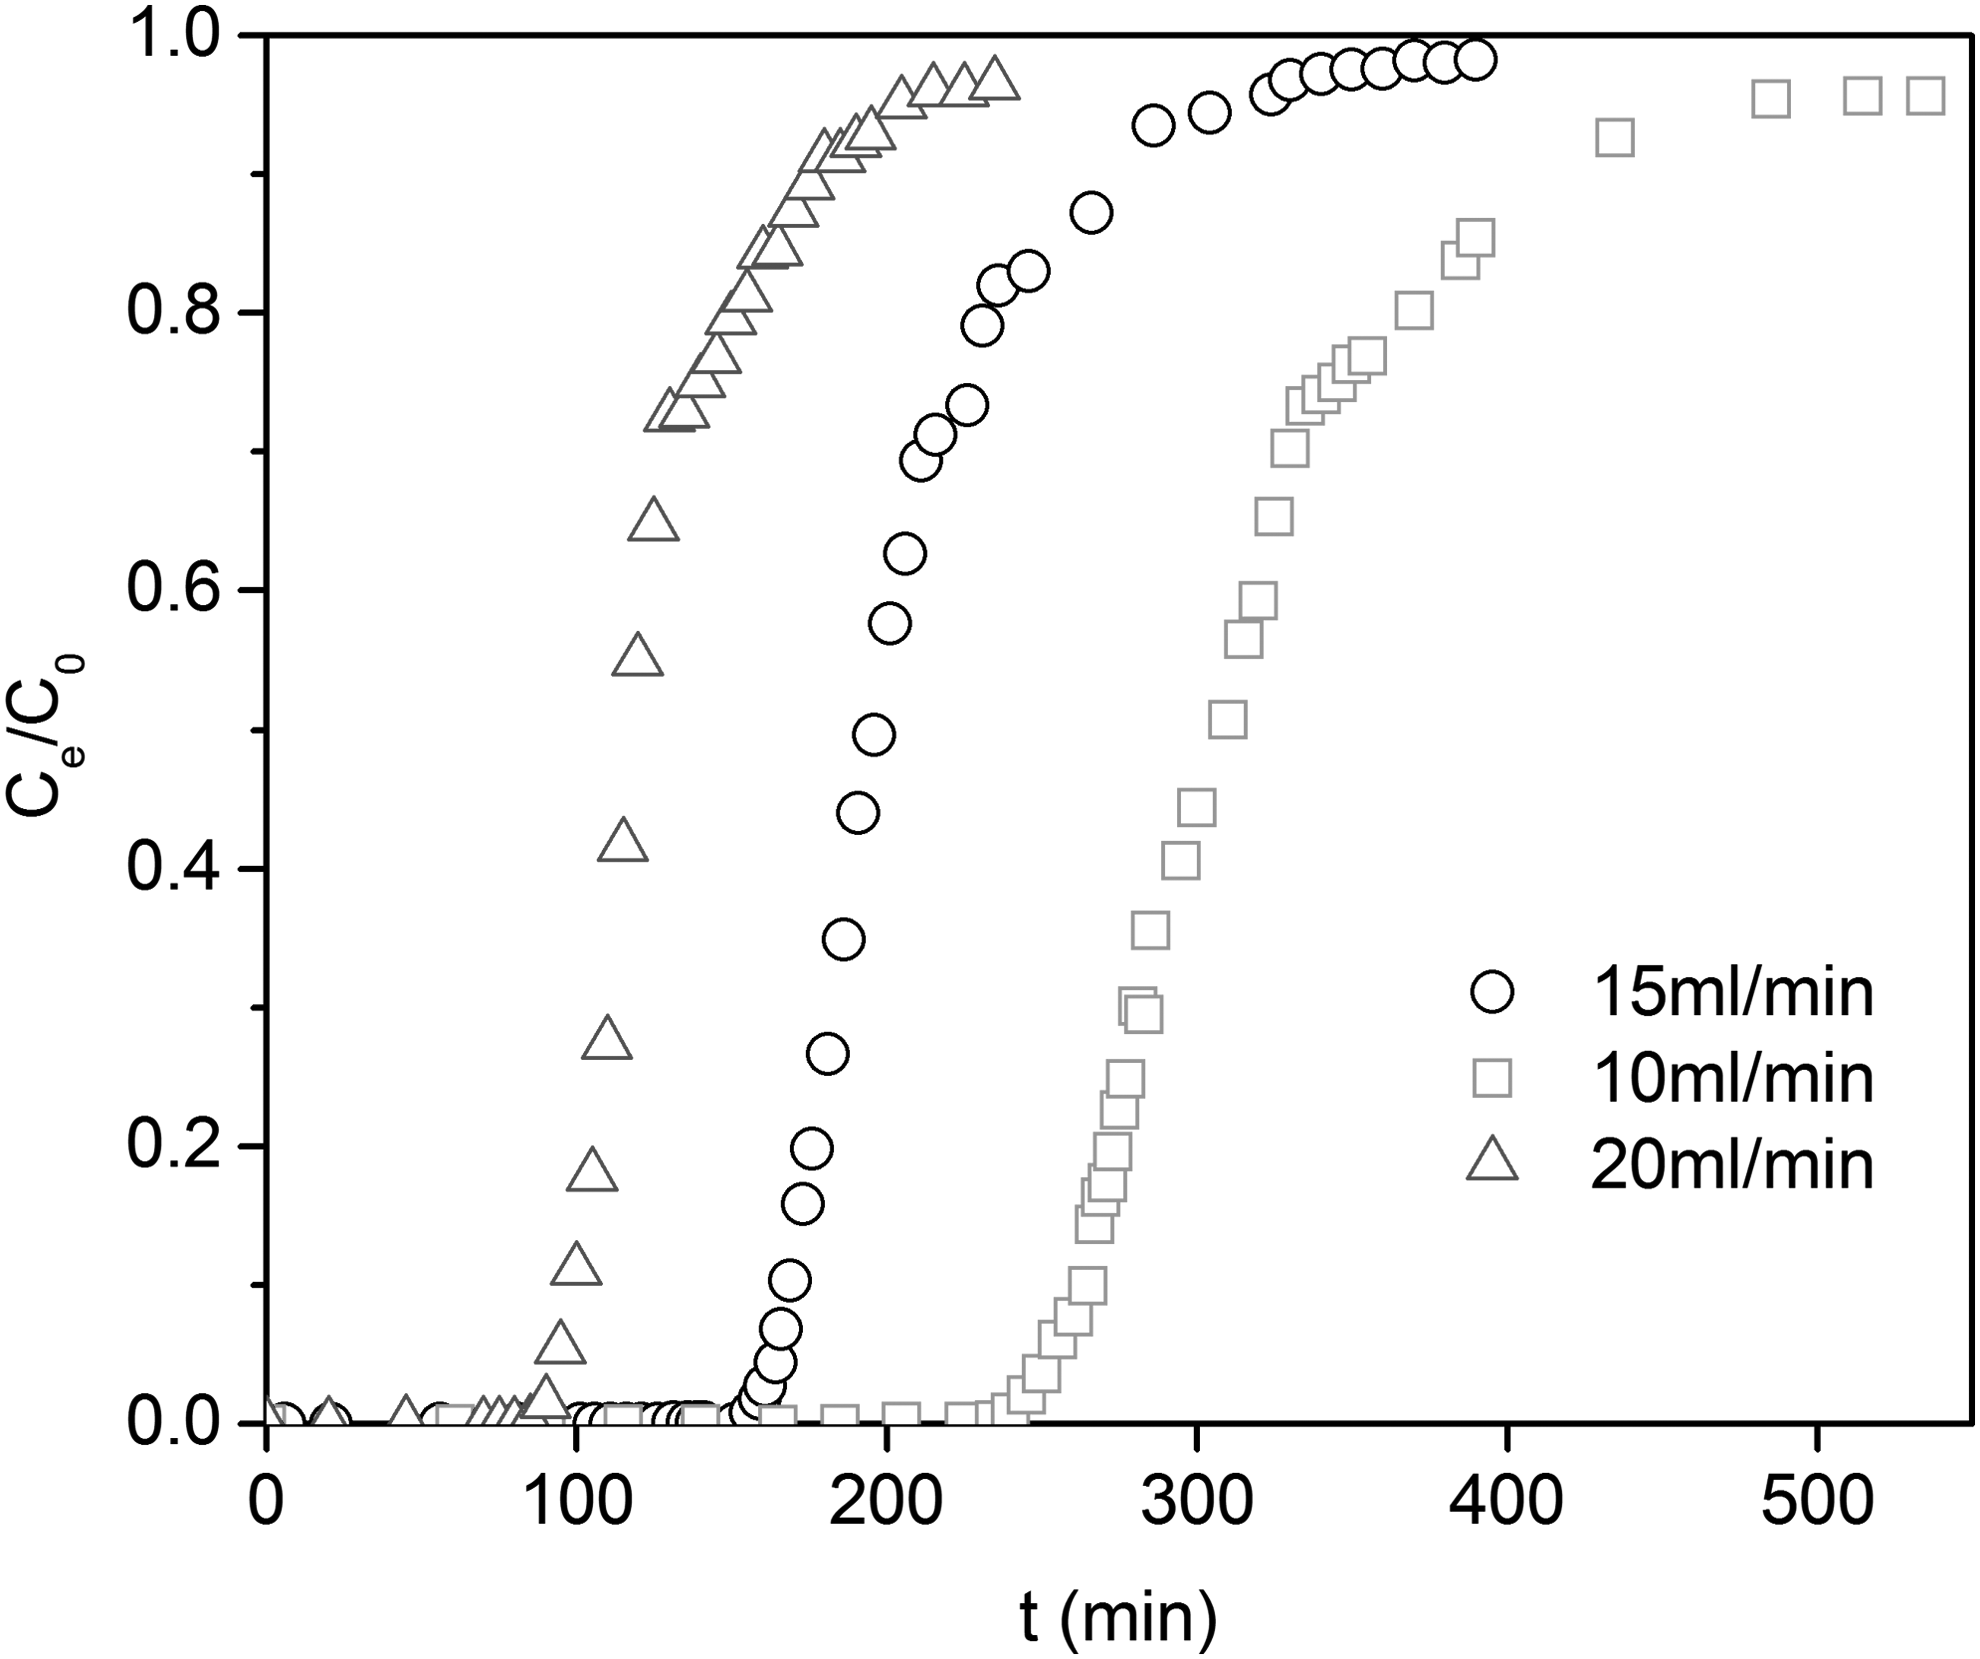
Effect of flow rate on breakthrough curves of Cr(VI).
Modeling analysis of breakthrough curves
Various mathematical models have been used to analyze breakthrough curve from a fixed-bed column and to calculate kinetic constants and uptake capacities (Chen et al., 2012). In this study, the Thomas model, Bohart–Adams model, and BDST model were employed to analyze Cr(VI) breakthrough curves obtained at different conditions. The analysis result of the Thomas model and the related parameters are presented in Table 1. The correlation coefficients (R2) were distributed between 0.809 and 0.987 for all experimental breakthrough curves, which suggested that good fittings were obtained with the Thomas model. This was also indicated by the fact that the calculated dynamic adsorption capacities (q0,cal) from the model were very close to the experimental values (q0,exp). The successful application of the Thomas model to Cr(VI) breakthrough curves indicated that diffusion process of Cr(VI) was not the limiting step of the dynamic adsorption process (Aksu and Gonen, 2004). As shown in Table 1, the Thomas rate constant kTh increased with the increase of flow rate and with the decrease of initial Cr(VI) concentration and H/D ratio, whereas the adsorption capacity q0 showed a reverse trend in contrast to kTh. This result suggested that it had to find a balance between dynamic adsorption rate and uptake capacity in the process design of biosorption.
Parameters of Thomas Model for Column Adsorption of Cr(VI) by Corn Stalk Based Anion Exchanger
H/D, height–diameter ratio.
The analysis result of the Bohart–Adams model and the related parameters are presented in Table 2. It was found that the R2 exceeded 0.933 for all fittings of experimental breakthrough curves, which indicated that the Bohart–Adams model was suitable for initial stage of the column adsorption process and the kinetic was probably dominated by external mass transfer process (Chen et al., 2012). The rate constant kBA from the Bohart–Adams model increased with the increase of flow rate and with the decrease of initial Cr(VI) concentration and H/D ratio. This trend was consistent with the analysis result from the Thomas model. Although the Bohart–Adams model provides a simple and comprehensive approach to evaluate fixed-bed column test, its validity is limited to the initial stage of adsorption breakthrough curve (Aksu and Gonen, 2004).
Parameters of Bohart–Adams Model for Column Adsorption of Cr(VI) by Corn Stalk Based Anion Exchanger
The calculated parameters from the BDST model are summarized in Table 3. As shown, the R2 values were distributed from 0.848 to 0.982, suggesting that the BDST model fitted the breakthrough curves well. However, there were some differences between the breakthrough time calculated from the model (tb,cal) and the experimental ones (tb,exp). Sometimes, the deviation was more than 10%. Comparing the three models, the Thomas model can fit the entire breakthrough curve better, whereas for the initial part of breakthrough curve, the Bohart–Adams model was also suitable to predict dynamic performance of Cr(VI) adsorption in a fixed-bed column. Both the Thomas model and the Bohart–Adams model suggested that the dynamic adsorption rate constant increased with the increase of flow rate and with the decrease of initial Cr(VI) concentration and H/D ratio, whereas Cr(VI) uptake capacity showed a reverse trend.
Parameters of Bed Depth Service Time Model for Column Adsorption of Cr(VI) by Corn Stalk Based Anion Exchanger
Regeneration of the fixed-bed column
In situ regeneration of CS-AE column was conducted by using 1.0 M HCl to simulate the practical application process. The breakthrough curves from adsorption–regeneration cycles are shown in Fig. 4a. As shown, four adsorption breakthrough curves were very close to each other, which suggested that CS-AE column showed higher regeneration performance. This may be due to quaternary ammonium structure in surface of CS-AE, which made it more like a strong basic exchange resin (Gao et al., 2009; Cao et al., 2018). Cr(VI) concentration in the desorption elution was also measured along with time to obtain desorption curves, which are plotted in Fig. 4b. As shown, most of Cr(VI) ion were rapidly eluted from the column in about 20 min, and after 30 min, the effluent Cr(VI) content was lower than 1.0 mg/L. Thus, the column can be easily regenerated by 1.0 M HCl solution. The three desorption curves were very close to each other, which also indicated that there is little decrease in Cr(VI) removal during regeneration process. The good regeneration performance would improve the potential for practical application of CS-AE biosorbent.
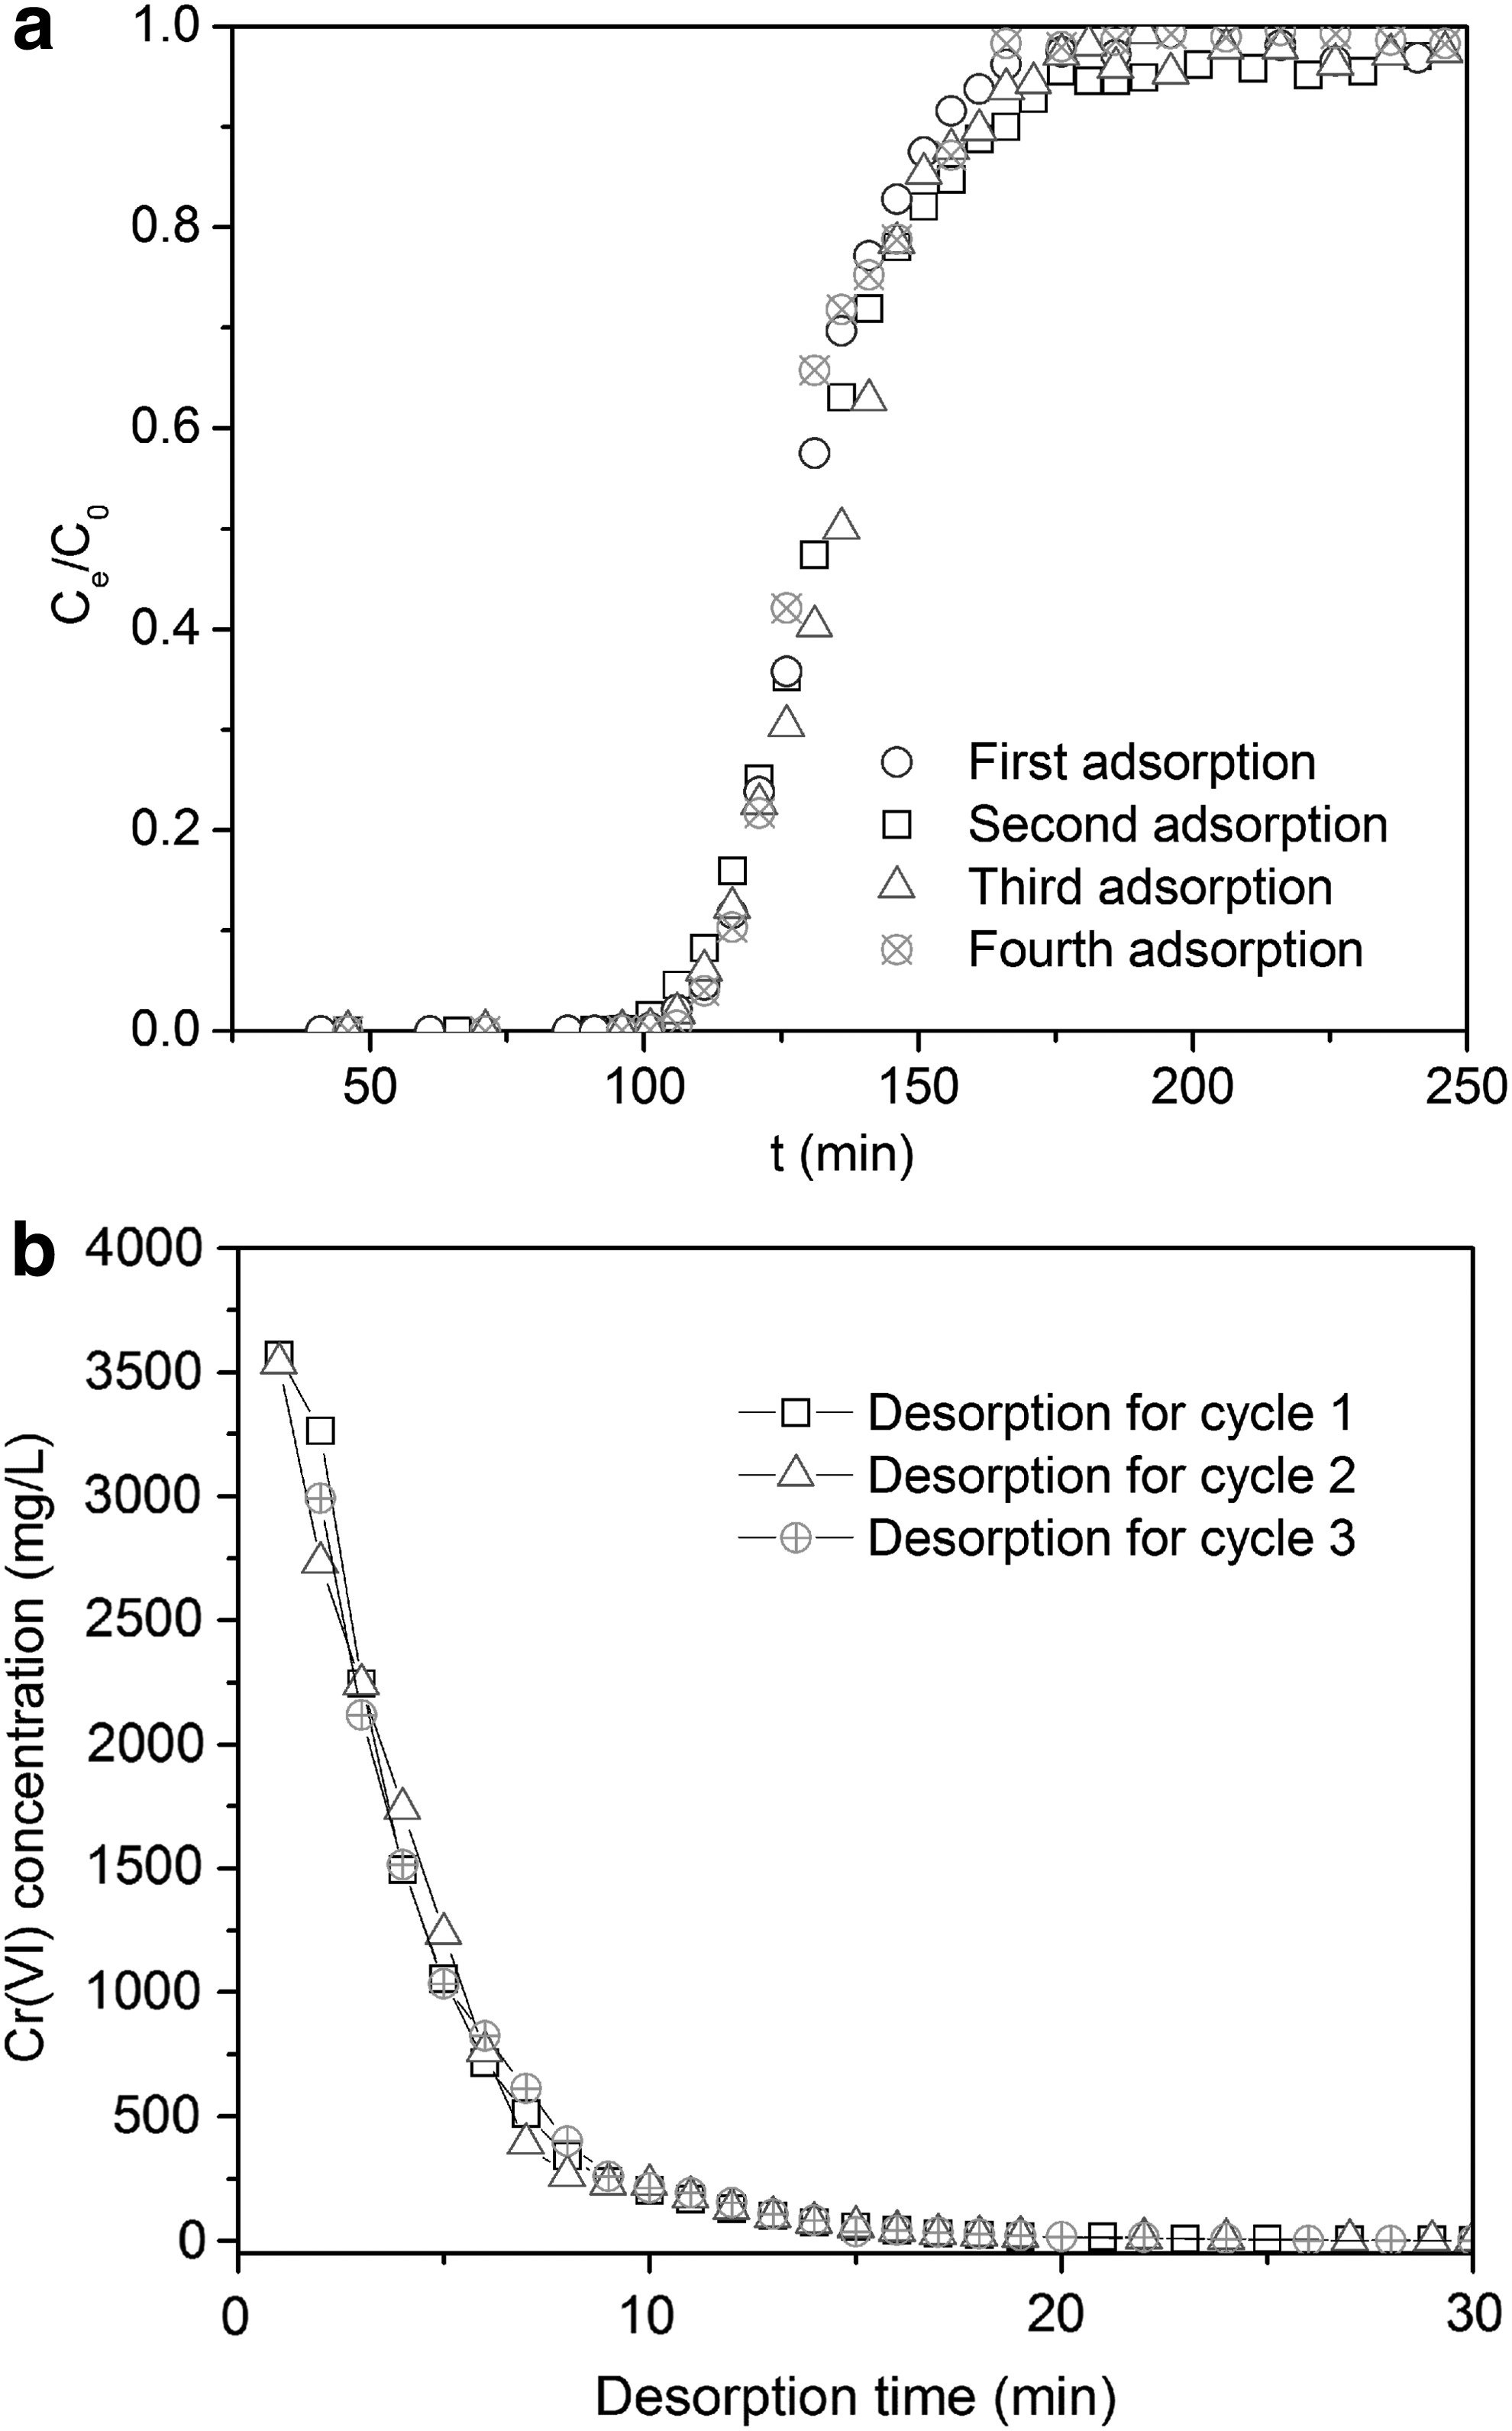
The breakthrough curves
Reduction of Cr(VI) to Cr(III) in fixed-bed column
As known, Cr(VI) possess a relatively high oxidative potential, which enable the redox reaction occurring between Cr(VI) and biomaterial with complicated surface groups (Deng and Ting, 2005; Yao et al., 2016). It was found in our previous study that part of Cr(VI) bound to CS-AE would be reduced to Cr(III) by electron donor groups such as amine and hydroxyl groups (Cao et al., 2018). Most studies about Cr(VI) reduction on biomaterial were conducted in batch adsorption experiment. In case of dynamic adsorption, however, there was little report about Cr(VI) reduction. In present study, both Cr(III) and Cr(VI) concentrations were measured in breakthrough curve experiments.
As shown in Fig. 5, Cr(III) was not found in column effluent during the initial stage, whereas it rose rapidly when Cr(VI) was breaking through the bed. After reaching the maximum value (3.5 mg/L), Cr(III) concentration decreased slowly to less than 1 mg/L. To explain this result, both Cr(VI) reduction and Cr(III) adsorption in column needed to be considered. Reduction of Cr(VI) was mainly decided by electron donor groups from surroundings, and after Cr(VI) reduction to Cr(III), the formed Cr(III) would be bound to acid groups in surface of biosorbent such as carboxyl and hydroxyl groups (Miretzky and Cirelli, 2010; Cao et al., 2018). Because CS-AE biosorbent also has the ability to adsorb Cr(III), there were enough blank adsorbent that would retain the formed Cr(III) inside the column until the adsorption zone reached the bottom of the bed. Thus, Cr(III) was not observed during the initial stage of outflow curve. The followed enhancement of Cr(III) concentration may be due to the competition adsorption of massive potassium ions, which came from potassium dichromate. Although trivalent ion usually was more easy to be adsorbed than monovalent ion in ion exchange process (Miretzky and Cirelli, 2010), large quantities of potassium ion could displace Cr(III) in the bed, suggesting that the accumulated Cr(III) were released during a period of short time. However, the redox reaction between Cr(VI) and biosorbent CS-AE was a long-lasting process (Cao et al., 2018). Therefore, Cr(III) was still detected in effluent after the column was exhausted, and its concentration (less than 1.0 mg/L in Fig. 5) possibly was depended on the equilibrium of the redox reaction. These results confirmed that Cr(VI) can also be reduced to Cr(III) by biosorbent during column adsorption process, and speciation transformation has to be considered in practical application of biosorption for Cr(VI) removal.
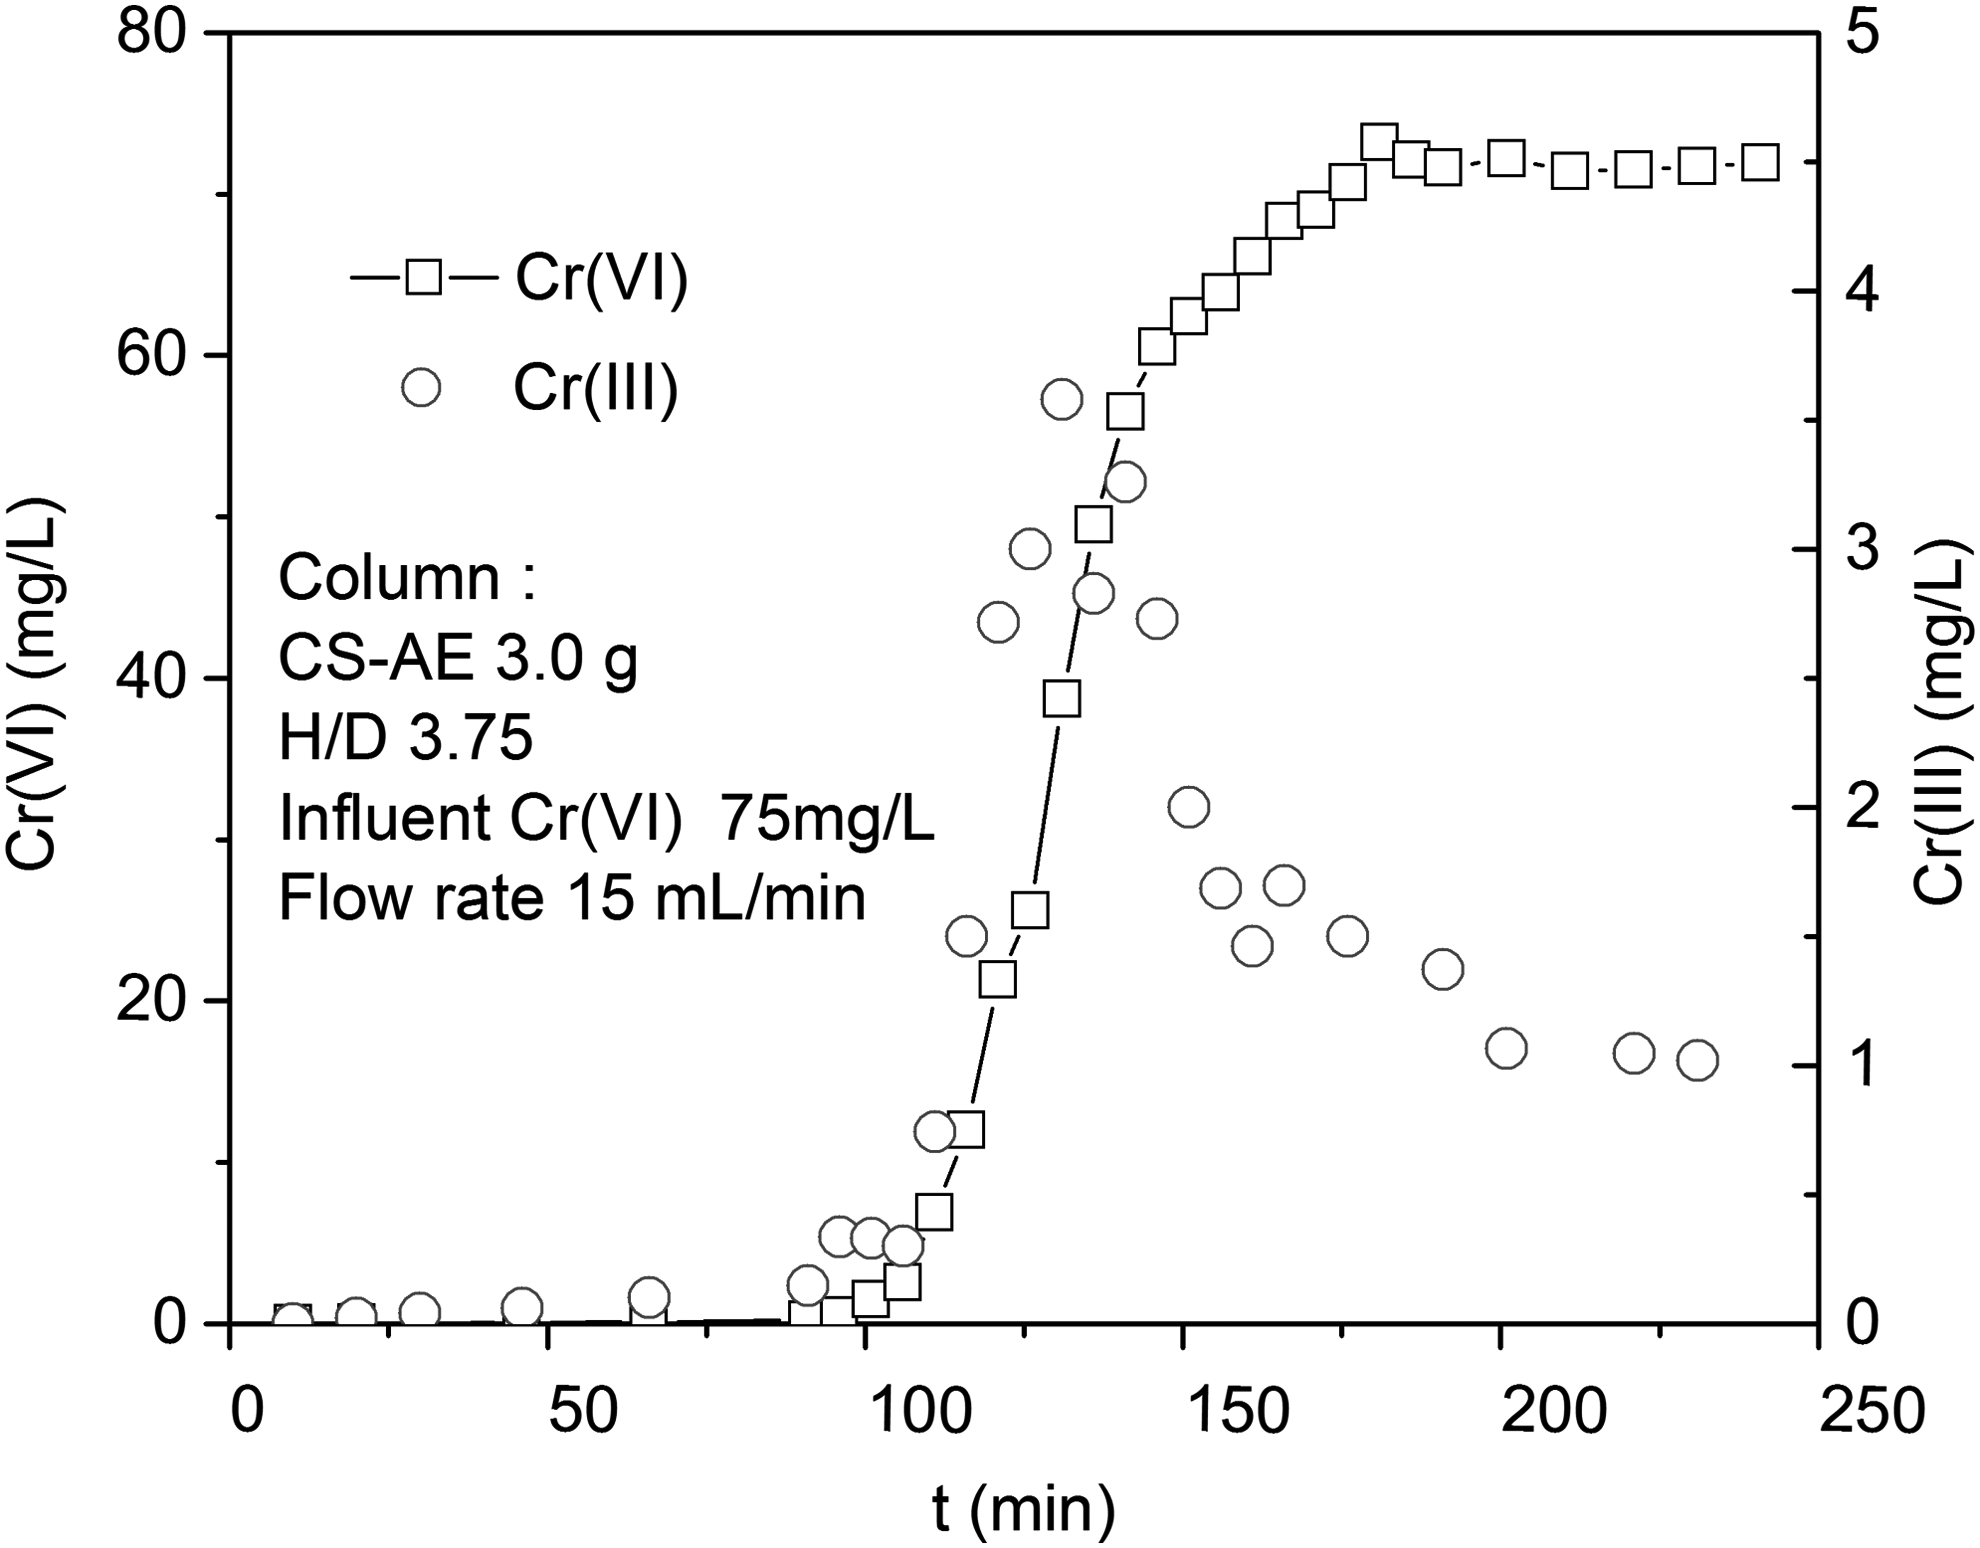
Reduction of Cr(VI) to Cr(III) in fixed-bed column of corn stalk based anion exchanger.
Column adsorption of Cr from real electroplating wastewater
To test the potential of CS-AE column for practical application, real electroplating wastewater from a factory was used as influent water in dynamic adsorption experiments. The water quality analysis result of the wastewater is summarized in Table 4. This electroplating wastewater contained both Cr(VI) and Cr(III). Besides, it had many other anions (SO42−, Cl−, NO3−, NO2−) and ions (Ni2+,Cu2+, Zn2+), which may affect the removal of chromium through competitive adsorption. The breakthrough curves (or outflow curve) of Cr(VI), total Cr, Cr(III), and SO42− are shown in Fig. 6. It can be seen that the tb and te of Cr(VI) were about 80 and 130 min, respectively. The dynamic adsorption capacity of Cr(VI) was calculated as 43.76 mg/g, which was a little lower in contrast to experimental result of artificial Cr(VI) solutions. This may be due to the competitive adsorption of coexisting anions in electroplating wastewater for the positively charged quaternary ammonium groups as adsorption sites in surface of CS-AE (Rapti et al., 2016).
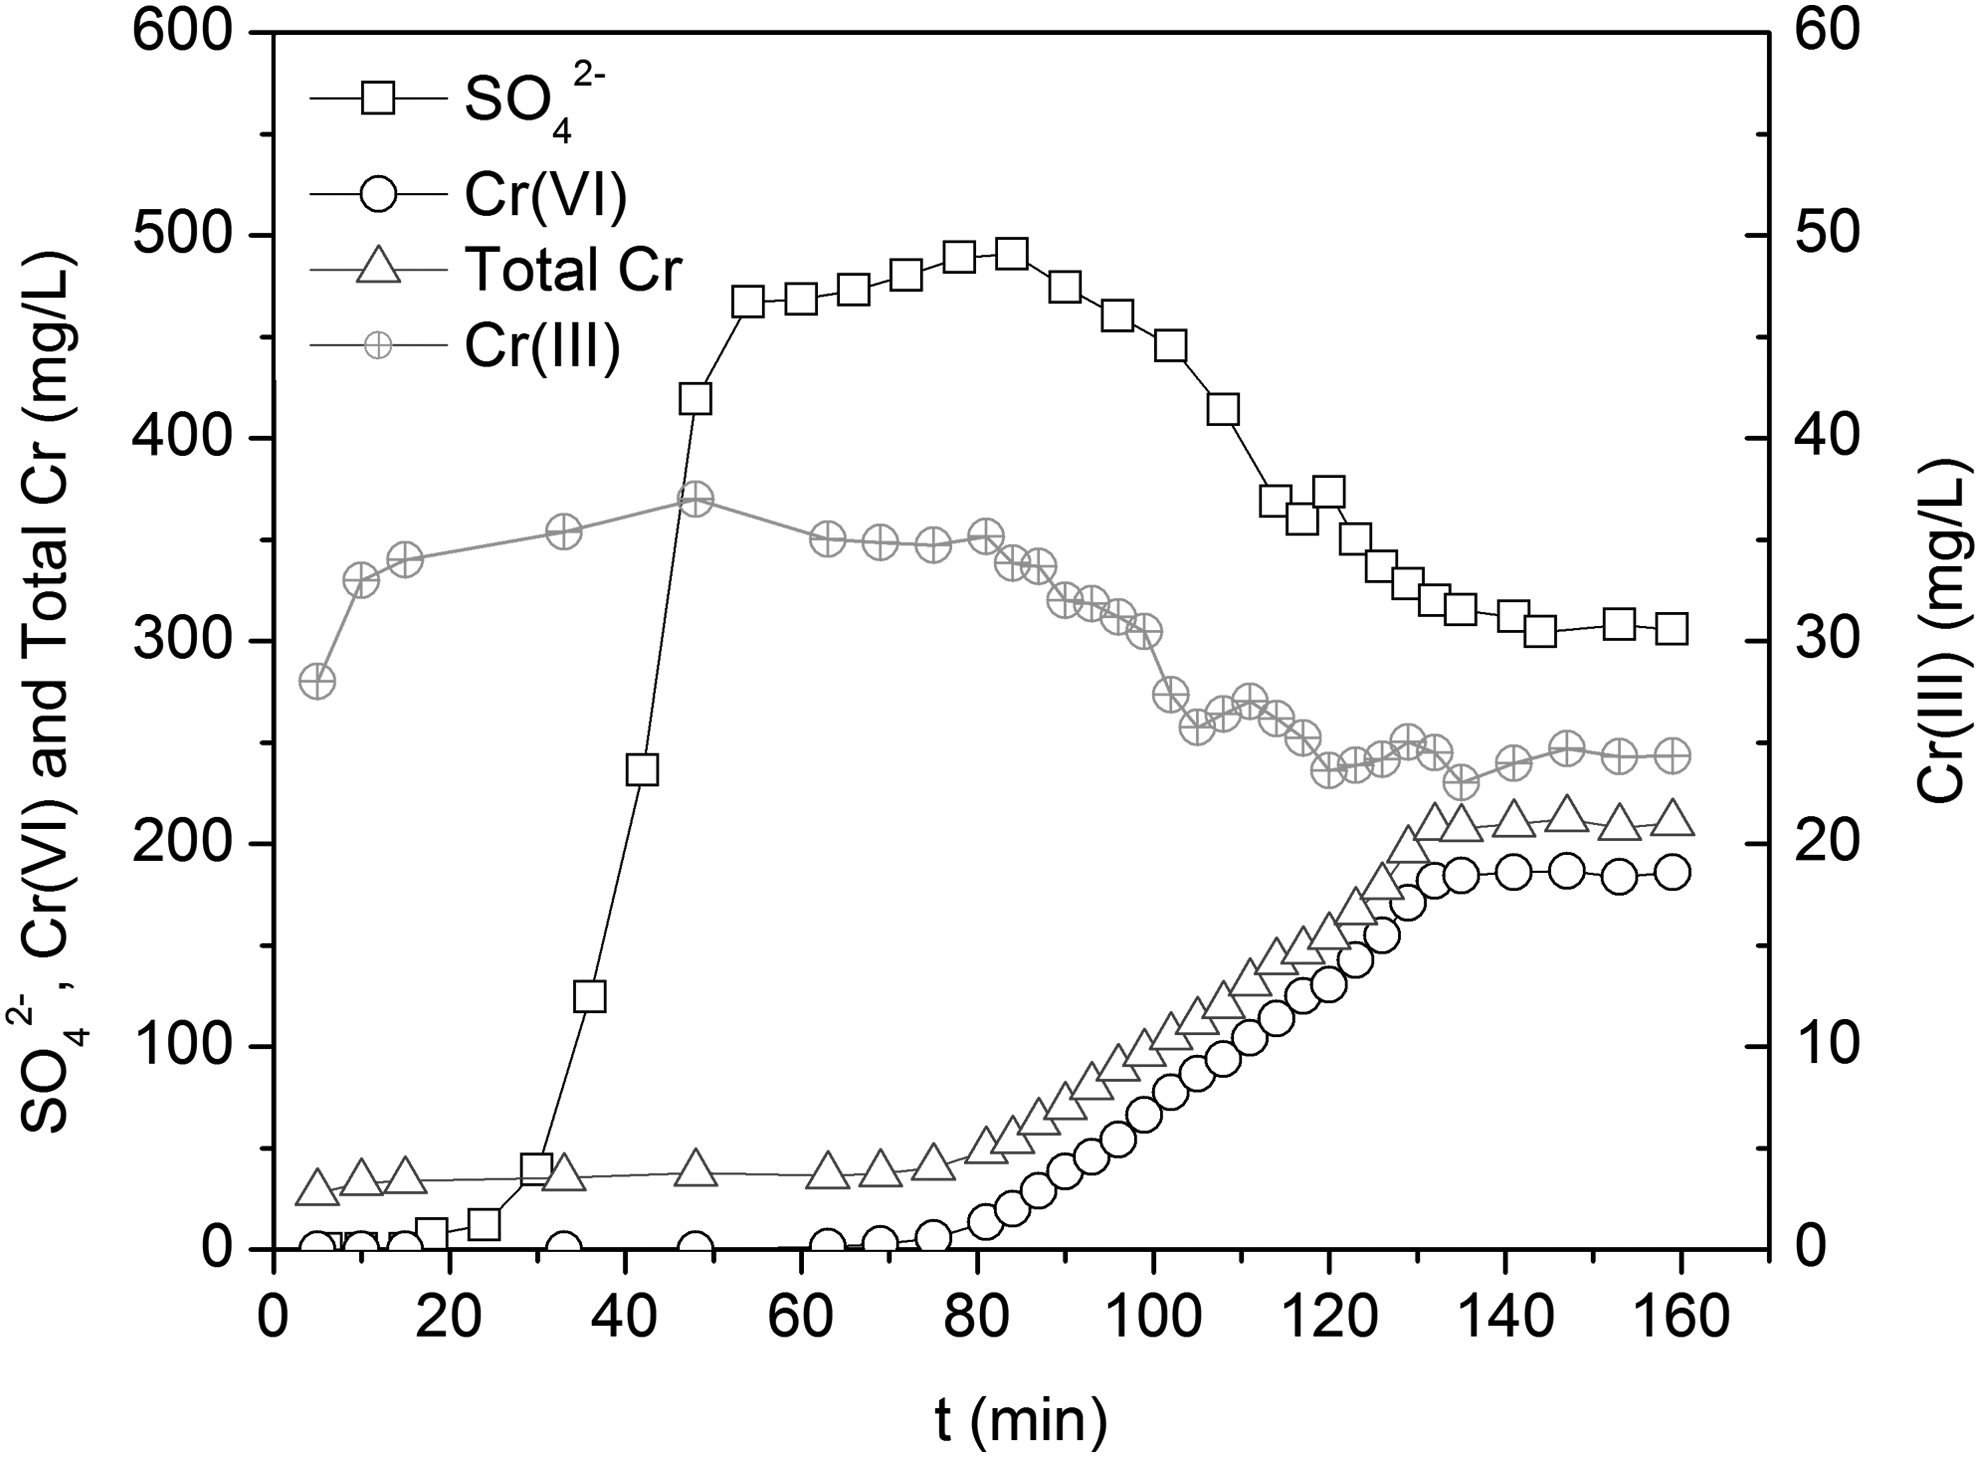
Breakthrough curves of SO42−, Cr(VI), Cr(III), and total Cr from electroplating wastewater.
Water Quality Analysis of Electroplating Wastewater Used in This Study
ND, not detected.
High selectivity to pollutants is very important for a desired adsorbent. For adsorption of Cr(VI), SO42− was the main competitive ion in wastewater because of their same charges and similar molecular structure (Pakade et al., 2011; Korak et al., 2017). In this work, SO42− breakthrough curve was also measured in electroplating wastewater experiment. As shown in Fig. 6, it can be seen that the breakthrough time of SO42− was ∼30 min that was much lesser than that of Cr(VI). This result clearly showed that CS-AE has higher selectivity to Cr(VI) than to sulfate ion, which improved its potential for practical application. After breakthrough, the concentration of sulfate increased dramatically to about 480 mg/L, and then, it decreased to the level of influent concentration. This change of sulfate concentration resulted from the exchange reaction between Cr(VI) and sulfate. Because CS-AE biosorbent showed higher affinity to Cr(VI) than sulfate, the initial adsorbed sulfate would be exchanged by Cr(VI), which enhanced the outflow concentration of sulfate in a short period.
However, the concentration of Cr(III) in effluent was much higher than that in influent water during the first 80 min of Cr(III) outflow curve, which is also shown in Fig. 6. This result indicated that Cr(VI) reduction to Cr(III) could occur in real wastewater treatment with biosorbent. It was also noticed that this Cr(III) curve looked different with the experimental result of artificial Cr(VI) solution [shown in Fig. 5, of which the Cr(III) was not detected in initial stage]. For the electroplating wastewater, Cr(III) concentration was 24.78 mg/L as shown in Table 4. When the wastewater flowed through the column, the amount of Cr(III), including both original Cr(III) and the new formed one from Cr(VI) reduction, was much more than the adsorption sites supplied by CS-AE adsorbent. As a result, the column would be saturated by Cr(III) in a few minutes, and then, the influent Cr(III) and the formed Cr(III) flowed out. Almost along with the breakthrough of Cr(VI), the concentration of Cr(III) started to decrease to the original level gradually. The reduction amount of Cr(VI) was calculated as 3.49 mg/g, which was apparently higher than that of artificial Cr(VI) solution experiment(0.53 mg/g), owning to the relatively higher influent Cr(VI) concentration, which enhanced the oxidation ability of Cr(VI).
Conclusion
In this study, experiment results showed that both the breakthrough time and exhaustion time of Cr(VI) increased with the increase of CS-AE column H/D value and with the decrease of influent concentration and flow rate. The Thomas model can fit the entire breakthrough curve better and was suitable to predict dynamic adsorption performance of Cr(VI). The rate constant kTh increased with the increase of flow rate and with the decrease of initial Cr(VI) concentration and H/D ratio, whereas the adsorption capacity q0 showed a reverse trend. Under suitable operation conditions (H/D 3.75, flow rate 15 min/L), q0 could reached 55.4 mg/g and kTh was in range of 8.6–10 × 10−4 mL/mg/min. The fixed-bed column of CS-AE can be easily regenerated by 1.0 M HCl solution in about 20 min. It was confirmed that Cr(VI) reduction to Cr(III) occurred in the fixed-bed column from experiments with both artificial Cr(VI) solution and industrial electroplating wastewater. Real wastewater test also showed that tb of Cr(VI) breakthrough curve (80 min) was much longer than that of SO42−(30 min), indicating that CS-AE column exhibited much higher selectivity to Cr(VI). These results suggested that the fixed-bed column packed with CS-AE biosorbent has the potential to remove Cr(VI) from real wastewater efficiently.
Footnotes
Acknowledgments
This work was financially supported by the National Natural Science Foundation of China (No. 51408239), the Natural Science Foundation of Fujian Province, China (No. 2016J01193), and the Key Projects of Enterprise and University Cooperation in Fujian Province, China (No. 2018Y4010).
Author Disclosure Statement
No competing financial interests exist.