




Abstract
Abstract
Considering the stringent emission regulations all over the world, the reduction of particulate emissions from diesel engines is of major interest. To enhance passive regeneration performance of catalyzed diesel particulate filter (CDPF), a NO2-assisted regeneration model is established in this work. In this article, optimal asymmetry ratio of diesel particulate filters was researched by comparing pressure drop under different operation conditions through the validated model and performances of passive regeneration of CDPF. Results show that deposition speed is equal to oxidation speed at the temperature of 330°C, reaching balance state. With increasing of temperature, oxidation speed is improved greatly. With increasing of space velocity, oxidation rate decreases. And temperature has a more significant effect than space velocity. As NO2 concentration, O2 concentration, and NO2/PM (particulate matter) ratio increase, oxidation rates are all improved, while importance of the influence on oxidation rate can be ordered that NO2/PM ratio > NO2 > O2. Moreover, NO2/NOx ratio reaches its maximum value when inlet temperature is about 330°C. NO2/NOx ratio decreases with increasing of space velocity. NO2/NOx ratio increases with increasing NO2, O2 concentration, and NO2/PM ratio. The importance of the influence on NO2/NOx ratio can be ordered that O2 > NO2/PM ratio > NO2. The results are valuable for performance enhancement of NO2-assisted regeneration and coupling different after-treatment systems.
Introduction
Diesel engines provide advantages of high thermal efficiency, good fuel economy, low CO2 emissions, and high reliability for both light-duty and heavy-duty applications (Resitoglu et al., 2014). However, diesel engines have also brought serious environmental problems, with the particulate matter (PM) from diesel engines being about 30–80 times higher than those from comparable gasoline engines. In addition to that, PM is harmful to humans with its complex composition (Johnson, 2011; Guan et al., 2015), especially small size. With the employment of new technology, the physical and chemical properties of diesel exhaust are different from traditional diesel exhaust (Hesterberg et al., 2011, 2012).
Under stringent emission regulations all over the world, from PM mass to particulate number (PN), particulate filtration is increasingly gaining in importance. Particulate filter technology is now considered as the most promising solution to meet the emission standards of heavy-duty vehicles. Researchers are concentrating on diesel particulate filter (DPF) and gasoline particulate filter to remove the PM and PN for diesel and gasoline, respectively.
In addition to good mechanical and thermal durability, DPF shows quite high filtration efficiencies, normally in excess of 90%, and it is considered as a mature technology. The most challenging issue with DPF is regeneration, which removes the deposited soot to avoid backpressure increasing. During the transient composite regeneration process, Zuo et al. (2014) studied the best burning regeneration region through cosine values of the angle between temperature gradient and velocity vector using a validated computational fluid dynamics simulation model. Zhang et al. (2016) established multidisciplinary design optimization model to optimize the composite regeneration process, reducing the pressure drop, temperature gradient, and microwave consumption, as well as improving the filtration efficiency and regeneration performance.
Under different velocities of exhaust gas in channels, E et al. (2016a) analyzed the trends of internal temperature, finding the maximum temperature value appearing in the rear end of DPF in the process of microwave regeneration. E et al. (2016c) analyzed the effects of exhaust gas parameters and structural parameters on pressure drop for continuous regeneration DPF through a validated mathematic model based on NO2-assisted regeneration. A thermal regeneration model was developed by Deng et al. (2017a), and field synergy theory was used to investigate and optimize the internal temperature distribution and temperature gradient in channels. A transient spatially two-dimensional model of the filter was developed by Schejbal et al. (2009) to predict the development of concentrations, temperature, pressure, and soot layer thickness along the filter.
Deng et al. (2017b) also studied the effects of key geometric factors (wall thickness, channel length, and channel diameter) on equilibrium properties of DPF, including pressure drop and soot mass concentration. The effect of some structural and operating factors on filter clogging and thermal aging was studied by Zhang et al. (2017), concluding that channel width, wall thickness, deposited ash mass, and the microwave power are the most noticeable. The physical and mathematical calculation models of MnOx-CeO2 catalysts were established on DPF by Zuo et al. (2012) to research the optimal concentration resulting in higher regeneration rate and lower exhaust back pressure.
Active regeneration involves O2 oxidizing soot at temperatures over 550°C, shown in Reaction (1). Such temperatures can't be encountered in diesel exhaust during normal driving cycles, and high temperature may destroy the filter during the process of regeneration. With nitrogen dioxide (NO2), the process begins to occur already at 250°C, shown in Reactions (2) and (3), based on research that nitrogen dioxide can oxidize PM easily under 300°C due to its strong oxidation property. The catalyzed diesel particulate filter (CDPF), coated with a catalytic coating, usually Pt, which is very effective in promoting the oxidation reaction of NO, Reaction (4), can achieve continuous regeneration at temperatures below 300°C with the use of ultralow-sulfur diesel fuel.
The catalyst in the CDPF converts NO to NO2 because the amount of NO2 is very low in the engine out exhaust, about 5–15% (Schejbal et al., 2010). Then NO2 reacts with deposited soot at temperatures as low as 300°C. The role of the Pt-based catalyst on CDPF is to facilitate filter regeneration (soot burning) and to provide other catalytic functions needed for an emission control system (Li et al., 2015), like CO and HC oxidation, which isn't considered in this study. The performance of NO2-assisted passive regeneration in a CDPF without diesel oxidation catalyst (DOC) is studied in this article.
It is necessary to distinguish the differences between continuous regeneration trap (CRT) and CDPF. NO2 can be generated on a DOC in the CRT; the difference between NO2 generated on DOC and CDPF derives from the efficiency of NO2 utilization. It can be explained that NO2 produced in CRT can be used only once for soot oxidation, while in CDPF, NO2 can achieve multiple use through back diffusion. In CDPF, NO2 is formed on the catalytic wall through NO catalytic oxidation, which is downstream of the soot layer deposit. Then the generated NO2 diffuses back to the soot layer because of concentration gradient, which is the essential requirement to achieve passive regeneration.
In this article, the optimal asymmetry ratio is researched based on the asymmetrical structure CDPF, and then the optimal asymmetry ratio is applied to study catalyzed regeneration performance. The results provide valuable information that can be used to enhance performance of NO2-assisted regeneration and couple different after-treatment systems.
Mathematical Models
In this study, the mathematical models are based on the works of Bissett (1984), who first built models of DPF, Konstandopoulos and Kostoglou (1999) who proposed two-layer concept, and Haralampous and Koltsakis (2004) who did much work on back diffusion of the NO2. Before making a specific description of model formulation, some assumptions are listed below:
Brownian diffusion and direct interception are only considered in deep-bed filtration, to calculate the filtration efficiency based on the theory of the unit collector (Schejbal et al., 2010). All channels behave in an exactly identical way, so a single channel could represent the monolith. The exhaust gas flows through two layers: the particle deposit that shrinks uniformly with time during regeneration and the porous ceramic channel wall. The flow distribution at the inlet is considered uniform; the radial concentration and temperature profiles are negligible. The slip flow effect, PM molecular weight change along axial direction, and the effect of pressure on diffusion are ignored.
Figure 1 shows a schematic diagram for single inlet and outlet channels of CDPF used in this work, where the inlet and outlet channels and walls are denoted with the subscripts 1, 2, and w, respectively. The engine-out exhaust enters the inlet channel and exits through the outlet channel because of alternate plugging, so the soot is deposited in the porous substrate wall.

Schematic diagram for single inlet and outlet channels of CDPF. CDPF, catalyzed diesel particulate filter.
Next, the governing equations for the conservation of mass, momentum, and energy in the flowing exhaust gas are discussed.
Governing equations
Conservation of mass of channel gas
The model is mainly based on the work of Bissett (1984). The equations for the conservation of mass in the inlet and outlet channels (Bissett, 1984; Konstandopoulos and Kostoglou, 1999; Konstandopoulos et al., 2000) can be described as:
where
Conservation of momentum of channel gas
The momentum balance of the exhaust gas in inlet and outlet channels can be formulated as follows:
where
Conservation of energy of channel gas
The equations for the energy of channel gas in the inlet and outlet channels can be written as:
Inlet channels:
Outlet channels:
where
Conservation of mass in particulate matter
The conservation of PM considers the deposition from the flow gas and the chemical reactions due to NO2 assisted regeneration; O2 thermal regeneration is not considered in this study because the temperature (lower than 500°C) is too low to activate the thermal reaction. The conservation of soot mass in the channel (Kalogirou et al., 2007; Kim et al., 2010; E et al., 2016b; Dardiotis et al., 2008) is expressed as follows:
where Wc is the PM molecular weight;
Conservation of energy in particulate matter
The energy equation for PM considers heat exchange between soot and exhaust gases in the filter wall. The conservation of energy for PM (Kalogirou et al., 2007; Kim et al., 2010; E et al., 2016b; Dardiotis et al., 2008) can be calculated according to the following:
where
Pressure drop model
The pressure drop model includes several parts. When the filter is clean, the pressure drop includes losses through the porous wall and frictional losses through inlet and outlet channels. When the filter is loaded, the losses through soot layer which is formed by soot deposit are added. The pressure losses through filter wall and soot layer are modeled according to Darcy's law, and the others are calculated by the fluid dynamics. And the pressure drop caused by contraction and expansion of the flow into and out of the entrance and exit of the channels is ignored, as seen in the Equation (7), as the order of the magnitude of the
The composition of the pressure drop is described as follows:
NO2-assisted regeneration model
The main principle is based on Konstandopoulos's two layer concept. When the filter begins working, the soot is deposited, and the single channel is divided into three parts. As seen in the Fig. 2 (Konstandopoulos et al., 2000), layer I is the contact layer, the part that catalyst and soot contact. Layer II is the soot layer on the top of the contact layer. The third part is the porous wall. The reason to divide the single channel into different parts is to apply individual chemistry kinetics for each part appropriately, and each part has different chemical reactions due to their position condition.
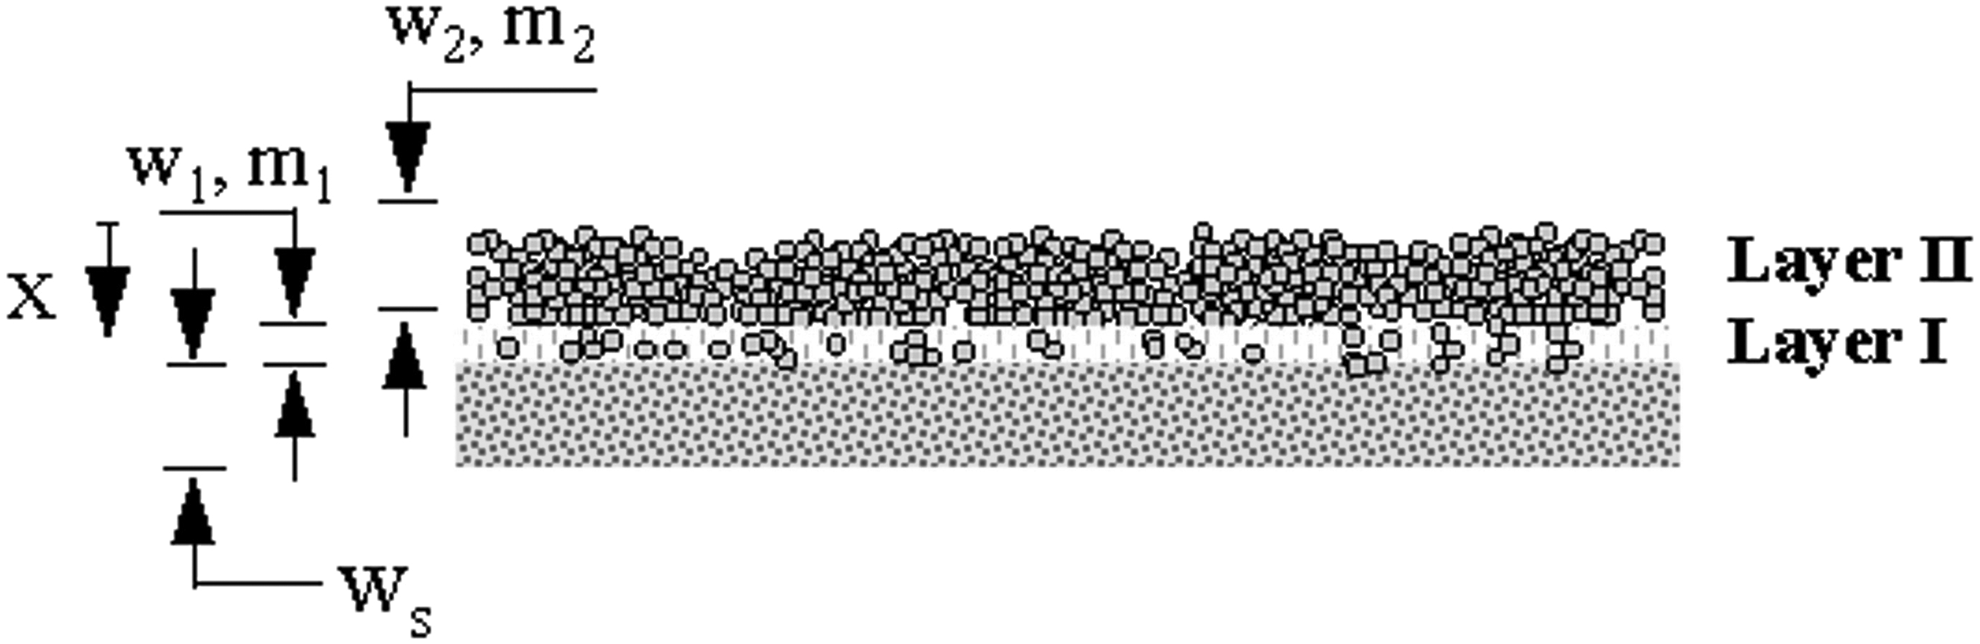
Schematic diagram for two layers of CDPF.
NO2 is mainly produced in the layer I, the catalytic layer (Haralampous and Koltsakis, 2004). The generated concentration gradient is the force that lets NO2 diffuse back to the other parts and then react with soot. The reversible reaction of NO to NO2 is also very important in this model.
Layer II NO2 mass balance
In this layer, soot is oxidized by NO2.
where
Layer I NO2 mass balance
In this layer, due to the catalyst, the NO2 is produced by the NO and O2. The general kinetic expression is listed below:
The NO2 mass balance:
where
Model Grid Independency
Since a CDPF model is present in the simulation, grid size study along the axial direction must be conducted to ensure the model grid independency. In this study, the pressure drop of grid sizes of 5, 10, and 15 mm is evaluated, respectively, as shown in Fig. 3. The differences between 5, 10, and 15 mm are both within 0.9%. Considering the accuracy and calculating time, the 10 mm grid size is used in this model.
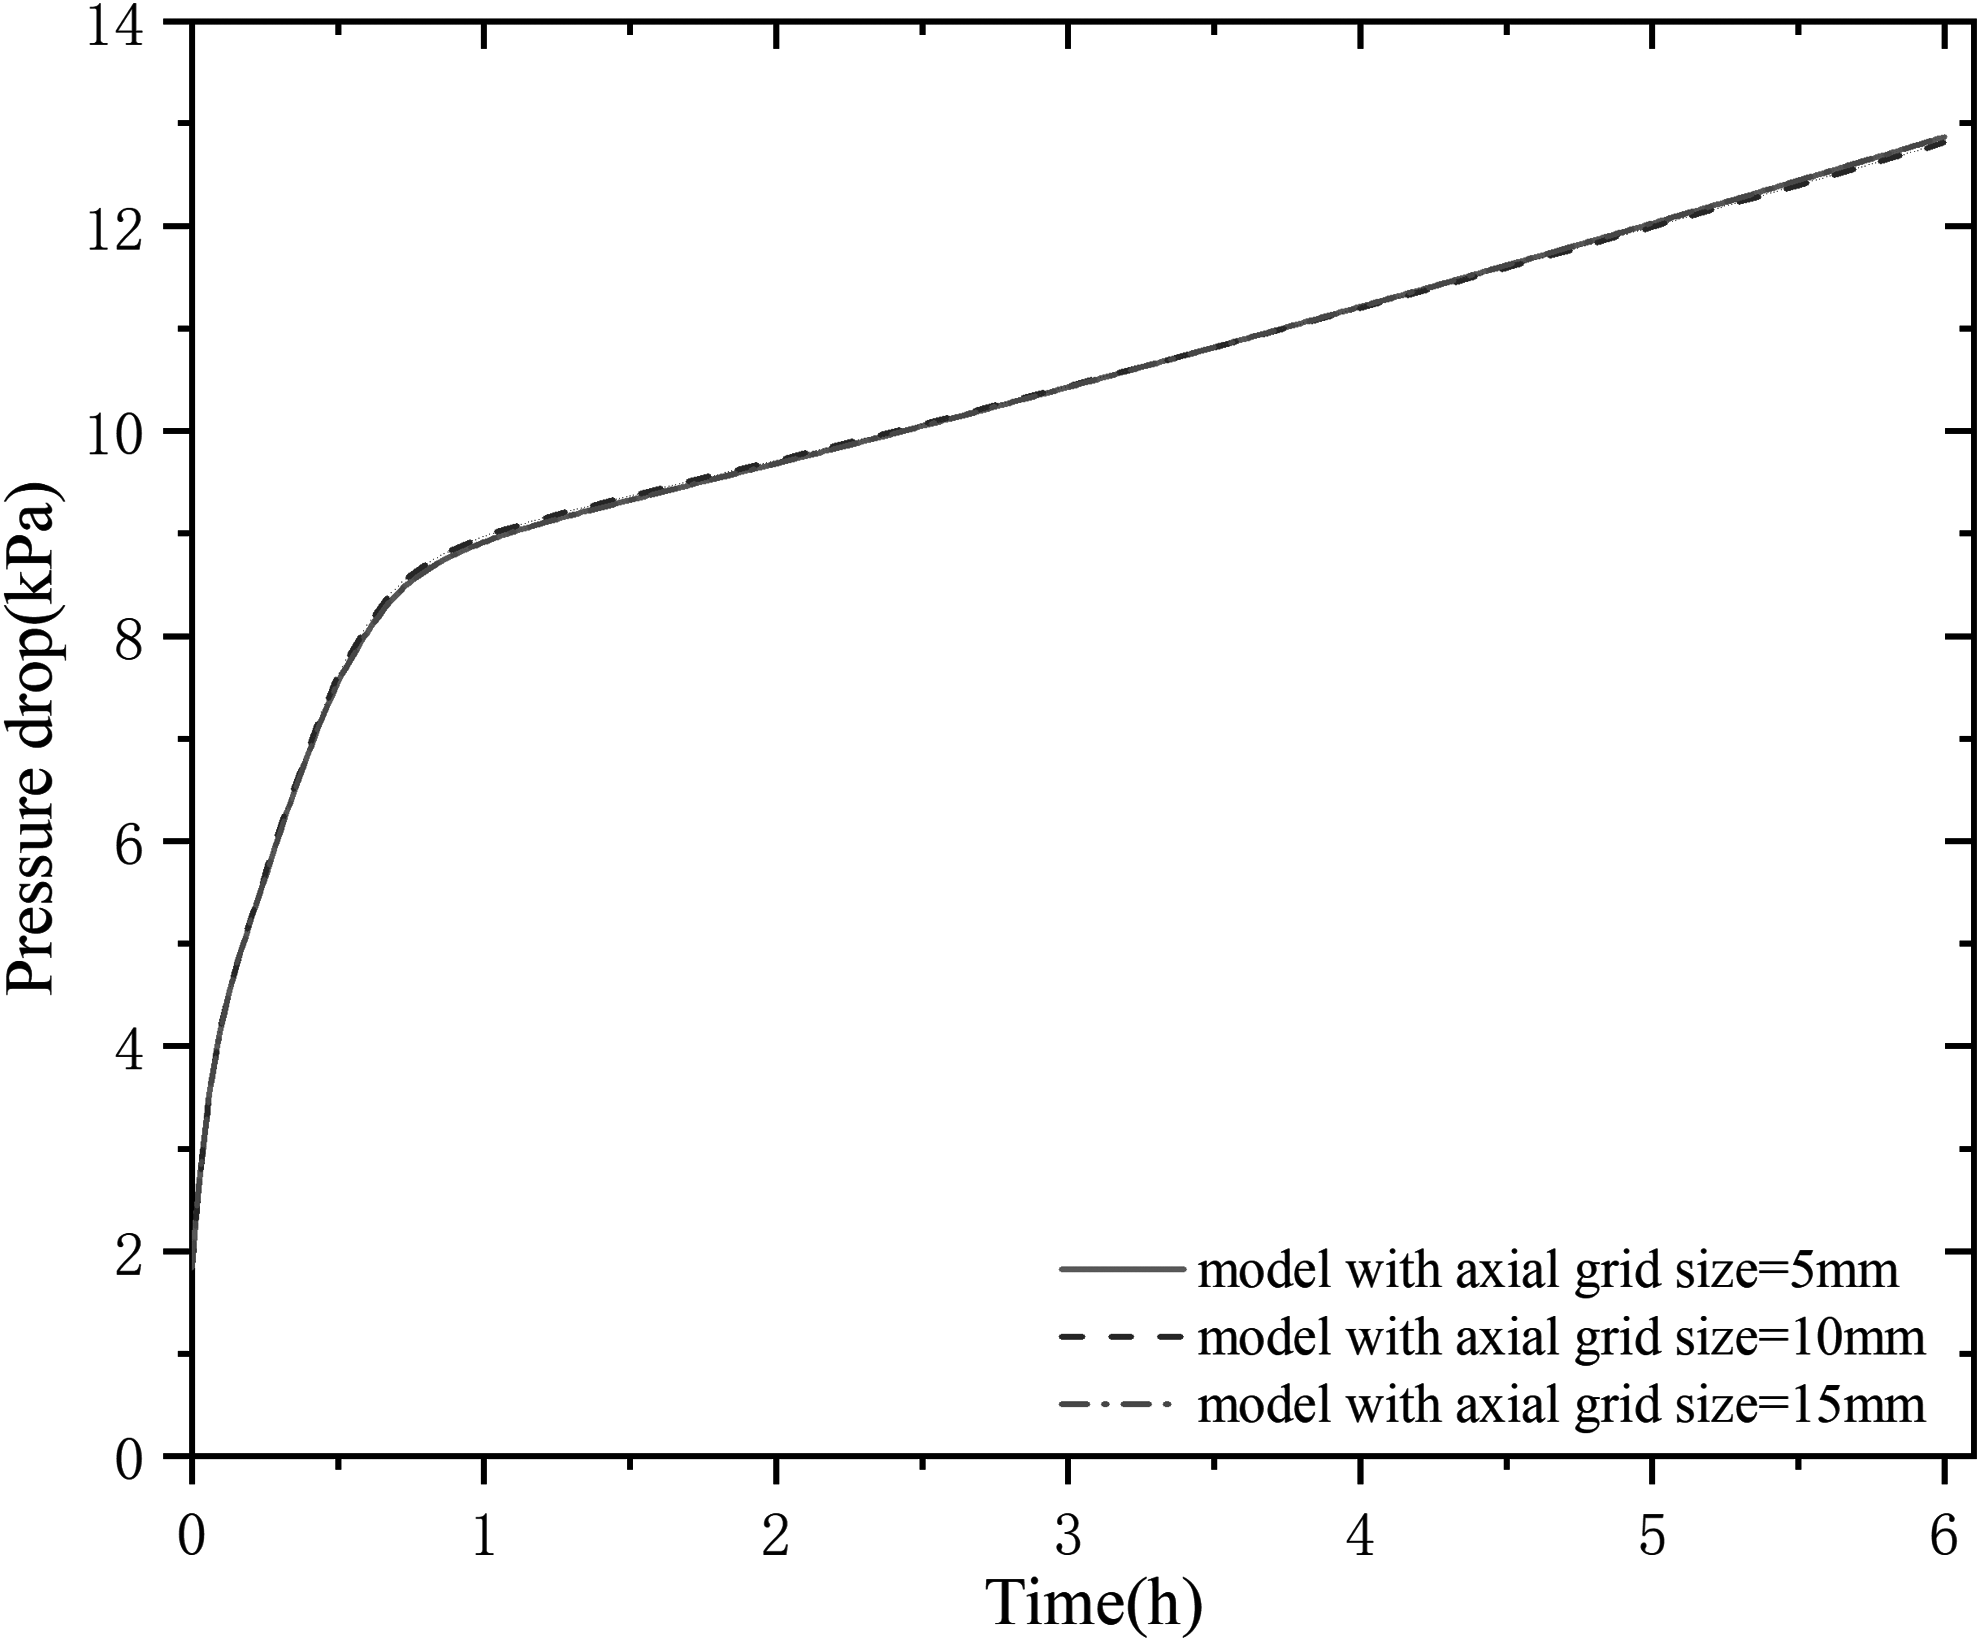
Pressure drops with different axial grid sizes.
Model Validation
To verify the validity of the proposed mathematical models in evaluating the performance of CDPF in this article, available experimental data in the literature of Mohammed et al. (2006a) are used, and Fig. 4 shows the experimental schematic representation. Table 1 summarizes the specification of the CDPF used in the literature, and Table 2 shows the initial conditions.

Schematic representation of experiment.
Specification of Catalytic Diesel Particulate Filter
Initial Conditions of Catalytic Diesel Particulate Filter
For the kinetic parameters, there are many studies on the kinetics of the NO2/soot reaction, with the activation energy being 95 kJ/mol (Kandylas and Koltsakis, 2002), 40 kJ/mol (Kandylas et al., 2002), 30 kJ/mol (Haralampous et al., 2004), and 40–70 kJ/mol (Kalogirou et al., 2007). And the activation energy of the NO oxidation reaction is 70 kJ/mol (Kandylas and Koltsakis, 2002) and 55 kJ/mol (Koltsakis et al., 2005). Based on the range of the kinetic parameters above, the Direct Optimizer in the simulation software is used to calibrate. The corresponding kinetic parameters for NO2/soot reaction and NO oxidation reaction are 80 and 35 kJ/mol, respectively.
Figure 5 compares the simulated pressure drop with experiments in the literature (Mohammed et al., 2006a) where 20%, 40%, 60%, and 75% loads were studied. In this study, 20% load is chosen for comparison. As seen in Fig. 5, the pressure drop increases in the whole process, and the slope in the first 1 h is very steep and then increases in a linear way. The reason of showing this phenomenon is clear that the deep bed filtration where the soot is deposited in the wall contributes to the pressure drop significantly, and then soot is deposited on the wall which is known as soot cake filtration to form the soot layer. It can be found that the model results are in good agreement with experimental results, and the maximum relative error is <7%.

Comparison of pressure drop in CDPF (inlet exhaust temperature 287°C; flow rate is 0.245 std-m3/s; 13.67% O2, 33 vppm NO2, 146 vppm NO).
Figure 6 shows comparison of accumulated soot mass with experiment results of a CDPF under different operation loads. It can be seen that the relative errors are 7%, 15%, 6%, and 12%. The comparisons of the NO2 concentration downstream of CDPF are also given in Fig. 7. The relative errors under different conditions are 2%, 10%, 7%, and 14% at 20%, 40%, 60%, and 75% loads, respectively.
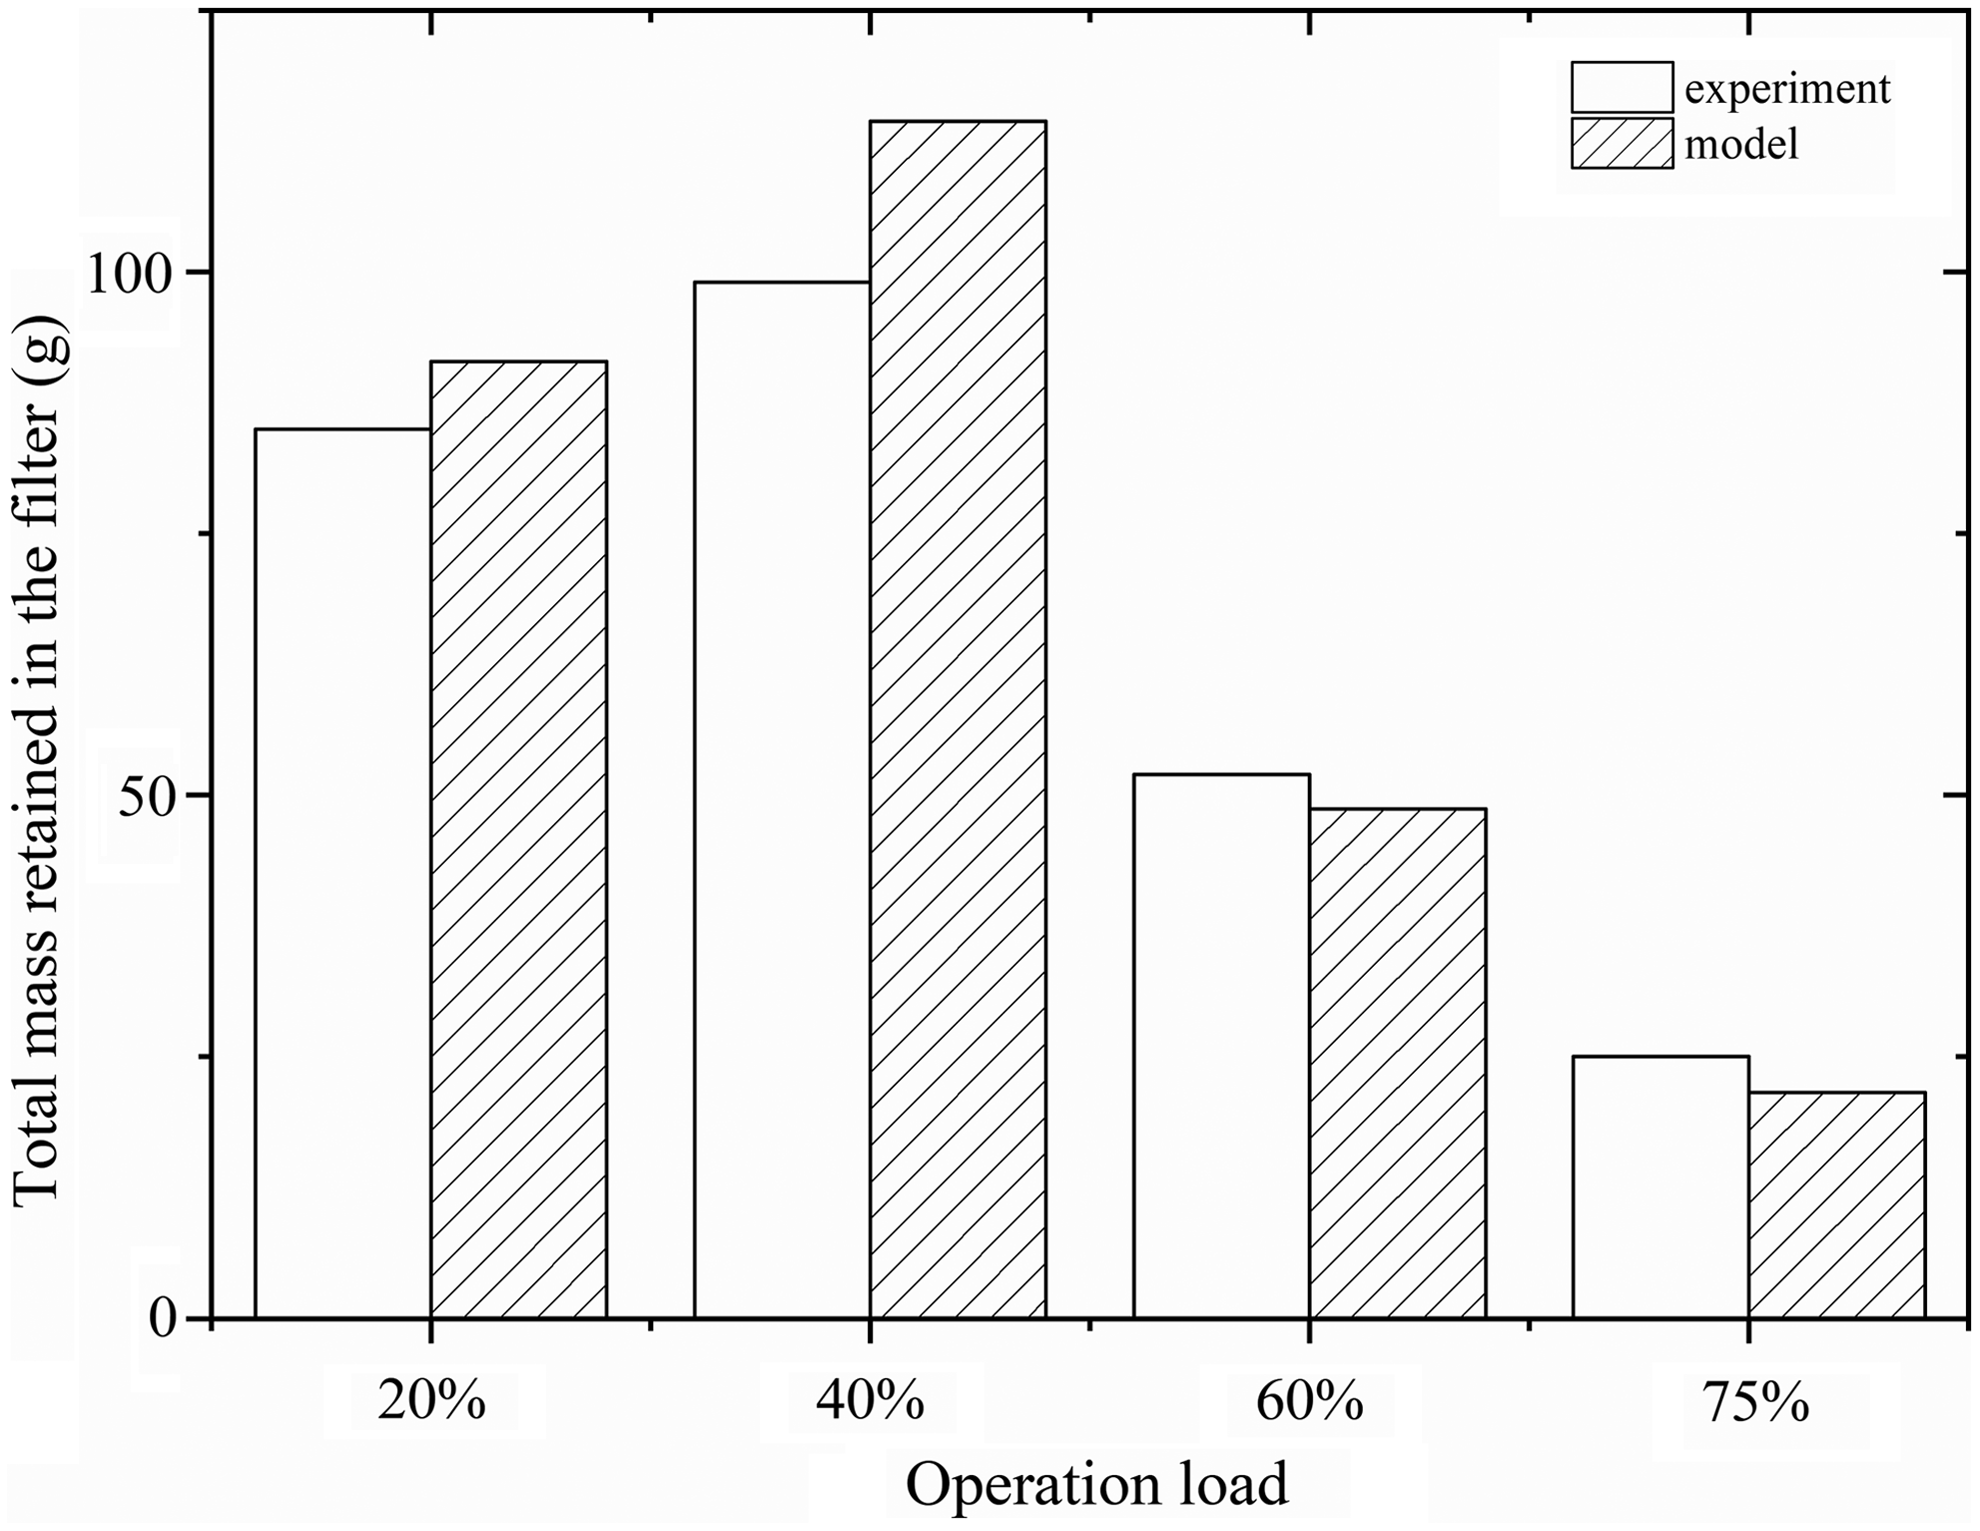
Comparison of accumulated soot mass under different loads in CDPF (inlet exhaust temperature is 287°C, flow rate is 0.245 std-m3/s, 13.67% O2, 33 vppm NO2, 146 vppm NO).
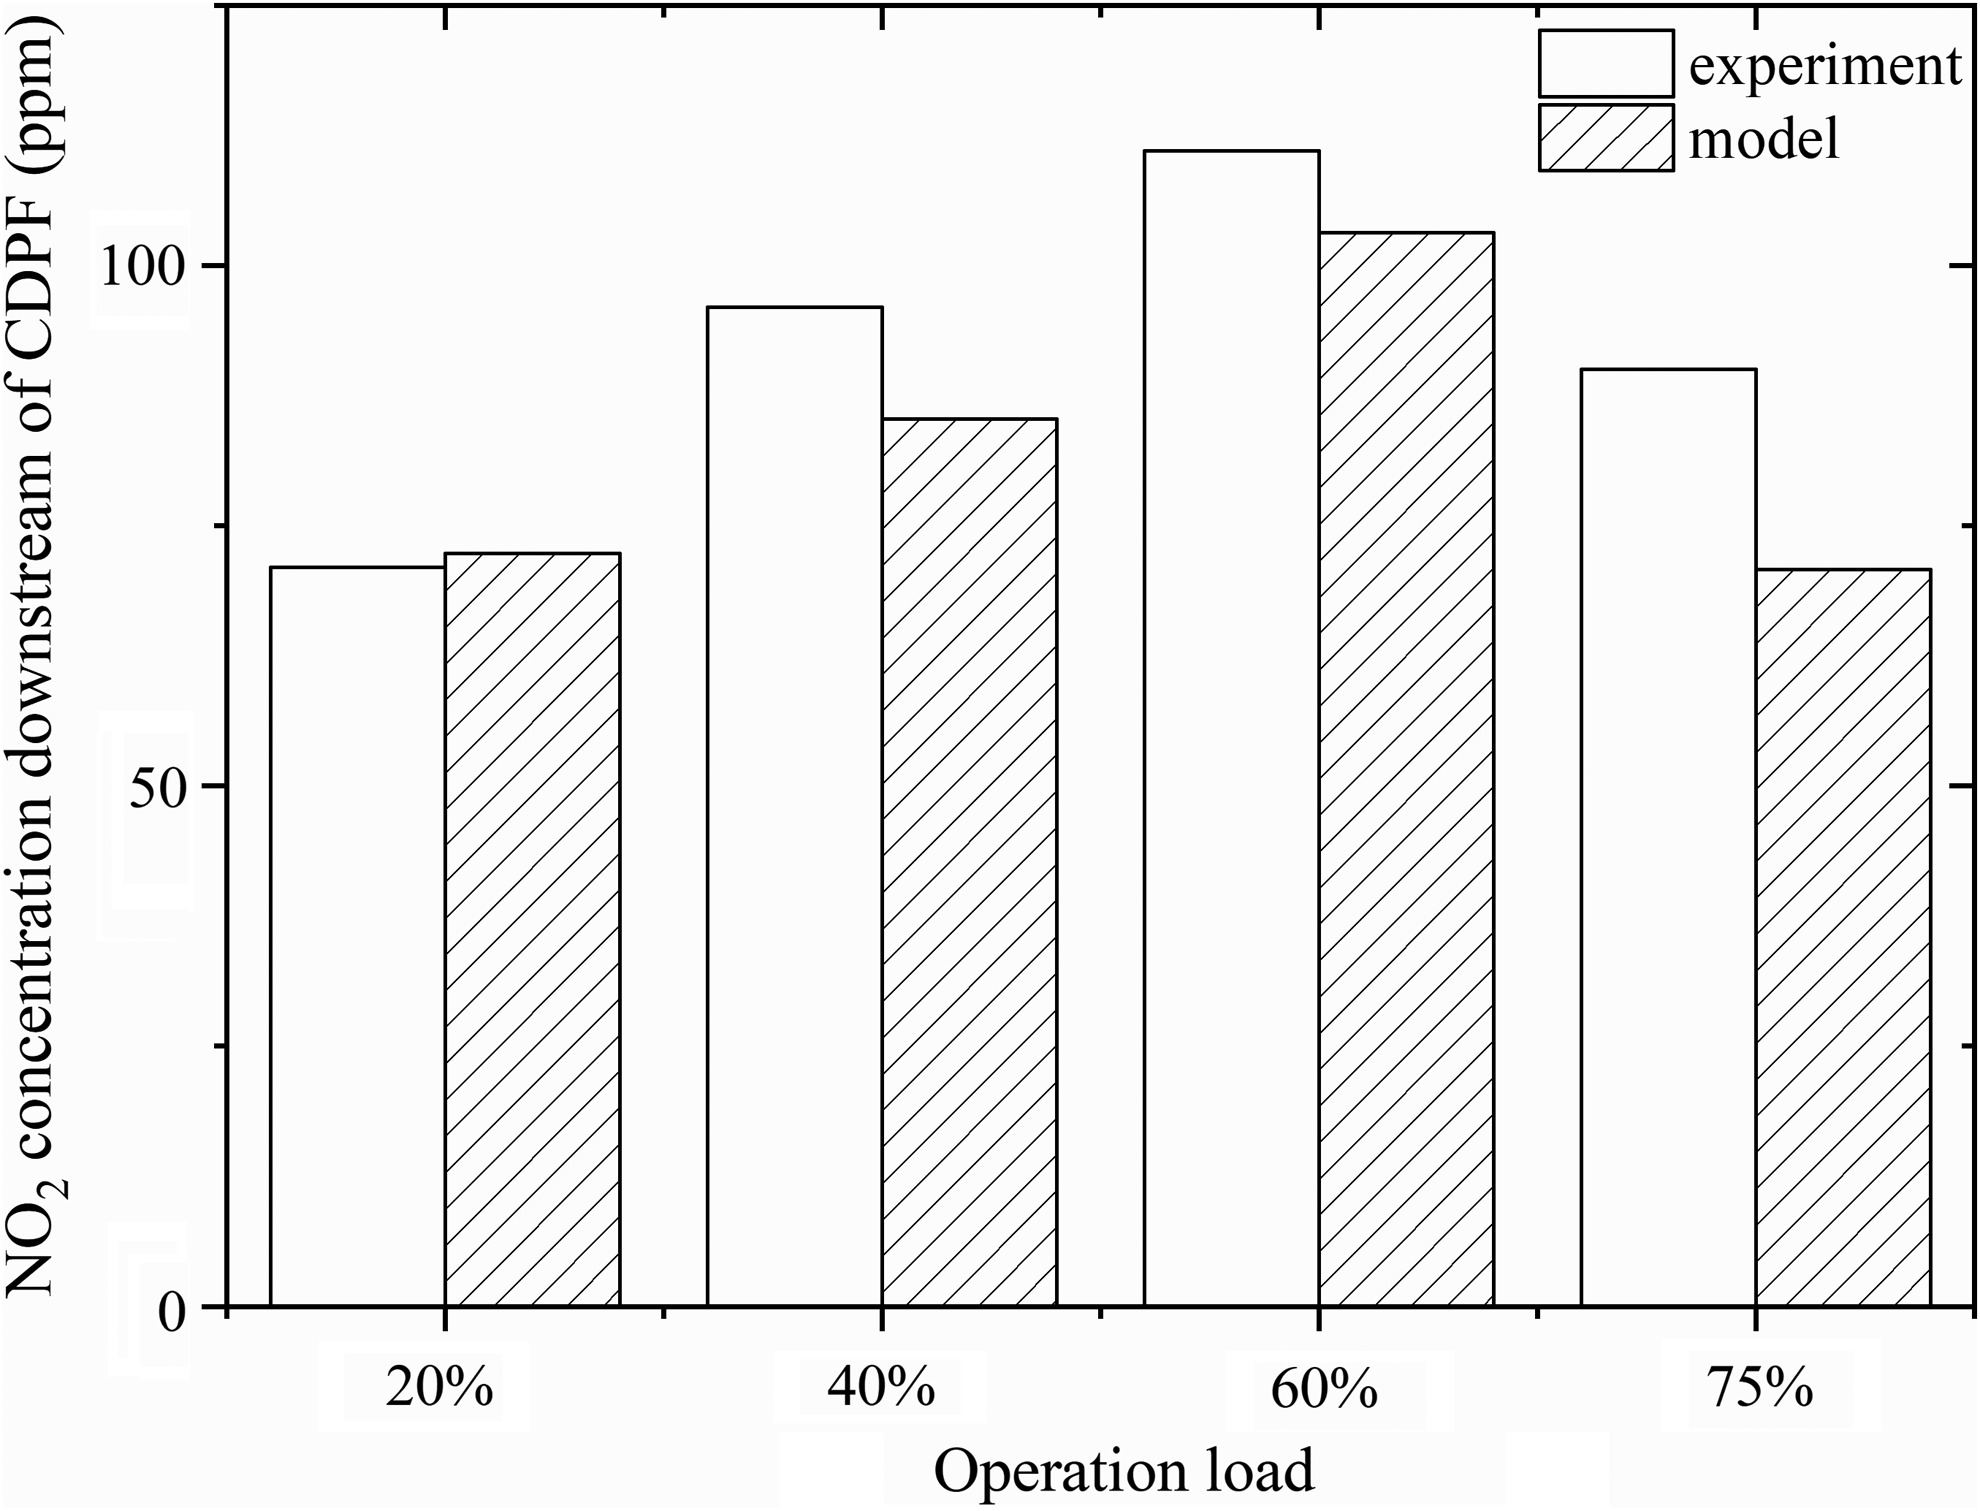
Comparison of NO2 concentration downstream of CDPF between experiment and simulation results (inlet exhaust temperature is 287°C, flow rate is 0.245 std-m3/s, 13.67% O2, 33 vppm NO2, 146 vppm NO).
The uncertain sources of error may be caused from three aspects as follows:
(a) Axial discretization. According to the model grid independency above, the pressure drop error caused by different axial discretization lengths is below 0.9%.
(b) Due to some assumptions. First, the slip-flow effect is not considered, leading to the error of mass flow prediction, which is very small at low temperature and reaches the largest value of 1.6% at 487 K (Payri et al., 2011). Second, the ignorance of pressure effect on diffusion in Equations (9) and (13) causes diffusion velocity error of around 5% (Depcik, 2010). Third, PM molecular weight change in the axial direction is negligible and it is found that the maximum change in molecular weight from entrance to exit is only on the order of 0.3% (Depcik, 2010). Next, modeling an enthalpy difference as the constant pressure specific heat times a temperature difference, which neglects the heats of formation and sensible enthalpy components of the chemical species, results in 3% error in PM and temperature profile (Depcik, 2010). Finally, the contraction and expansion may cause pressure drop error of about 10−2 to 10−3 compared to the other parts of the pressure losses (Konstandopoulos et al., 2000), specifically speaking about 3% (Sappok, 2009).
(c) Some measuring errors of each device and uncertainties of the computed values also contribute to the overall error during the experiment.
The established model made some simplifications to reduce the complexity of calculation, the errors are within the allowable range, the effectiveness of the model was verified, and this model can be used to evaluate the performance of NO2 assisted regeneration in the CDPF.
Results and Discussion
Based on the above described model, a study of continuous regeneration of diesel filters under a variety of operating conditions will be presented in this section. First of all, the optimal asymmetry ratio is discussed under different soot loadings. Then the optimal asymmetry ratio is applied to investigate the performance of the passive regeneration characteristics in the CDPF, including the influence of exhaust gas parameters on passive regeneration and the NO2/NOx ratio downstream the CDPF.
Optimal asymmetry ratio
The purpose of introducing the asymmetrical structure, in which the inlet channel diameter is bigger than the outlet, is to maximize soot load and ash capacity and minimize back pressure. The asymmetry ratio is the ratio of the inlet diameter to the outlet diameter. If the asymmetry ratio is too small, the effect of improving capacity of soot and ash will not be obvious. If the asymmetric ratio is too large, it will increase the machine difficulty. Therefore, it is necessary to find an optimum asymmetric ratio (OAR), where the pressure drop is minimum while the asymmetry ratio is as small as possible. The influence of asymmetry ratio on pressure drop is an indicator to evaluate the performance of the asymmetrical channel structure. In this study, six types of asymmetry ratios were chosen under different exhaust conditions to study its influences on pressure drop.
Optimal asymmetry ratio under different soot loadings
First, as shown in Fig. 8, pressure drop varies with soot loadings for different asymmetric ratios. For a certain asymmetry ratio, the pressure drop increases with the increase of soot loading. The slope of the pressure drop with the change of soot loadings is the largest when the asymmetry ratio is 1.0, that is to say, the smaller the asymmetry ratio is, the more sensitive the pressure drop is for the variation of soot loadings. Changing the asymmetry ratio from 1.0 to 1.4 causes the pressure drop to decrease. As the asymmetry ratio continues to increase to 1.5, pressure drop increases instead.
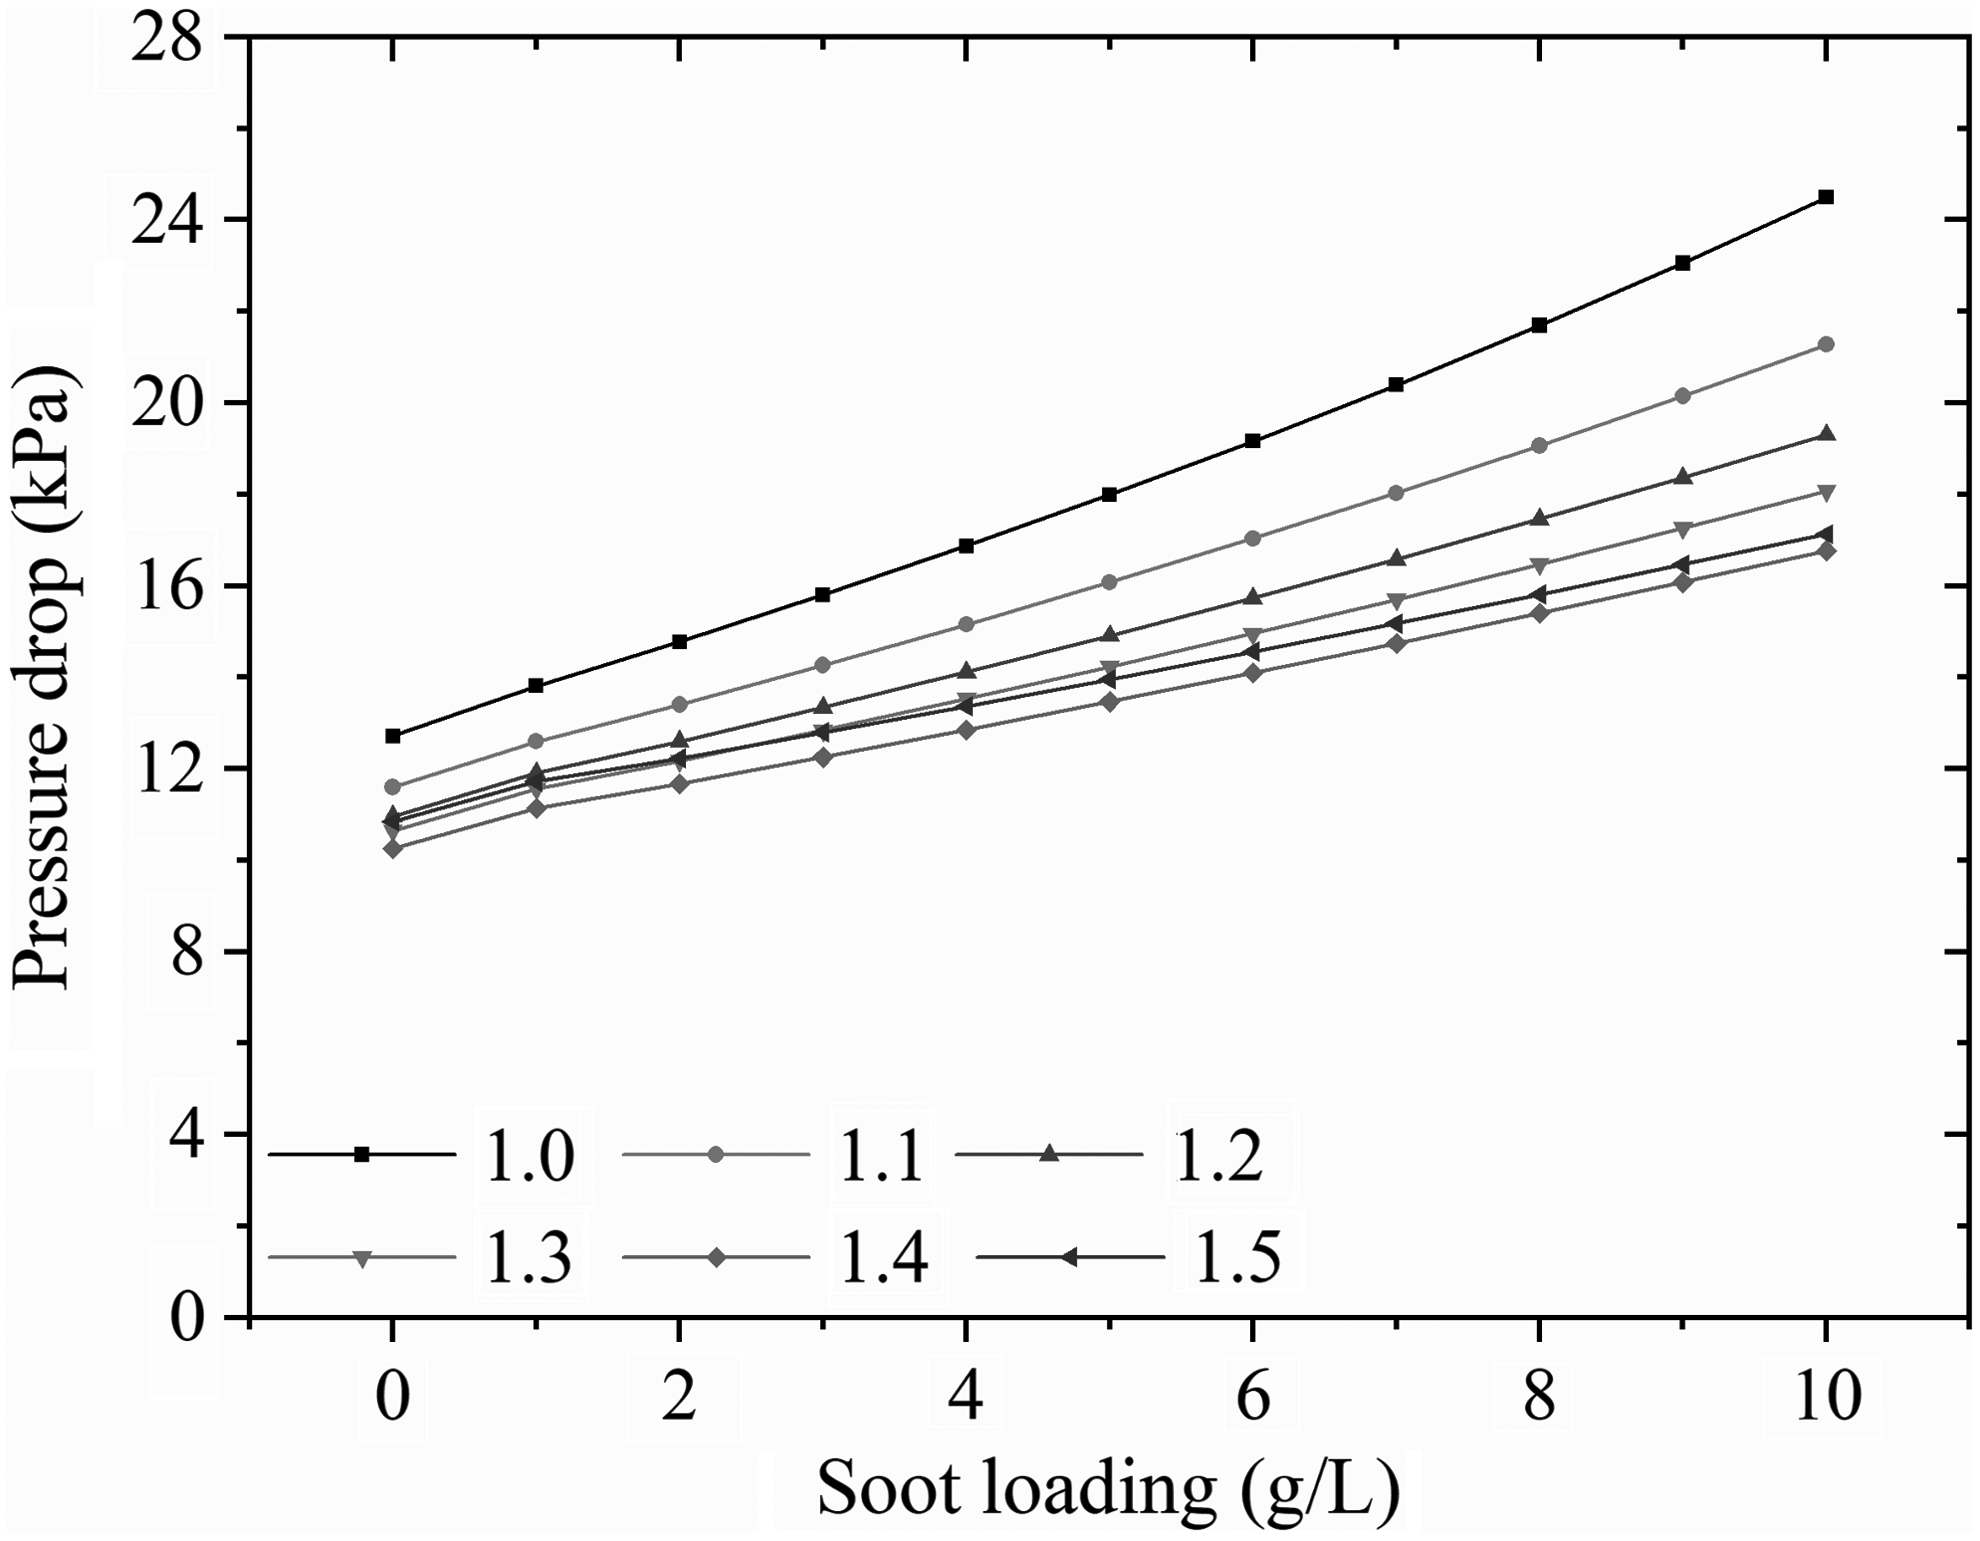
CDPF pressure drop varies with soot loading under different asymmetric ratios (inlet exhaust temperature is 330°C, flow rate is 0.245 std-m3/s, 13.67% O2, 33 vppm NO2).
With the changing of asymmetry ratio, flow velocity also changes correspondingly. The inlet diameter increases, the inlet velocity decreases; the outlet diameter decreases, the outlet velocity increases. Therefore, the pressure drop at the inlet channel decreases and the pressure drop at the outlet channel increases. Also the soot layer becomes thinner with the larger inlet diameter and a decrease in the pressure drop is caused. Based on the above analysis, the pressure drop is the smallest when the asymmetry ratio is 1.4, the best asymmetric ratio under different soot loadings is 1.4. Next, the optimal asymmetric ratio under different operating conditions is explored, based on two soot loadings: 0 and 6 g/L.
Optimal asymmetry ratio under different exhaust flow rates
As shown in Fig. 9, the relationship between flow rate and pressure drop under various asymmetry ratios is obtained. The flow rate is 0.1, 0.2, 0.3, 0.4, 0.5, and 0.6 m3/s, respectively, and the asymmetry ratio is 1.0, 1.1, 1.2, 1.3, 1.4, and 1.5. Generally, the pressure drop increases with increasing of exhaust gas flow rate. The reason is clear that with the increase of flow rate, the reaction times of soot oxidation and NO oxidation are both shortened; consequently, the retained soot increases and the pressure drop increases.

Effects of flow rate on pressure drop at various asymmetry ratios (inlet exhaust temperature is 330°C, 13.67% O2, 33 vppm NO2), soot loadings
When the soot loading is 0 g/L, it can be seen that the pressure drop decreases as the asymmetry ratio increases from 1.0 to 1.3. As the asymmetry ratio continues increasing, the change of pressure drop is not obvious, and the pressure drops are almost the same under the asymmetry ratios of 1.3, 1.4, and 1.5. The pressure drop is slightly higher with the asymmetrical ratio of 1.3 at high flow rate, specifically the cutoff point of flow rate being 0.5 m3/s. At the soot loading of 6 g/L, the trend is similar to 0 g/L. The difference is that the cutoff point of flow rate is 0.4 m3/s. That is to say, when the exhaust flow rate is lower than 0.4 m3/s, the OAR is 1.3; when the exhaust flow rate is higher than 0.4 m3/s, the OAR is 1.4.
Optimal asymmetry ratio under different inlet temperatures
The relationship between inlet temperature and pressure drop under various asymmetry ratios is shown in Fig. 10 for inlet temperatures of 270°C, 300°C, 330°C, 360°C, 390°C, and 420°C, respectively. In Fig. 10a, for soot loadings of 0 g/L, the pressure drop increases with increasing of exhaust gas temperature. When the temperature is higher than 330°C, pressure drop starts decreasing. This phenomenon is the same to different asymmetry ratios. In the initial state, there is no soot deposition, exhaust temperature is low, and the regeneration is not obvious. So, the pressure drop increases with increasing of temperature. When the temperature rises to a certain extent, the regeneration plays a dominant role, so the pressure drop decreases with increasing of temperature. When the inlet temperatures are below 345°C, the OAR is 1.4, while the OAR is 1.3 at temperatures above 345°C.

Effects of exhaust temperature on pressure drop under various asymmetry ratios (flow rate is 0.245 std-m3/s, 13.67% O2, 33 vppm NO2), soot loadings
In Fig. 10b, for soot loadings of 6 g/L, pressure drop decreases with increasing temperature. When the temperature of the exhaust gas increases, the capacity of NO2 to oxidize soot increases, resulting in a decrease in the amount of soot and a corresponding drop in pressure drop. And the OAR is 1.4 under the whole temperature range.
Optimal asymmetry ratio under different O2 concentrations
As shown in Fig. 11, the relationship between O2 concentration and pressure drop under various asymmetry ratios is acquired, for O2 concentrations of 5%, 10%, 15%, 20%, 25%, and 30%, respectively. At 0 and 6 g/L soot loadings, the effect of oxygen concentration on pressure drop is small, and the pressure drop shows a slowly decreasing trend with increasing of oxygen concentration. The effect of oxygen concentration on pressure drop is reflected in the regeneration process. That is to say, oxygen is only involved in the oxidation of NO to NO2 and the exact effect on regeneration is achieved by changing the amount of NO2, so O2 concentration has an indirect influence on the regeneration.

Effects of O2 concentration on pressure drop under various asymmetry ratios (inlet exhaust temperature is 330°C, flow rate is 0.245 std-m3/s, 33 vppm NO2), soot loadings
The effect of asymmetry ratio is also distinct. The pressure drops under both soot loadings are the lowest when the asymmetry ratio is 1.4. When the soot loading is 0 g/L, as the asymmetry ratio changes from 1.0 to 1.4, the pressure drop decreases, while the pressure drop increases when asymmetry ratio continues to reach to 1.5 which is even higher than that with the asymmetric ratio of 1.3. When the soot loading is 6 g/L, the trend is similar to that of 0 g/L, but the pressure drop with an asymmetric ratio of 1.5 is lower than pressure drop with an asymmetric ratio of 1.3. Therefore, it is considered that the optimum asymmetry ratio at different oxygen concentrations is 1.4.
Optimal asymmetry ratio under different NO2 concentrations
The relationship between NO2 concentration and pressure drop under various asymmetry ratios is shown in Fig. 12, for the NO2 concentration of 20, 40, 60, 80, 100, and 120 ppm, respectively.
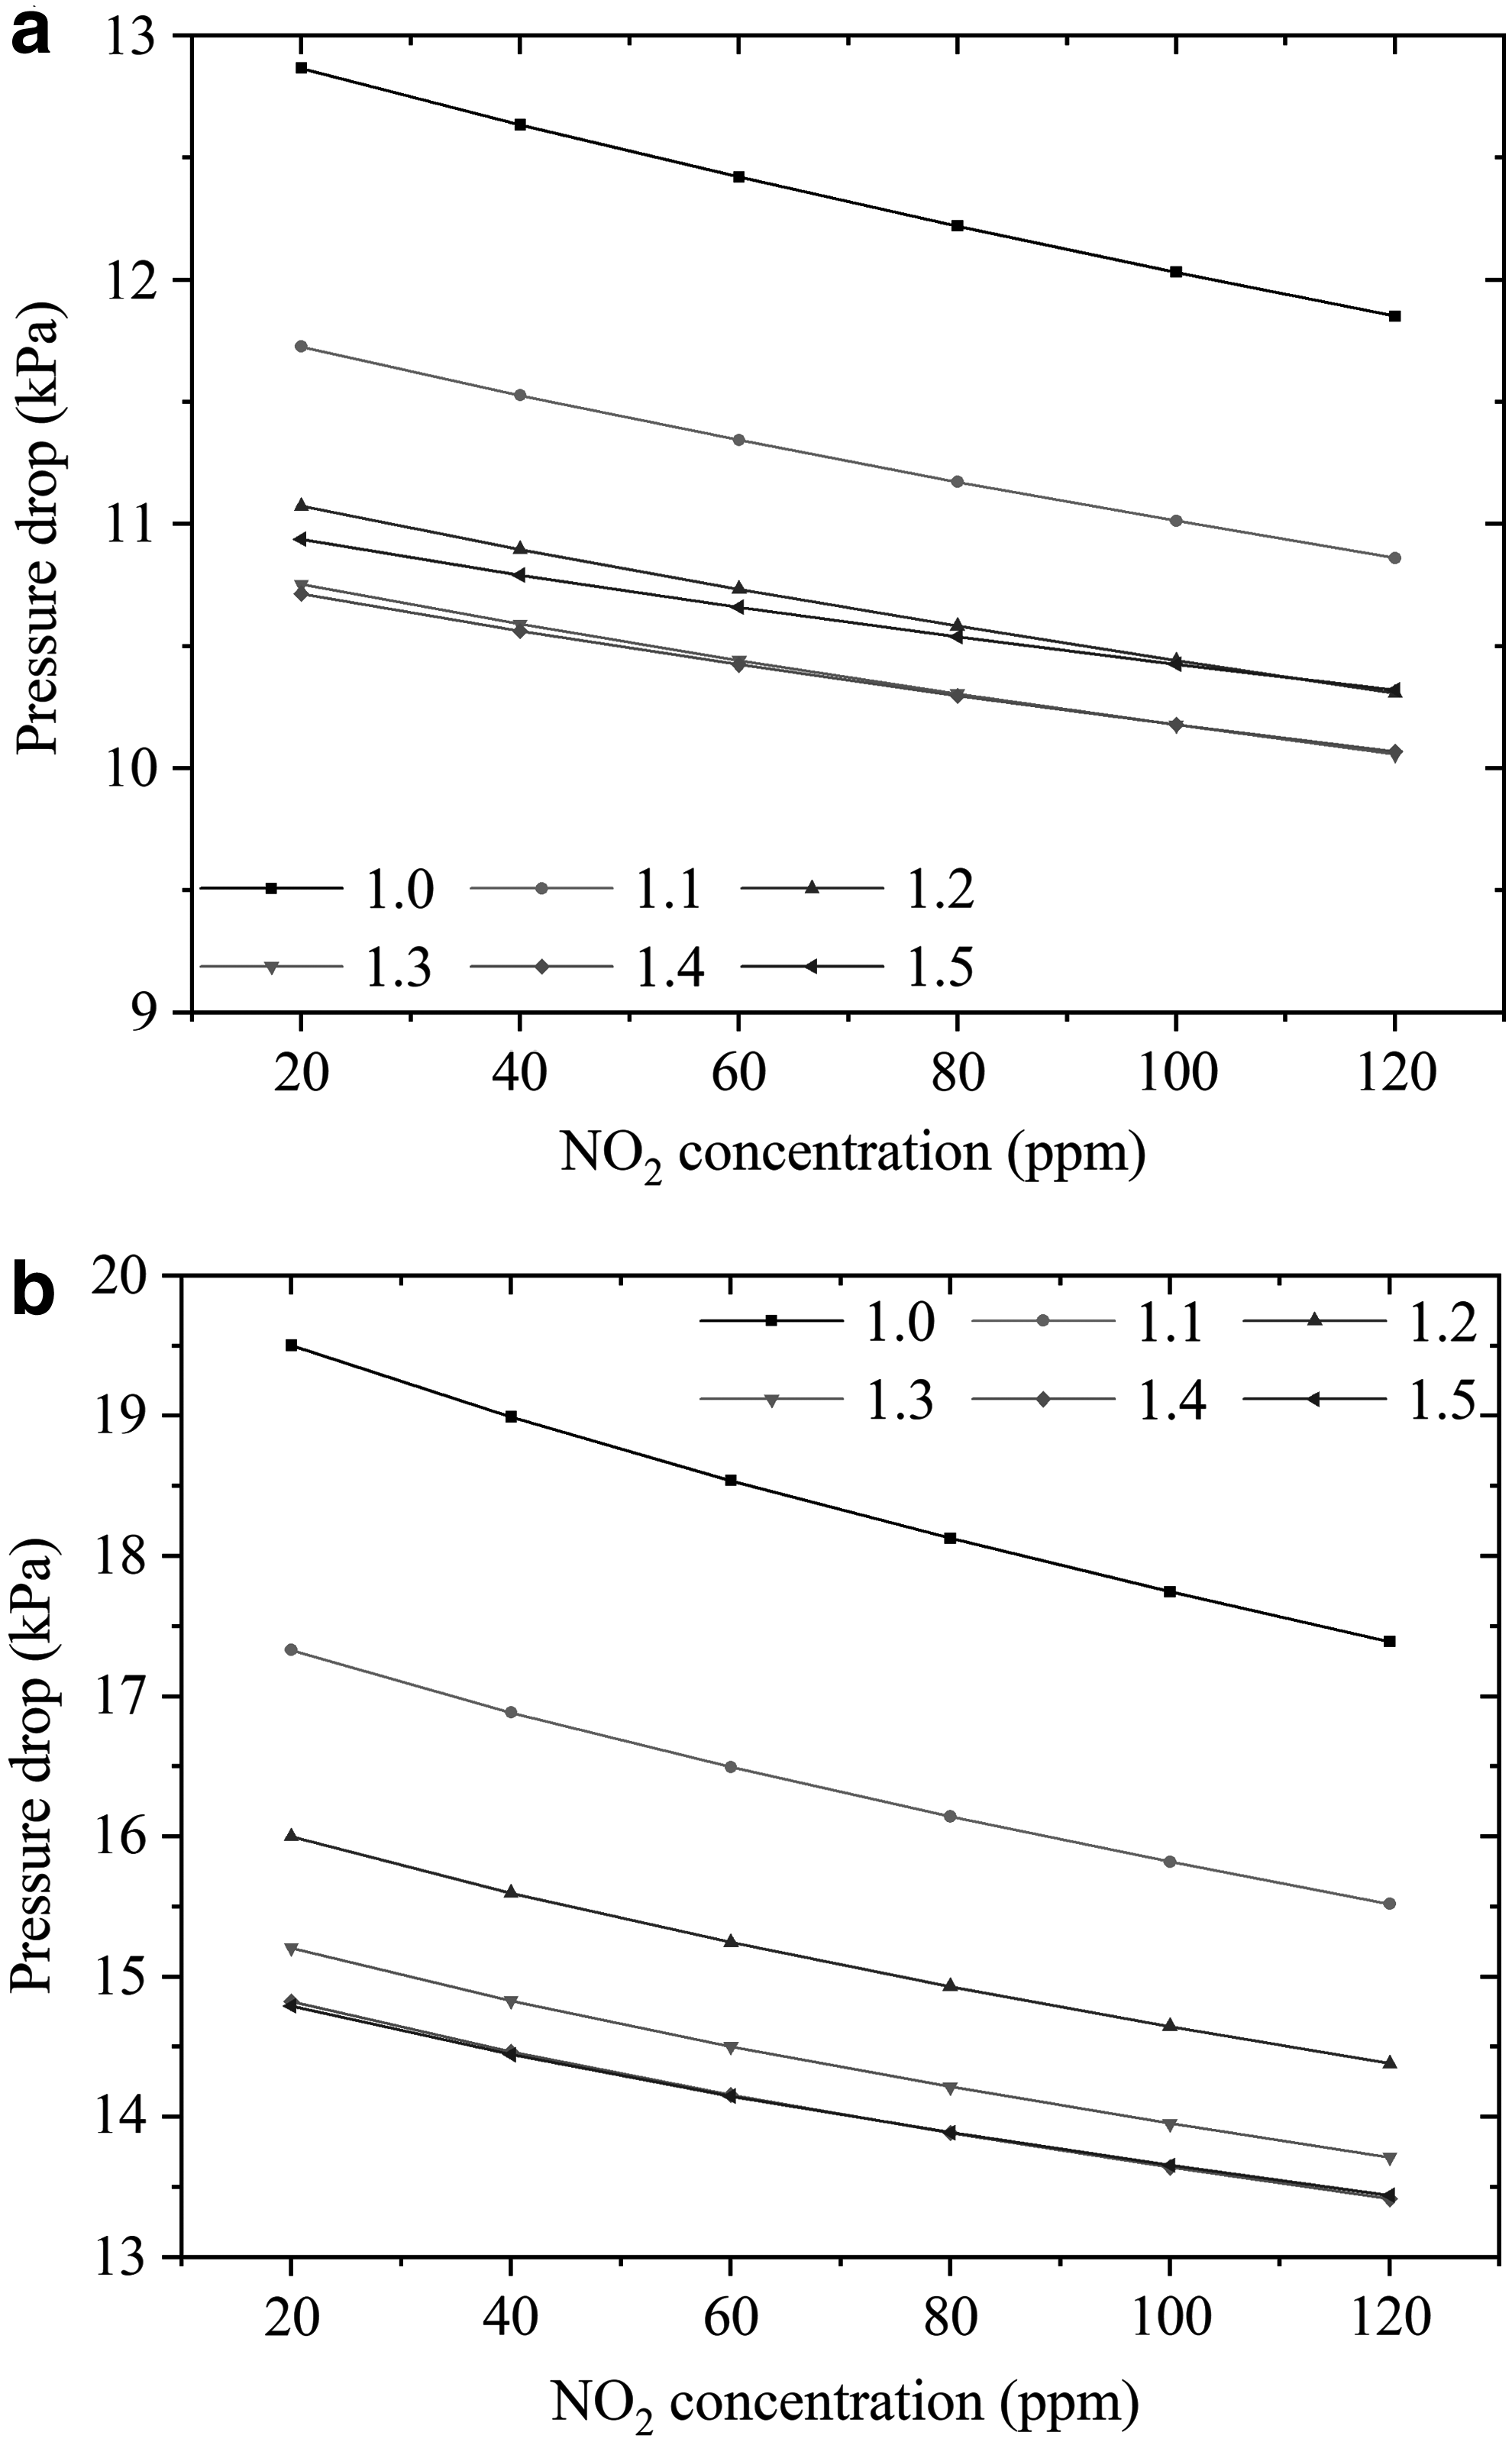
Effects of NO2 concentration on pressure drop at various asymmetry ratios (inlet exhaust temperature is 330°C, flow rate is 0.245 std-m3/s, 13.67% O2), soot loadings
First of all, it can be seen that with increasing of NO2 concentration, the pressure drop shows a decreasing trend and the effect of NO2 on pressure drop is greater compared with O2. NO2 is the main oxidant in the regeneration process. As NO2 concentration increases, more soot can be oxidized, so the pressure drop decreases. At a soot loading of 0 g/L, the pressure drop decreases as the asymmetric ratio increases from 1.0 to 1.3, whereas the pressure drop begins to increase when the asymmetry ratio increases to 1.5. At the soot loading of 6 g/L, when the asymmetry ratio is between 1.0 and 1.4, the pressure drop decreases with increasing of asymmetry ratio. The pressure drop curves of 1.4 and 1.5 are basically the same. Hence, the best asymmetric ratio at 0 and 6 g/L soot loadings is different, and the OAR is 1.3 at 0 g/L, while the OAR is 1.4 at 6 g/L, under different NO2 concentrations.
Based on the OAR analysis under different operating conditions, it can be found that the optimal asymmetry ratio under different conditions is not fixed. In summary, although the optimal asymmetry ratio under different initial conditions is different, the OAR can be determined within the range of 1.3–1.4, specifically tending to be 1.3 under 0 g/L soot loading and 1.4 under 6 g/L soot loading.
Influences of exhaust gas parameters on NO2 assisted regeneration performance
Based on above discussion, the results are applied to investigate the performance of the passive regeneration for the 6 g/L soot loadings with asymmetrical ratio of 1.4 and 0 g/L soot loadings with asymmetric ratio of 1.3. The starting point of this section is to explore the low temperature oxidation ability of NO2 to provide a clear understanding of NO2 oxidation ability.
First of all, the inlet temperature is studied. Figure 13 gives the relationship between deposited soot mass and inlet temperature. In this study, the range of the inlet temperature is from 270°C to 420°C, and the O2 thermal oxidation isn't considered. When the inlet temperature is lower than about 330°C, the accumulated soot increases with time, which indicates that the soot deposition rate is greater than the oxidation rate. As the temperature increases, the soot oxidation rate increases. When inlet temperature is higher than 330°C, the deposited soot decreases with time, indicating that the soot oxidation rate is higher than the deposition rate. At about 330°C, the soot deposition rate and oxidation rate are basically the same, and the amount of soot on the DPF remained basically unchanged.
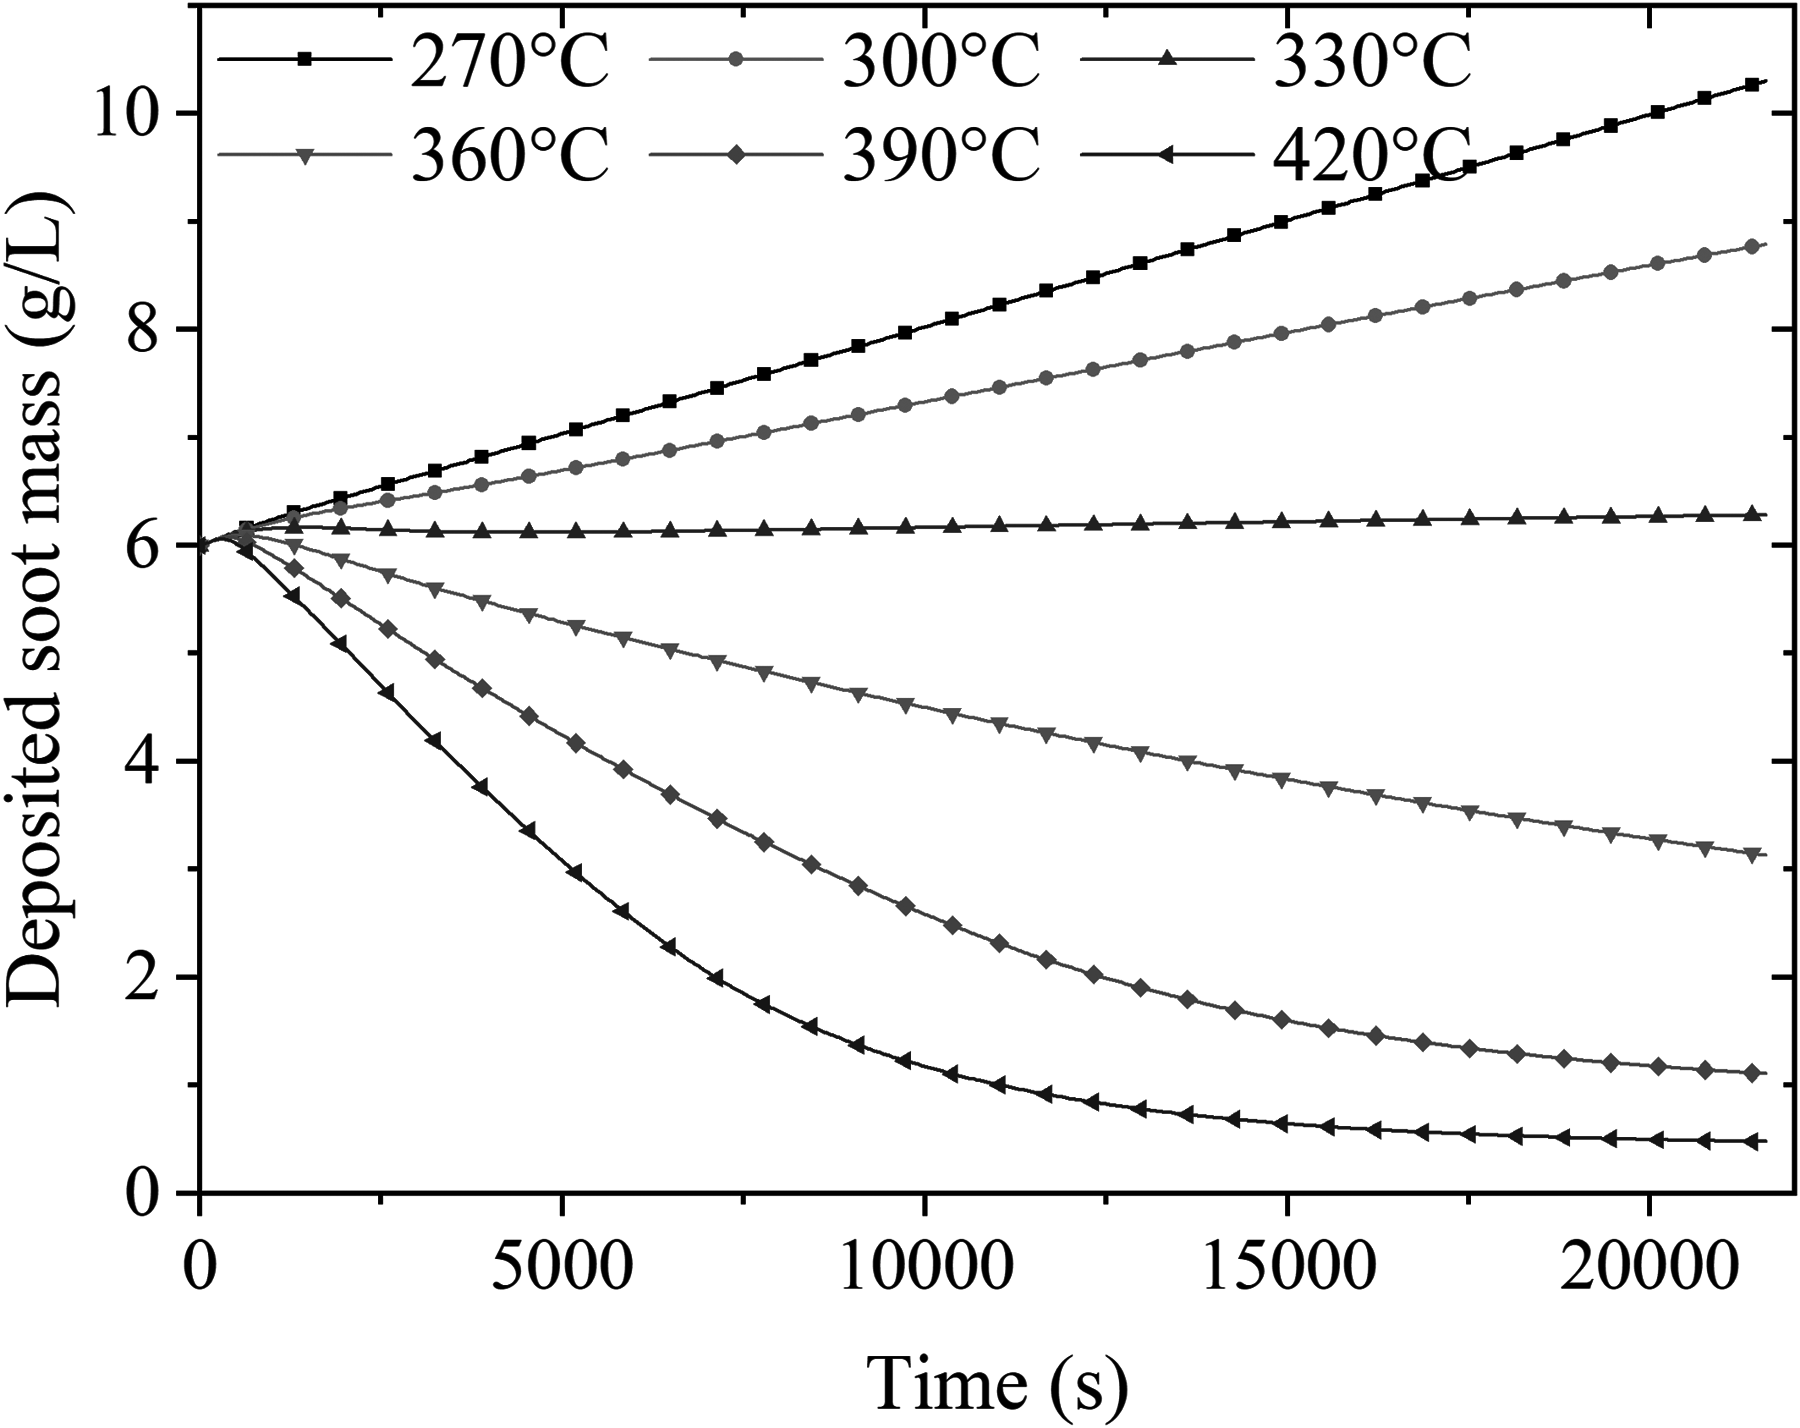
Effects of exhaust temperature on soot mass retained in CDPF.
To study the ability of passive regeneration for the CDPF, the oxidation mass (percentage) at different exhaust temperatures is shown in Fig. 14 for 0 and 6 g/L soot loadings. It can be seen that the percentage of oxidation mass increases with increasing inlet temperatures. The change trend is similar at different soot loadings. The specific values of oxidation amount can be expressed as follows.
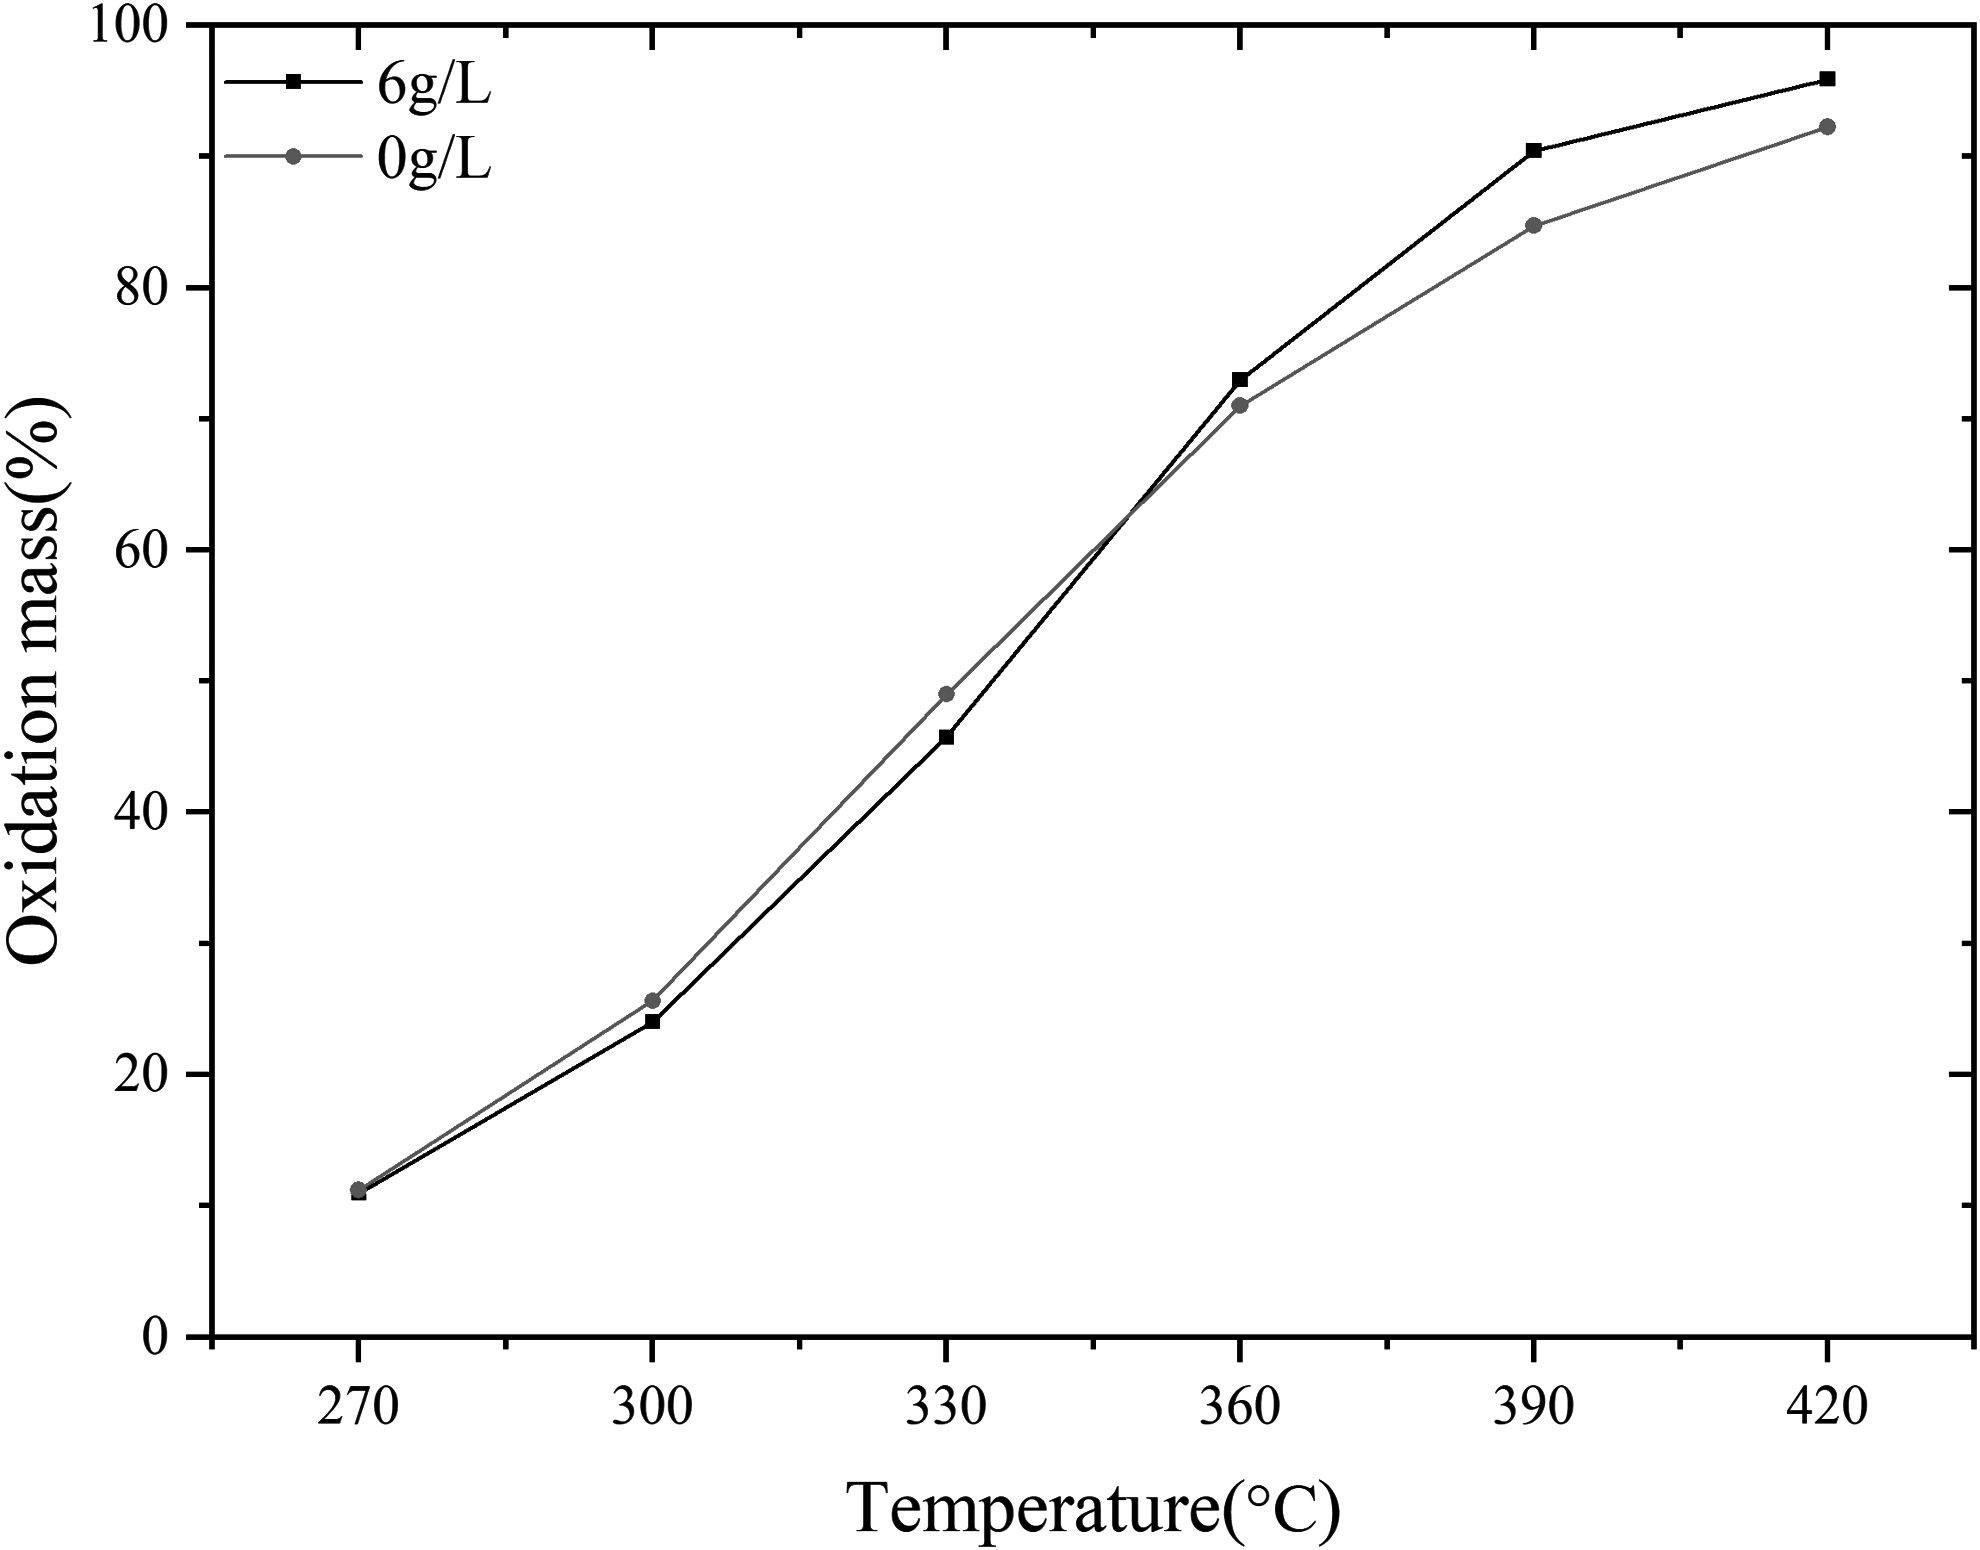
Comparison of oxidized soot mass (percentage) under different exhaust temperatures between 0 and 6 g/L.
At 6 g/L soot loadings, 11% of the soot can be oxidized at 270°C; 24% of the soot is oxidized at 300°C; 45% of the soot is oxidized at 330°C; 73% of the soot is oxidized at 360°C; 90% of the soot is oxidized at 390°C; and 96% of the soot is oxidized at 420°C. The exhaust temperature has a great influence on the soot oxidation rate, especially from relatively low to moderate temperatures (from 270°C to 360°C). The oxidation ability of NO2 can be seen clearly. To study the effects of other parameters on passive regeneration under different temperatures, three types of temperatures are chosen, that is, 270°C, 330°C, and 420°C representing lower, moderate, and higher temperatures at the soot loadings of 6 g/L.
Influence of space velocity under different temperatures
Figure 15 gives the relationship between deposited soot mass and space velocity. The space velocities are 5.9/s, 11.8/s, 17.6/s, 23.5/s, 29.4/s, and 35.3/s, and the boundary conditions are: exhaust temperature 330°C, O2 volume concentration 13.67%, NO2 concentration 55 ppm, and soot loading 6 g/L. When the space velocity is lower than 11.8/s, soot decreases over time, which means soot deposition rate is lower than the oxidation rate. When the space velocity is higher than 11.8/s, the deposition rate of soot is higher than the oxidation rate. During the whole process, the soot oxidation rate decreases with increasing space velocity. The deposition rate and oxidation rate are equal at a space velocity of 11.8/s. The increase in space velocity indicates that the resident time of the exhaust gas in the channels is shortened, and the reaction time of NO2 and soot is correspondingly shorter, resulting in the reduction of soot oxidation rate.
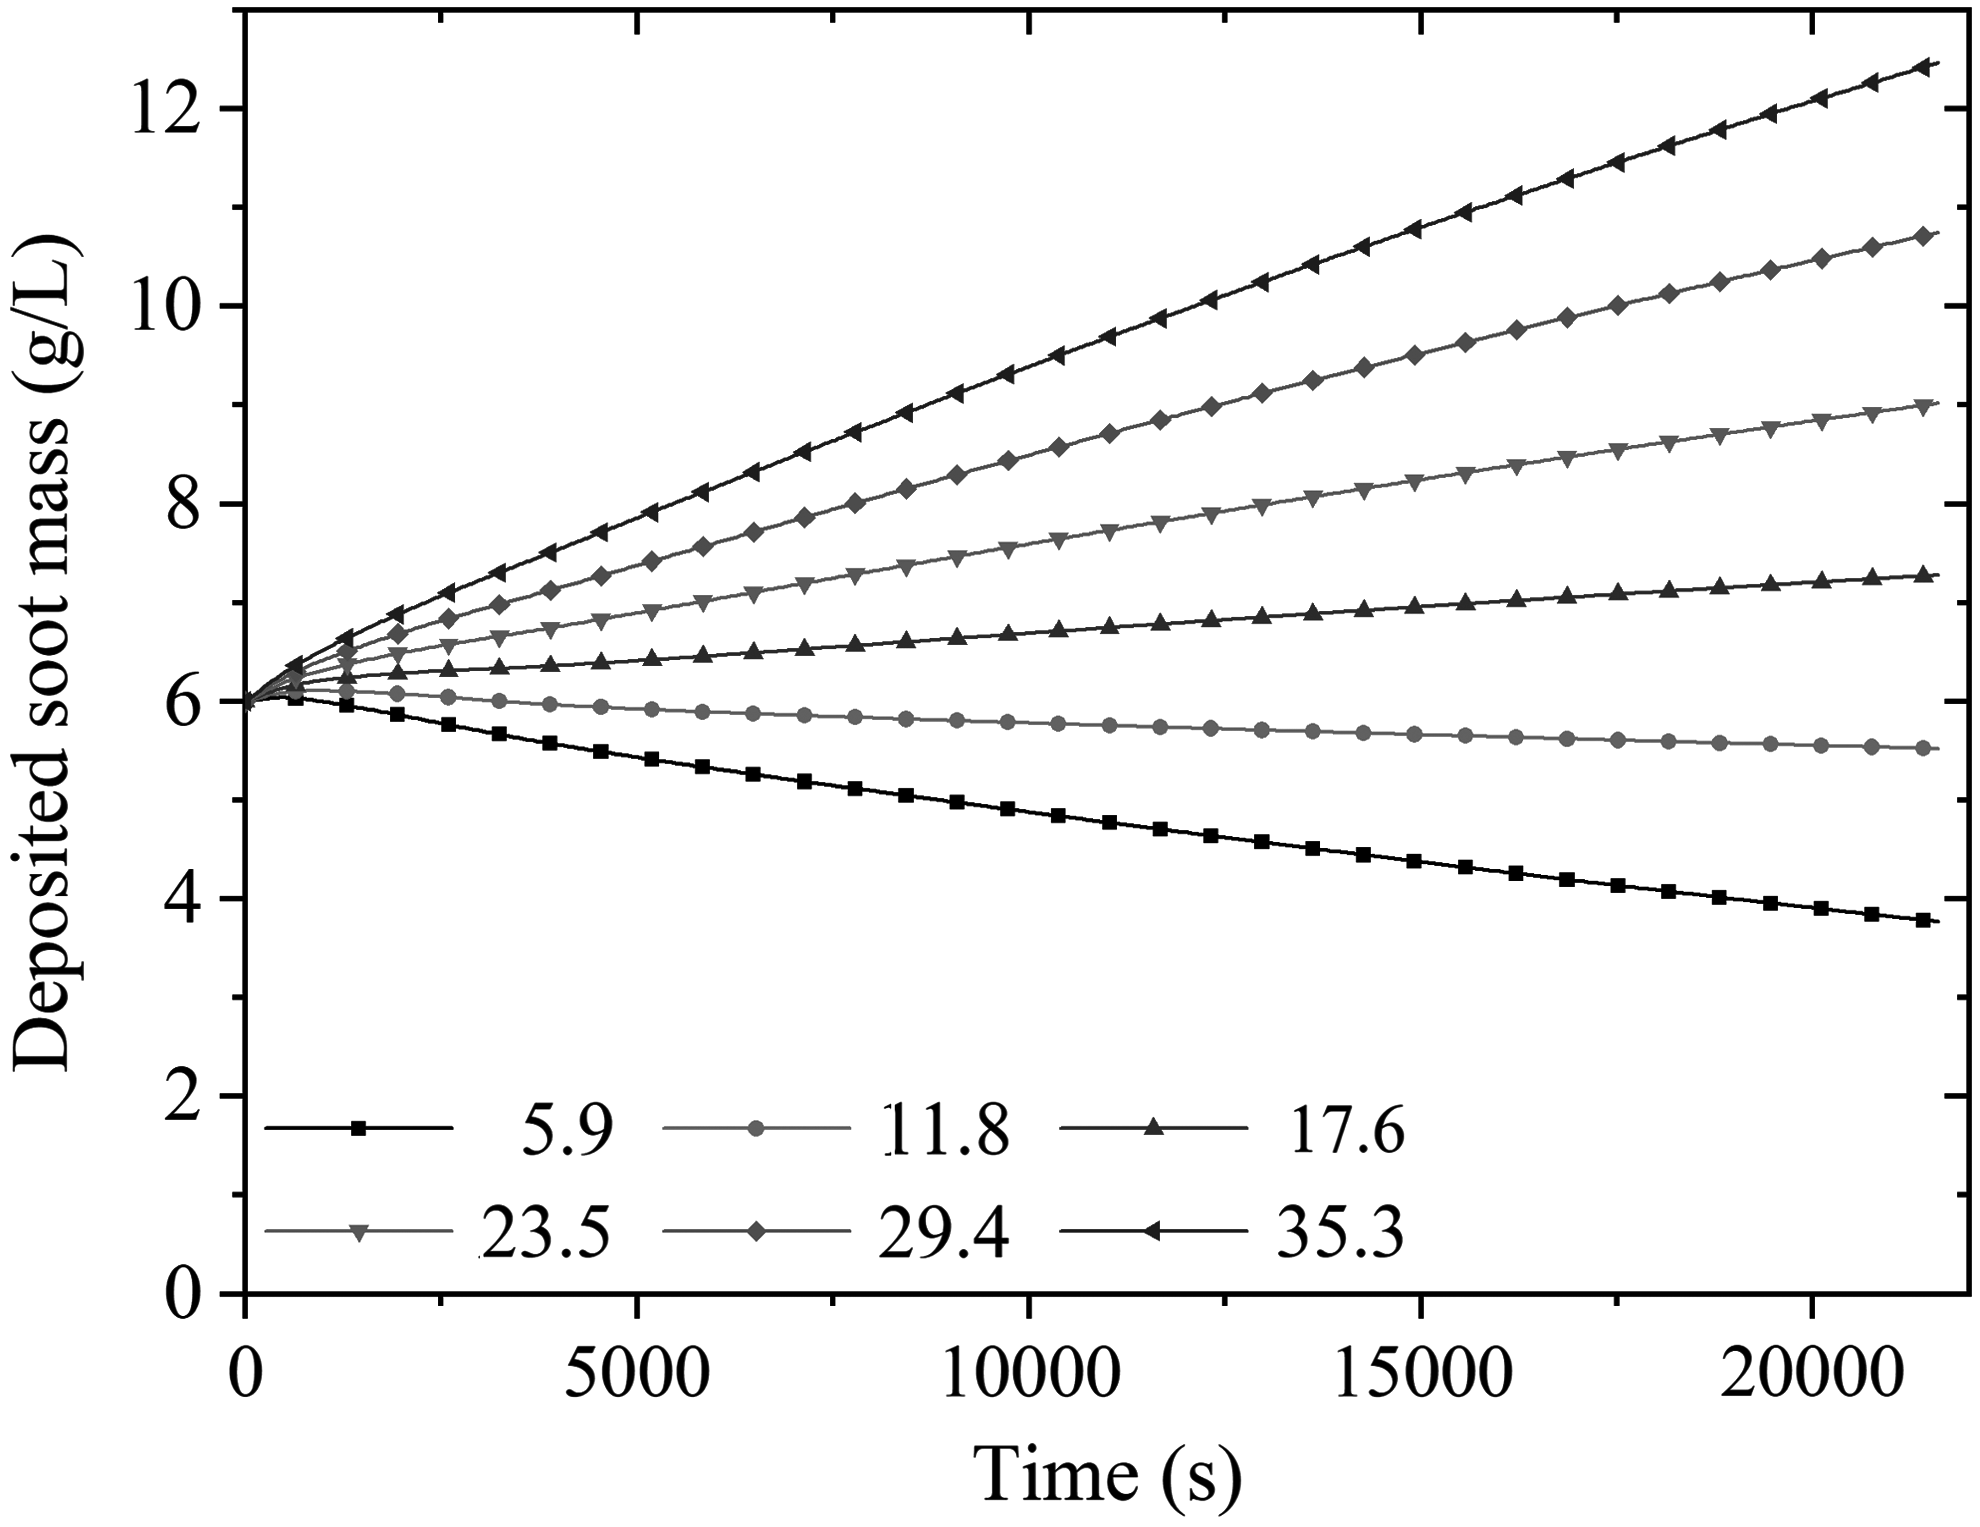
Effects of space velocity on soot mass retained in CDPF.
Figure 16 shows how the oxidation mass varies with space velocities, at exhaust temperatures of 270°C, 330°C, and 420°C, respectively. It's apparent that the oxidation mass is different under the three types of temperatures. When the exhaust temperature is 270°C and 420°C, the oxidation mass changes slowly with increasing of space velocity. The percentage of oxidation mass is around 10% at 270°C and 95% at 420°C. At 330°C, the percentage of oxidation mass is decreasing from the initial 54% to 36%, which means the higher the space velocity, the smaller the amount of oxidized soot. Compared to space velocity, the temperature has a more profound influence on regeneration.

Comparison of oxidized soot varied with space velocity under different exhaust temperatures.
Influence of O2 concentration under different temperatures
Figure 17 shows the influence of O2 concentration on regeneration. The change range of O2 concentration is from 5% to 30%, a very wide range. When the initial soot loading is 6 g/L, the exhaust temperature is 330°C, the exhaust flow is 0.245 m3/s, and the NO2 volume concentration is 55 ppm; with the change of oxygen concentration, the deposited soot changes slightly. When the oxygen concentration is lower than 15%, the soot mass increases slowly with time, and the soot deposition rate is greater than the oxidation rate. When the oxygen concentration is higher than 15%, the soot oxidation rate is higher than the deposition rate. When the oxygen concentration is about 15%, the soot deposition rate is equal to oxidation rate.
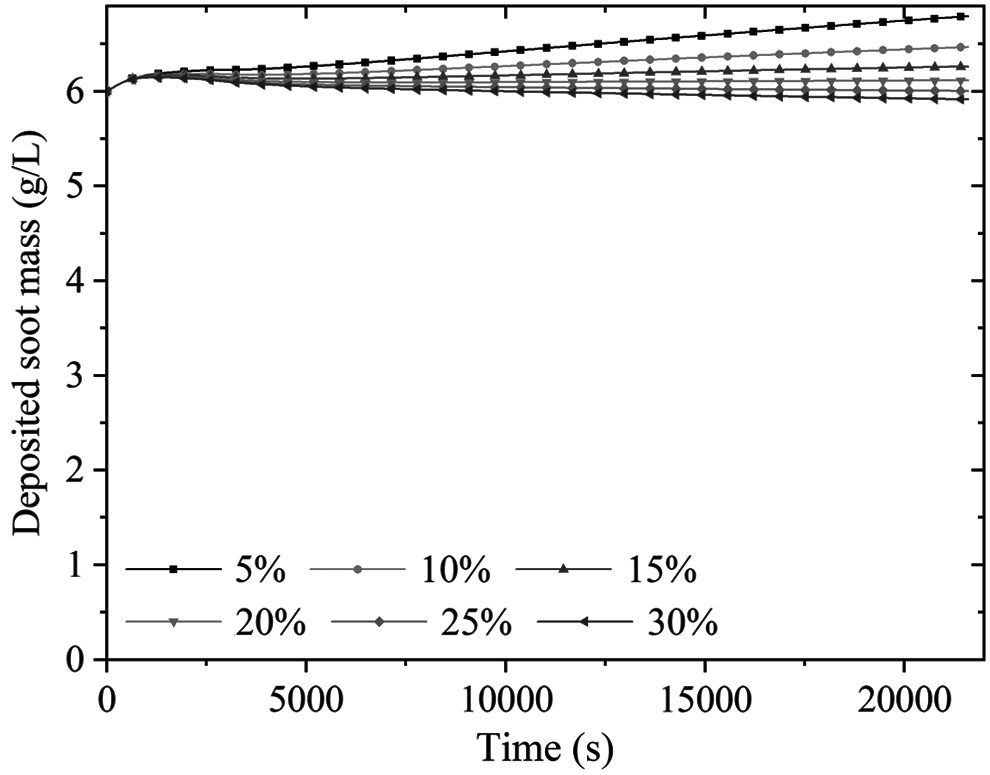
Effects of O2 concentration on soot mass retained in CDPF.
The oxidation mass varies with oxygen concentration at exhaust temperatures of 270°C, 330°C, and 420°C, as shown in Fig. 18. The percentage of oxidation mass increases slowly with increasing oxygen concentration, at the three temperatures; the corresponding percentages are 10%, 45%, and 95%. The change of oxygen concentration has no significant effect on soot regeneration. Oxygen affects the passive regeneration by affecting the amount of NO2. O2 generates NO2 through NO oxidation, then the generated NO2 diffuses back to the soot layer to react with it, so there is a time lag between the change of oxygen concentration and oxidation mass. So the influence of O2 concentration on regeneration is slight.
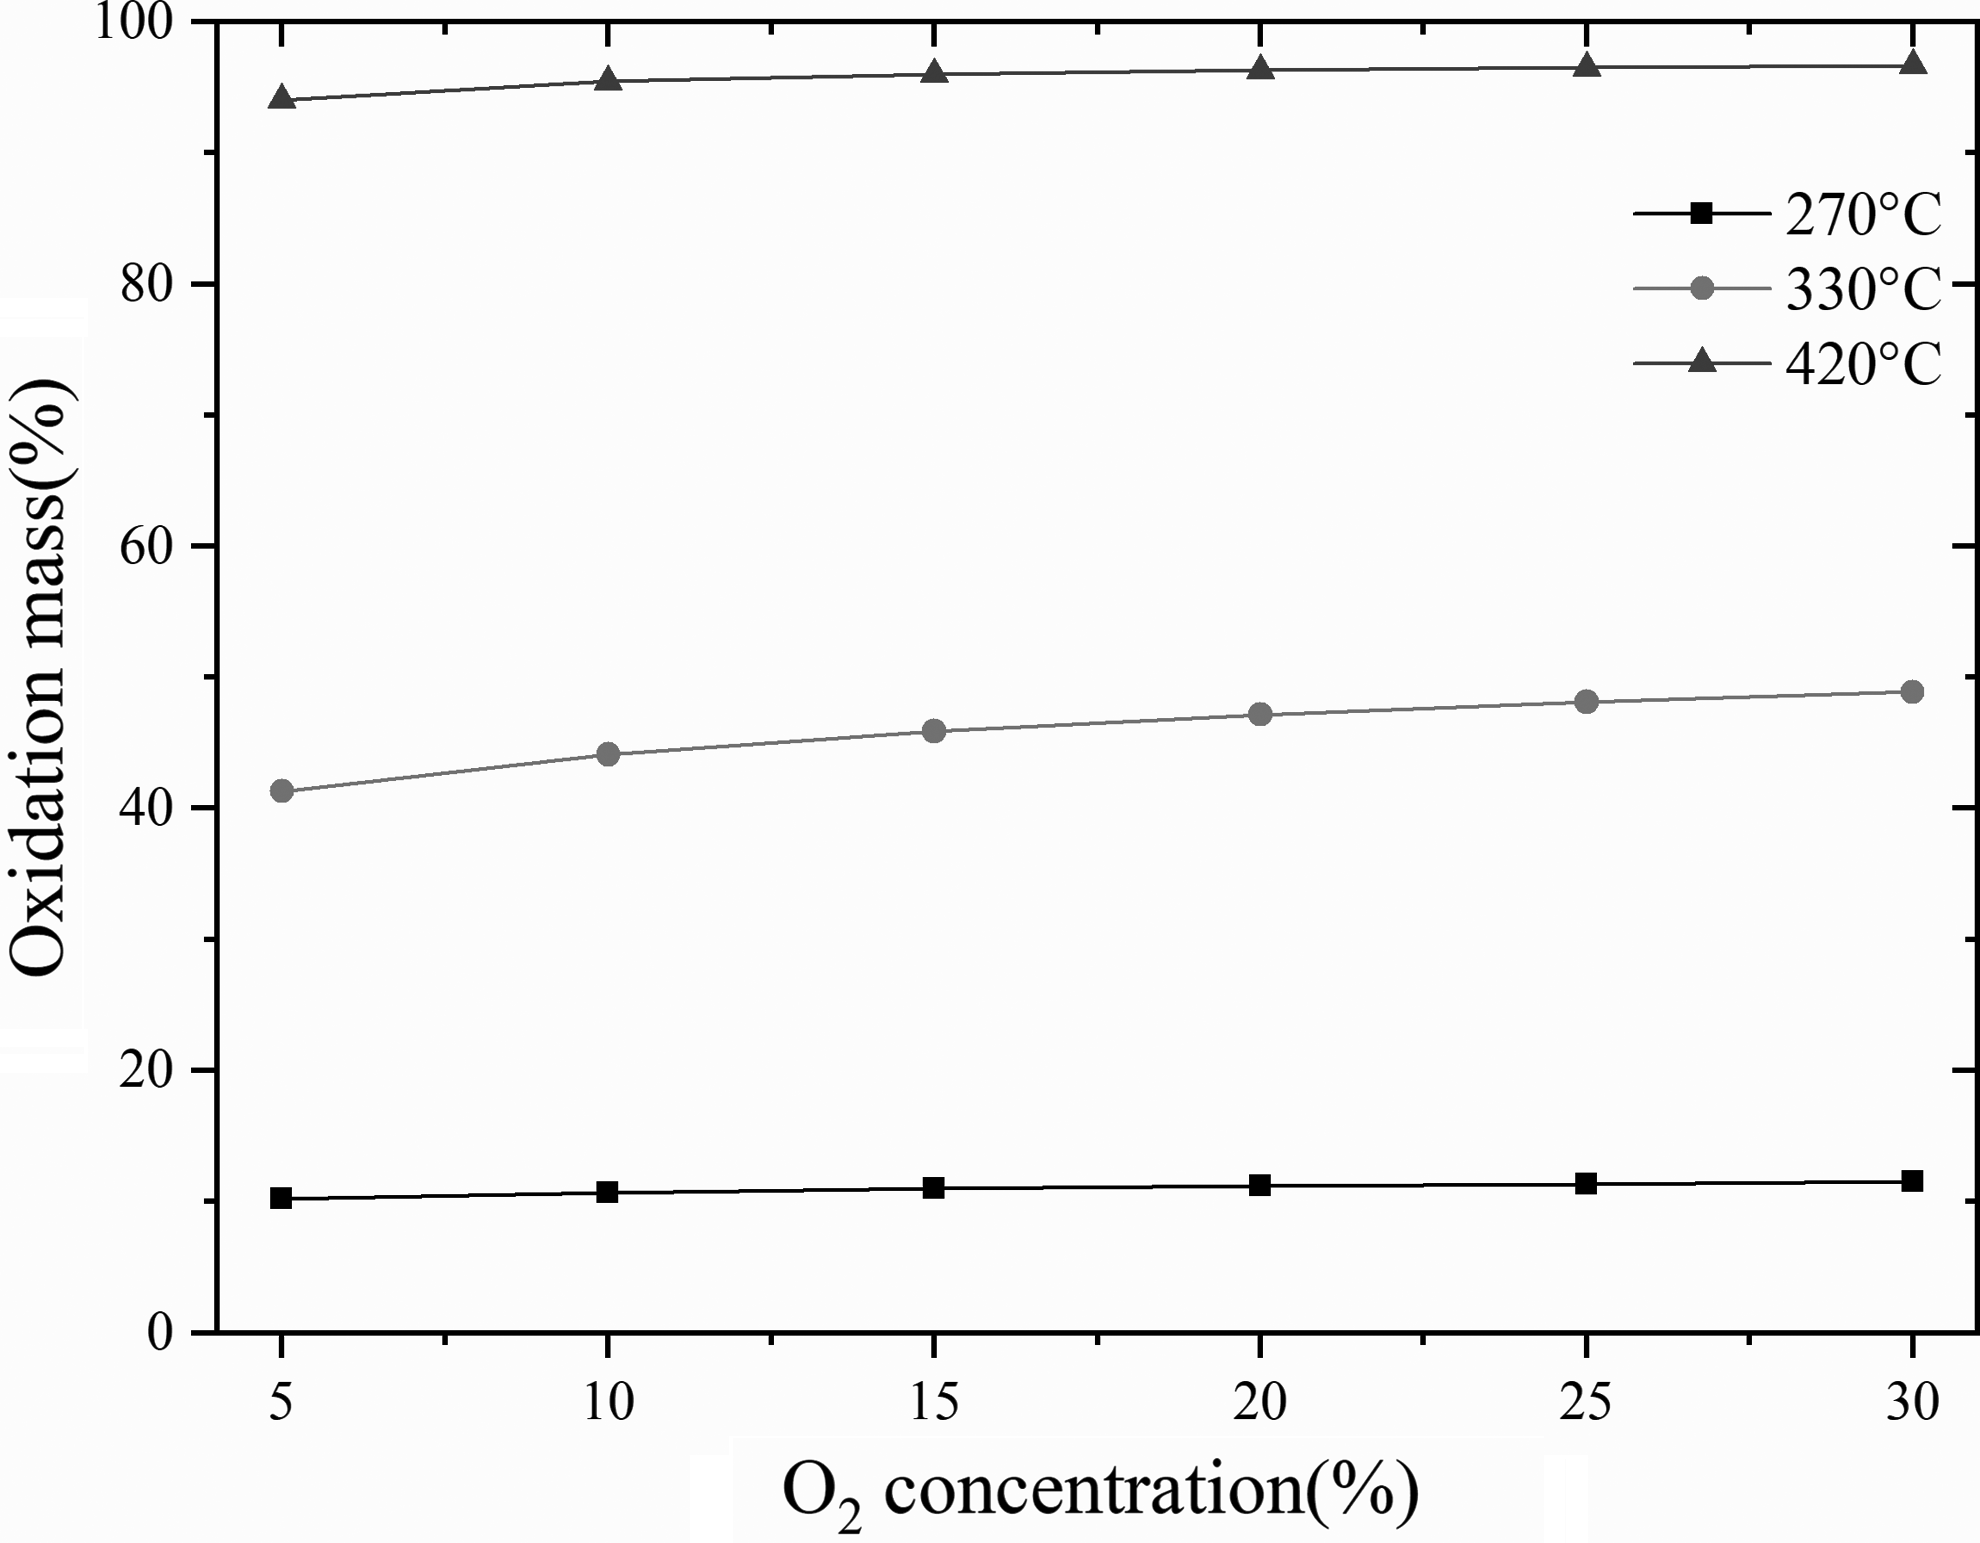
Comparison of oxidized soot varied with O2 concentration under different exhaust temperatures.
Influence of NO2 concentration under different temperatures
In Fig. 19, the relationship between deposited soot mass and NO2 concentration is given. The boundary conditions are that: exhaust temperature 330°C, exhaust gas flow rate 0.245 m3/s, and oxygen concentration 13.67%. The range of NO2 concentrations is from 20 to 120 ppm. Based on this, it can be investigated whether NO2 concentration has a significant effect on regeneration in CDPF. As the NO2 concentration increases, the oxidation rate of soot is enhanced. Oxidation and deposition rates reach a balance when NO2 concentration is 60 ppm.
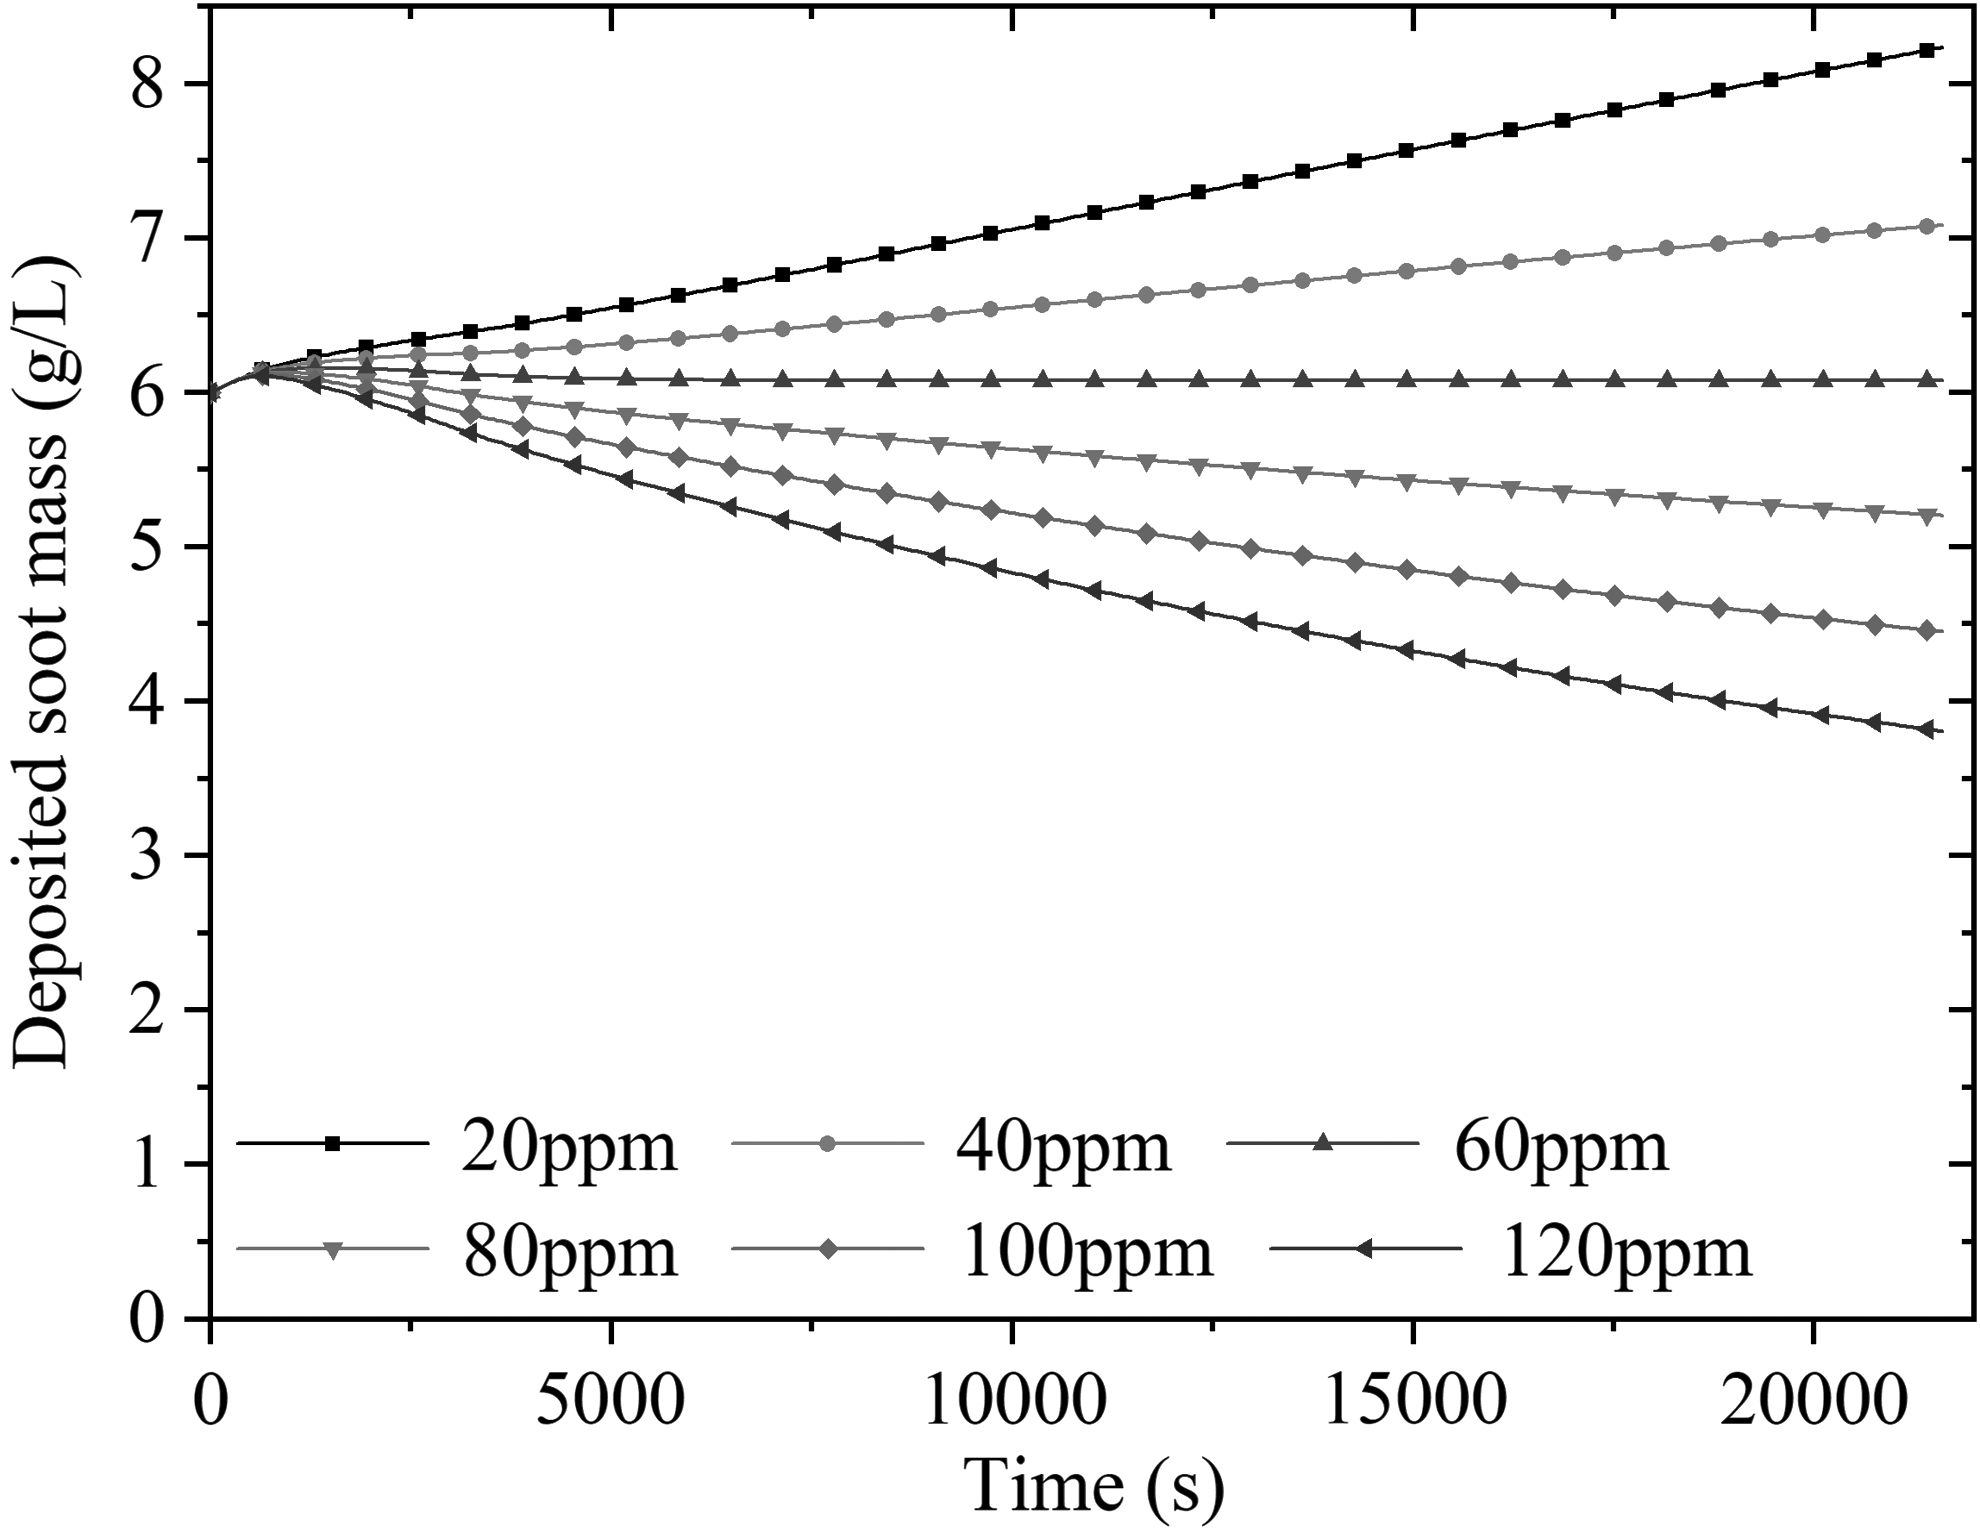
Effects of NO2 concentration on soot mass retained in CDPF.
The effects of NO2 concentration under different temperatures are shown in Fig. 20. The percentage of oxidation increases from 6% to 19% at 270°C; increases from 29% to 67% at 330°C; and increases from 91% to 98% at 420°C. With the increase of NO2 concentration, the oxidation rate is improved greatly. As the main oxidant of passive regeneration, NO2 concentration plays an important role in soot oxidation, especially at moderate temperatures. At high temperatures, the change of oxidation mass is small, and temperature is the dominant factor.

Comparison of oxidized soot varied with NO2 concentration under different exhaust temperatures.
Influence of NO2/PM ratio under different temperatures
For soot regeneration speed, the inlet NO2/PM mass ratio is an important parameter. Figure 21 shows the influence of NO2/PM ratio on regeneration. The range of the NO2/PM ratio is from 3 to 28; the NO2 concentration and soot concentration are both changed. It can be investigated whether the NO2/PM ratio has a great impact on regeneration in CDPF. As the NO2/PM ratio increases, the oxidation rate of soot increases. When the ratio of NO2/PM is 3, the deposited soot increases with time, which means the soot deposition rate is larger than the oxidation rate. When the ratio of NO2/PM is greater than 8, the deposited soot decreases with time. When NO2/PM ratio is between 3 and 8, the oxidation rate is equal to the deposition rate.

Effects of NO2/PM on soot mass retained in CDPF. PM, particulate matter.
The effects of NO2/PM ratio under different temperatures are shown in Fig. 22. The effect is the same as NO2 concentration. The influence of NO2/PM ratio is more obvious at 270°C and 330°C, where the percentage of oxidation mass increases from 7% to 38% at 270°C and from 31% to 90% at 330°C. While at 420°C, the change is slight.
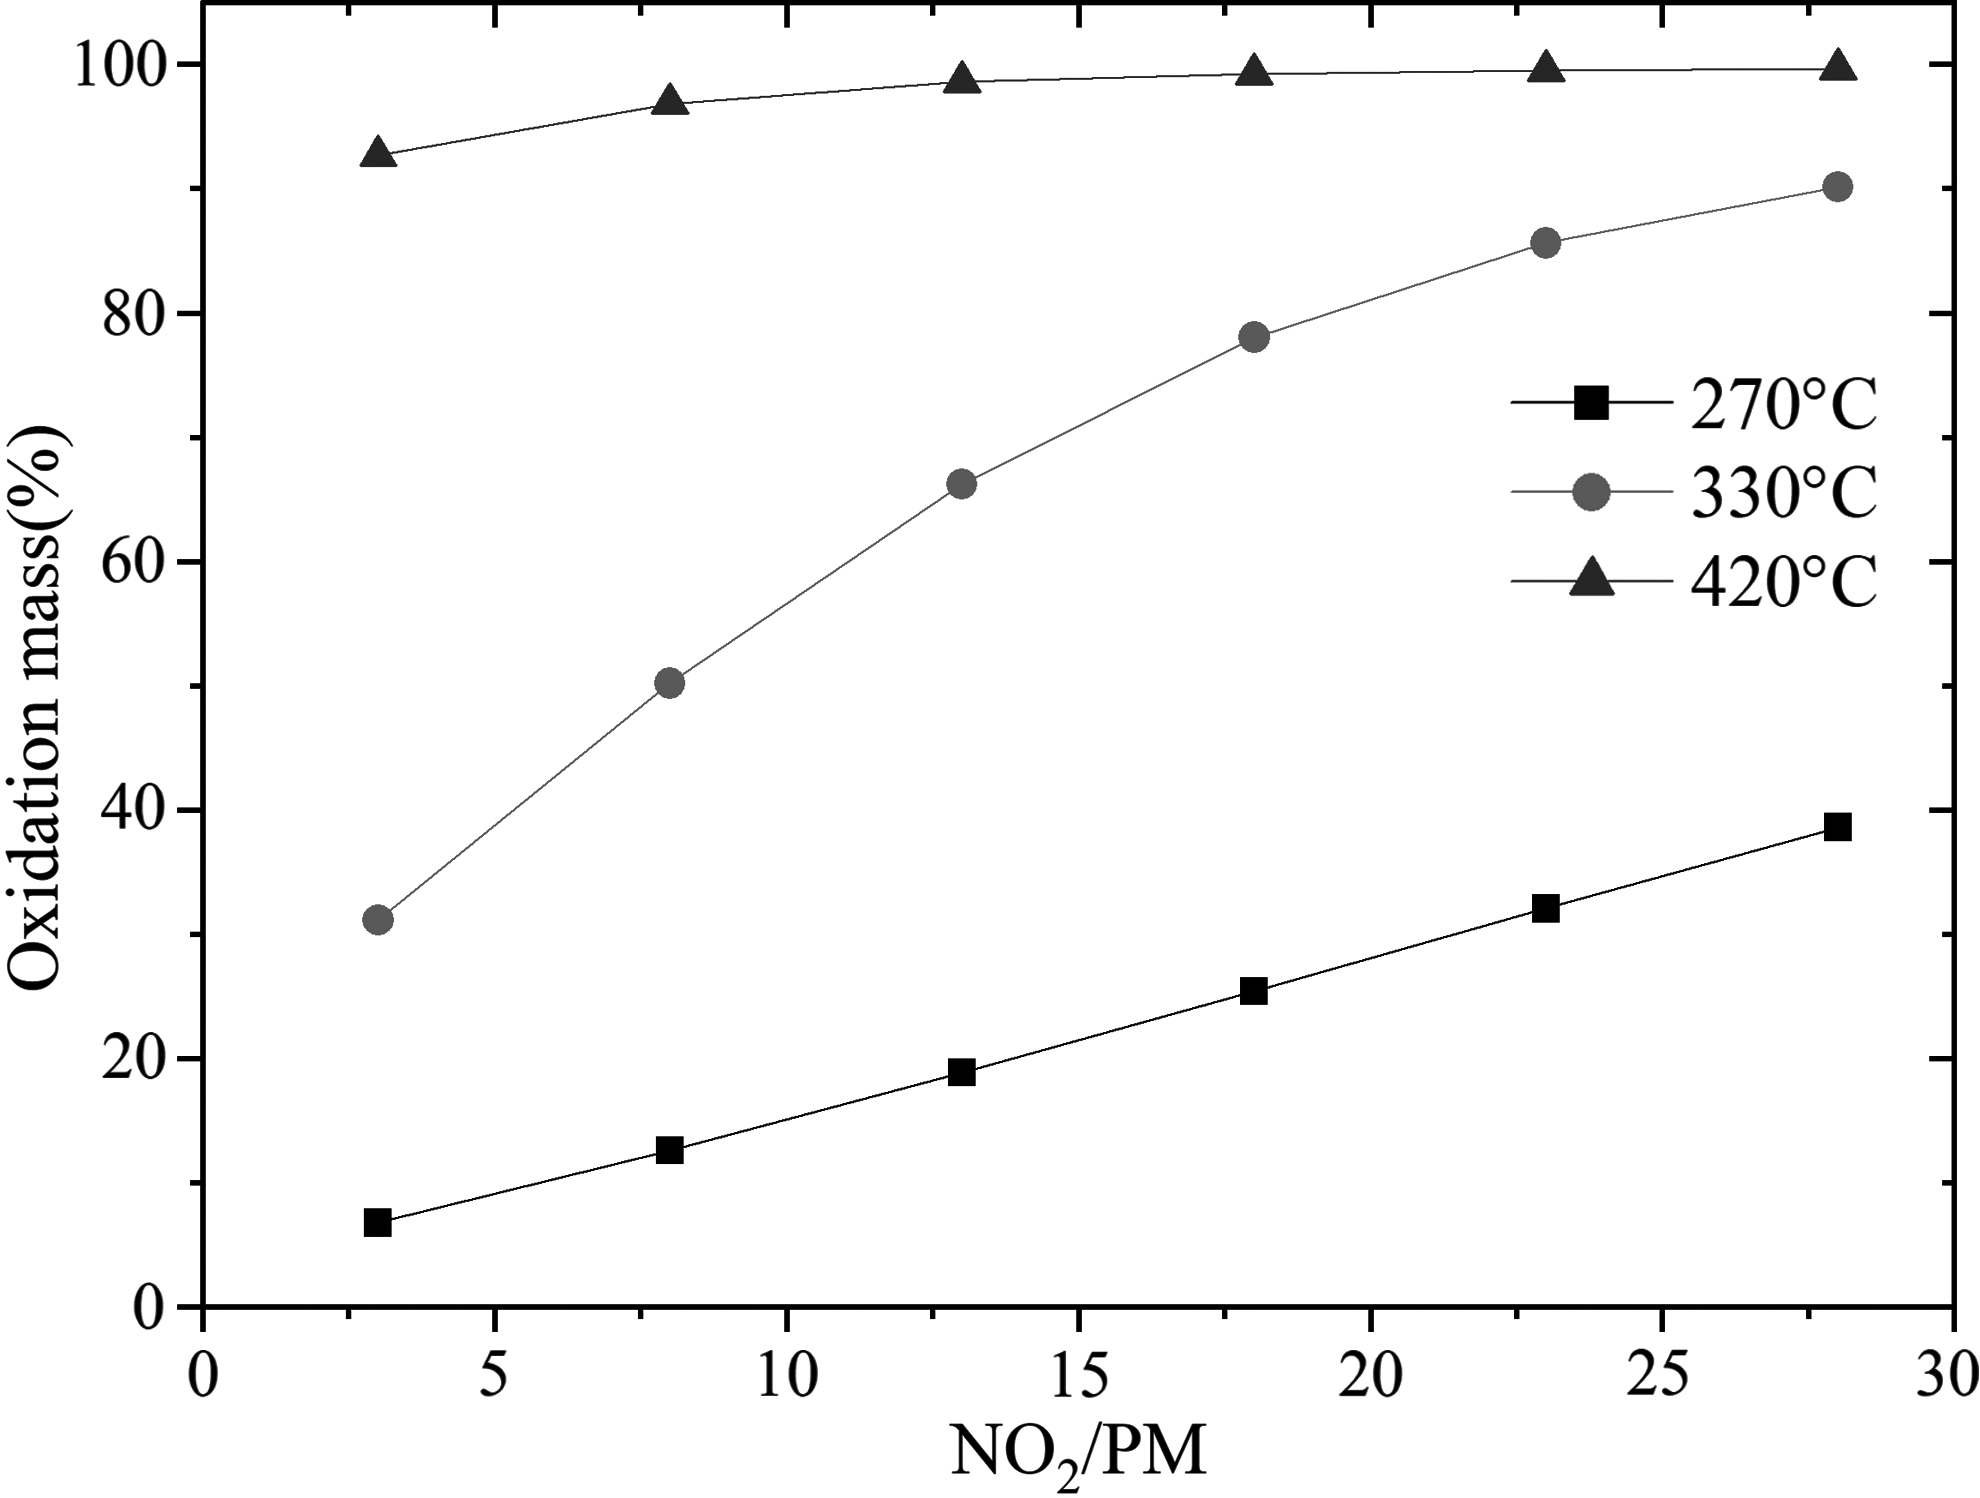
Comparison of oxidized soot varied with NO2/PM under different exhaust temperatures.
Analysis of NO2/NOx ratio downstream of CDPF
The incorporation of an NO2 assisted regeneration mechanism can have a significant impact on the NO2 concentration downstream of the CDPF. NOx itself is a regulated pollutant, so the NO2/NOx concentration downstream of the CDPF is also studied.
In Fig. 23, the relationship between NO2/NOx ratio downstream of the CDPF and inlet temperature is given. It can be seen that the NO2/NOx ratio is increasing slowly from the inlet temperature of 270–330°C, and then the ratio decreases from 330°C to 420°C. When the temperature is relatively low, the NO oxidation reaction (NO2 production) and the PM oxidation reaction (NO2 depletion) are both enhanced with increasing temperature. The two reaction rates are quite high, so the NO2/NOx ratio remains basically unchanged. When the temperature is higher, the NO oxidation reaction is restricted by chemical reaction kinetics, the NO2 decomposition reaction and PM oxidation are enhanced, so the NO2 concentration decreases sharply.
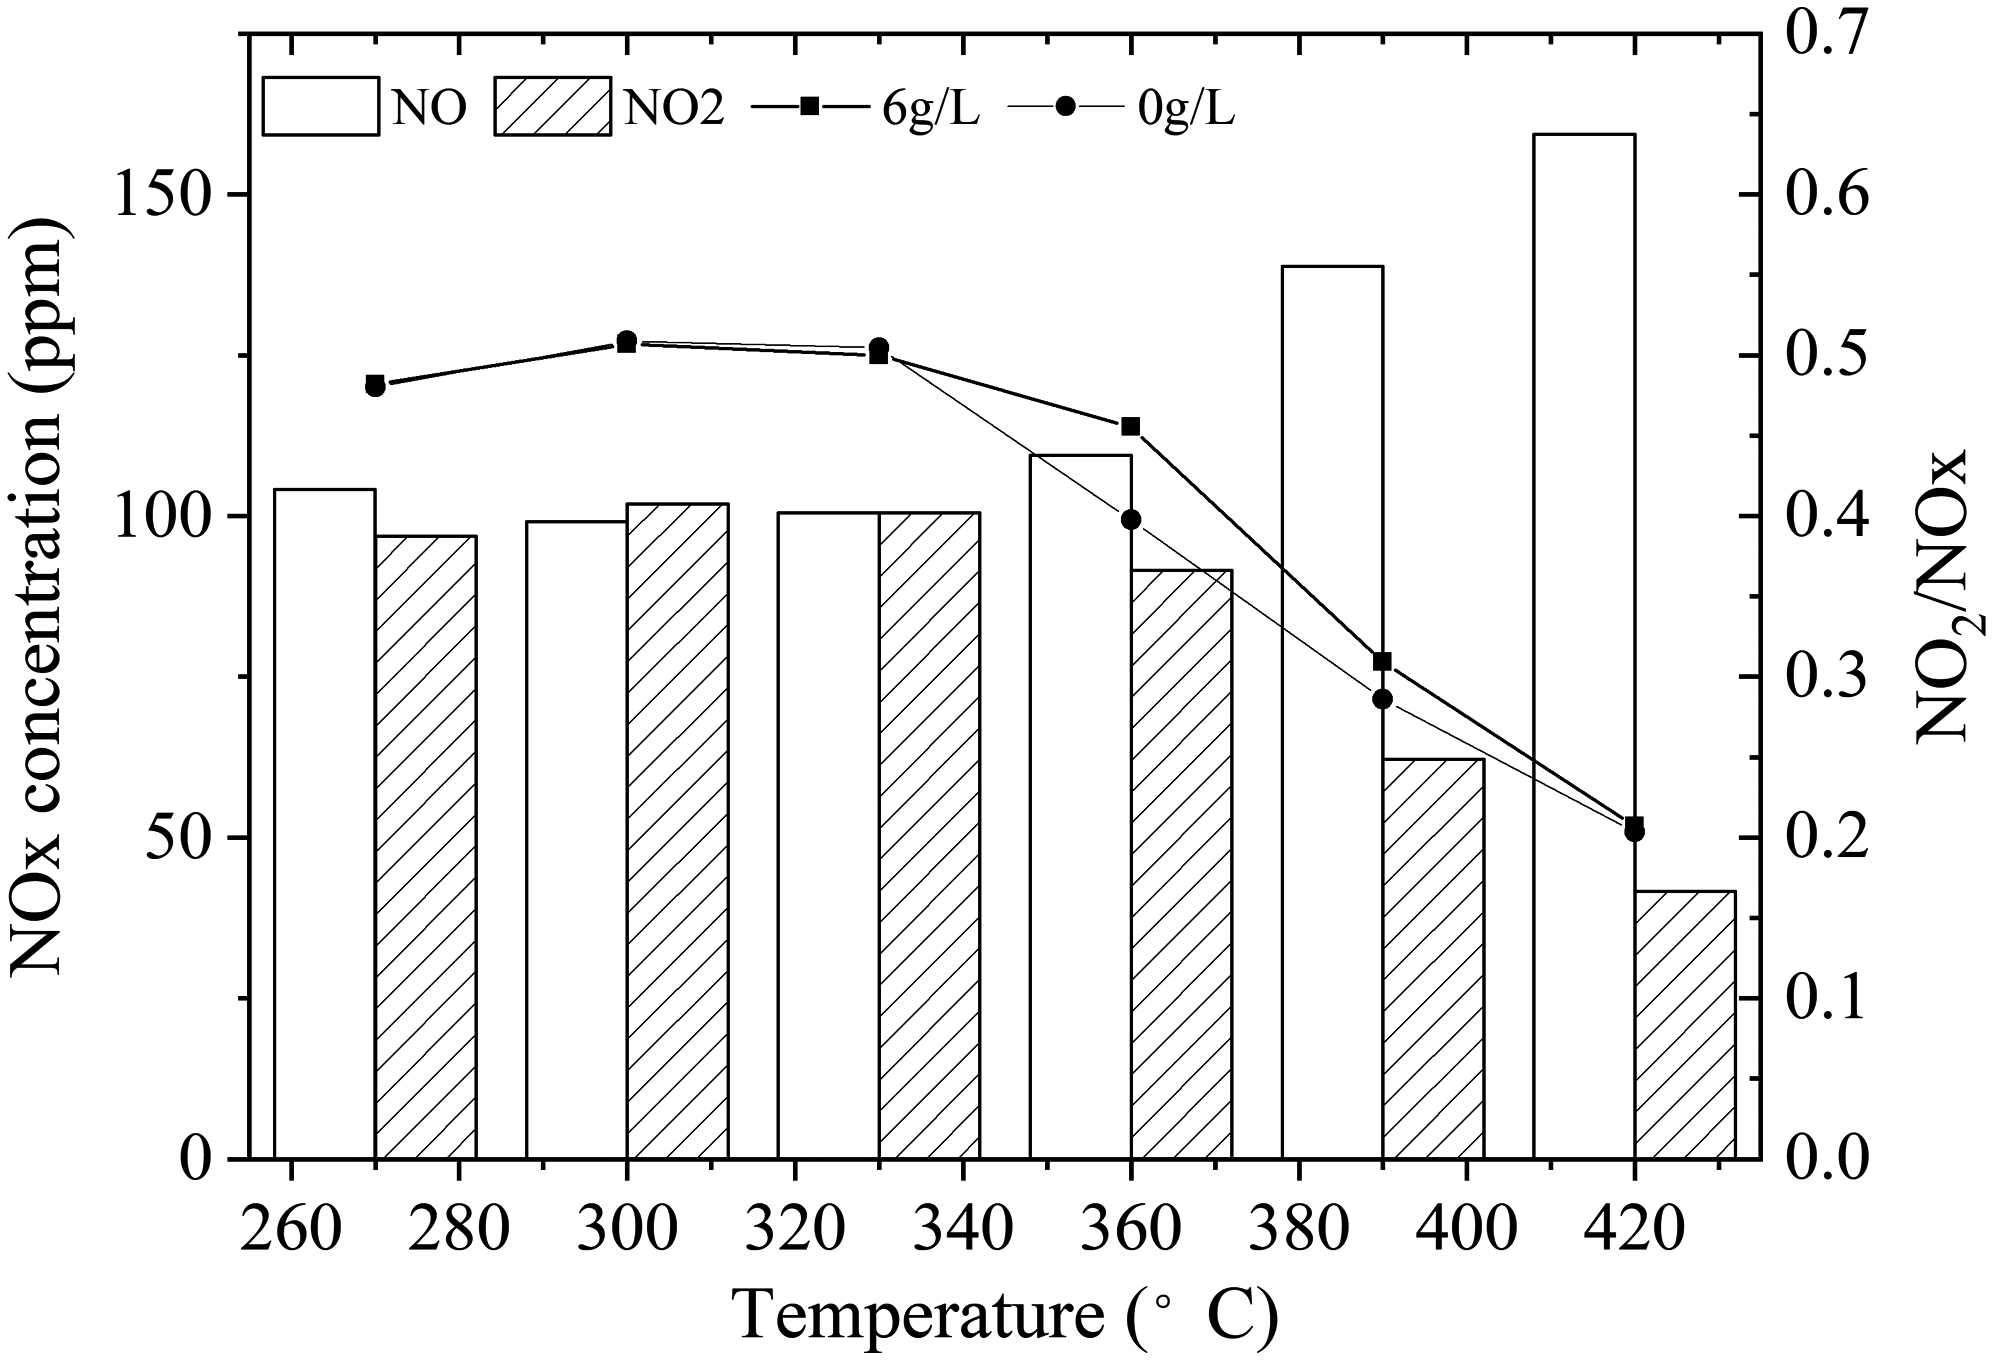
Effects of exhaust temperature on NOx concentration downstream of CDPF.
The changes of NO2/NOx ratio downstream of the CDPF at different space velocities are shown in Fig. 24; the exhaust temperature is chosen at 330°C. When the soot loading is 6 g/L, the NO2/NOx ratio downstream of the CDPF decreases with increasing space velocity, but the reduction is small. The range of NO2/NOx ratio is from 0.58 to 0.41. As the space velocity increases, the reaction time shortens, both the soot oxidation reaction and the NO oxidation reaction are inhibited, but the oxidation reaction of NO is more affected. So, the final NO2/NOx ratio decreases.
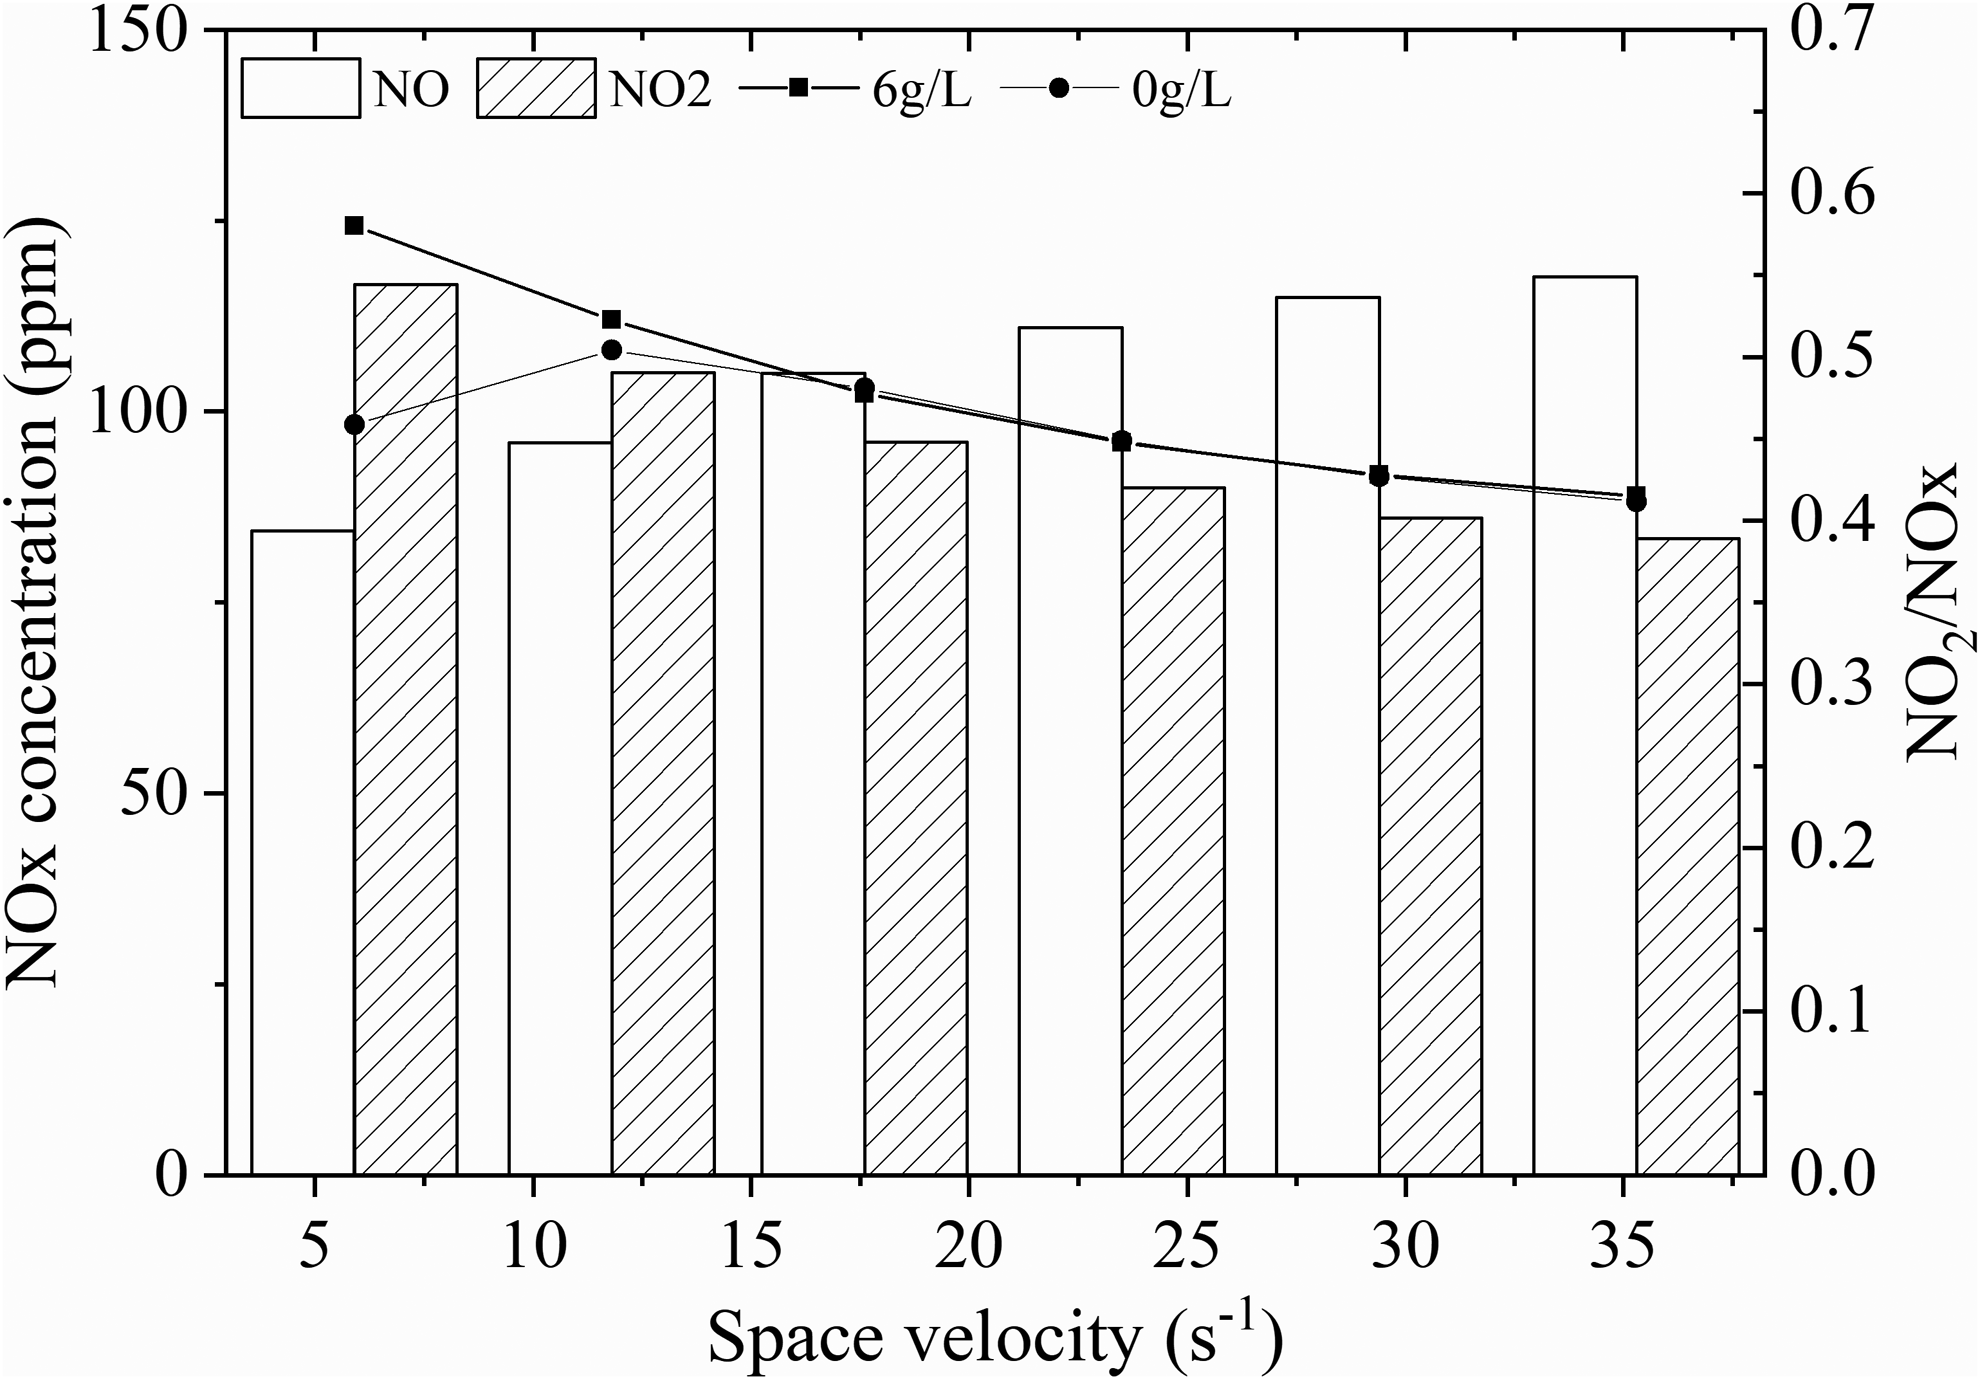
Effects of space velocity on NOx concentration downstream of CDPF.
Figure 25 shows the change in the NO2/NOx ratio downstream of the CDPF at different oxygen concentrations. The NO2/NOx ratio increases with increasing inlet O2 concentration, and the variation range of NO2/NOx ratio downstream of the CDPF is from 0.39 to 0.61 under the range of O2 concentrations examined. The change trend is basically same at the two soot loadings. The concentration of oxygen has little effect on soot regeneration, but has an important effect on the NO2/NOx ratio downstream of the CDPF. O2 can participate in NO oxidation reaction directly. As the O2 concentration increases, the NO2 production rate increases, resulting in increase of NO2 concentrations downstream of the CDPF.
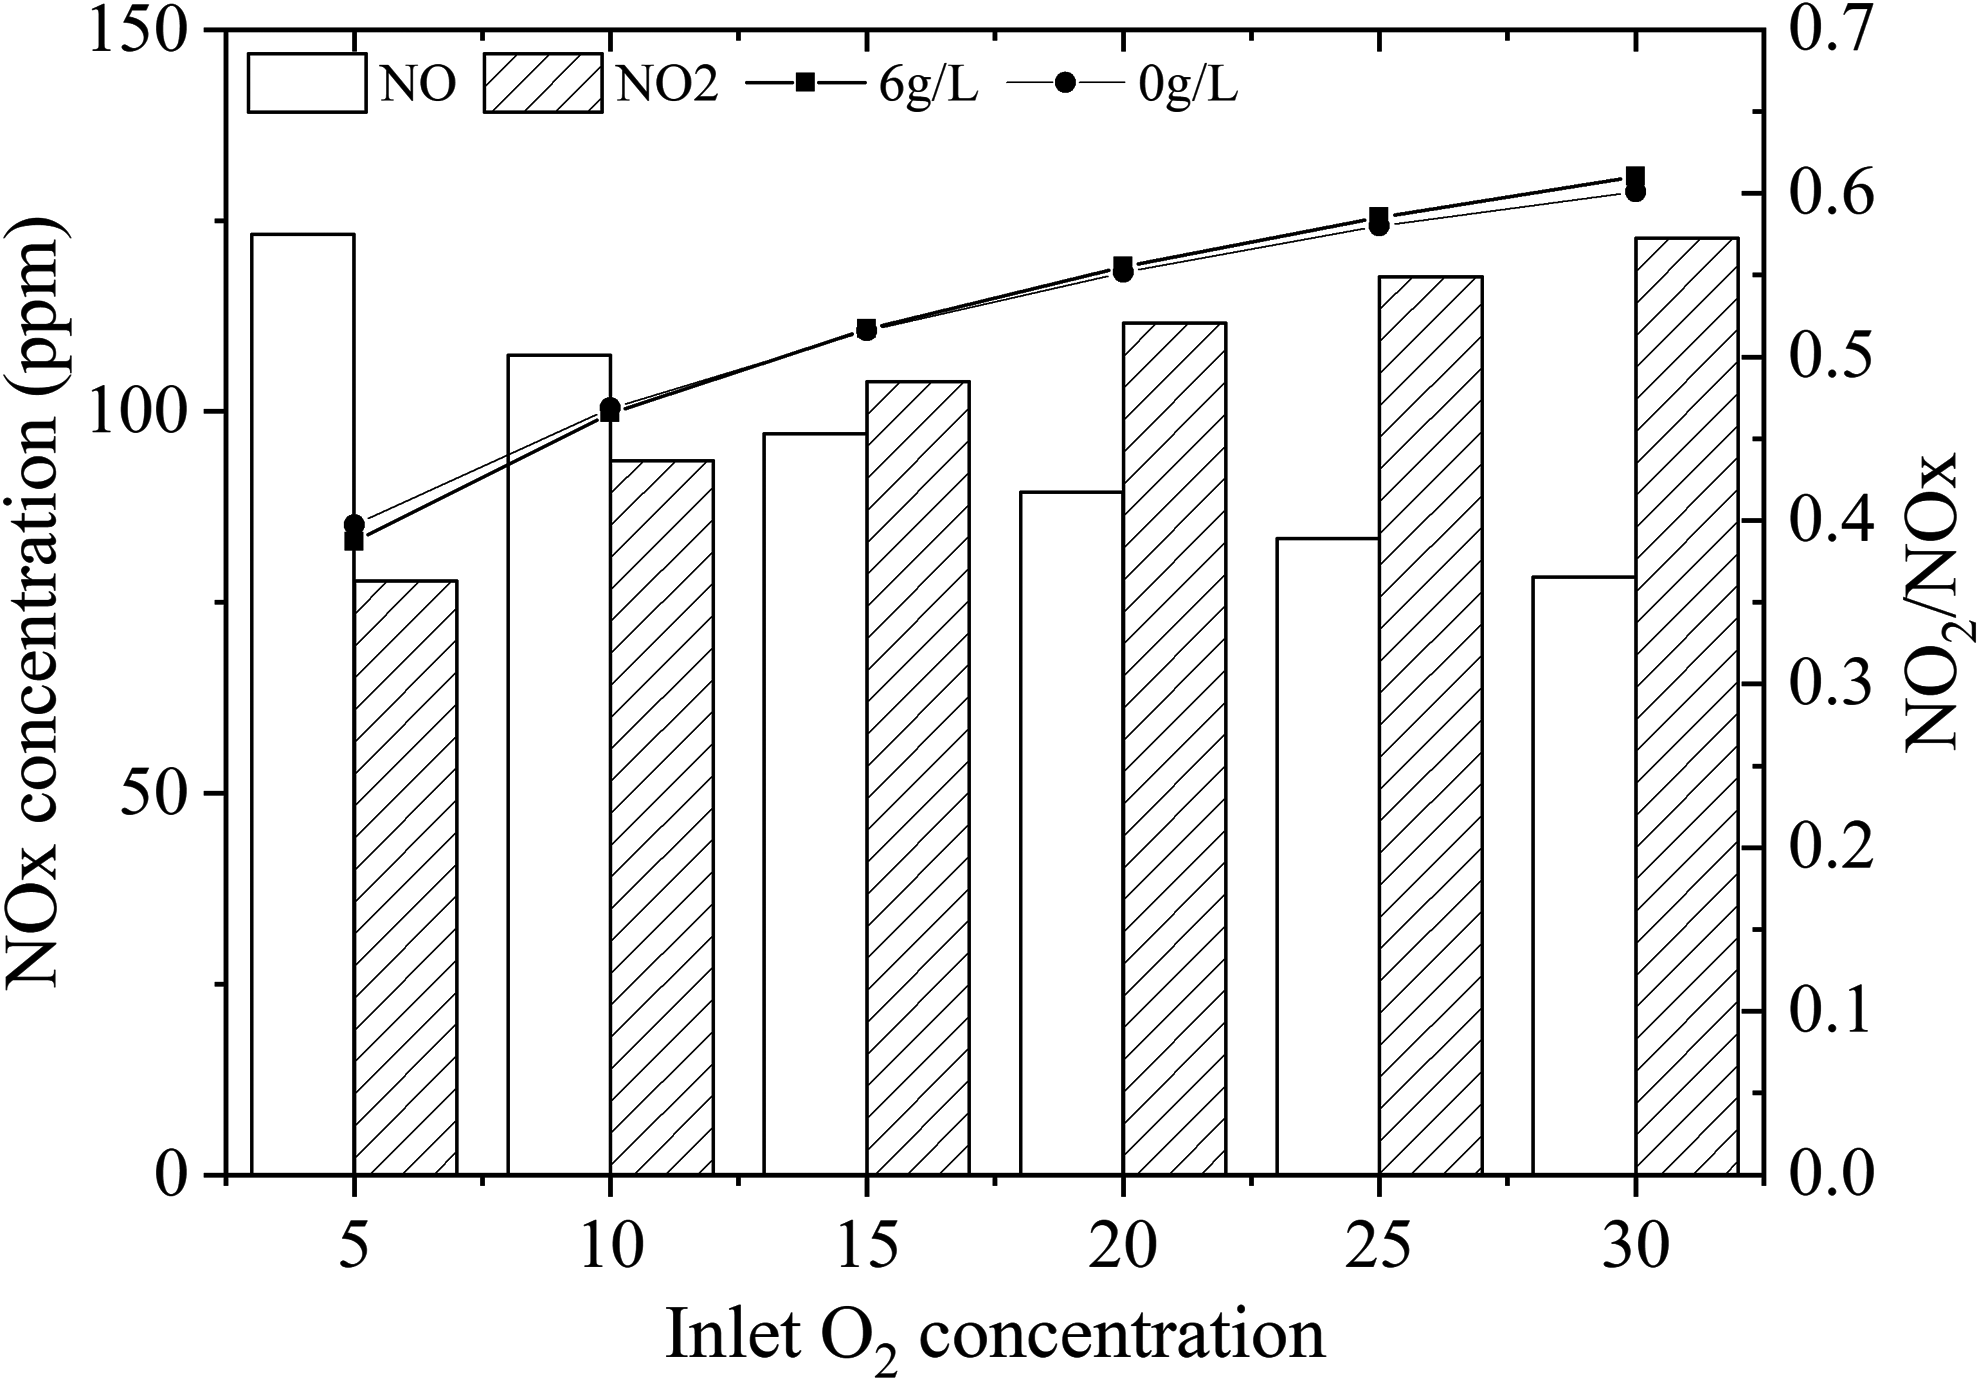
Effects of O2 concentration on NOx concentration downstream of CDPF.
Figure 26 shows the relationship between NO2/NOx ratio downstream of the CDPF and inlet NO2 concentration. It can be seen that the NO2/NOx ratio is increasing with increase of NO2 concentration. But the variation is very slow, and the NO2/NOx ratio is kept at around 0.5. It can be found that the effect of NO2 concentration on the regeneration speed is greater than O2 concentration, while the effect on NO2/NOx ratio is less compared with O2 concentration.
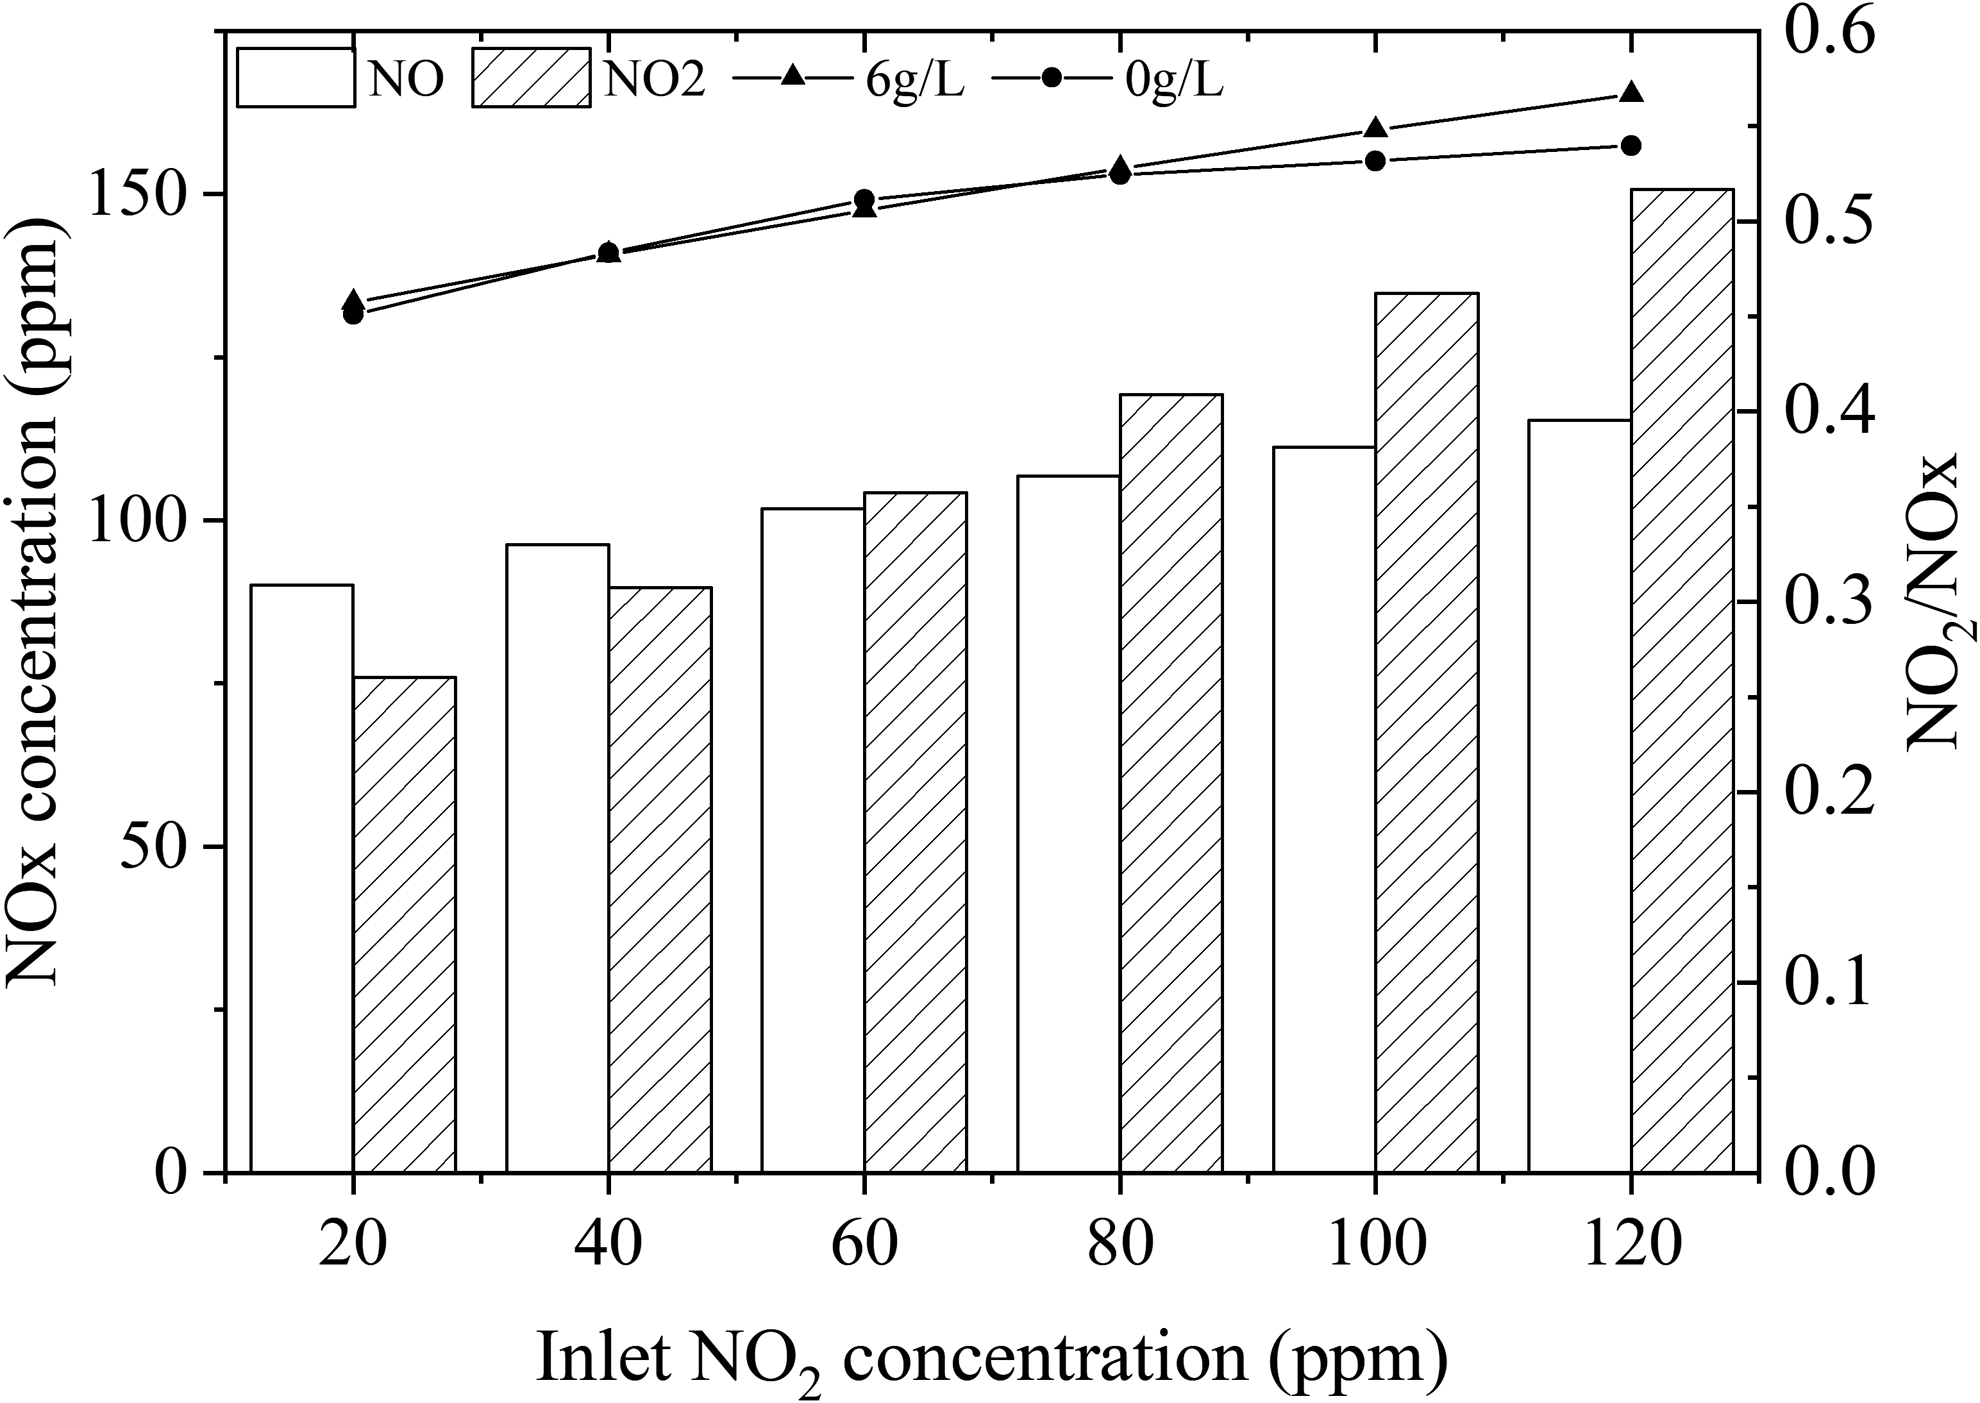
Effects of NO2 concentration on NOx concentration downstream of CDPF.
In Fig. 27, the trends of NO2/NOx ratios under different NO2/PM ratios are given. The variation range of NO2/NOx ratio downstream of the CDPF is from 0.45 to 0.65. It can be observed that the NO2/NOx ratio downstream of the CDPF is enhanced with increase of NO2/PM ratio. The selection of appropriate NO2/PM ratios is important to meet different requirements.
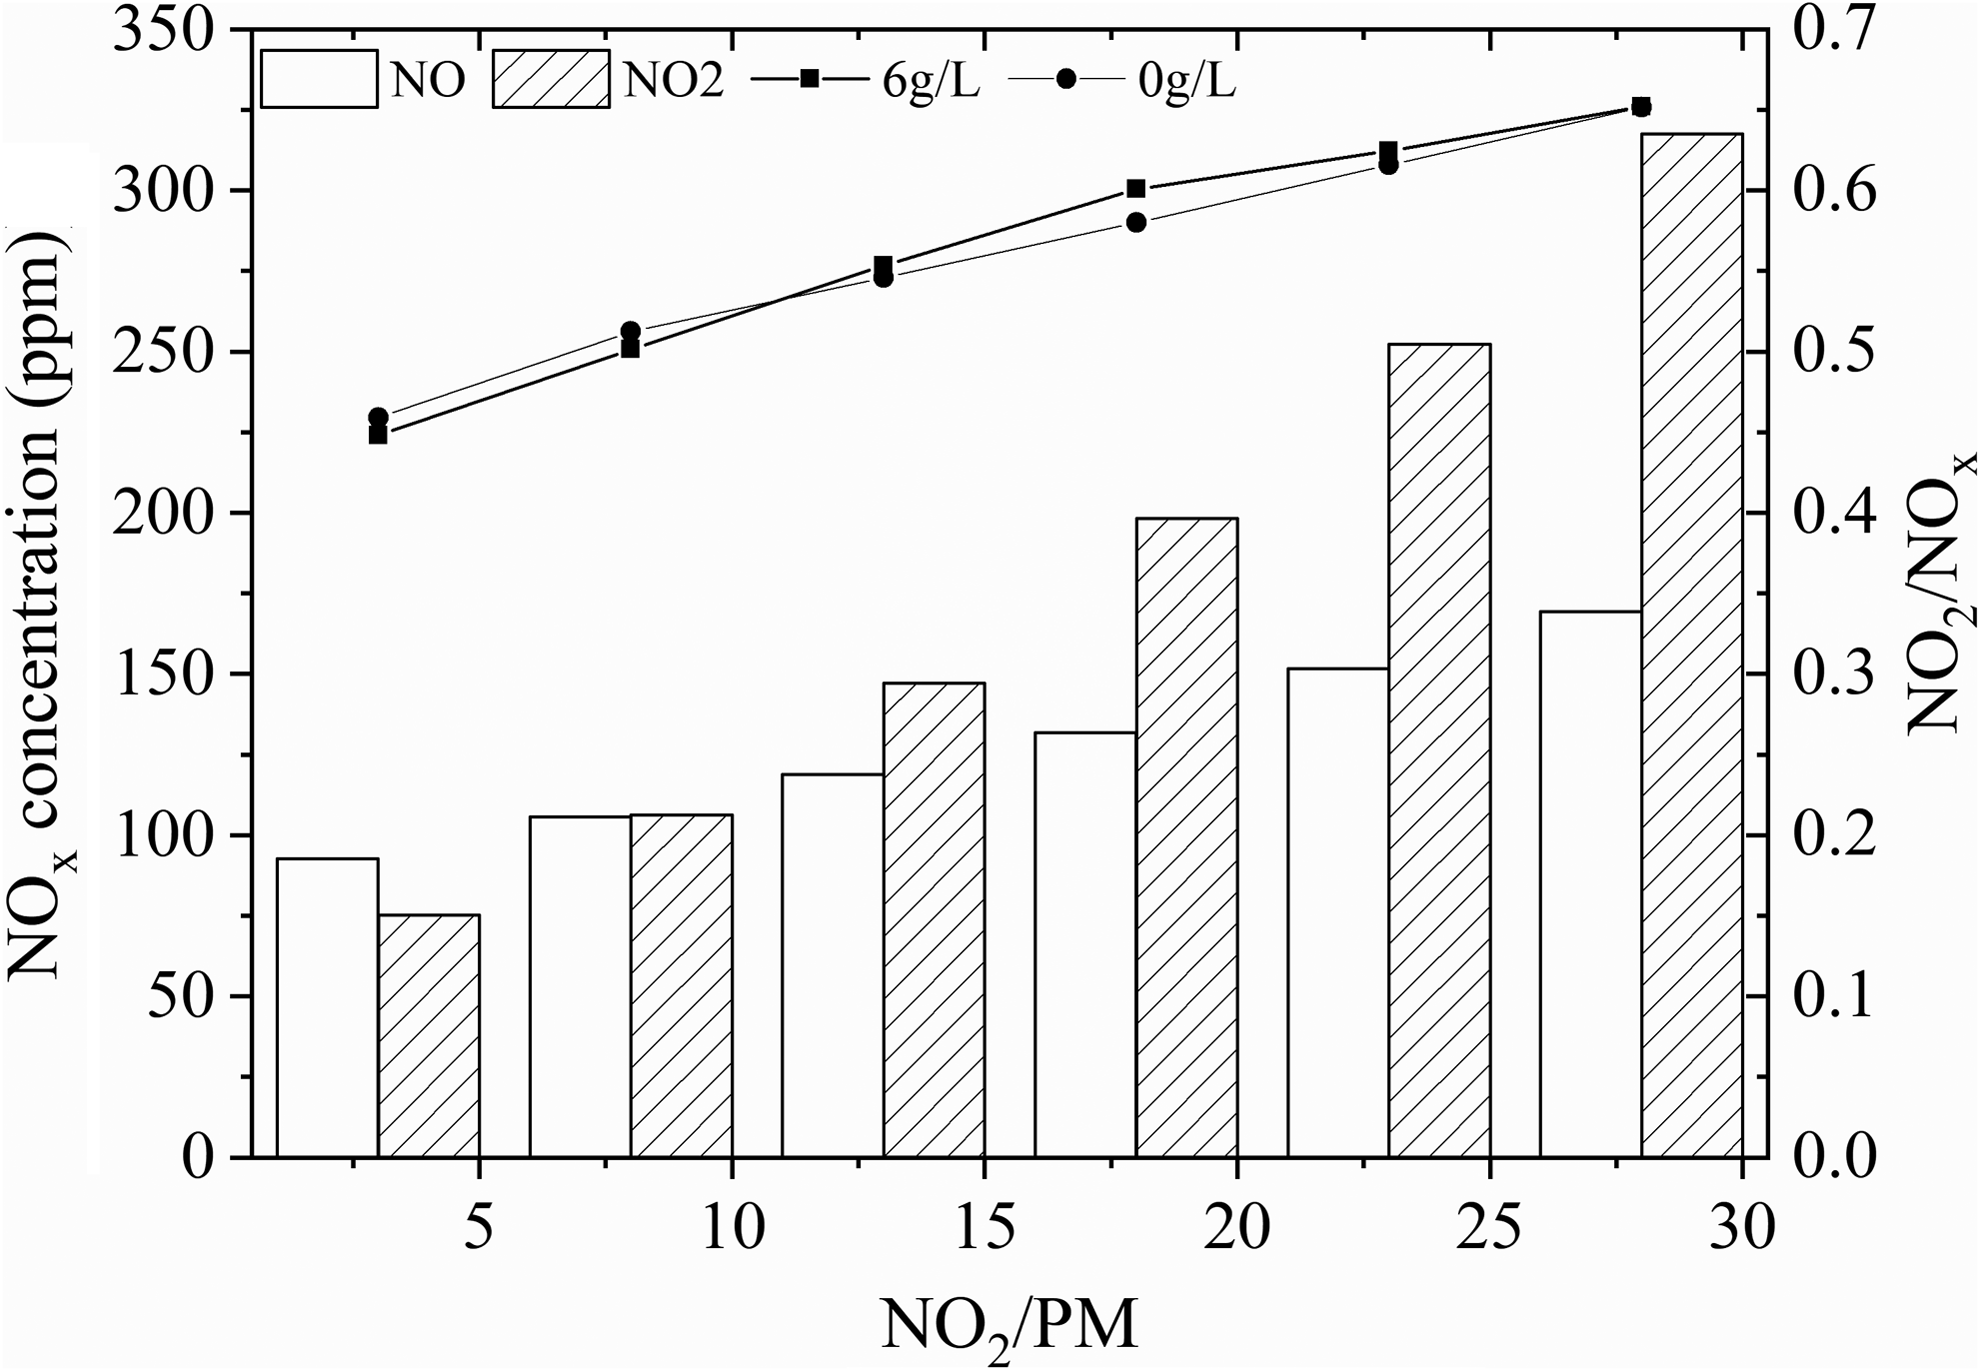
Effects of NO2/PM on NOx concentration downstream of CDPF.
Conclusions
Based on the NO2 assisted regeneration model, the optimal asymmetry ratio, the passive regeneration performance of CDPF, and the change of NO2/NOx ratio downstream of CDPF were studied. The following conclusions can be drawn:
The optimal asymmetry ratio under different conditions is not fixed; the range of the best asymmetric ratio can be determined to be between 1.3 and 1.4. As for different soot loadings, the best asymmetric ratio is 1.4 under certain conditions. As for flow rate, the OAR is 1.4 when the exhaust flow is high and the OAR is 1.3 when the exhaust flow is low. As for the temperature, when the soot loading is 0 g/L, the OAR is 1.4 when the temperature is lower than 345°C, and the OAR is 1.3 when the temperature is higher than 345°C. When the soot loading is 6 g/L, the OAR is 1.4 under different temperatures. For different oxygen concentrations, the OAR is 1.4 when the carbon loadings are 0 and 6 g/L. For different NO2 concentrations, the OAR is 1.3 when the carbon loading is 0 g/L, and the OAR is 1.4 when the carbon loading is 6 g/L.
As for NO2 assisted passive regeneration, inlet temperature is a decisive factor. At 330°C, the deposition rate and oxidation rate are equal. As the temperature rises, NO2 soot increases dramatically and can oxidize more than 90% of soot at 420°C. The effect of other parameters on the regeneration performance at different temperatures shows that the influence of temperature on the regeneration rate dominates. With increasing space velocity, the oxidation rate of soot decreases. As the NO2, O2 concentrations and NO2/PM ratio increase, the oxidation rates all improve, while importance of the influence on passive regeneration can be ordered that NO2/PM ratio > NO2 > O2.
The range of NO2/NOx ratio is around 0.20–0.65 based on this model research. The NO2/NOx ratio reaches its maximum value when the exhaust temperature is about 330°C. NO2/NOx decreases with increasing space velocity. NO2/NOx ratios all increase with increasing NO2, O2 concentrations and NO2/PM, and the importance of the influence can be ordered that O2 > NO2/PM > NO2.
Footnotes
Acknowledgments
The authors are supported by “the National Natural Science Foundation of China under grant numbers 51576140 and 51276128,” State Key Laboratory of Automotive Safety and Energy (Project No. KF1818), National Engineering Laboratory for Mobile Source Emission Control Technology (NELMS2019B01 and NELMS2017A02), and Special Fund for Development of Small and Medium Enterprises (SQ2013ZOA100012).
Author Disclosure Statement
The authors declare that no conflicting financial interests exist.