
Abstract
Abstract
Globally, the human population is facing difficulties vis-à-vis the ability to secure a sustainable supply of water, food, and energy due to the rising number of population, urbanization, globalization, and so on. The Ethiopian government has given emphasis on sugar and ethanol production from sugarcane, which will highly increase water and energy utilization in Ethiopia. The study aims to assess the water–energy–food nexus (WEFN) in the sugarcane production sector of Ethiopia. The set of indicators considering the consumption, mass, and economic productivity of water and energy in three different sugarcane producing factories in Ethiopia (Wonji-Shoa, Metehara, and Fincha) has been applied. An integrated indicator, so-called “water–energy–food nexus index (WEFNI),” is calculated to identify and compare the WEFN performance of the study sites. The assessment results helped to understand the water–energy–sugarcane relationships. The best nexus performance was found for Wonji Shoa, which has the highest WEFNI score that is, 0.63, followed by Fincha (0.47) and Metehara (0.45). The nexus assessment showed that the higher energy use in Wonji Shoa due to the modern irrigation technology implemented can be compensated by the reduction of water loss and productivity improvement, which finally lead to the increased WEFNI score. Recommendations such as adoption of modern irrigation system and substitution of fertilizers by filter cake are made for improving the WEFN of sugarcane cultivation. This study helps producers and stakeholders to understand their management performance and take actions to improve their productivity, profit, and resource management.
Introduction
Policy-makers, researchers, and the public in recent decades have understood how the water, energy, and food (WEF) security are strongly interconnected to each other (Bizikova et al., 2014). It is known that increasing pressure on environmental resources may lead to an unbalanced ecosystem, limited economic growth, and reduced human well-being. For instance, the global population is estimated to grow to 8 billion by 2025, 10 billion by 2050, and 11 billion by 2100, whereas the traded percentage of food produced globally has grown from 15% in 2000 (Endo et al., 2015) to about 20% in 2012 (Alexandratos and Bruinsma, 2012). Food demand is predicted to increase by 60% in 2050 over the 2005/2007 base (WBCSD, 2014).
Meanwhile, from the total amount of global freshwater and energy resources, food production has a consumption share of 70% and 30%, respectively (El-Gafy et al., 2017). According to WBCSD (2014), the annual world agricultural production will increase by 77% in developing countries and 24% in developed countries over the base year 2007. A study conducted by Bazilian et al. (2011) estimated that most of the global human water utilization (60–80%) is for irrigation, and from this amount of water utilized, 90% is irrigated by humans living in arid areas of developing countries. The global water cycle is changing in response to warming caused by climate change (Carter and Gulati, 2014; Endo et al., 2015).
In 2016, over 400 million people were affected by different disasters and 94% of these disasters were related to drought or water shortage (Guppy and Anderson, 2017). The increasing shortage of water will have a major impact on food production. Food production will be indirectly affected by water shortage caused due to water utilization for energy crops production, which will lead to trade-offs with the energy and resources sectors (Gulati et al., 2013). The demands for WEF are estimated to increase by 40%, 50%, and 35%, respectively, by 2030 (Endo et al., 2015). WEF security should be sufficiently addressed by society to facilitate sustainable development (Miara et al., 2014).
Several articles have focused on the separate analysis of the three nexus elements. Ang et al. (2015) surveyed 104 quantitative and qualitative energy security studies. Out of these, 53 studies deal with energy security using indicators, even though the choice and number of indicators vary. The study revealed that there are two major types of energy security indicators. The first are those that deal with performance over time, while the second are those that compare performance between countries. Some of the studies included scenarios to forecast energy security for the future. On the other hand, there were studies considering the nexus holistically using nexus tools, which analyze the three elements together.
For instance, the Qatar environment and energy research institute developed a water–energy–food nexus (WEFN) tool (WEF nexus tool 2.0) to assist decision makers in considering different scenarios to predict resource demand in Qatar (Willis et al., 2016). Other studies such as those by Bazilian et al. (2011) and Bizikova et al. (2014) are focused on an integrative framework approach of the WEFN instead of quantitative approach. Although several WEFN researches have shown promising progress, there are limitations to changing the nexus thoughts to nexus actions. The main reason for this is limited availability and consistency of data to help researchers and policy makers to identify the relationships and responses that appear (McGrane et al., 2018).
Considering the mutual reliance between WEF is imperative as handling one of them cannot be done in isolation, but should rather be seen together, and their interconnection is called the WEFN (Rasul and Sharma, 2015; El-Gafy, 2017). Therefore, it is necessary to have a WEFN approach that can identify how and where the three elements interrelate with each other (Halon et al., 2013). An integrated view across the nexus provides more complete information on relative resource scarcity and the potential for sustainable development in different regions (Hoff, 2011). To apply a nexus approach, the necessity has been identified to produce an index that takes into account the WEF rather than considering only one or two elements (El-Gafy, 2017).
The main goal of this study is to understand the WEF security in the context of the chosen region, that is, Ethiopia, specifically in the sugarcane cultivation sector. A set of indicators, which are assumed to have relationships with all the elements (WEF), were used to quantify and analyze the water–energy–sugarcane nexus. The proposed indicators include water and energy consumption, water and energy mass productivity, as well as water and energy economic productivity.
This study has gone through an integrated quantitative analysis of the consumption of resources along with the production of food. The final analysis shows a unified nexus result of all the components considered. The area of sugarcane is increasing rapidly as a result of increasing demands for ethanol and increased sugar demand for human consumption globally. Regardless of considerable diversity in production systems and circumstances, sugarcane is a particularly “high-impact” crop with significant positive and negative environmental and socioeconomic impacts (Hess et al., 2016). Ethiopia is endowed with large areas of lowlands with climate and soil types suitable for sugarcane production. The Ethiopian government has given emphasis on sugar and ethanol production from sugarcane, which will highly increase water utilization in Ethiopia, where agriculture is the backbone of the country's economy and water management is poor (Fito et al., 2017). Even though Ethiopia is working to be a leading sugar producing country in Africa, there are no previous studies made on the interconnection between WEF in the sugarcane cultivation sector. Therefore, this work will give some important information to the farmers, producers, and business people who are working in the agriculture sector, especially in the sugarcane production sector.
Methods
Scope of the study
The study's scope covers the assessment of WEFN of sugarcane cultivation practice in the year 2017/18 (from July 1, 2017, to June 30, 2018) and the geographical scope is bound to three large-scale sugar producing factories located in Ethiopia. As the goal of the study is to analyze the relationship between WEF in the sugarcane production sector of Ethiopia, the assessment is therefore concentrated on the sugarcane farms of major sugar producing and resource utilizing factories of the country. By considering sugarcane as a food product, the WEF interconnection is studied. The sugarcane farms selected for data collection are those owned by three major sugar producing factories of the country, Wonji-Shoa, Metehara, and Fincha, located 110, 200, and 350 km away from the capital city Addis Ababa. These three sugar factories have a combined production capacity of about 580,960 tonnes of sugar annually, with Wonji-Shoa, Metehara, and Fincha contributing 174,000, 136,690, and 270,000 tonnes of sugar per year, respectively.
The potential irrigation sites for the sugarcane cultivation of these factories are the Awash basin for Wonji-Shoa and Metehara sugar factories, and the Fincha river for Fincha factory. The source of energy that the factories use is generated by the factories themselves. Metehara generates 9 MW electric power to entirely satisfy its own power demand. Wonji-Shoa is currently contributing 20 MW electric power to the national grid, in addition to satisfying its own 11 MW of energy demand, and Fincha produces 31 MW electric powers, including 10 MW exported to the national grid. Metehara and Fincha sugar factories have more than 10,000 and 12,170 ha of sugarcane land and a capacity of producing 12,500 and 20,000 m3 of ethanol, whereas Wonji-Shoa sugar factory has around 12,800 ha of sugarcane land and a plan to have new plant with a capacity of producing 12,800 m3 ethanol per year (Ethiopian Sugar Corporation, 2018).
Nexus assessment approach
In the study, the methodology proposed by El-Gafy (2017), which considers a collection of several indicators, was used. The assessment aimed at identifying the study year (2017/18)'s WEFN management performance of the sugarcane cultivation by comparing to the past 2 years' (2015/16 and 2016/17) experience at the study sites. Each year of the data collection starts on July 1 and ends on June 30 of the next year. Table 1 illustrates the set of indicators associated with food–energy, food–water, and energy–water relationships, which were used to quantify and analyze the water–energy–sugarcane nexus and to help in providing information to producers regarding nexus performances in the sugarcane cultivation sector of the country. Based on those six indicators, a single index thta integrated all the indicators in the consideration, so-called “Water–Energy–Food Nexus Index (WEFNI),” was further determined for the studied sugarcane cultivation sites. The main reason for using the index-based analysis approach for the study is because the interconnection among the three key elements needs to be jointly considered. The adoption of nexus based on the index approach has proven to capture the integrated system of irrigation practice, which has a great role in food production (El-Gafy, 2017). Having this general idea in mind, the six indicators proposed for the study are all included in the nexus assessment. The reason to select these indicators is that they are expected to help linking the implications of water and energy consumption to the amount of crop produced and the economic benefits that would be obtained from the crop production.
Water–Energy–Food Nexus Indicators for Sugarcane Production System
Water consumption indicator (Wc)
The water consumption indicator accounts for the total amount of irrigation water used per hectare-year of sugarcane cultivation. The water consumption data of sugarcane cultivation in the study sites were obtained from the actual irrigation. The values for consumption were directly taken from actually recorded data at every site. This study has considered only direct water consumption data of sugarcane cultivation. Water consumption data of the three study sites for the three consecutive years (2015/16–2017/18) were collected from each study site.
Energy consumption indicator (Ec)
The energy consumption indicator accounts for the energy used per hectare-year of sugarcane cultivation. It can be calculated by converting all the input data for sugarcane cultivation by multiplying with their corresponding energy equivalent values. Energy use for the sugarcane cultivation can be categorized into direct energy use as fuel or electricity to operate machinery and equipment and indirect energy use, which implies to the energy consumed during the production of the inputs that are used in the cultivation process (Zahedi et al., 2015). Ec is calculated by using Equation (1).
where Qh (MJ/h), Qm (MJ/h), Qd (MJ/L), Qf (MJ/kg), Qp (MJ/L), Qh′ (MJ/L), and Qs (MJ/kg) are energy equivalents of human labor, machinery, diesel oil fertilizer, pesticide herbicide, and seed inputs in sugarcane production, respectively; and H (h/ha-year), M (h/ha-year), D (L/ha-year), F (kg/ha-year), P (L/ha-year), H′ (L/ha-year), and S (kg/ha-year) are the quantity of human labor, machinery, diesel fuel, fertilizer, pesticides, herbicides, and seed inputs for sugarcane production per hectare per year collected from the studied sugarcane farms in the study.
Ep is the pumping input energy (MJ/ha-year) or the amount of energy consumed to pump the water used for sugarcane cultivation per hectare of land. Ep can be calculated by applying [Eq. (2)].
where Pj (hp) is the power of the pump j; h is the pumping hours per year; k is a factor to convert hp to MJ/h; eff j is the efficiency of pump j; and r is the number of the irrigation pumps in the farm. The data of the Pj and r are primarily collected from the studied sugarcane farms.
Water mass productivity indicator (Wmp)
Water mass productivity measured in kg/m3 is calculated by applying [Eq. (3)] below.
where Y is the yield of sugarcane (tonne/ha-year). Wc is the irrigation water consumption (m3/ha-year).
Energy mass productivity indicator (Emp)
Energy mass productivity measured by tonne/GJ is calculated applying [Eq. (4)].
where Ec is the energy consumption for sugarcane cultivation (GJ/ha-year).
Water economic productivity indicator (Wep)
The economic water productivity of irrigation water measured by thousand cubic meters (USD/1,000 m3) is calculated by applying [Eq. (5)].
where Np is the net profit gained per hectare per year from sugarcane (USD/ha-year).
Energy economic productivity indicator (Eep)
The economic productivity of energy measured by (USD/GJ) will be calculated applying [Eq. (6)].
Water–food–energy nexus index
The WEFNI gives assistance for stakeholders, producers, and decision makers by providing information about the performance of the WEFN management. To determine the WEFN of the study sites, the WEFNI needs to be calculated and then the nexus status of the study sites can be determined based on the WEFNI value of that site. The WEFNI value ranges between 0 and 1. The higher WEFNI indicates better WEFN performance and vice versa. The reason that higher WEFNI indicates better nexus performance is because every business sector (sugar factory in this case) has a desire to maximize its productivity and profit. To be productive and profitable, the business sector has to maximize its production by reducing the resource use and cost of the inputs. As the sector works for productivity and profit, it increases the WEFNI, which will finally be used to indicate the nexus performance. WEFNI is calculated by applying Equation (7).
where Xi refers to the six indicators described in Table 1, which are normalized using Equations (8) and (9) below. The weight (wi), which every indicator holds, is taken to be equal (i.e., 1) for it is assumed that all the indicators are equally important for the assessment. The indicators of WEFNI are normalized to avoid dimensional inflection by applying the Min–Max normalization technique applying Equations (8) and (9) as stated by Juwana et al. (2012). Equation (8) is used when minimum of the indicator is the least preferred value and Equation (9) is used where maximum of the indicator is the least preferred value.
where xi is current (2017/18) value of the indicator. Min(xi) and Max(xi) are the minimum and maximum indicator values recorded for different study sites. Comparing the values of the three study years proposed, the maximum and minimum indicator values were identified for all the study sites.
Data sources
The data sources include both primary and secondary data. The primary data includes input and output data for the sugarcane cultivation process, which were collected directly from the studied sugarcane cultivation sites of three sugar factories in Ethiopia. The data (agricultural inputs) were collected by the factory at every study site over the entire year for the whole farm area and averaged per hectare of agriculture land. The agricultural inputs considered in this study were water, energy for irrigation, cost of sugarcane, human labor, machinery, diesel oil, fertilizer, pesticide, herbicide, and cane seed. Cost of sugar cane for Metehara and Fincha study sites was not available; therefore, it was assumed to be the same as that at Wonji-Shoa. The production data are collected by tracing back to the factories' 2 years of experiences (2015/16 and 2016/17), in addition to the current year 2017/18. This is to identify the minimum and maximum values that they had recorded before. The secondary data include the energy equivalents of inputs (human labor, machinery, diesel oil, fertilizer, pesticide, herbicide, and seeds) in the sugarcane cultivation process referred from the previous studies (Karimi et al., 2008; Zahedi et al., 2015).
Results and Discussion
Analysis of water and energy consumption indicators of the study sites
Figure 1 shows the total amount of water consumption in m3/ha-year and the energy input values in MJ/ha-year, along with minimum and maximum values over the years 2015/16–2017/18, for each studied sugarcane cultivation site. The results show that in the recent year (2017/18), the amount of water that Wonji-Shoa consumed per hectare of sugarcane production was about 48% and 39% lesser than that at the Metehara and Fincha sugarcane farms, respectively. The main reason for the low water consumption for sugarcane cultivation in Wonji-Shoa was the more modernized irrigation technology used than the others. Some of the water-saving irrigation technologies are sprinkler, pivot, and drip with irrigation efficiencies of 75%, 85%, and 95%, respectively, while the old one, furrow, has an efficiency of only about 55% (Silalertruksa and Gheewala, 2018). Wonji-Shoa uses the pivot and sprinkler irrigation method, which can save water more than the other study sites that are mostly dependent on furrow irrigation method. Water is on the way to becoming an increasingly scarce resource (Bigas, 2012), and in a country like Ethiopia where agriculture is the backbone of the country's economy, priority must be given for adopting alternative and more water-saving irrigation technologies. Large amounts of water are withdrawn every cropping year due to the old irrigation technologies that are relatively water intensive. Not only should water saving technologies be used but also the trend in water mismanagement such as over or excessive utilization (Guppy and Anderson, 2017) should be controlled.
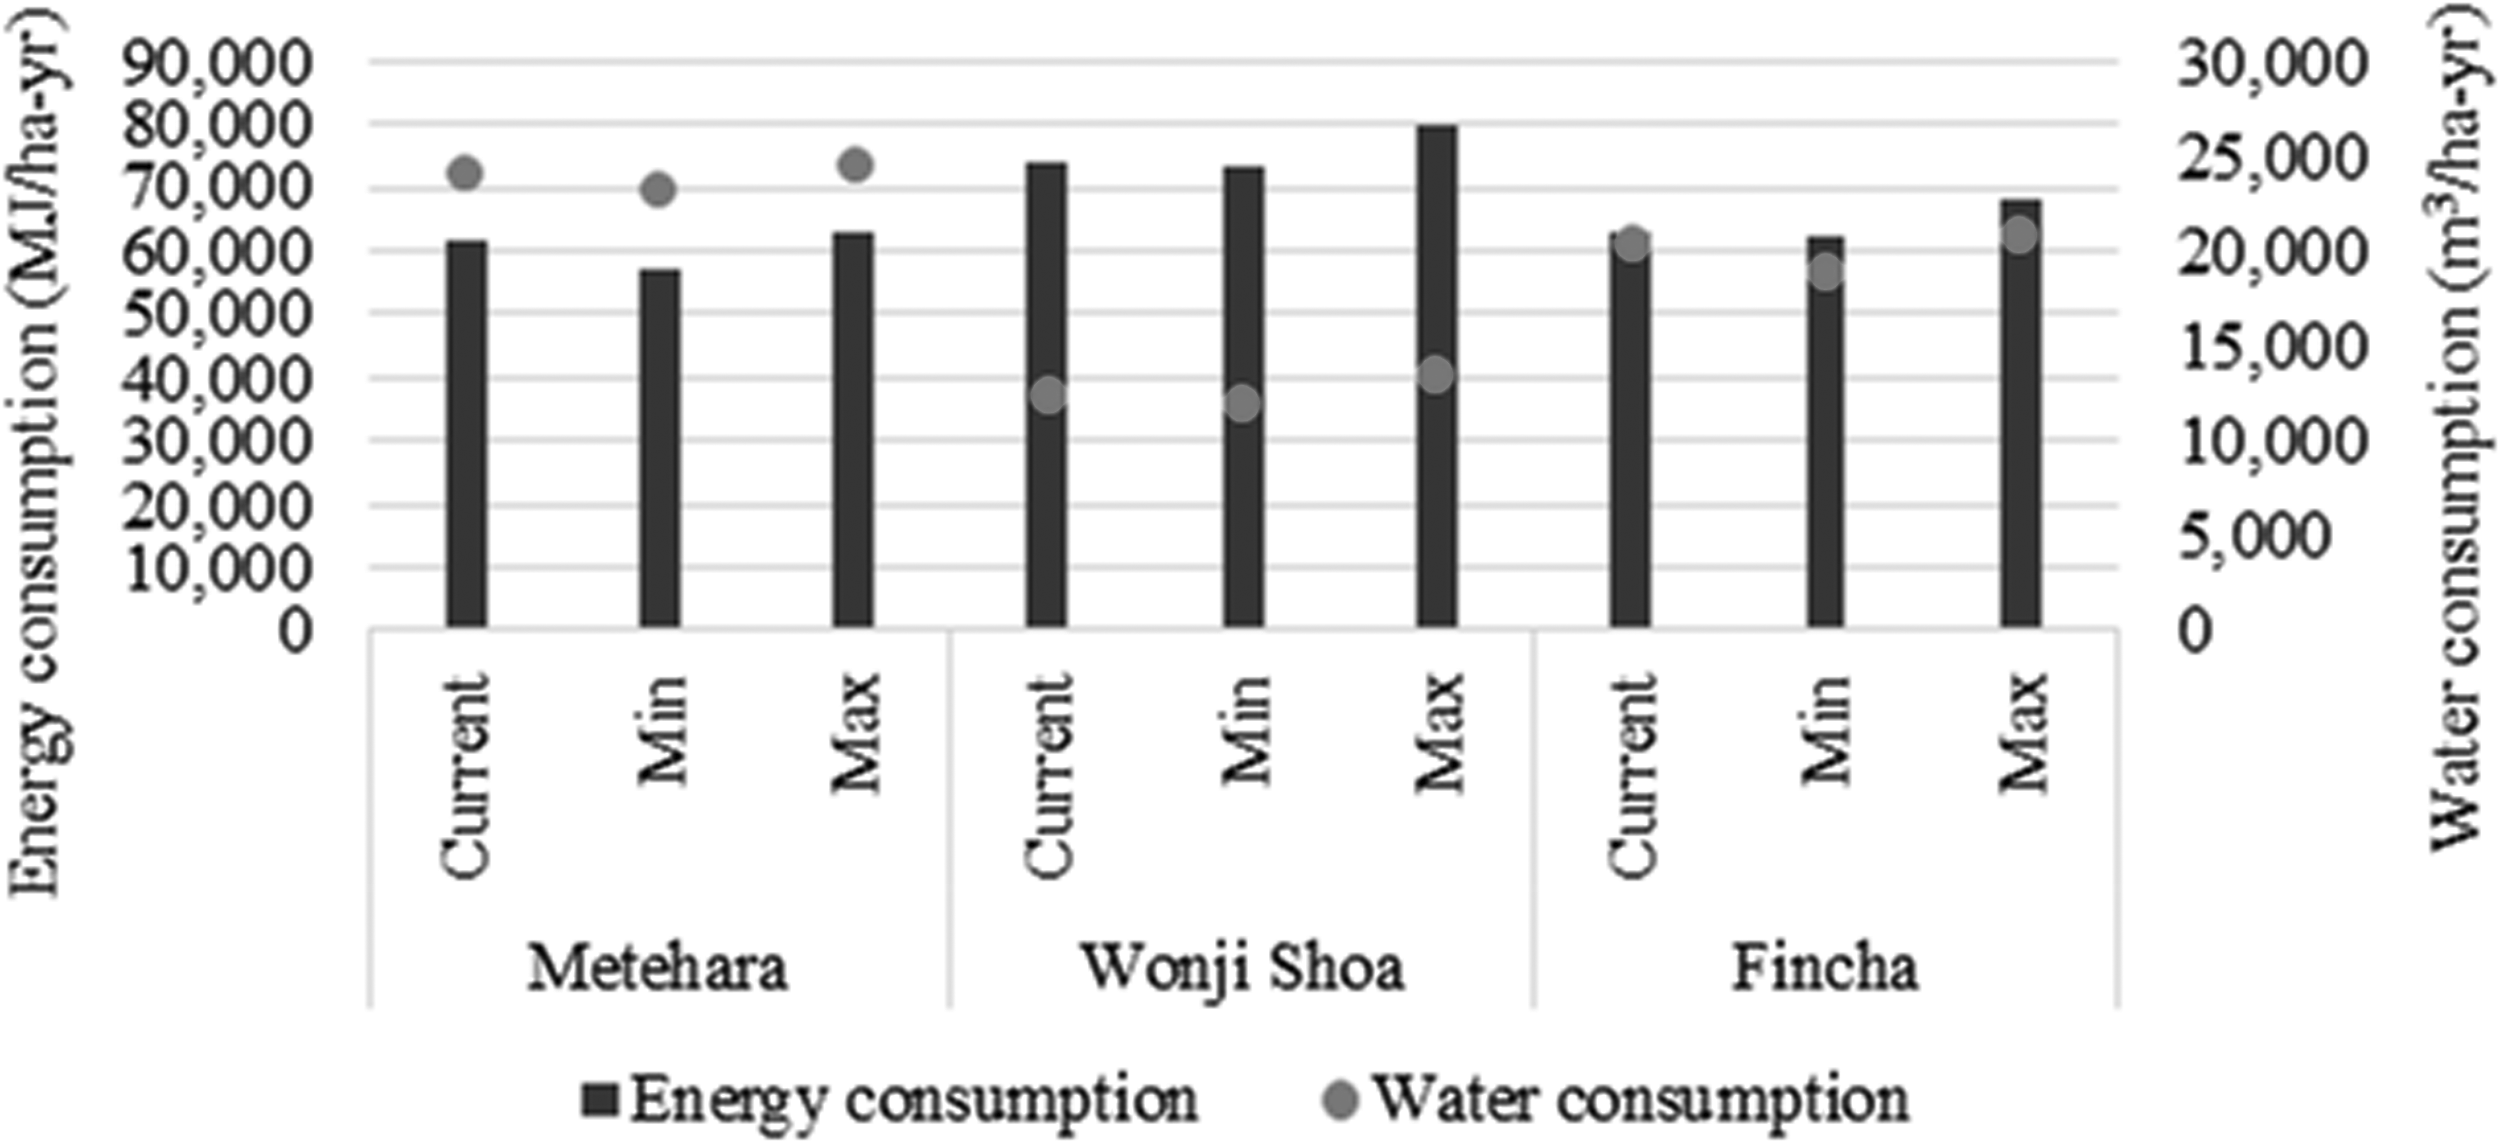
Water and energy consumption per hectare of sugarcane cultivation of each study site.
On the other hand, the total energy consumption of Wonji-Shoa was about 21% and 18% higher than that at the Metehara and Fincha sugarcane farms, respectively. This was once again because of the modern irrigation technology, which forced the Wonji-Shoa to use more energy for their operation, while the Metehara and Fincha can get the benefit from the lesser energy consumption. Even though sugarcane production at Wonji-Shoa is energy intensive, the results from all the studied sites indicated that the major energy consumption comes from the fertilizer application. The situation of Wonji-Shoa having higher energy consumption and Metehara having higher water consumption than the others remains the same for their minimum and maximum consumptions as well, even though the percentage decrement and increment varies.
Actions in one sector more often have impacts in one or both of the others. Modern irrigation has higher energy requirement, but it reduces water loss. In water-scarce areas, if these irrigation mechanisms are not used, it will result in lesser production, which then affects the energy production from bagasse in the sugar factory. This will finally affect the entire nexus.
Share of agricultural inputs to the total energy used for the sugarcane production
Inputs to every agricultural activity have contributed to the total energy consumption of the crop production system. The energy consumption classified by the inputs in the sugarcane cultivation process of the study year (2017/18) is illustrated in Fig. 2.
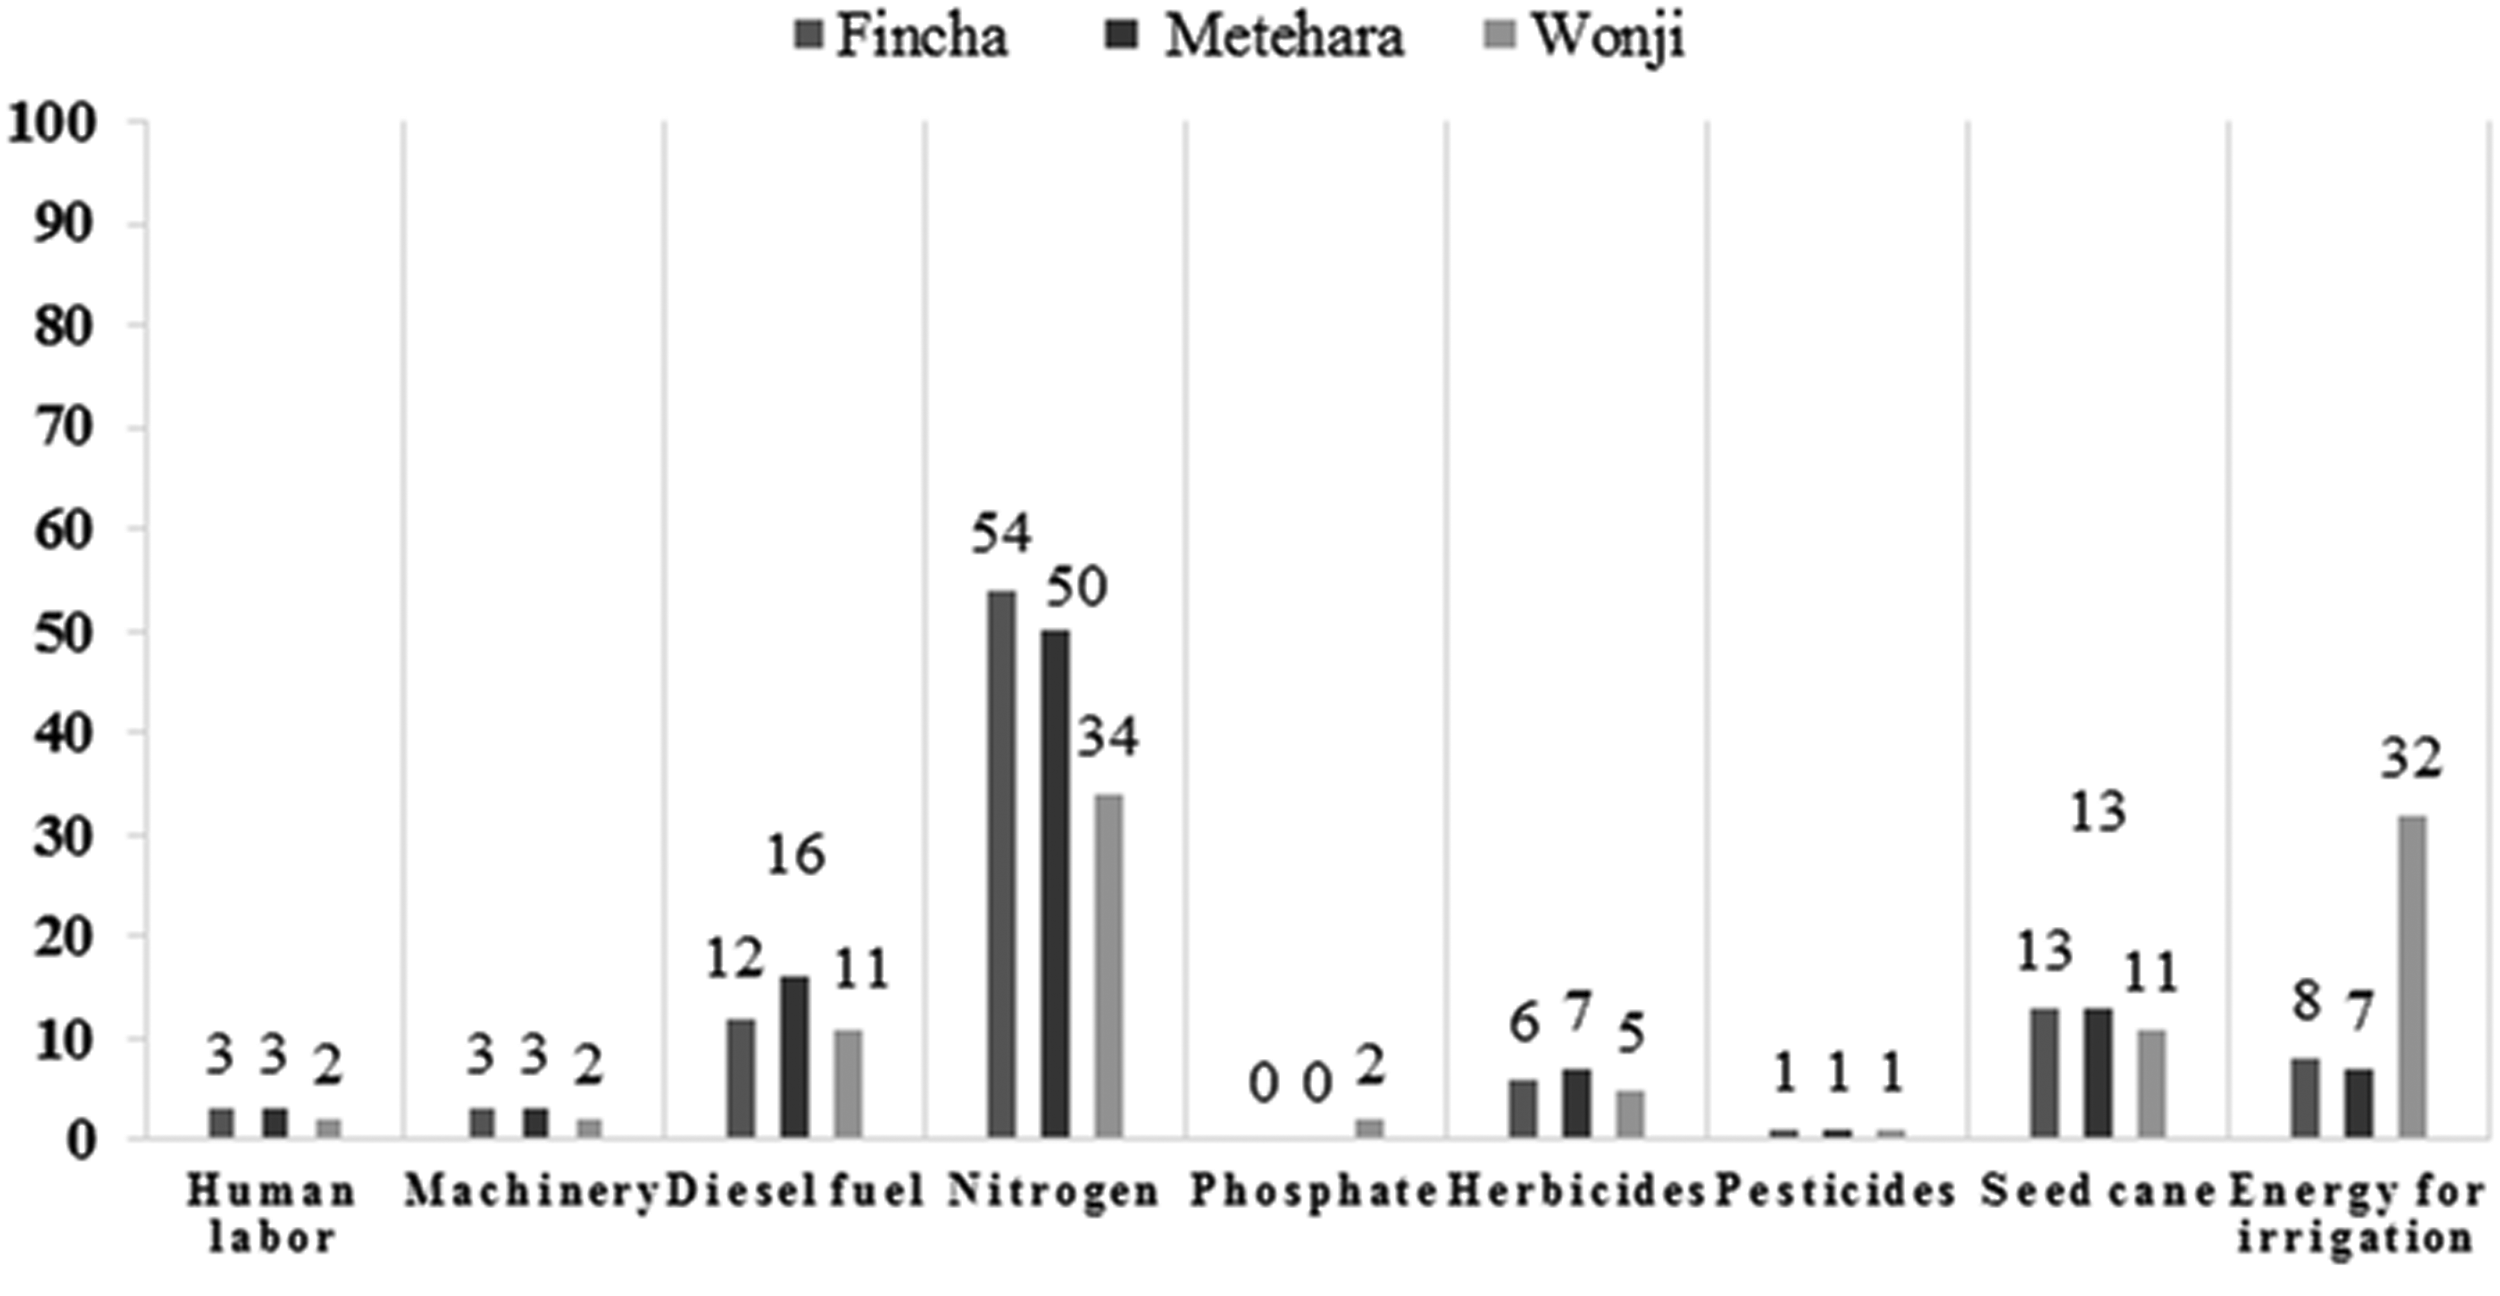
Percentage share of agricultural inputs to the total energy used for the sugarcane production in the study sites in 2017/18.
The results show that nitrogen fertilizer is the major contributor to the energy consumption in all sugarcane cultivation study sites. The indirect energy or the amount of energy required to produce nitrogen fertilizer is much higher than the energy required for producing the other inputs in sugarcane cultivation. Nitrogen fertilizer accounts for about half of the total energy consumption in Metehara and Fincha study sites. The remaining half of the energy consumption is shared among the other inputs with different percentages. However, in Wonji-Shoa site, fertilizer has a contribution of about one-third of the total energy consumption. Meanwhile, the energy used for irrigation is found to be another source of high energy consumption for sugarcane cultivation here; it is almost as equal to the nitrogen fertilizer. Energy share of nitrogen fertilizer is higher in all the study sites and this is due to the energy intensiveness of nitrogen fertilizer during its production.
Different studies have shown that there is some loss of soil organic matter every year, which leads to the application of fertilizers (Karimi et al., 2008). This application of fertilizer makes the energy consumption in sugarcane cultivation higher. To overcome this problem, replacing synthetic fertilizers by the sugar factories' byproducts such as filter cake and vinasse is a better option. Chang et al. (2016) stated that organic cultivation could successfully reduce the fossil energy consumption for producing synthetic fertilizers and pesticides. The energy of human labor, machinery, diesel oil, fertilizer, pesticides, and irrigated water inputs per hectare in the crop's production system along with the minimum and maximum values is illustrated in Table 2.
Water Consumption, Calculated Energy Inputs, and Total Harvested Area Per Year of the Study Sites
Analysis of water and energy mass productivity indicators of the study sites
The analyzed energy and water mass productivity indicators of the three study sites are illustrated in Fig. 3. The study site that has the highest water mass productivity does not always have the highest energy mass productivity. As an example, sugarcane production in Wonji-Shoa has the highest water mass productivity, while it always has a low energy mass productivity. High energy consumption for irrigation made a significant change in the decreased energy mass productivity of Wonji-Shoa, while those who did not use much energy for irrigation benefited with high energy mass productivity. On the other hand, the study site that has the lowest water mass productivity always has high energy mass productivity. The same situation has also been observed for the rest of the years, even though the absolute figures recorded vary.
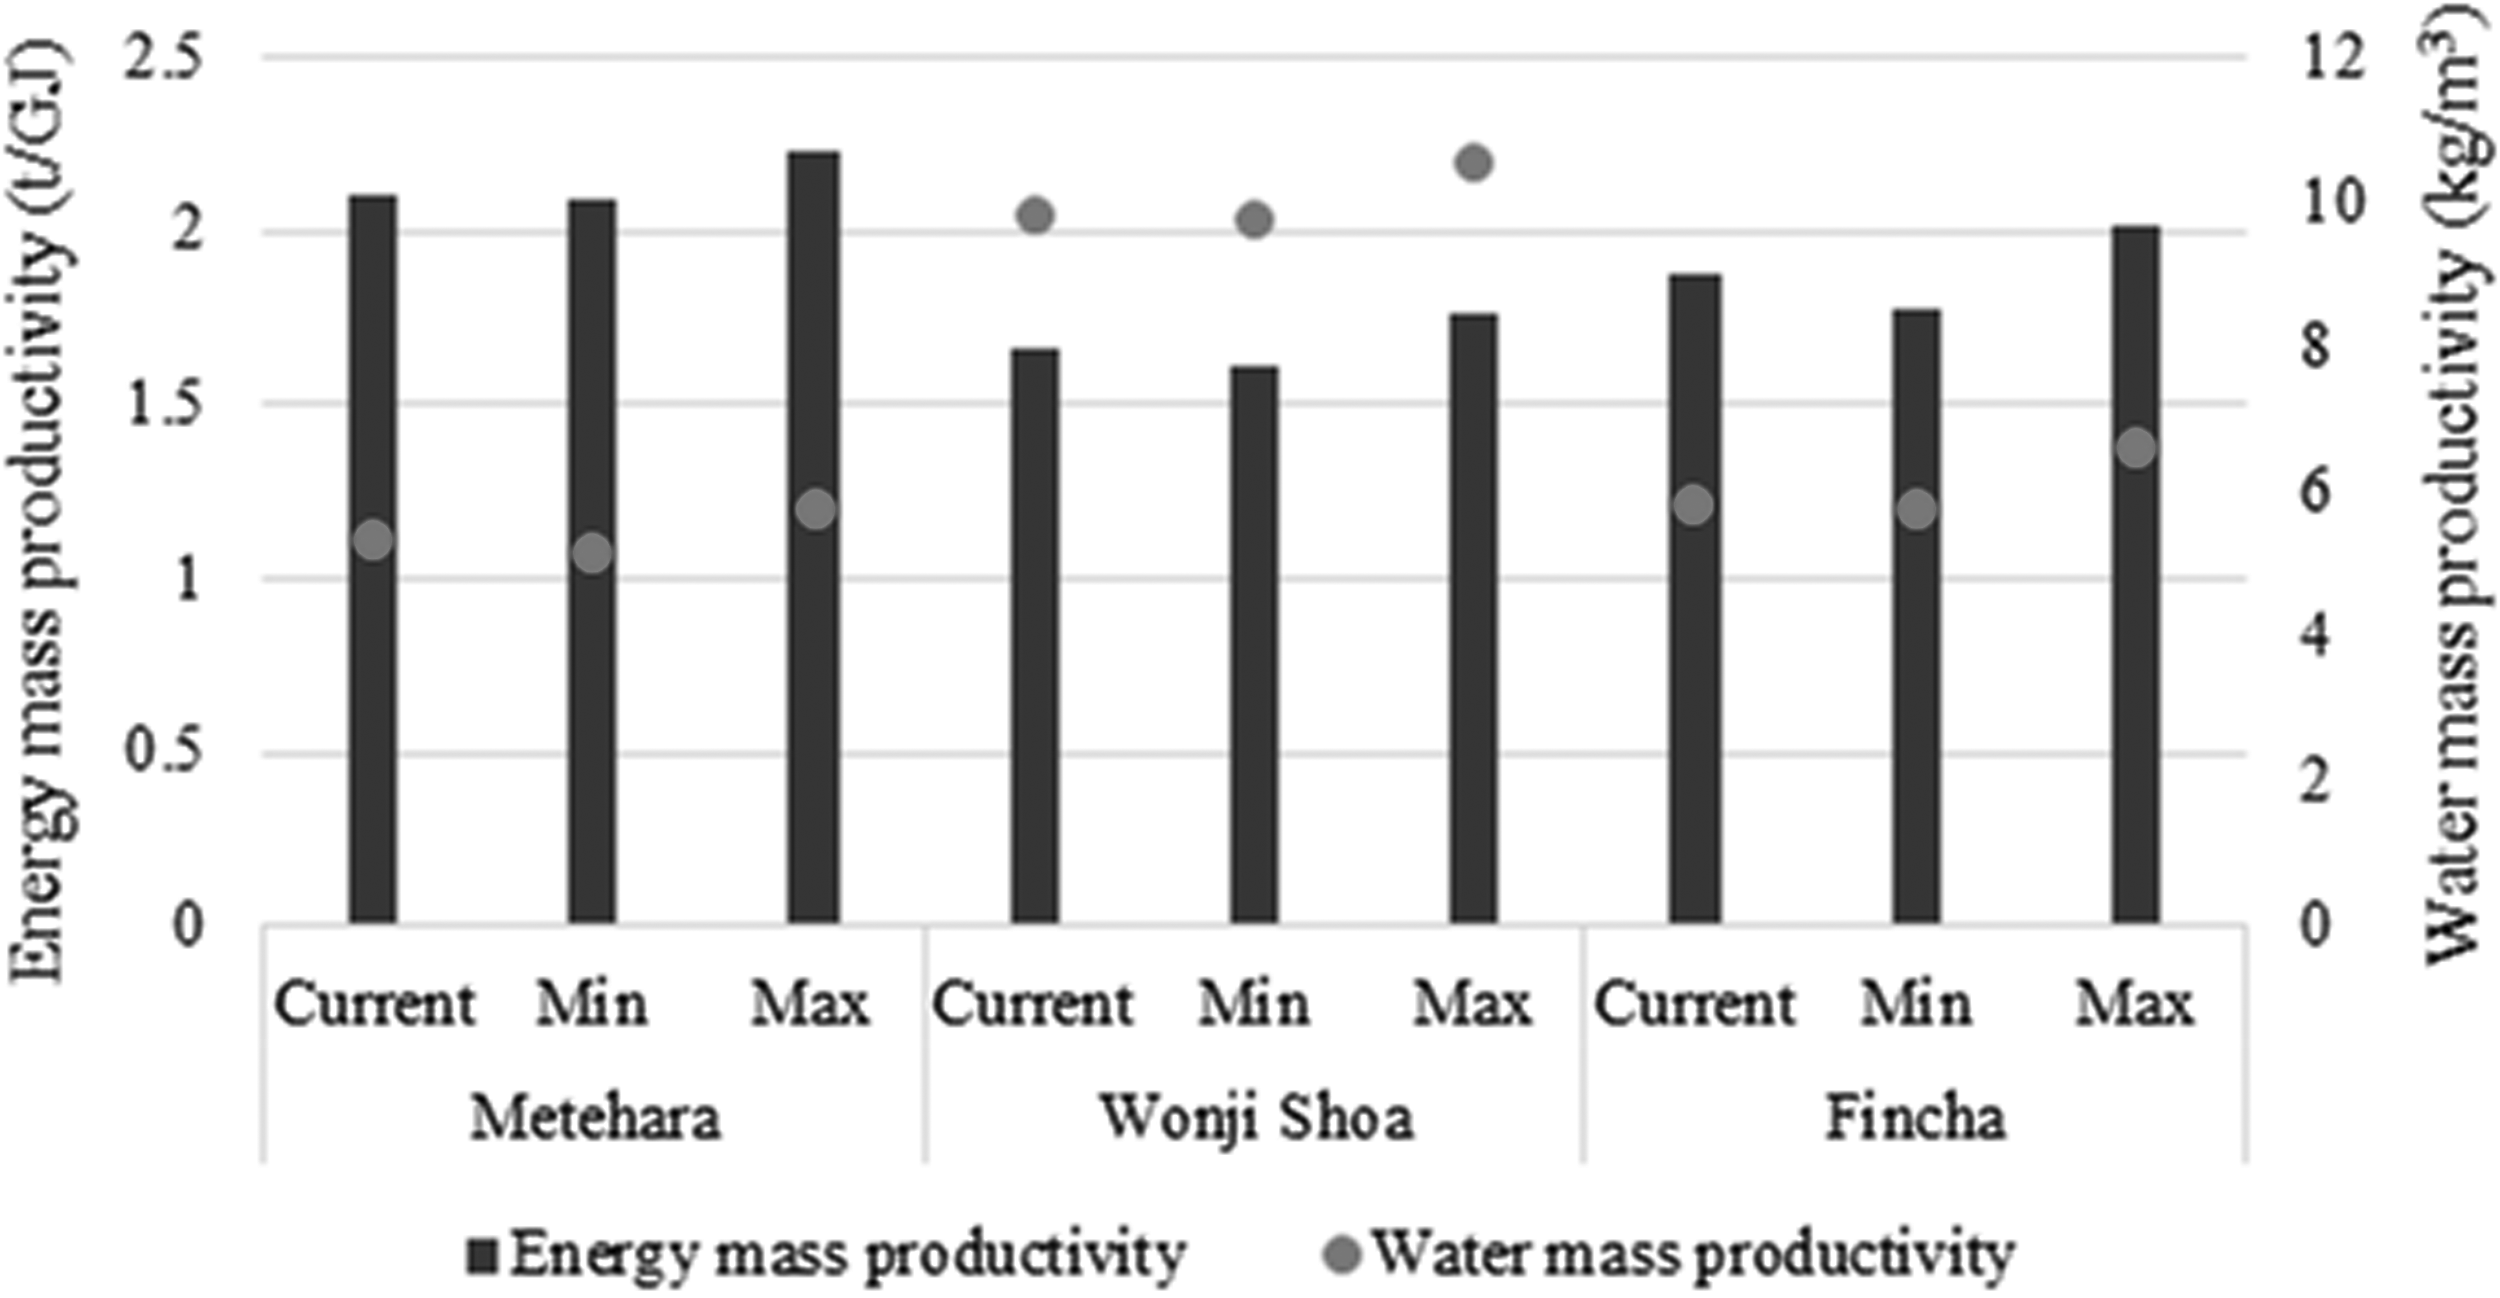
Water and energy mass productivity per hectare of sugarcane cultivation of each study site.
Analysis of water and energy economic productivity indicators of the study sites
The analyzed energy and water economic productivity indicators of the three study sites are illustrated in Fig. 4. The results illustrated clearly that sugarcane cultivation at Wonji-Shoa study site has the highest water economic productivity followed by Fincha and finally Metehara. However, in terms of the energy economic productivity, the production at Metehara site becomes the highest. Fincha remained with the second highest energy economic productivity, with Wonji-Shoa becoming the least of all. The reason for these results to occur is the same as that stated for the mass productivity. Therefore, the site that has the highest water mass productivity always has the highest water economic productivity. The conclusions remain the same for the other years, despite the value change.
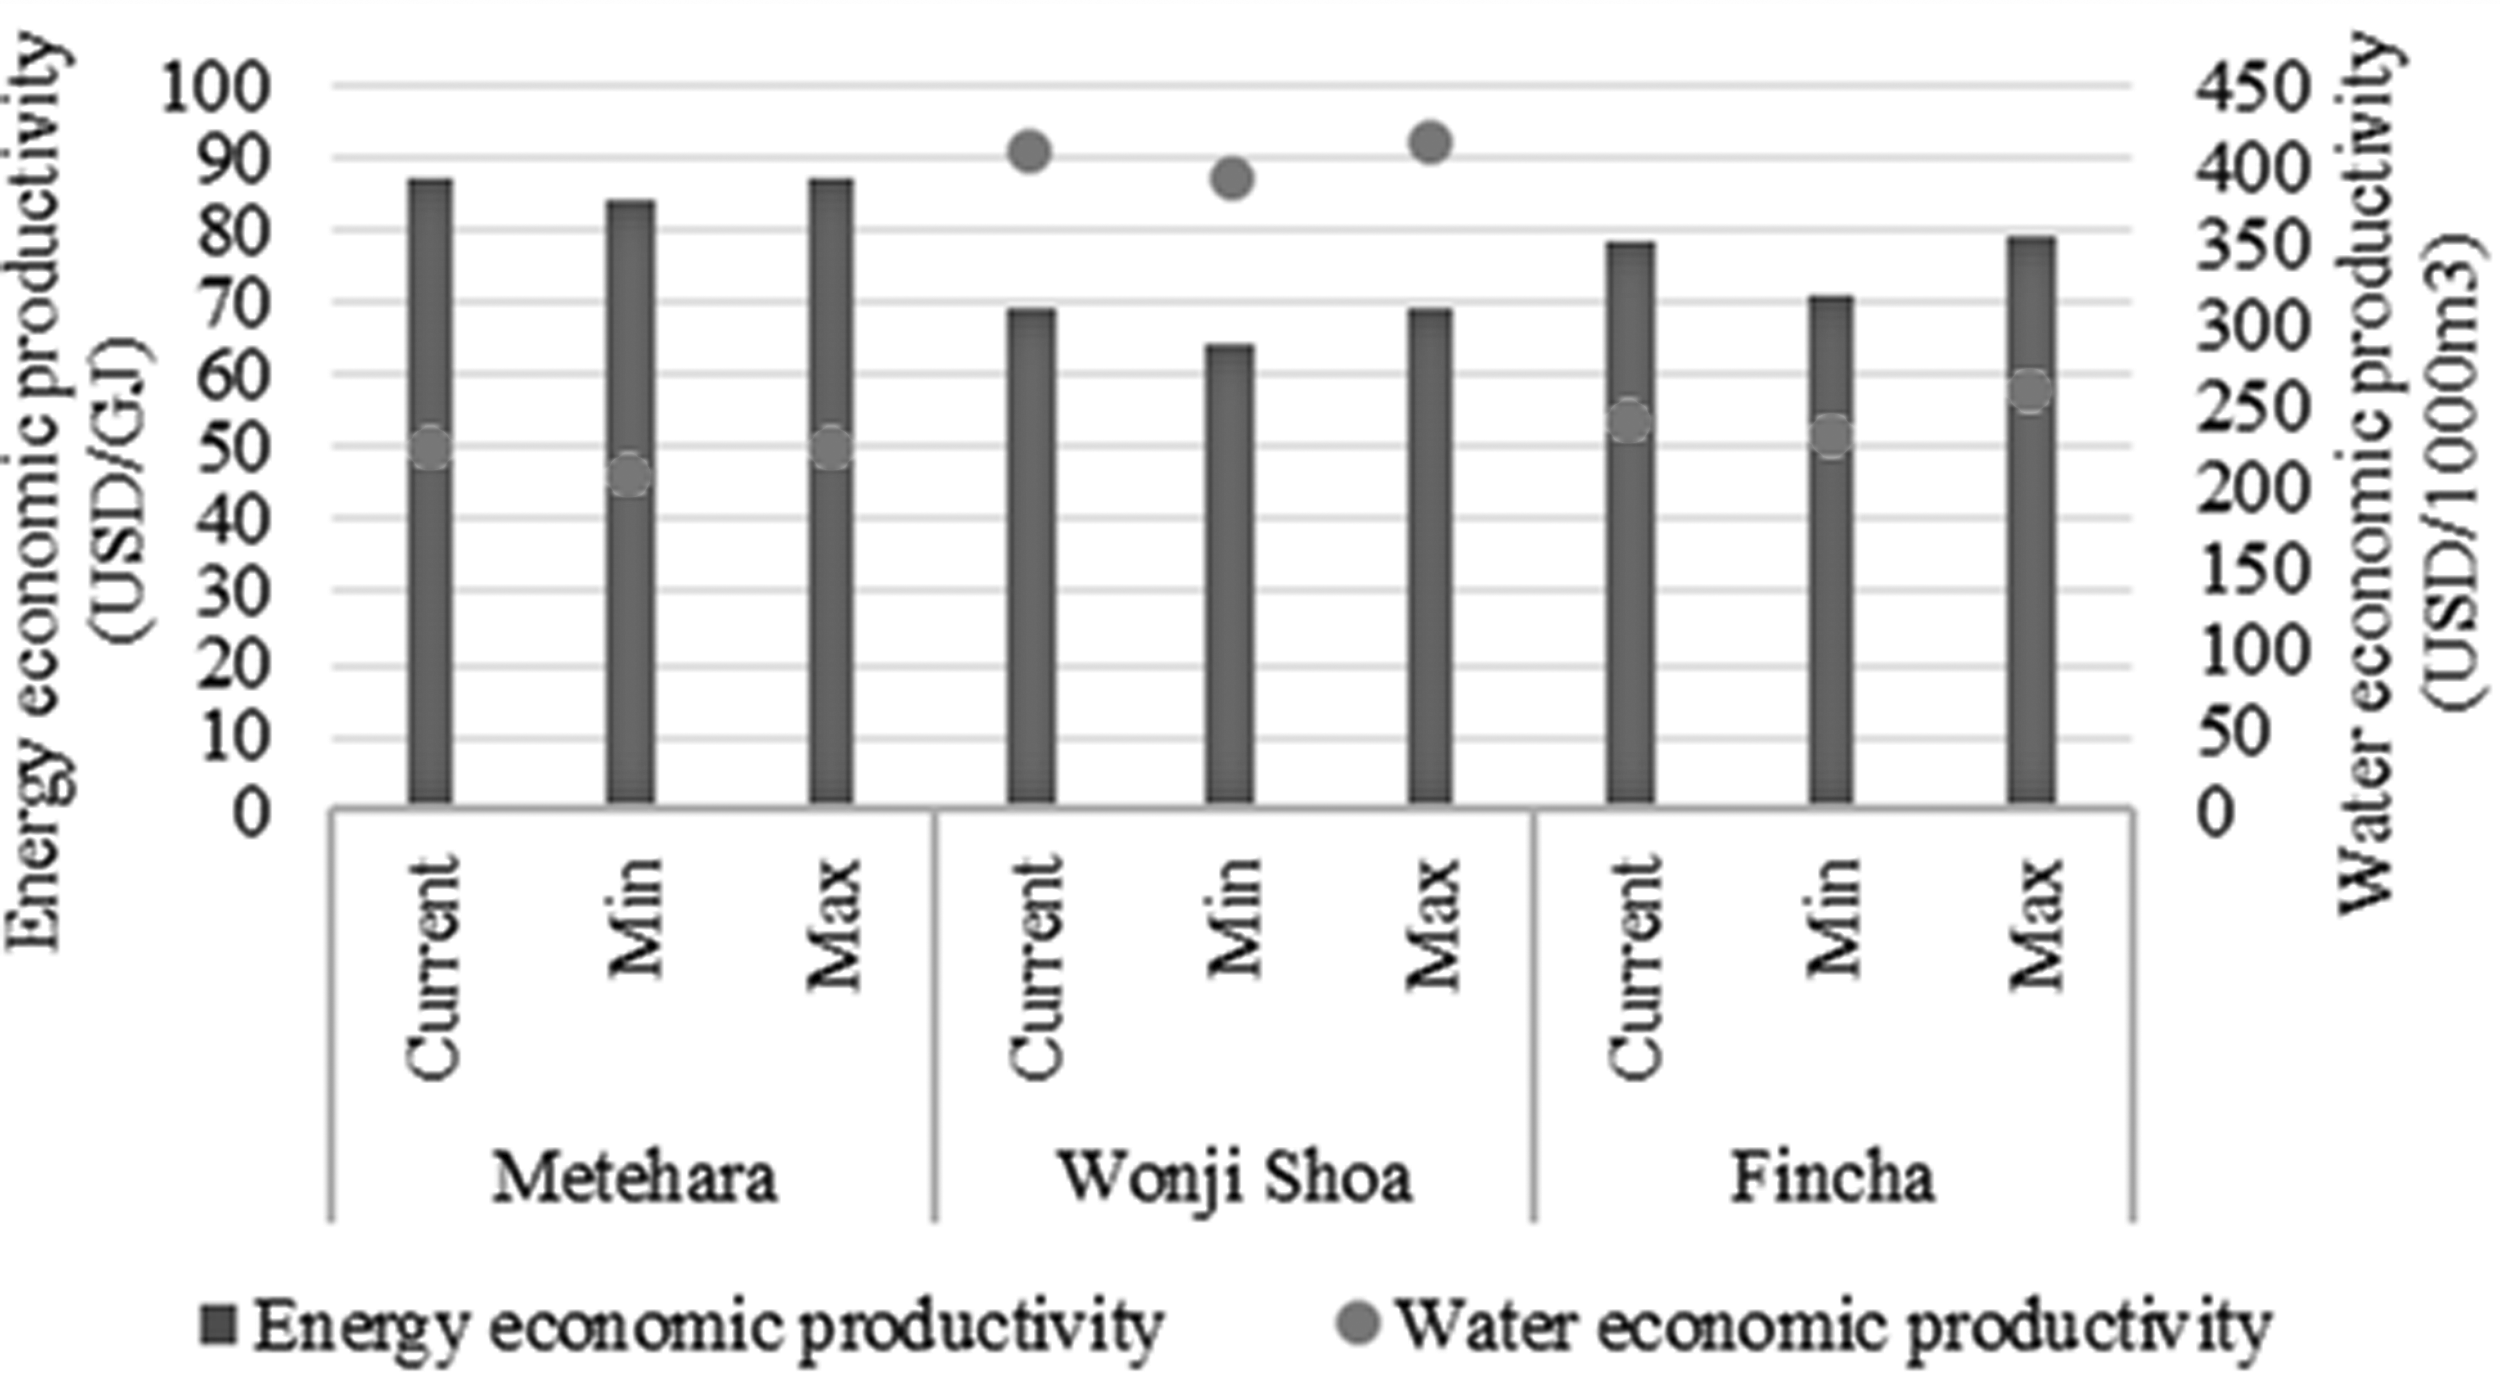
Water and energy economic productivity per hectare of sugarcane cultivation of each study site.
Analysis of WEFNI for sugarcane cultivation of the study sites
Table 3 shows the normalized values of all indicators and WEFNI values of each sugarcane cultivation site, which are calculated based on Equations (7)–(9). This normalization helps to understand how well the current year (2017/18) sugarcane production of each study site is improved in each indicator, in relation to their past years' (2015/16 and 2016/17) experiences. Comparing the normalized values of the consumption indicators, sugarcane production in Metehara and Fincha recorded lesser improvement in water consumption, while Wonji-Shoa had better water consumption performance. On the other hand, the normalized values of the energy consumption indicator showed that Wonji-Shoa and Fincha have very good improvement; meanwhile, Metehara still has less improvement in energy consumption compared to the previous years.
Normalized Indicators and Water–Energy–Food Nexus Index of Sugarcane Cultivation in the Study Sites
WEFNI, water–energy–food nexus index.
According to the values shown in Table 3, the normalized mass productivity indicators indicated that Metehara has good improvement in water mass productivity than the other two sites (i.e., the normalized water mass productivity = 0.31, which is higher than the others). Meanwhile, for the case of energy mass productivity, Fincha has better improvement (i.e., the normalized energy mass productivity = 0.45) followed by Wonji-Shoa and Metehara. The normalized values for economic productivity indicated that Metehara and Wonji-Shoa have very good improvement in both water and energy economic productivity, while Fincha performed less in the water economic productivity and high in the energy economic productivity.
WEFNI is finally applied to determine the WEFN performance management of each study site. In this study, since the weight applied to every indicator is equal, WEFNI shows the average of all the normalized indicators. Based on the obtained WEFNI values, the nexus performance management of the sugarcane production in the study sites was identified. Since a higher WEFNI score indicates better nexus performance of the sugarcane production, Wonji-Shoa, with a WEFNI score of 0.63, has the best nexus performance among the three sites. Even though the WEFNI score of the other two study sites (Metehara and Fincha) was not as good as Wonji-Shoa, their scores nevertheless indicated good nexus performance. In the case study by El-Gafy (2017), the normalized values of water and energy mass productivity were reported to be 0.84 and 1, respectively. Compared to these values, the mass productivity values of both water and energy of all the study sites are lower. On the other hand, the normalized values for consumption and economic productivity of water and energy in the three study sites are much better than the reference study. Generally, the overall WEFNI scores of all the study sites were higher than the score in the reference study. The WEFNI will help the producers by providing information about how much energy or water they are using by comparing to the amount of product they gained in relation to their past years' experiences. Based on their WEFNI values, the farmers or stakeholders can adjust their way of resource utilization along with profit maximization. Farmers or producers will benefit from producing with less amount of water and less effort in irrigation, as well as reduction of energy cost for irrigation, while having a substantial amount of product.
As indicated before, the study site (Wonji-Shoa) that has modern irrigation mechanisms is found to save more water and resulted in a higher WEFNI score than the other two (Metehara and Fincha). This result has given a clue that adoption of modern irrigation can improve the entire nexus of the cultivation process. The agriculture sector's water-saving potential increases as more water-efficient irrigation techniques such as sprinkler irrigation become cost-effective and available (Zou et al., 2013). Based on this concept, an analysis was carried out to see the impact of modern irrigation in Metehara and Fincha. Assuming that these two sites use the modern irrigation mechanism with similar irrigation efficiency as Wonji-Shoa, their WEFNI scores increased from 0.45 and 0.47 to 0.64 and 0.65, respectively, which are even higher than Wonji-Shoa (0.63).
The other reduction option is the substitution of inorganic fertilizers, which have high energy requirement during production by filter cake. This idea is explained in detail along with the calculation of the WEFNI values in the scenario analysis section of the article below.
Scenario of replacing inorganic fertilizer by sugar byproduct (filter cake)
Each study site has its own nitrogen fertilizer consumption, which is responsible for the total energy consumption of their agricultural production system based on the amount used. Haj-Seyed Hadi et al. (2009) reported that it would be possible to minimize the use of fossil energy and still produce a substantial amount of product by partly replacing fertilizers. Therefore, it is necessary to use practically recommended ways of reducing intensive energy input related to fertilizer application. Reduction of input energy is directly related to the WEFN improvement. Reducing intensive energy input related to inorganic fertilizer application by replacing with filter cake will also reduce the expense of importing inorganic fertilizer. This cost reduction will directly help to increase the energy and water economic productivity, which finally take part in the improvement of the whole nexus.
In this study, a research scenario of replacing half of the inorganic fertilizer (urea) by the byproduct (filter cake) produced in the sugar production section of the factory was conducted. Filter cake, which has 2.2% nitrogen content, can be used as a replacement for nitrogen fertilizer (George et al., 2010). The nitrogen fertilizer used for the sugarcane production in the study sites is urea (CH4N2O) which has 46.6% nitrogen content. Application of urea fertilizer for the sugarcane cultivation in the sugar factories' farm is about 410, 360, and 450 kg per ha of farmland in Metehara, Wonji-Shoa, and Fincha factories, respectively. Therefore, in order for filter cake to replace half of the urea fertilizer in each study site, 21.2 times more kilogram of filter cake is needed. According to this concept, 4,346, 3,816, and 4,770 kg of filter cake are required to replace half of the total urea fertilizer used in Metehara, Wonji-Shoa, and Fincha, respectively. The energy consumption for transporting the filter cake from the sugar factory to the agriculture fields are assumed to be offset with the transportation of the filter cake to waste disposal area in the conventional filter cake management mechanism.
WEFNI comparison of the fertilizer substitution scenario and the base case
The cost of fertilizer saved from this substitution in the factories' farm is about 0.52 $/kg, which is in total $107, $94, and $117 for Metehara, Wonji-Shoa, and Fincha, respectively. This amount of money saved increased the energy economic productivity of each study site and helped to improve their nexus performance. The WEFNI result obtained from the proposed nitrogen fertilizer substitution in the sugarcane farm of the sugar factories with comparison to the base case is presented in Fig. 5.
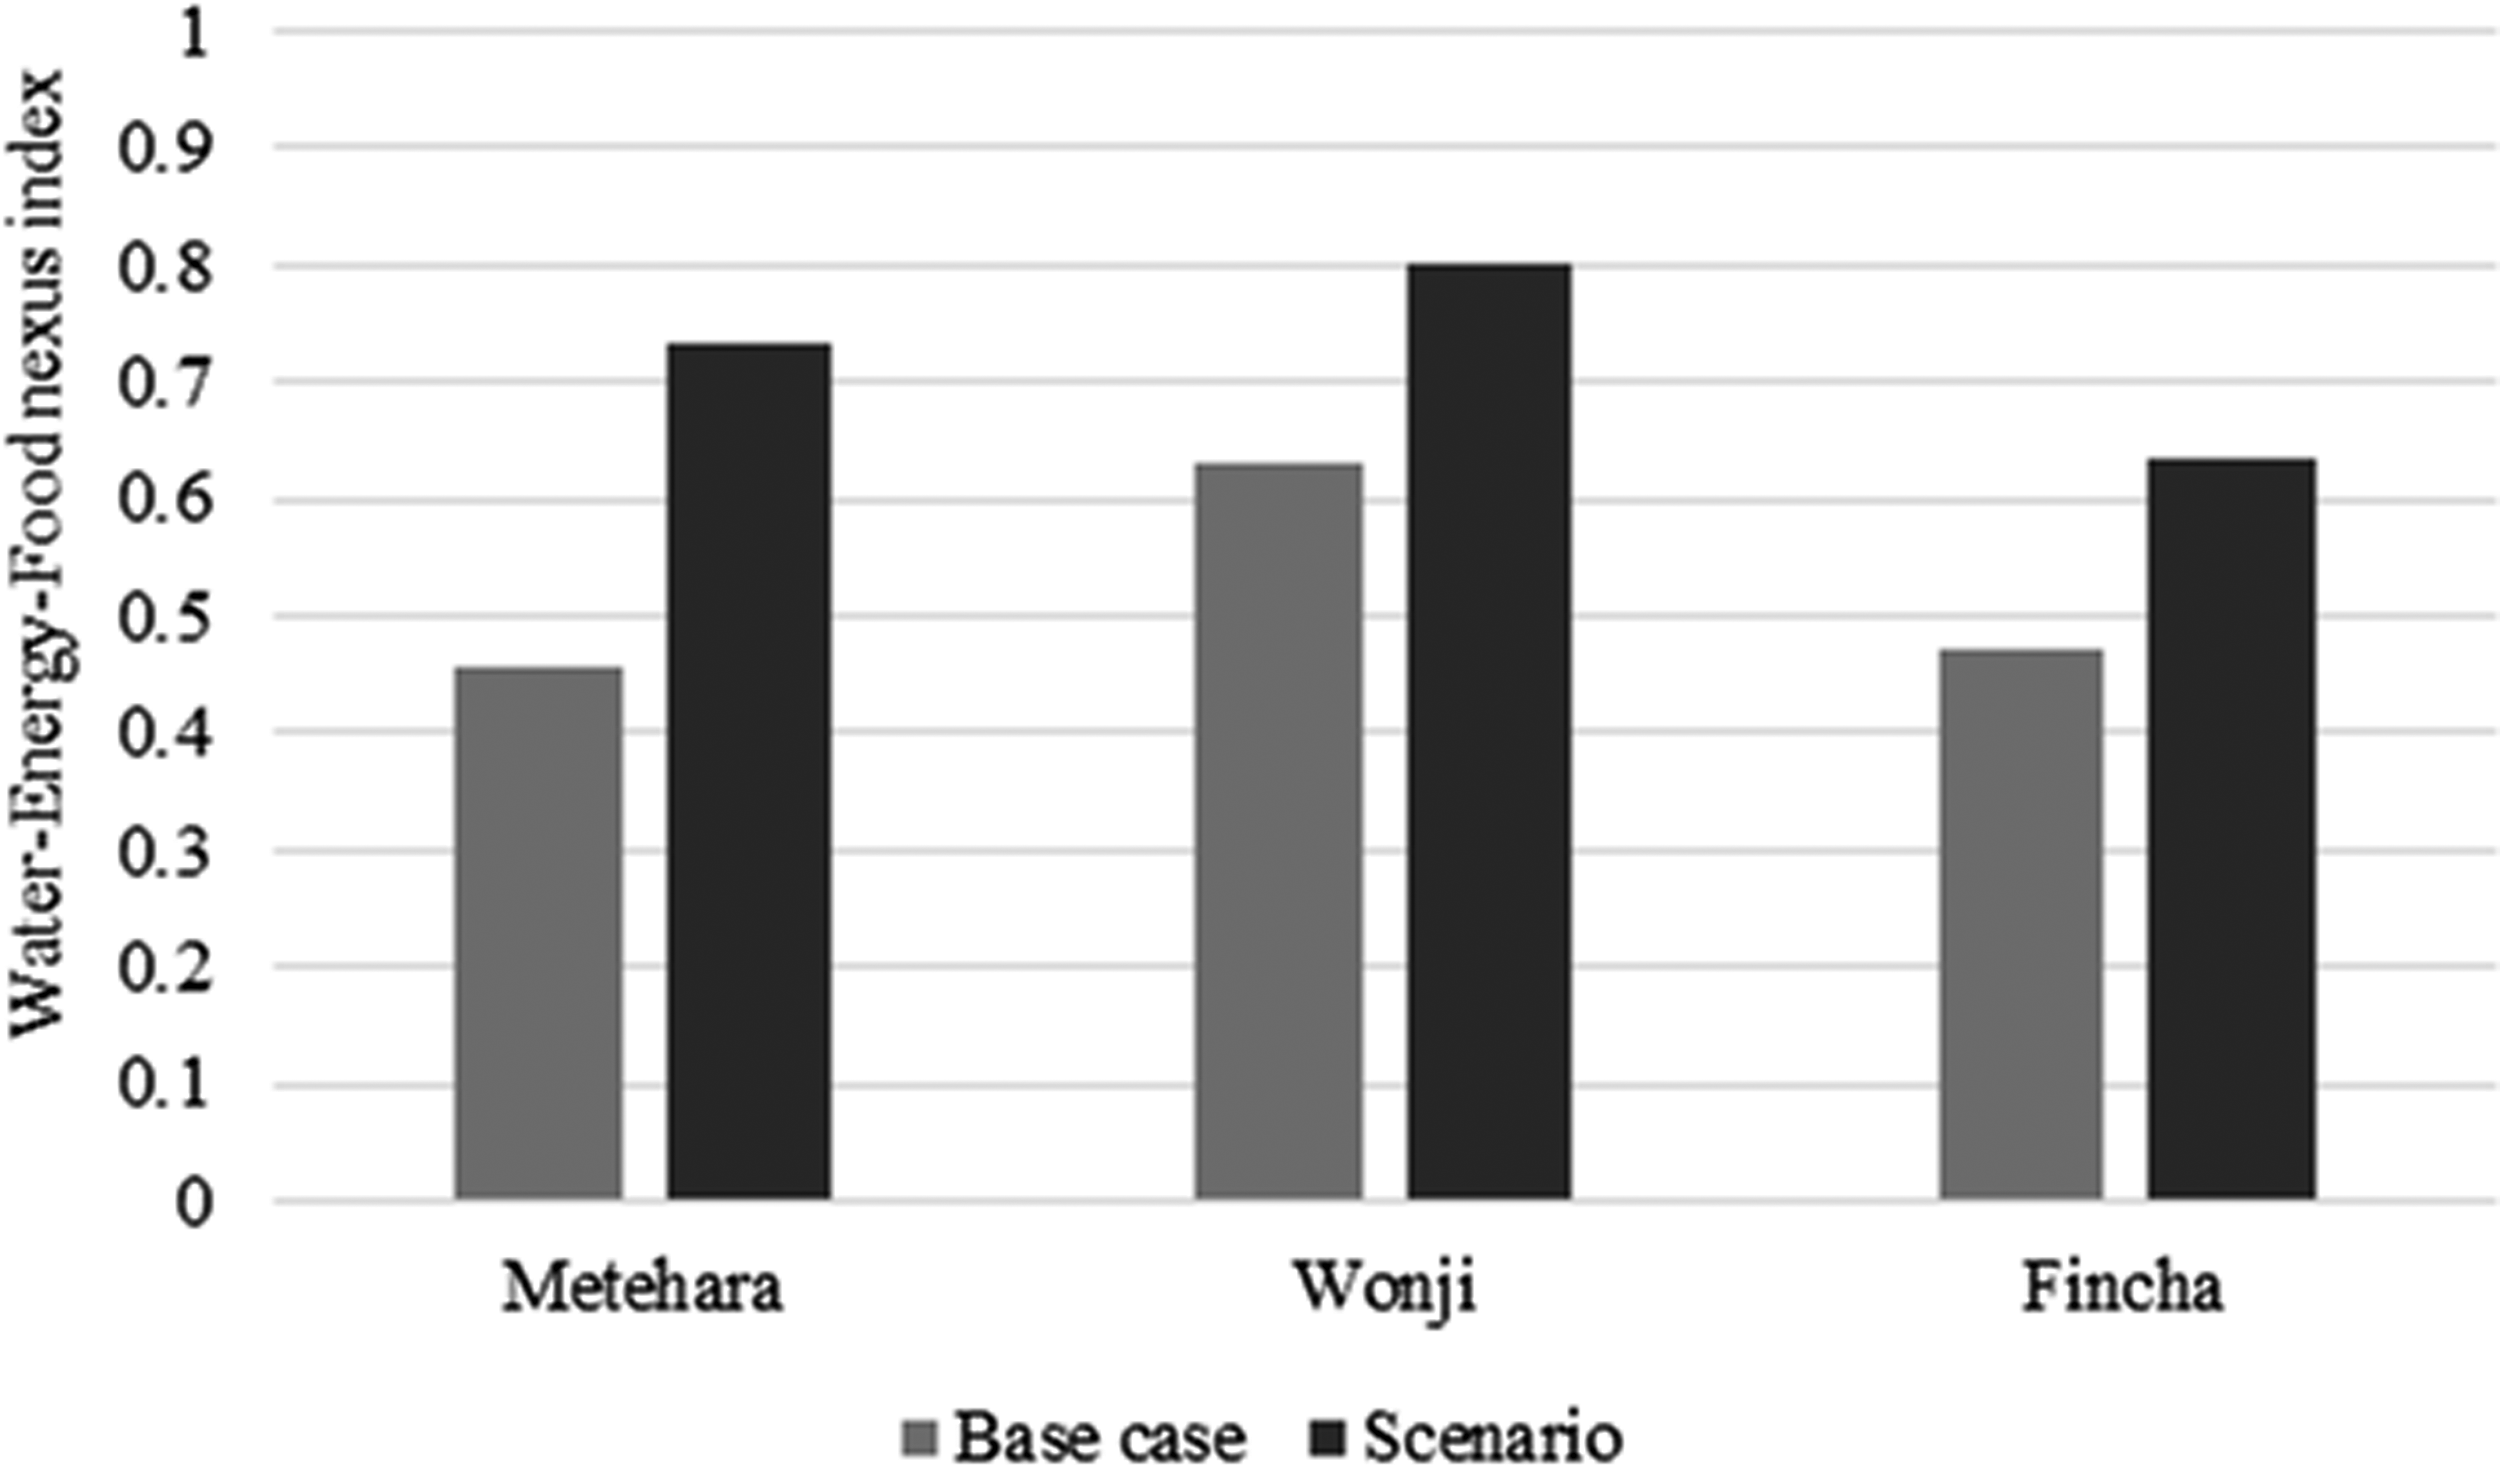
Water–energy–food nexus index comparison of the scenario and the base case.
As it was in the base case, Wonji-Shoa is still leading in having the best nexus performance. Substituting half of the nitrogen fertilizer by filter cake has helped the nexus performance to be improved from 0.63 to 0.8 in Wonji-Shoa site, 0.45 to 0.73 in Metehara site, and 0.47 to 0.63 in Fincha site. These result variations indicate that the considered scenario is one way of improving the WEFN performance of the studied sites. Producers and stakeholders of the agriculture sector can use this nexus assessment approach to improve their productivity, profit, and resource management. Based on annual analysis of this nexus, they can understand how well their management performance is improved and help them to take actions on their weak points of the agricultural production stage.
Conclusions
This study provided information about the WEFN in the sugarcane production sector of three large-scale sugar producing factories in Ethiopia in the year 2017/18. The study was conducted by applying a WEFNI approach, which brings different indicators together. The indicators used in this study can also be applied to any crop or agricultural product at any time and place as long as there is the production of agricultural produce, consumption of both water and energy during cultivation, and economic value of that specific product. The major role players for the nexus improvement of the proposed study sites were the reduction of resource (water and energy) consumption and the increase of food (sugarcane) productivity relative to the past 2 years.
Depending on the results and discussion derived from the data collected, suggestions were given for the WEFN management improvement in the sugarcane production sector of the country. The significant (influential) input for the increased consumption of energy is nitrogen fertilizer. Introducing natural fertilizers in which the agriculture sector of the factories can get them easily and cheap to replace synthetic fertilizers can save energy as well as cost in the agriculture sector of the sugar factories. Since the studied sugar factories produce ethanol along with their sugar production, the byproducts from sugar and ethanol production such as filter cake and vinasse can be used as natural fertilizer. Chang et al. (2016) also observed that the energy utilized for producing synthetic fertilizers, pesticides, and herbicides to increase crop yields is predicted to be 30% to 50% of total agriculture energy consumption. Excess withdrawal of water for irrigation is due to old and less water-saving mechanisms. Therefore, to overcome this problem, the factories' agriculture sectors have to replace the old irrigation mechanisms with new and water-saving irrigation technologies. WEFNI calculation needs to be done yearly to follow up the annual improvement of WEFN management in the proposed study sites. In addition to yearly assessment, further works are recommended to include different scenario analyses, which would possibly improve the nexus performance of the study sites. Studies on nexus assessment have to be made with or/and without considering other indicators. The literature survey of Ang et al. (2015) showed several energy security studies, which applied various energy security indicators to measure the energy situation in different regions. Therefore future nexus studies are recommended to include this indicator to analyze the energy security and combine it with other indicators of food and water. Finally, care must be taken when emphasizing large-scale investments such as sugar factories, which are highly dependent on water and energy. Policy planning and making should also consider resource (water and energy) management trends of sugar factories in the country.
Footnotes
Acknowledgments
The authors would like to pass their gratitude to the Joint Graduate School of Energy and Environment (JGSEE), King Mongkut's University of Technology Thonburi, for the financial support during the research. Besides, the authors would also like to show their appreciation and gratefulness for every person involved in the research, especially those who supported by providing every information required during the data collection. The National Science and Technology Development Agency (NSTDA) through the Research Chair Grant 2559 on the project “Network for Research and Innovation for Trade and Production of Sustainable Food and Bioenergy” (RD&E Fund: FDA-CO-2559-3268-TH) is also acknowledged.
Author Disclosure Statement
No competing financial interests exist.