
Abstract
Abstract
To provide a theoretical basis for soil management in mining areas, soil and vegetable samples were collected from the vegetable fields at a depth of 0–20 cm near the tungsten mining area in Ganna, China, and seven heavy metals (cadmium [Cd], copper [Cu], chromium [Cr], lead [Pb], zinc [Zn], arsenic [As], and mercury [Hg]) were analyzed by atomic absorption spectrophotometry and atomic fluorescence method. Health risk assessment was used to determine the health risks of the contaminated vegetables and soils. Results showed that the soil was very seriously polluted by Cd, Hg, and As; leafy vegetables were polluted mainly by Cu, Zn, Cr, and As, whereas rhizome plants were polluted by Cd, Pb, and Hg. Furthermore, correlation analysis and the speciation of heavy metals in soil suggest that Cd, Cu, Pb, Zn, and Cr in vegetables may be derived from the soil, whereas Hg and As may be affected by human beings. After the health risk assessment, it was found that there were greater health risks to children than adults from vegetables contaminated by heavy metals. The target hazard quotients for all heavy metals were all >1. The degree of harm from different metals was ranked as follows: As > Cr > Cd > Cu > Hg > Pb > Zn. So, heavy metal pollution in vegetables was serious, and there was high noncarcinogenic risks that endangers human health.
Introduction
Heavy metal pollution because of the exploitation of mineral resources has become serious environmental problem in recent years. Gannan area of China is known as the “World Tungsten Capital,” where tungsten ore is a typical polymetallic-associated mineral resource, and large amount of pollutants, such as mining dust, beneficiation wastewater, tailings waste residue, and so on, are produced during the mining process. These harmful ingredients from mining and processing are released into the mining area and enter the soil through irrigation, precipitation, and drenching. Finally, heavy metals copper (Cu), lead (Pb), zinc (Zn), chromium (Cr), cadmium (Cd), arsenic (As), and mercury (Hg) are accumulated in the soil, resulting in the contamination of the surrounding environment. Heavy metals accumulated in the soil might be converted to other speciations to promote the migration and spread through the food chain and pose a serious threat to human health (Shahab et al., 2018; Deng et al., 2019; Li et al., 2019; Vongdala et al., 2019). Previous studies have shown that Cd typically dominated heavy metals in tungsten mining areas. Other heavy metal elements also might cause different degrees of pollution, and endanger the local ecological environment (Li et al., 2014; Zhang et al., 2016; Shen et al., 2019).
In addition, many studies indicated that there were also heavy metal pollution characteristics in native plants in mining areas. It was reported that heavy metals such as Cd and Cu inhibited the growth and development of plants through the characteristics study of the heavy metal pollution of native plants in a tungsten mining area in southern Ganzhou (Wang and Song, 2005; Liu et al., 2010). There was 52.95 mg/kg and 2135.50 mg/kg of Cd and Cu in Pangushan tungsten mine, respectively, which far exceeded the background values of soil environment in Jiangxi Province and seriously endangered the ecological environment (Hui et al., 2018). Because of the risks to human health, research to date has mainly concentrated on heavy metal pollution of soil in tungsten mining areas, and there have been few studies of heavy metal pollution in vegetables and the associated health risks (Lin, 2014; Chen et al., 2015; Zhao et al., 2015; Barać et al., 2016; Nie et al., 2016).
To understand the health risks of topsoil and vegetables around the tungsten mine area, the Jiangxi Province, which has long history on tungsten mining, was taken as the research object. To analyze the characteristics of heavy metal content in the mining area and the surrounding farmland soil and vegetable samples, the noncarcinogenic risk of heavy metals in topsoil and vegetables was evaluated by the target hazard coefficient method. The evaluation results could be the scientific basis and theoretical support for the agricultural environmental management of the mining area.
Materials and Methods
Overview of the study area
The sampling area is in the southwest part of Ganzhou, upstream of the Zhangjiang River, in Jiangxi Province, China, between 114°–114°44′W and 25°15′–25°37′N. The area is dominated by red and yellow soils. It has a subtropical monsoon climate and is characterized by warm and humid weather with abundant rainfall.
Sample collection and analysis
Soil and vegetable samples from a vegetable field in the study area were collected in June 2015. The soil was sampled using plum blossom method following the procedures outlined in the Soil Environmental Monitoring Technical Regulations (0–20 cm) and the standard of HJ/T166-2004. GPS was used to located the sampling points, Finally, a total of 69 vegetable samples were collected from 10 vegetable fields, which comprised 63 samples of leafy vegetables (celery, chrysanthemum, kale, and other leafy vegetables) and 6 samples of white radish, carrots, and other rhizomes. Soil samples and vegetable samples were placed in labeled clean sample bags and transported to the laboratory for analysis. The sampling points are given in Fig. 1.

Soil sampling sites in vegetable fields.
Samples of soils were naturally air-dried. Then, gravel, plant residues, and other impurities were removed. The soil samples were quartered and ∼1 kg was chosen and passed through a 100-mesh nylon sieve. The vegetable samples were washed three to five times with deionized water. Then they were separated into the edible part and the woody part. The edible part was chopped and dried, first at 105°C for 0.5 h and then at 80°C to a constant weight, and the woody part was crushed with a microplant crusher. The concentrations of Cu, Pb, Zn, Cr, and Cd in the soil samples were determined by atomic absorption spectrophotometry after the European Community Bureau of Reference (BCR) extractions (Guo et al., 2014). Heavy metal such as Hg and As in vegetable samples were determined by the atomic fluorescence method after digestion with HNO3-HClO4 (Hu et al., 2017).
In all sample assays, the reliability of the control analysis data was checked against spiked recovery and parallel samples. The recoveries were between 80% and 120%, and the relative standard deviations were <10% (Xi and Sun, 2010). The guidelines for sample analysis (GBW07423) and the National Plant Reference Material (GBW07604) were used to control the quality of the samples, and the data measurements fell within the permissible range of error.
Evaluation methods
To understand and evaluate the health risks from ingestion of vegetables grown in this region, the target hazard coefficient method (target hazard quotients [THQ]) was chosen that established by the US Environmental Protection Agency (USEPA) in 2000 (Yu et al., 2015; Zhang et al., 2015). This method can be used to assess the health risks from both a single heavy metal and multiple heavy metals at the same time. The method assumes that the dose of the contaminant absorbed is equal to the intake dose. The formula is as follows:
where Ci is the measured mean value of a contaminant (mg/kg); FIR is the ratio of the diet to digested food (g/[human·d]) for which the value for adults and children was 301.4 and 231.5, respectively; ED is the average life expectancy, which had values of 30 and 7 for adults and children, respectively; EF is the exposure frequency (D), which has a value of 365; BW is the mean mass (kg) of the subject, and was 55.9 for an adult and was 32.7 for a child; TA is the mean time (d) for noncarcinogenic exposure and was 10,950 for an adult and 2,555 for a child, and the RFD is the daily reference (mg/[kg·d]). The daily reference values and thresholds for doses of metals to which the human body can continue to be exposed for a long time without compromising health established by the World Health Organization (WHO) and the USEPA are given in Tables 1 and 2.
Reference Doses of Pollutants Investigated (mg/[kg·d])
RFD, the daily reference values and thresholds for doses of heavy metals.
Health Risk Assessment Parameters
TA, mean time; BW, mean mass; ED, average life expectancy; EF, exposure frequency; FIR, ratio of the diet to digested food.
The noncarcinogenic risks in sensitive populations can be assessed with the THQ. When the THQ is >1, there may be a noncarcinogenic risk to sensitive populations from heavy metals. The noncarcinogenic risk increases with the increase in the THQ value. The TTHQ refers to each pollutant risk factor (THQ). There is no risk of chronic noncarcinogenic production when the TTHQ is <1. On the contrary, there is a noncarcinogenic risk when the TTHQ is >1. The noncarcinogenic risk also increases with the increase in the TTHQ.
Results and Discussion
Heavy metals in vegetable fields
Concentrations of Cd, Cr, Cu, Zn, Pb, Hg, As and physiochemical properties of soil samples are given in Table 3. The pH values of the vegetable soil were between 4.91 and 7.21, and 90% of the samples had pH values <7, indicating the weakly acidic nature of soils in the southern area of Jiangxi Province. The soil organic matter in the sampled soils was classified as level 3 (2–3% content) compared with the national soil fertility standards (Table 3). The cation exchange capacities of the soil were <20 cmol/kg, and the total nitrogen concentrations in all the vegetable soils were ∼1 g/kg, which had met the requirements for vegetable growth. Heavy metals such as Cd and Cu concentrations in all soils exceeded the National secondary standard values and the Ganzhou background values (Table 3) for soils. The As and Hg concentrations exceeded the national secondary standard values in 60% and 70% of the samples, respectively, which exceeded the Ganzhou soil background values in 90% and 100% of the samples, respectively. The concentrations of the Pb, Zn, and Cr in the soil samples bellowed the National secondary standard values, but 100% of the samples exceeded the background values of Ganzhou City. Therefore, the vegetable soils were heavily polluted with heavy metals, mainly by Cd and Hg. The coefficients of variation for Cd, Hg, and As showed considerable regional variation and were >50%, mainly because of the tungsten mining, causing unequal enrichment of heavy metals in soil.
Summary of the Properties of Vegetable Soils
CEC, cation exchange capacities; CV, coefficient of variation; SOM, organic matter.
Heavy metals in vegetables
The concentrations of Cd, Cr, Cu, Zn, Pb, Hg, and As in the edible part of the vegetables sampled from the tungsten mining area were also determined. The mean values of the heavy metals in the vegetables are given in Table 4.
Summary Information About Heavy Metals in Vegetables
The results presented in Table 4 indicate that the concentrations of Cu, Zn, Cr, and As in the leafy vegetables were 100% higher than the standard values for vegetable hygiene. These results indicate high health risks from vegetables. The coefficients of variation of Cd, Pb, and Hg varied widely and were 161.98%, 245.46%, and 163.32%, respectively. The Zn, Cr, and As concentrations in all the rhizomes far exceeded the hygiene standards for vegetables, indicating high risks to health. The coefficients of variation were >50%, for Cd (111.11%), Pb (75.71%), and Hg (100.00%). These high coefficients of variation indicate the distinct distribution of these three heavy metals. It is known that vegetables in this region may not only absorb heavy metals from the soil through migration, but also adsorb them from the air through the leaves (Dahmani et al., 2000; Rattan et al., 2005), resulting in strong accumulation of heavy metals.
Using correlation analysis to detect sources of heavy metals in vegetables
Pearson correlation analysis
To clarify the relationships between vegetables and heavy metals in soils, Pearson correlation analysis and principal component analysis (PCA) (Pang, 2015; Yang et al., 2018) were used. This assessment could provide a basis for restoring heavy metal-polluted soils and improve the health of vegetables. The results of correlation analysis are given in Tables 5 and 6.
Pearson Correlation Analysis of Metals in Vegetables
p < 0.05 level (bilateral) was significantly correlated.
p < 0.01 level (bilateral) was significantly correlated.
Pearson Correlation Analysis of Metals in Soils and Vegetables
p < 0.05 level (bilateral) was significantly correlated.
p < 0.01 level (bilateral) was significantly correlated.
As given in Table 5, Cd in the vegetables was significantly and positively correlated with Cr in the vegetables, with a correlation coefficient of 0.938. However, Cd was significantly and negatively correlated with Zn and Hg, with correlation coefficients of −0.981 and −0.719, respectively. Cu was significantly and positively correlated with both Pb (0.819) and As (0.652). There was a significant negative correlation between Zn and Cr. The correlation results suggest that Cd, Cr, Cu, Pb, and As in the vegetables had similar sources. Metal element such as As was strongly correlated with multiple metals, suggesting that the As pollution came from a variety of sources.
As given in Table 6, Cd in vegetables was positively correlated with Cd and Pb in the soil, with correlation coefficients of 0.65 and 0.653, respectively. Cr in vegetables was positively correlated with Pb and Cr in the soil, with correlation coefficients of 0.614 and 0.07, respectively. The contents of Hg in the soil were negatively correlated with Cd, Pb, and Cr in the vegetables, but were positively correlated with As in the vegetables. This indicates that Cd, Pb, and Cr in vegetables and in soil had the same sources, and Hg and As in soil and As in vegetables had the same source.
Principal component analysis
To further explore the correlation between heavy metals in vegetables, PCA was used to analyze the load factor of heavy metal elements in the tungsten mining area. In order to eliminate the difference in quantity and dimension between variables, so that all kinds of variables are in the same position. The PCA results are given in Table 7.
Results of Principal Component Analysis of Heavy Metals in Vegetables
The eigenvectors extracted from PCA are given in Table 7. The first two components with eigenvalues >1 and a cumulative variance of >70% were taken as the principal components, and the principal component factor of the heavy metals of the vegetables were also obtained. The first principal component accounted for 51.758% of the variance, including Cd, Cu, Pb, Zn, and Cr. The second principal component included Hg and As, which accounted for 20.921% of the variance. The metals associated with the first principal component were mainly from natural sources, and the high concentrations of heavy metals such as Cd, Cu, Pb, Zn, and Cr in vegetables can reflect the relatively high heavy metal concentration in soil accordingly. The metals associated with the second principal component mainly reflected human activities, perhaps including improper use of chemical fertilizers by local residents or the irrigation from river contaminated with acid waste water from the mine.
Speciation of heavy metals in soils from vegetable fields
Although the total concentrations of heavy metals in soils can be used to reflect the degree of pollution and damage to the environment, they do not provide information about the bioavailability of heavy metals. It is important to assess the direct impacts of heavy metals on the environment by each speciation. The extraction method of the BCR was carried out to determine the speciation of the heavy metals in the vegetable soils (Fig. 2).
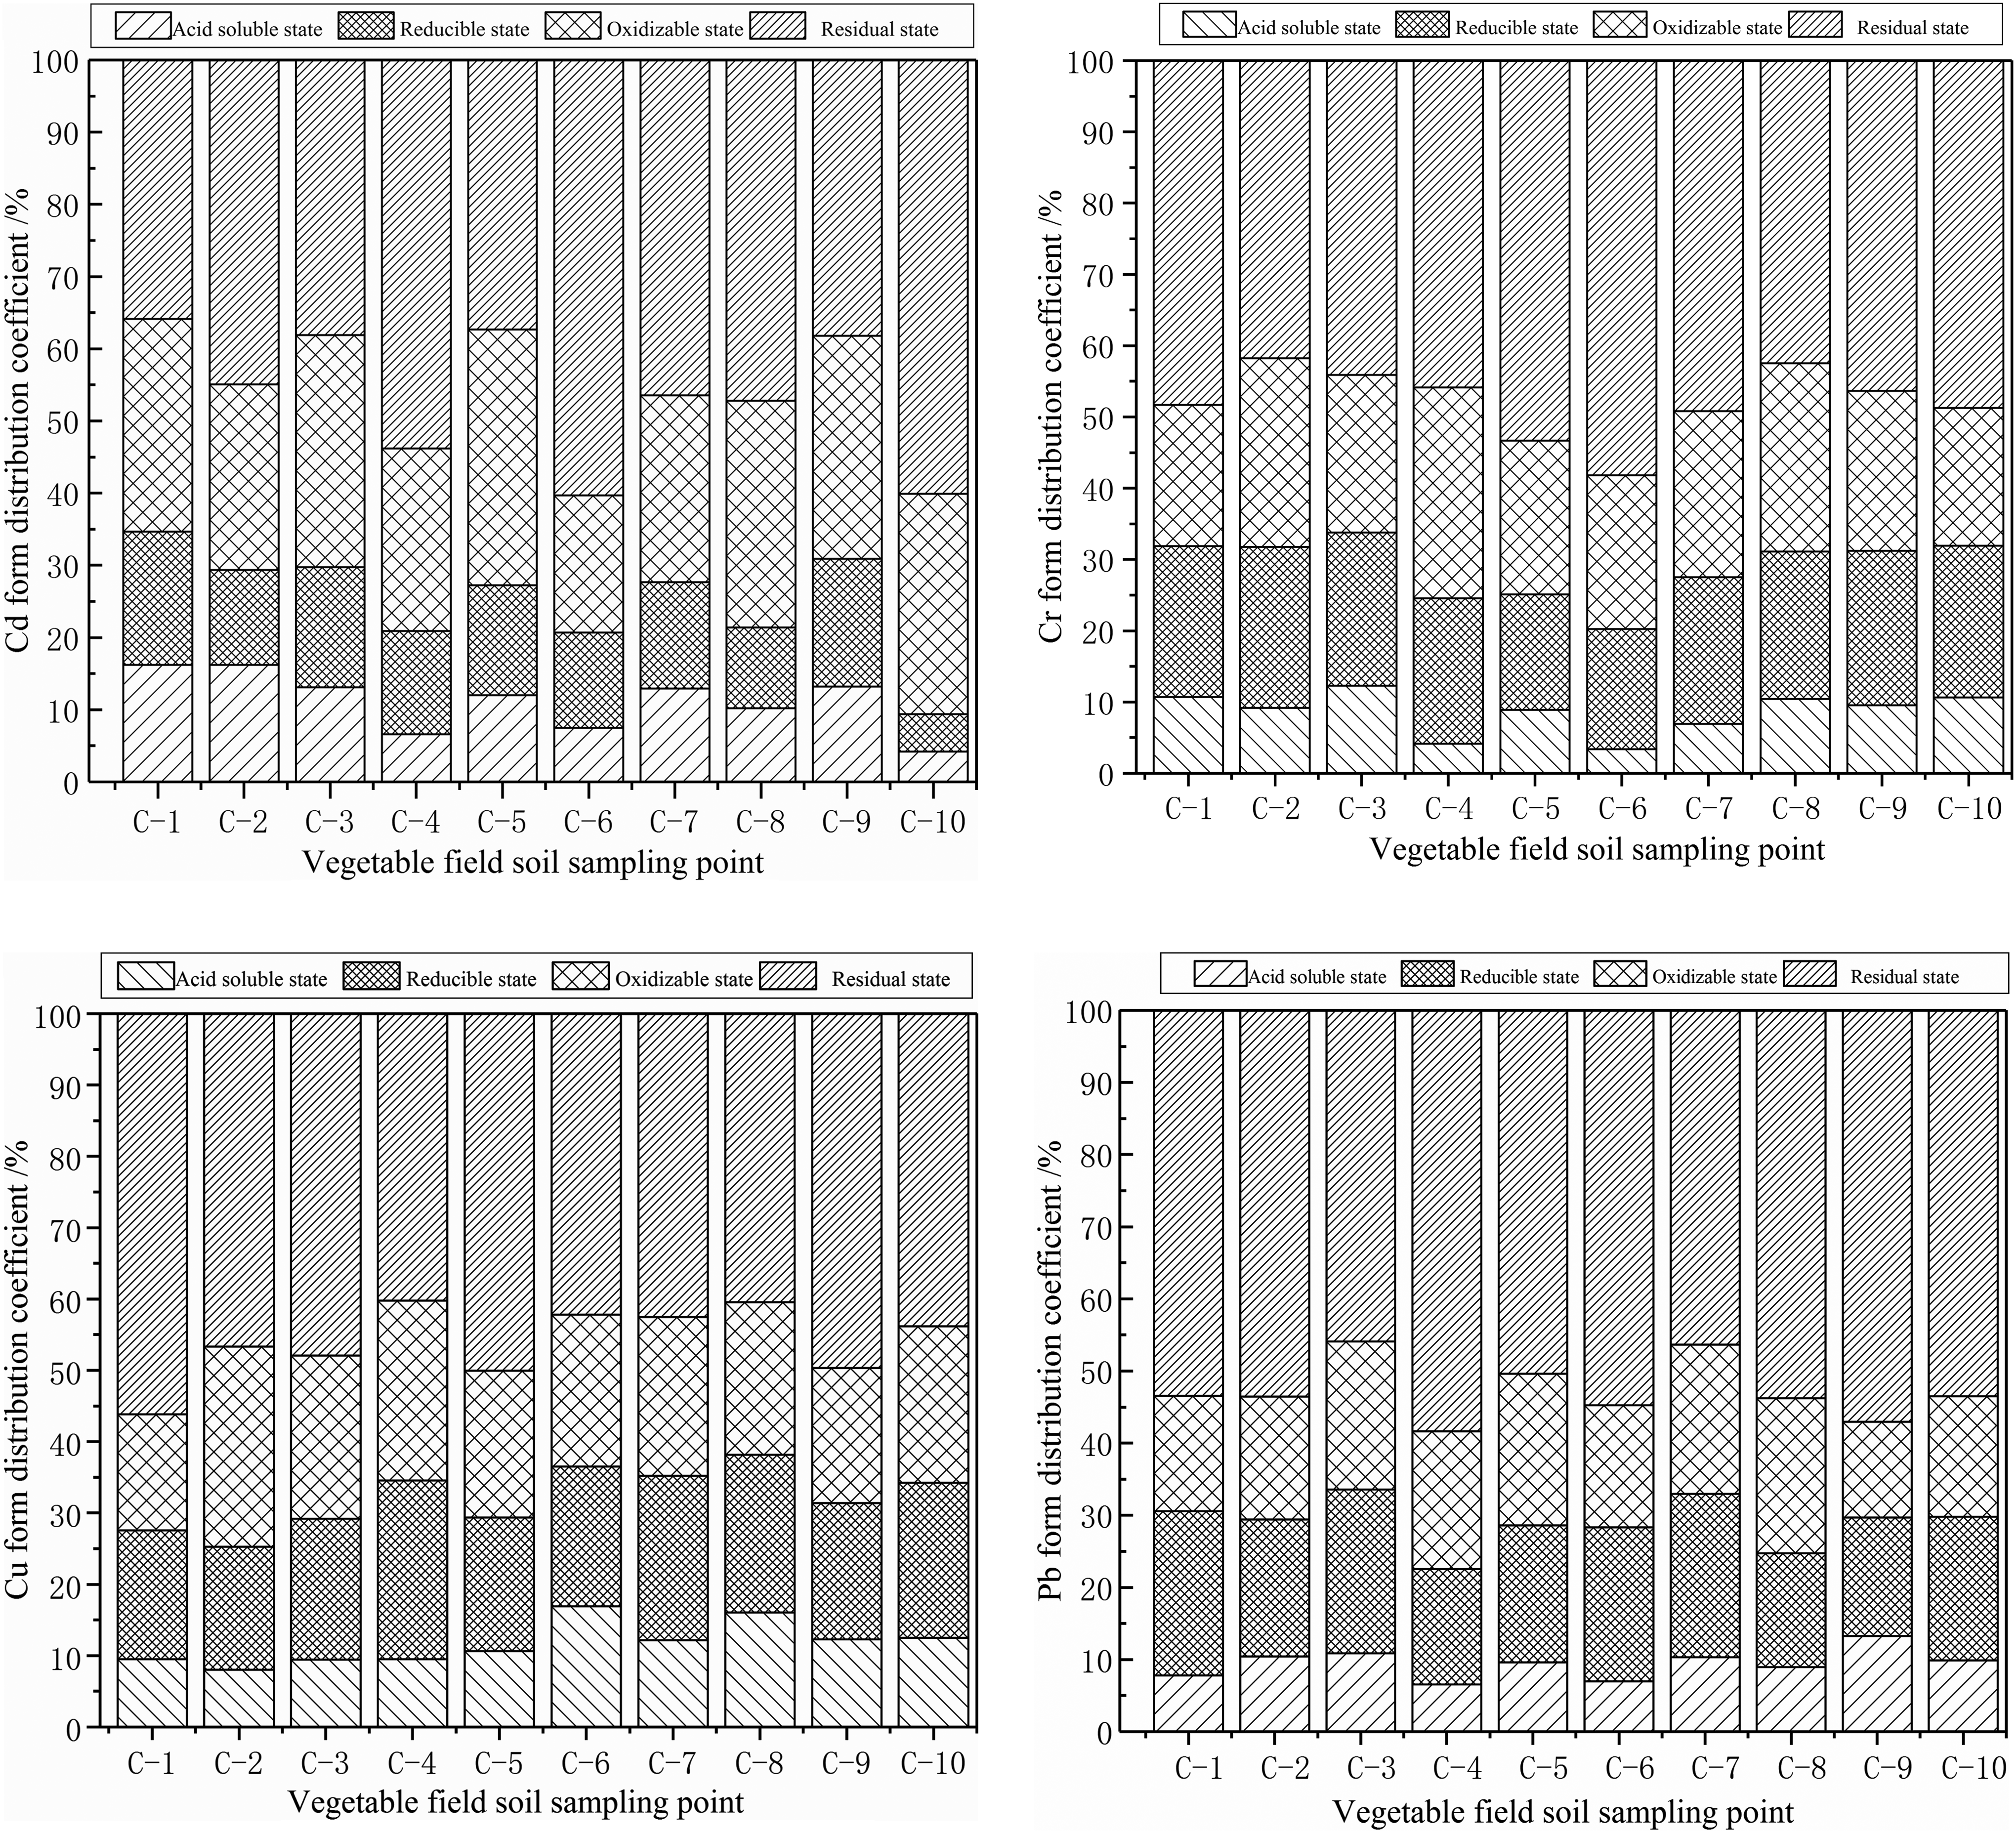
Distribution characteristics of soil heavy metals. As, arsenic; Cd, cadmium; Cr, chromium; Cu, copper; Hg, mercury; Pb, lead; Zn, zinc.
In the vegetable soil, the order of the contents of Cd speciation is as follows: residue > oxidizable > reducing > acid soluble. Under acidic conditions, Cd showed higher activity because of higher acid-soluble state, ∼11% of the total amount. The highest Cd-containing areas are C-1 and C-2 according to the shorter distance to the tungsten tailings, and the oxidizing acidification of sulfide leads to the increase of acidity. The contents of Cu and Cr speciation decreased as follows: residual state > oxidizable state > reducible state > acid-soluble state. The proportions of the reduced and oxidizable fractions were roughly the same and accounted for ∼50% of the total concentration. The acid-soluble speciation is the most available and accounted for ∼11% of the total concentration. These three-heavy metal speciations are more active, easily bioabsorbed, and enriched on the plant surfaces. The residual speciation accounted for >50% of the total concentration of Pb and Zn indicating that Pb and Zn were not easily biologically absorbed or used, and that their potential impacts on the environment were small.
Human health risk assessment
THQ and TTHQ for the food intake of heavy metals (Table 8 and Fig. 3) were calculated to assess the risk to human health from vegetables grown in the tungsten mining area. As speculated from Table 6, the health risk of heavy metals to children is greater than adults, which is similar to the Rukeya et al.'s evaluation of Beijing vegetables using this health risk assessment model (Rukeya et al., 2018).

Heavy metal THQ contribution rate of vegetable. THQ, target hazard quotients; TTHQ, sum of target hazard quotients.
Target Hazard Quotients and TTHQ Values of Heavy Metals in Edible Vegetables
THQ, target hazard quotients; TTHQ, sum of target hazard quotients.
THQ values for adult in leafy vegetables decreased as follows: As > Cr > Cd > Cu > Hg > Zn > Pb. As and Cr had THQs of 146.03 and 35.18, accounting for 73.56% and 17.72% of the TTHQ, respectively. The THQ for children indicates high risks, and 1.31 times more than the adult THQ. So, the risk to children was greater than that to adults. The children's TTHQ was up to 260.65, of which As was the main contributor. The THQ values of adults in rhizomes decreased in the following order: As > Cr > Cd > Pb > Hg > Cu > Zn, and the THQs of As and Cr reached 188.59 and 53.63, accounting for 72.25% and 20.55% of the TTHQ, respectively. The child TTHQ was higher than the adult TTHQ, showing greater health risks to children than adults from consuming vegetables. The THQs for all heavy metals were >1, and the degree of harm from the different metals was ranked as follows: As > Cr > Cd > Cu > Hg > Pb > Zn. To sum up, the health risk assessment of the edible part of vegetables suggested a noncarcinogenic risk. Besides, the risk to adults from vegetable consumption was less than the risk to children, and it was more risky to consume rhizomes than leafy vegetables. It has been reported that the Cd content of rice in the region were 54 times that of the general rice, 15 times for the vegetable and the 8.7–20.3 times for the animal's viscera (Liu et al., 2012; Wang et al., 2014), demonstrating that the local crops pose serious threat to the daily diet health of local residents. Local residents and relevant government departments should pay attention to these risks.
Conclusion
Soils from vegetable fields near the tungsten mining area in Gannan are mainly polluted by Cd, Hg, and As. The Cu, Cr, Zn, and As concentrations in leafy vegetables exceeded the vegetable hygiene standard limits, with exceedance rates of 100% for Cr, Zn, and Hg. Correlation analysis and the speciation of heavy metals in soil suggests that the Cd, Cu, Pb, Zn, and Cr in vegetables may be derived from the soil, whereas the accumulation of Hg and As may be brought about by human activities. The risk assessments to human health from consuming vegetables grown in the tungsten mining area were analyzed. THQ values of all the seven heavy metals in vegetables are >1, and the degree of harm from the different metals is ranked as follows: As > Cr > Cd > Cu > Hg > Pb > Zn, indicating serious noncarcinogenic risks to health. As a result, the vegetables grown in the tungsten mining area were not edible.
Footnotes
Author Disclosure Statement
No competing financial interests exist.
Funding Information
The National Natural Science Foundation of China (grant no. 51664025, 41861002).