
Abstract
Abstract
A continuous fixed-bed column study with sodium alginate-polyvinyl alcohol immobilized spent substrate of Pleurotus ostreatus (ISSPO) as biosorbent was carried out for the removal of Cd(II) from aqueous solution. Influence of different operational parameters, for instance, flow rate, bed depth and influent concentration on solute adsorption by ISSPO had been investigated. With increasing bed depth and the decreasing of flow rate and initial influent concentration, breakthrough and exhaustion time increased. With increasing flow rate, adsorption quantity decreased; and with increasing bed depth and initial concentration, adsorption quantity increased. Experimental data were analyzed using Adams–Bohart, Thomas, Yoon–Nelson, and Clark models. Compared with other three models, Thomas model fitted experimental data better, and q0 derived from Thomas model was closer to the experimental data. This revealed that the external and internal diffusion was not the bottleneck of this process.
Introduction
Cadmium is usually released into the environment in the following ways: metal production, phosphate fertilizer application, electroplating, and battery manufacturing (Xiaomin et al., 2007). This metal has caused a worldwide attention because of its toxic, carcinogenic, and mutagenic properties in nature. According to reports, cadmium is very harmful to human body and can cause many diseases, such as kidney damage, emphysema, and hypertension (Serencam et al., 2013). The World Health Organization (WHO) sets the maximum cadmium content in drinking water at 0.003 mg/L (WHO, 2008). Conventional methods, including chemical precipitation, coagulation, membrane processing, and solvent extraction (Gupta and Rastogi, 2008; Elouear et al., 2009), have been used to eliminate Cd(II) from aqueous solution, but these methods have the disadvantages such as high operating costs, low selectivity, and large consumption of raw materials and chemicals are needed (Gupta and Rastogi, 2009; Hu et al., 2014a). Adsorption is a promising technological alternative to traditional techniques for metal ions removal from aqueous solution as it is advantageous in operation cost, removal efficiency, and environment friendly (Gupta et al., 2006; Gupta and Nayak, 2012). Various biomaterials have been used as biosorbents, including fungus (Zafar et al., 2007), nutshell (Pehlivan et al., 2009), pine sawdust (Hansen et al., 2010), and other agriculture wastes (Amuda et al., 2007; Yuvaraja et al., 2014; Shin et al., 2007).
Spent substrate of Pleurotus ostreatus (SSPO) is a kind of agricultural wastes produced in edible mushroom industry and contains a large amount of components such as mycelium, cellulose, and hemicellulose. It pollutes the ecological environment when it is discharged directly into the environment. The porous nature of the SSPO makes it have a large specific surface area. At the same time, due to the growth and secretion process of SSPO, it is also rich in a large number of oxygen-containing functional groups (such as hydroxyl, carboxyl, and phosphate), which can be used as adsorbent to remove heavy metal ions from water. In our previous study, Zn(II) in simulated wastewater was adsorbed by SSPO without chemical modification (Hu et al., 2014b) and the Cd(II) in simulated wastewater was subjected to batch adsorption experiments by immobilizing SSPO with sodium alginate-polyvinyl alcohol (SA-PVA), whereas its performance in a fixed-bed column system and its removal models for Cd(II) have not been conducted. In this study, in a fixed-bed column experiment, SA-PVA immobilized SSPO (ISSPO) was used to adsorb cadmium (II) in aqueous solution. At the same time, the influences of bed depth, flow rate, and influent concentration on adsorption process were also studied. The dynamic behavior of the column was explored by Adams–Bohart, Thomas, Yoon–Nelson, and Clark models.
Materials and Methods
Chemicals
A standard solution of 1 g/L Cd(II) was prepared by dissolving appropriate amount of cadmium dinitrate tetrahydrate [Cd(NO3)2.4H2O] in deionized water. Cd(II) concentrations in solution were determined by Atomic Absorption Spectrophotometer (AA-6800 model; Shimadzu-GL, Japan).
Column adsorption experiments
The batch experiments were carried out in a plastic column with a length of 120 cm and an internal diameter of 10 cm. And the volume of the reactor is 9420 mL. The ISSPO of 404, 485, and 566 g were separately loaded into the adsorption column at a height of 50, 60, and 70 cm, respectively. Small gravels with a diameter of about 4 cm were added into the column to prevent adhesion of the adsorbent. Different concentrations of cadmium ion (50, 100, and 200 mg/L) solution were dropped into the adsorption column by wriggle pump, the flow rates were 20, 30, and 40 mL/min, respectively. According to our previous research, the experiment was carried out at room temperature (25°C), and the pH of the reaction solution was set at around 5 (Jin et al., 2017).
The shape of breakthrough curve and the time of breakthrough were important factors describing the adsorption performance (Lee et al., 2000; Radojka and Marina, 2008). The breakthrough curve was a good example of some of the properties of a fixed-bed column. The breakthrough point was when the effluent concentration (Ct) extracted from the column was about 5% of the influent concentration (C0) (Song et al., 2015). The exhaustion point was at which the effluent concentration reached 95% (Kumar and Bandyopadhyay, 2006).
The total content of the adsorbed metal (qtotal [mg]) is shown by the area under the breakthrough curve, for flow rate and a given feed concentration, and can be given by equation (1).
where Ct and C0 represent the effluent and influent concentration (mg/L), respectively. V represents the flow rate (mL/min).
qe (mg/g), which was the amount of adsorbed metal or adsorption quantity at equilibrium, can be shown by the following equation:
where m is the mass of sorbent(g).
Results and Discussion
Effect of column parameters on Cd(II) adsorption
Effect of bed depth
Figure 1 displayed the breakthrough curves of the ratios of effluent and influent concentration (C0/Ct) versus time at bed depth of 40, 50, and 60 cm (with ISSPO of 404, 485, and 566 g, respectively) and at constant flow rates of 30 mL/min and 100 mg/L for initial concentration of Cd(II). It could be seen clearly that the breakthrough time and the exhaustion time were extended from 490 to 920 min and from 1890 to 3720 min with the augment of bed depth from 40 to 60 cm, respectively. With the increase of bed depth, the penetration time and exhaust time prolongated due to the increase of the ISSPO amount added to the column, which furnished more binding sites for Cd(II). At lower bed depth, the axial dispersion dominates the mass transfer process and reduces the pervasion of metal ions (Luo et al., 2011). Metal ions cannot diffuse through the whole mass of the biosorbent when the bed column was not deep enough, which shortened the breakthrough and exhaustion time. With the increase of the bed depth, the retention time of the solution containing metal ions in the adsorption column prolongs, which makes the metal ions fully contact with the adsorbents (Qaiser et al., 2009). As the depth of the bed increased, the slope of the breakthrough curve decreased, indicating that the higher the bed, the wider the mass transfer band and the longer the exhaustion time (Zhang et al., 2010). Similarly, the adsorption quantity at equilibrium (qe) was found to increase with the deepening of the bed column as given in Table 1 (qe was 8.442, 11.22, and 12.07 mg/g when the bed depth was 50, 60, and 70 cm, respectively). This increasing tendency could be owing to larger surface area and more binding sites for Cd(II) adsorption resulted from higher amount of biosorbents at higher bed column (Ahmad and Hameed, 2010). Sun et al. also found that the depth of the column bed in the adsorption column had a great influence on the removal of metal ions (Sun et al., 2014).

Effect of bed height on breakthrough curve.
Parameters of Thomas Model
Effect of flow rate
The effect of flow rate (20–40 mL/min) on the Cd(II) adsorption in ISSPO column was investigated at the bed depth of 60 cm and the initial Cd(II) concentration of 100 mg/L. As shown in Fig. 2, with the flow rate increased, the slope of breakthrough curve steepened. When the flow rate ascended, both the exhaustion and breakthrough time were descended, the breakthrough time was 1550, 890, and 810 min at flow rate of 20, 30, and 40 mL/min, with corresponding exhaustion time of 4080, 2810, and 1570 min, respectively. This phenomenon was also caused by insufficient diffusion of Cd(II) at higher flow rate, leading to the exhaustion of the bed column ahead of equilibrium timepoint (Kumar et al., 2011; Zou et al., 2013). With the augment of flow rate (20 to 40 mL/min), the adsorption quantity also abated from 11.72 to 9.705 mg/g. In the study of dynamic cadmium adsorption by peat and mollusk shells, it was also found that the increase of flow rate shortened the contact time between adsorbent and cadmium ions, decreased the breakthrough time of the column, and the utilization efficiency of the biosorbents (Li and Champagne, 2009).
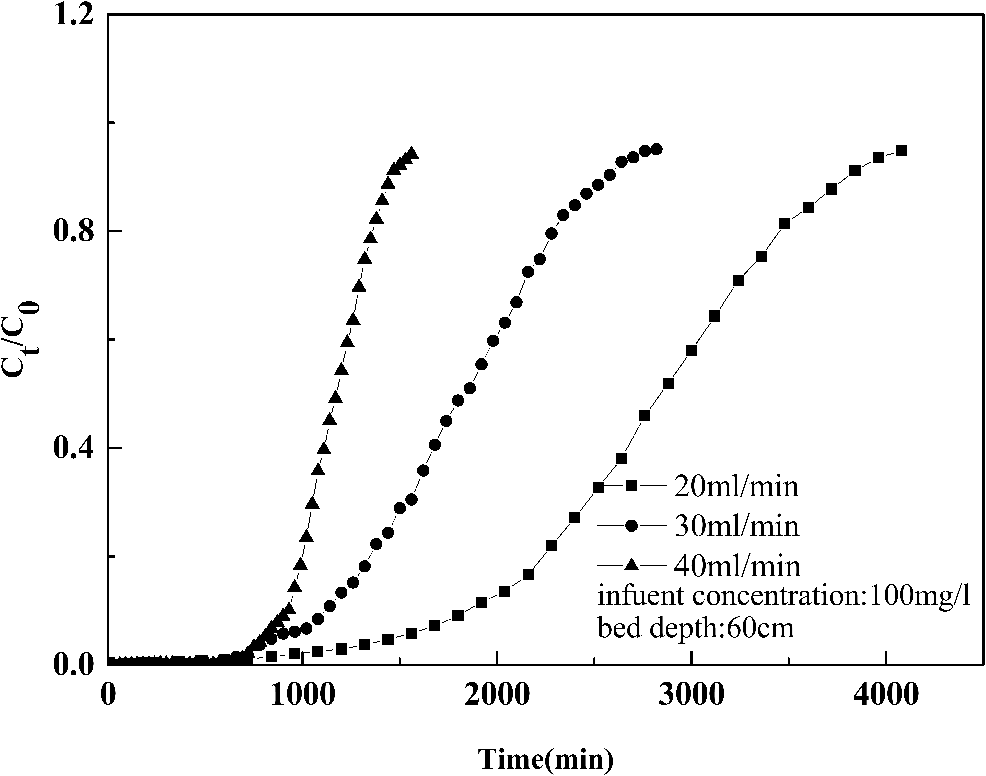
Effect of flow rate on breakthrough curve.
Effect of influent Cd(II) ion concentration
The variety in the influent Cd(II) concentration has a great impact on breakthrough curve. Figure 3 revealed the breakthrough curves at varying initial concentrations of 50, 100, and 200 mg/L, a given bed depth of 60 cm, and flow rate of 30 mL/min. As could be seen from the plot, the higher the initial Cd(II) concentration, the faster the breakthrough and exhaustion occurred. When the initial influent Cd(II) concentration was set to 50, 100, and 200 mg/L, respectively, the breakthrough time was 1080, 890, and 420 min. The exhaustion time also descended with the ascended in initial concentration from 3360 (50 mg/L), 2820 min (100 mg/L) to 1710 min (200 mg/L). The decrease in breakthrough and exhaustion time was assigned to a faster saturation of binding sites in the bed column system at higher initial Cd(II) concentration (Zümriye and Ferda, 2004). The breakthrough curve was sharper at higher Cd(II) concentration, which suggested intraparticle diffusion of the adsorbates controlled the adsorption process. Moreover, it was found that the adsorption quantity (6.646 mg/g at 50 mg/L, 11.22 mg/g at 100 mg/L, and 12.82 mg/g at 200 mg/L) increased with the increment of the initial Cd(II) concentration, because the higher Cd(II) concentration might give rise to greater driving force to surmount mass transfer resistance in the liquid phase (Chen et al., 2012). Rao et al. also found that the increase in initial concentration increased the adsorption quantity of the biosorbent (Rao et al., 2014). Although the adsorption quantity increases as the concentration increases, it is infeasible to blindly increase the initial concentration of the solution, because too high concentration may shorten the exhaustion time of the adsorption and decrease the regeneration rate of the biosorbent, which may correspondingly increase the operation cost. However, too low concentration is also undesirable, because it may increase the mass transfer resistance of the adsorption, prolong the length of the mass transfer zone, and decrease the utilization rate of the adsorbent (Chen et al., 2012). Therefore, a proper initial concentration is crucial to metallic ion adsorption under the conditions of high bed height and fast flow rate.

Effect of initial concentration on breakthrough curve.
Breakthrough curve modeling
Prediction of breakthrough curve is important to devise a continuous adsorption system; some simple mathematical models were developed to depict and analyze the laboratory-scale column studies (Gutiérrez-Segura et al., 2014). In this study, the parameters of the fixed-bed column for Cd(II) adsorption by ISSPO were evaluated by Adams–Bohart, Thomas, Yoon–Nelson, and Clark models.
Adams–Bohart model
This model is appropriate for analyzing the initial part of the breakthrough curve (Ct <0.15C0) (Bohart and Adams, 1920). It is initially used in gas–solid systems, and its overall method has been successfully used to quantitatively describe other systems. The expression of Adams–Bohart model is given as follows:
where Ct and C0 are the effluent and influent concentrations (mg/L), respectively, Z is the bed depth of column, N0 is the equilibrium concentration (mg/L), kAB is kinetic constant (L/mg min), and V0 is the surface velocity computed by dividing the cross-sectional velocity by the cross-sectional area of the column (cm/min).
Adams–Bohart model supposes that the adsorption equilibrium is not instantaneous (Jain et al., 2013). If we employ this model for low effluent concentrations (Ct <0.15C0), a considerable fitness in curve will be obtained. In this study, the fitted curve is presented in Fig. 4 and the kAB and N0 are given in Table 2. With the increase of flow rate, the initial concentration and bed depth decreased, and the value of kAB increased. The value of kAB increased from 0.019 × 10⁻³ to 0.075 × 10⁻³ with the flow rate increased from 20 to 40 mL/min. The results showed that the dynamics of the whole system was mainly controlled by external mass transfer in the initial stage of adsorption (Karimi et al., 2012). The correlation coefficients gained from Adams–Bohart model were all >0.97, indicating that Adams–Bohart model well described the cadmium-ISSPO adsorption system, which was consistent with the study of Kumar and Chakraborty (2009). They performed a fixed-bed column study to evaluate the properties of short-chain polymer polyaniline synthesized on the surface of jute fiber (PANI-jute) to remove hexavalent chromium Cr(VI). And the correlation coefficients gained from Adams–Bohart model were all >0.98, which was similar to the results of this experiment.
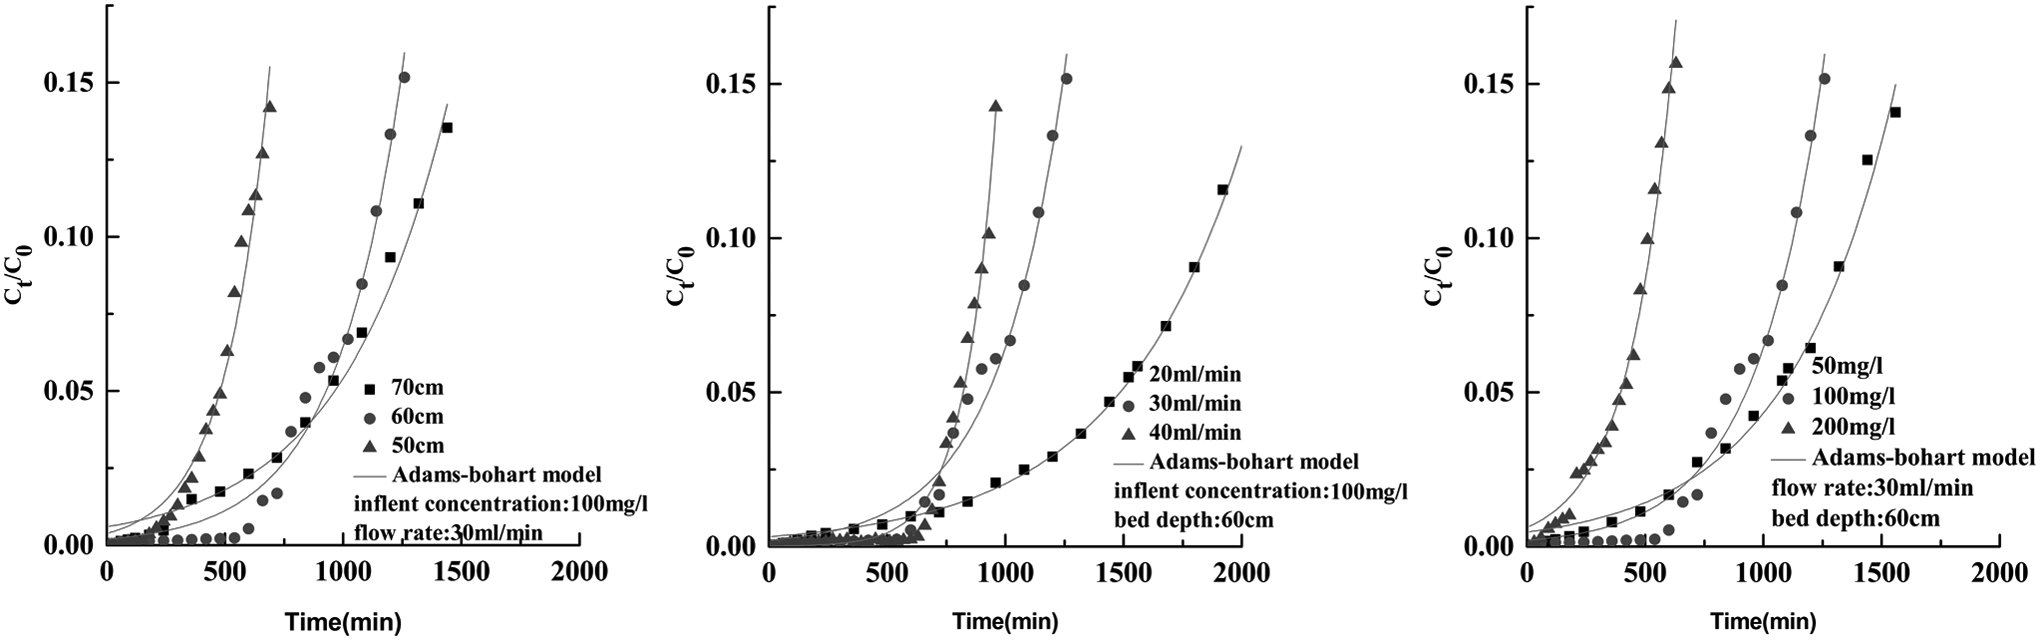
Adams–Bohart model plot.
Adams–Bohart Model Parameters
Thomas model
Nowadays, Thomas model has been widely used to describe the sorption process of fixed-bed columns (Thomas and Ann, 1948). It is expressed by the following equation:
where kTH stands for the Thomas model constant (L/min mg), t is the total flow time (min), and qTH stands for the adsorption quantity (mg/g).
Thomas model is on account of two hypotheses, one is Langmuir kinetics with no axial dispersion of adsorption–desorption, and the other is that the rate of driving force produced in the adsorption process follows the second-order reversible reaction kinetics (Kumar and Chakraborty, 2009). The fitted curve is shown in Fig. 5, and the relative constants and coefficients obtained according to Equation (4) are presented in Table 1. It was clear that the KTH increased with the increasing flow rate, but decreased as the initial influent concentration and bed depth increased. Meanwhile, the results showed that the adsorption quantity increased with the increase of bed depth and initial concentration, and decreased with the increase of flow rate. And qe obtained from each adsorption experiment was near to qTH calculated by Thomas model. Obviously, a higher influent concentration and bed depth bring about a better adsorption for Cd(II) by ISSPO column, which was owing to the driving force in the adsorption process caused by the difference of influent concentration (Paudyal et al., 2013; Nguyen et al., 2015). The R2 values of Thomas model obtained at different adsorption parameters maintained >0.9986, indicating that the experimental data were good fitness in Thomas model, and the adsorption process followed Langmuir isotherm and second-order kinetics.
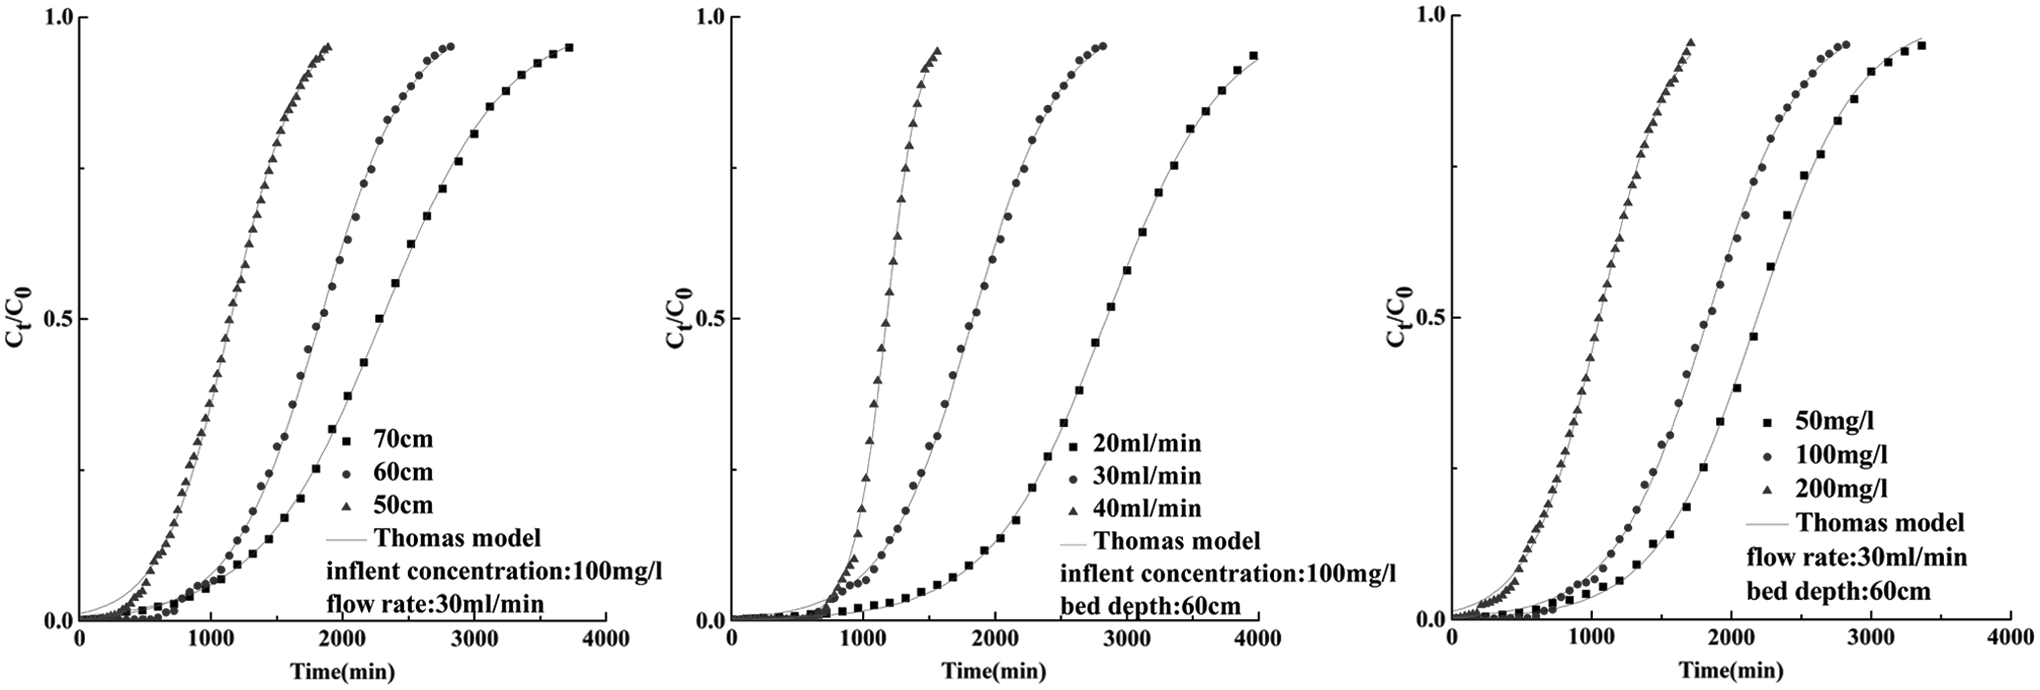
Thomas model plot.
The results indicated that the Thomas model well reflected Cd(II) adsorption by ISSPO in the fixed-bed column system (Dima et al., 2015). Similar adsorption trends in column adsorption have also been reported in other researchers' reports (Baral et al., 2009; Han et al., 2009).
Yoon–Nelson model
Yoon–Nelson model can be fitted without the fixed-bed characteristics such as bed height and adsorption flow rate, and its form is simple (Yoon and Nelson, 1984). The model is described by the following equation:
where τ is the time required to maintain a 50% initial adsorbate adsorption breakthrough, and kYN is the Yoon and Nelson's proportionality constant.
Because of the symmetry property of the breakthrough curve, the adsorption quantity of Cd(II) adsorbed by adsorbent (qYN) is half of the total amount of Cd(II) entering the adsorption column in 2τ period. Therefore, qYN is reckoned by the following equation:
The fitted curve is shown in Fig. 6 and values of kYN and τ obtained according to the Equation (6) are listed in Table 3. The values of R2 (>0.9856) made clear that Yoon–Nelson model could well represent this Cd(II)-ISSPO system. The value of kYN decreased with the increased of bed depth, initial concentration and flow rate, whereas the values of τ increased with increasing bed depth and decreased with the increasing flow rate. The values of τ increased with the decrease of the initial concentration due to the quicker equilibrium of adsorption within the column (Calero et al., 2009). kYN increased with the initial concentration increase, because the rise in initial concentration accelerated the competition between the sorbate species for the sorption sites, which finally resulted in a higher retention rate (Malkoc et al., 2006). The value of τ decreased as Cd(II) concentration decreased more rapidly due to column saturation. These results resembled to those obtained by other researchers in different adsorption systems (Chen et al., 2012; Sharma and Singh, 2013). The agreement between the calculated and the experimental adsorption quantity was poorer in Yoon–Nelson model compared with that in Thomas model.
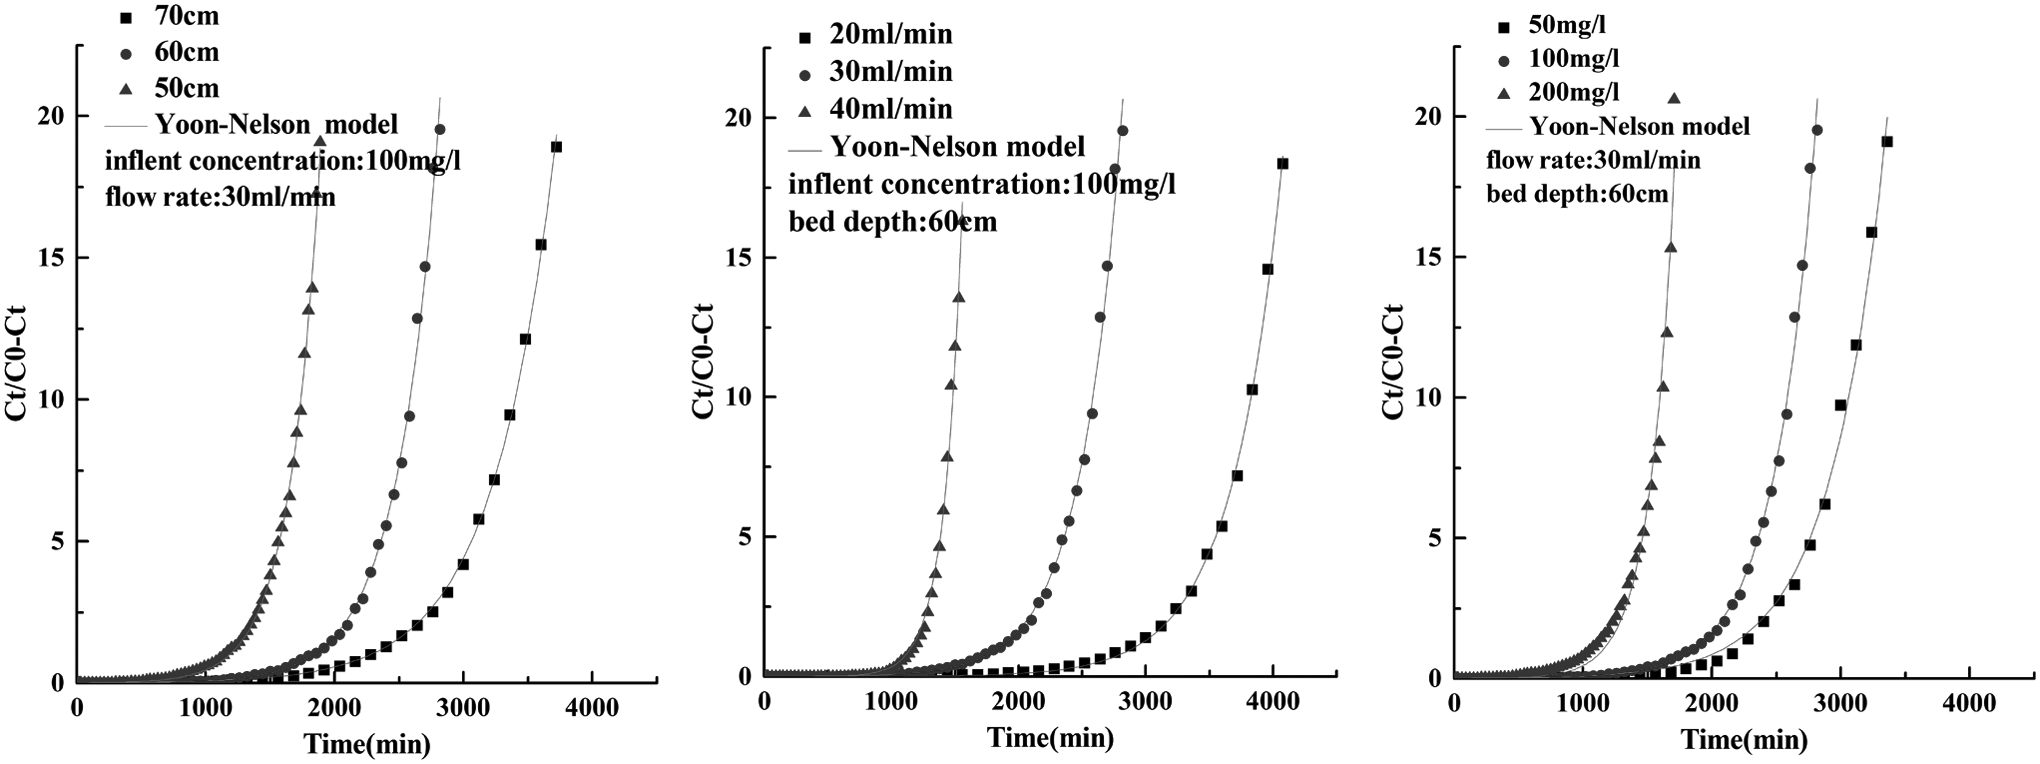
Yoon–Nelson model plot.
Parameters of Yoon–Nelson Model
Clark model
Clark model is established in the light of Freundlich equation (Clark, 1987). The foundational equation is expressed as follows:
where A and r are both Clark constants, n is the Freundlich constant.
A and r can be derived by Equation (7). The value of 1/n (0.813) determined in our previous study according to Freundlich model at 298 K was applied to count the parameters of Clark model.
The parameters of Clark model, including A, r, and n, are given in Table 4. The fitted curve is shown in Fig. 7. As could be seen in Table 4, the influence of bed depth, flow rate, and initial Cd(II) concentration on the values of kinetic constants were very obvious. The values of r descended when the bed depth ascended. Obviously, a higher bed depth of the column could accommodate more adsorbents, which might reduce the mass transfer of the adsorbates between adsorbent particles. However, the values of r rose with the increment of influent flow rate, because a higher flow rate might shorten the diffusion distance of adsorbates to adsorbent particles through the stationary layer of water. Moreover, the values of r also increased with the ascending initial Cd(II) concentration. It might be owing to the increase in driving force caused by elevated initial concentration (Aksu and Gonen, 2004). Higher R2 values (r = 0.9985 to 0.9998) indicated that the Clark model provided a corresponding good correlation.
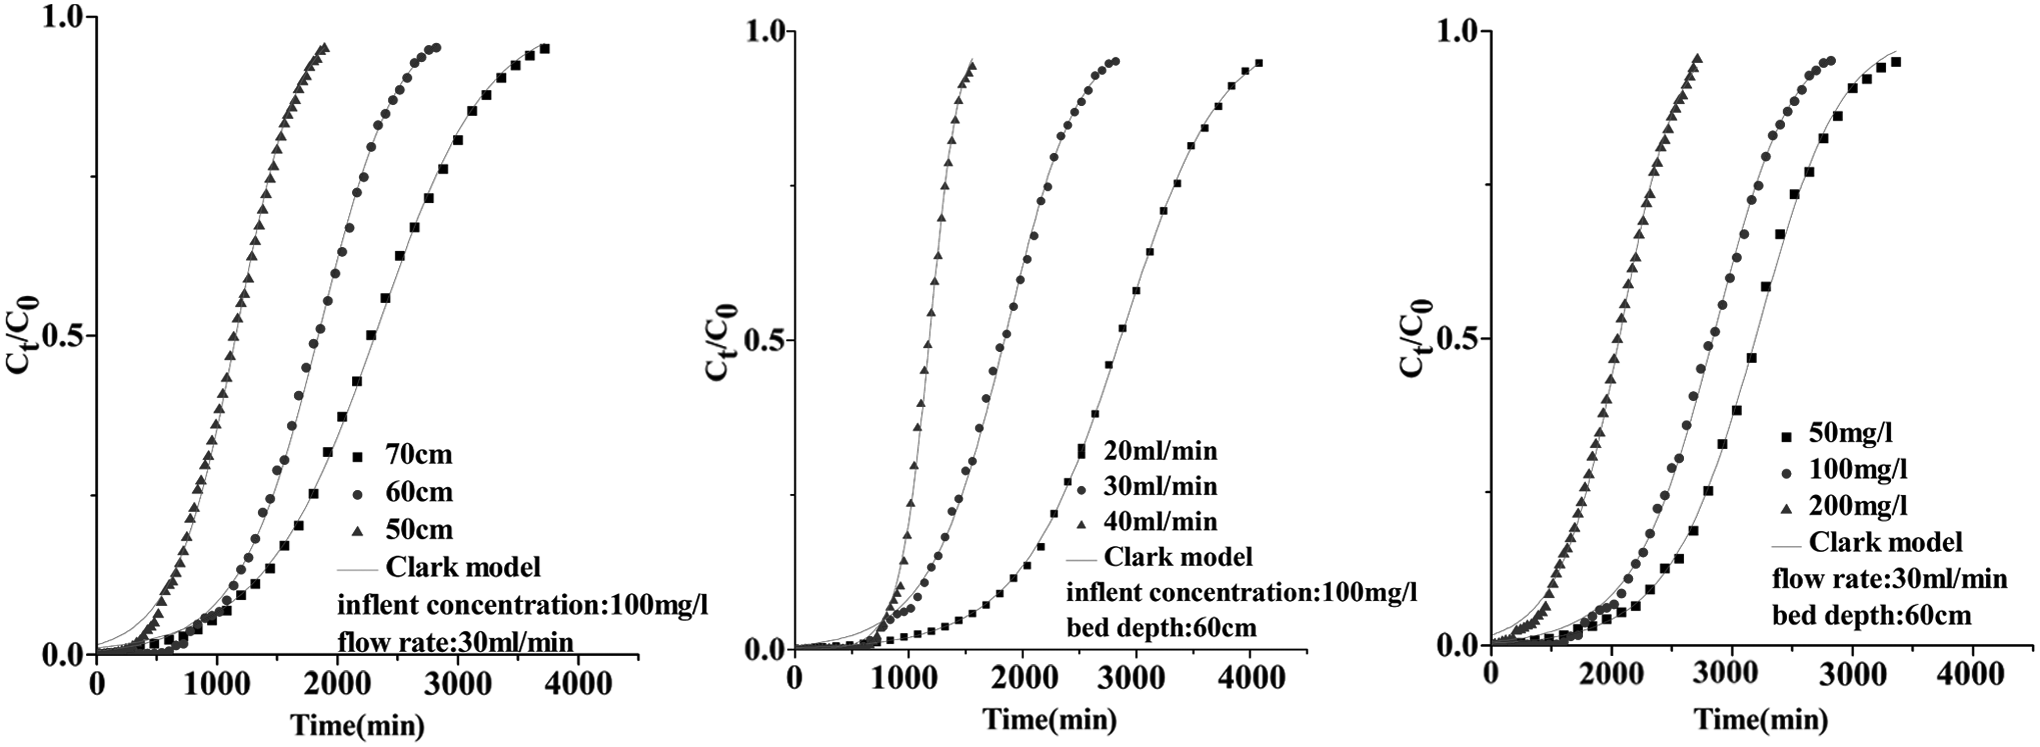
Clark model plot.
Parameters of Clark Model
Conclusions
It was concluded that the breakthrough and exhaustion time increased with the increase of bed depth, as well as the decrease of flow rate and the decrease of initial influent concentration. The adsorption quantity increased with the decreasing flow rate and increasing bed depth and initial concentration. Thomas model was good fitness for the experimental data than Yoon–Nelson, Adams–Bohart, and Clark models at diverse depth, flow rate, and influent concentration, which indicated that the external and internal diffusions was not the bottleneck of the process. The value of qTH estimated from the Thomas model was close to the data from this experiment.
Footnotes
Acknowledgment
This study was supported by the research project of National Key Research Project of China (Grant No. 2017YFD0801104).
Author Disclosure Statement
No competing financial interests exist.