
Abstract
Abstract
Recent literature suggests that intestinal microbiome may play a mediating role between aflatoxin exposure and the height-for-age of children. We tested the hypothesis that among children in Guatemala, aflatoxin exposure was associated with intestinal microbiome dysbiosis and lower height-for-age. De-identified data were acquired from local health officials for 35 children who attended a health clinic in Totonicapán, Guatemala, and had potentially been exposed to aflatoxin through their maize-based food supply. Microbial differences were assessed for children grouped by height, diarrhea, age, and aflatoxin exposure. Furthermore, two subgroups were identified—one healthy (n = 12) and one unhealthy/dysbiotic (n = 9)—based upon clustering of the children's microbiomes and morbidity data. Odds ratios were computed to assess the likelihood of a child having a healthy or dysbiotic microbiome based on the classification of height, diarrhea, age, or aflatoxin exposure. The results of the study supported significant differences in beta diversity between the intestinal microbiomes of children who were shorter (less than or equal to −2.54 standard deviation; SD) versus taller (greater than −2.54 SD), those who were older (>14 months of age) versus younger (<14 months of age), and those that had reported diarrhea in the past 2 weeks versus not. Most importantly, children whose aflatoxin-contaminated diet resulted in the consumption of >10 ng of aflatoxin/kg of body weight/day had 24 times higher odds of having a dysbiotic intestinal microbiome. The results build upon available literature and support the need for more in-depth studies concerning the interactions among aflatoxin exposure, the intestinal microbiome, and child stunting.
Introduction
Poor child growth, gauged by the height-for-age ratio of the child, is an important health metric and a primary outcome indicator for Sustainable Development Goal 2.2 (United Nations General Assembly, 2015). Child stunting, defined as a child having a height-for-age z-score (cm/mo) less than −2 standard deviations (SDs) below the World Health Organization (WHO) global average (World Health Organization, 2010; Perumal et al., 2018), has been associated with increased morbidity and mortality and, most importantly, decreased cognitive function during childhood and adulthood (Alderman et al., 2006; Dewey and Begum, 2011).
Purported environmental determinants of chronically low height-for-age ratios are numerous, dynamic, and country specific. Generally, they include maternal health, diet, morbidity, and biological exposures (Esrey, 1996; Black et al., 2013; Solomons et al., 2014; Wild et al., 2016). However, recent articles and meta-analyses—including water, sanitation, hygiene (WaSH) (Gera et al., 2018; Humphrey, 2018; Stewart et al., 2018b), and diet/nutrition (Bhutta et al., 2013)—have concluded that individual interventions within these areas have had limited impact on improving child growth.
Research on the relationship between child growth and intestinal health has had two primary foci: functioning of the intestines (Syed et al., 2016; Harper et al., 2018) and the intestinal microbiome (Kane et al., 2015). Numerous mechanisms have been hypothesized about intestinal functionality, but little is known about the interaction among shifts in the intestinal microbiome, environmental exposures, and child growth. What is known is that the intestinal microbiome continually evolves over the first 3 years after a child is born, when it becomes similar to adult microbiomes (Stewart et al., 2018a).
Developmental milestones that can influence microbiome development include infant–child mobility, breastfeeding practices, and complementary solid food diet (Lim et al., 2016). Furthermore, factors that are associated with an unhealthy microbiome include diarrhea, subclinical infections, and antibiotic usage (Lim et al., 2016; Robertson et al., 2019), each having effects for varying lengths of time on the microbiome. For example, it has been reported that diarrhea can affect the microbiome for at least 2 weeks postinfection (Becker-Dreps et al., 2015). Important here is that these effects or negative shifts to the microbiome, that is, dysbiosis of the microbiome, have been correlated with the height-for-age ratios of children in numerous countries (Robertson et al., 2019).
No studies have been published on the effects of aflatoxins—fungal toxins and contributors to poor child growth—on the intestinal microbiome of children (Liew and Mohd-Redzwan, 2018). Aflatoxins are a type of mycotoxin produced by the fungi Aspergillus flavus and Aspergillus parasiticus. Aflatoxins are found on maize, sorghum, peanuts, and other groundnuts (Wu et al., 2014). Aflatoxin B1 has been classified as a class 1 carcinogen by the International Agency for Research on Cancer (IARC) because of its association with liver cancer (International Agency for Research on Cancer, 2006).
A recent IARC report reviewed available animal and human studies on the link between aflatoxin exposure and child growth; it concluded that evidence was enough to warrant concern and further investigation (Wild et al., 2016). Limited evidence suggests that aflatoxin exposure solicits an inflammatory response along the intestinal wall, reducing intestine functionality (Wild et al., 2016; Hoffmann et al., 2018), but little is known about the impact of aflatoxin on the intestinal microbiome.
Based on our review of the literature, aflatoxins can affect intestinal functionality. The interaction between aflatoxin exposure (specifically aflatoxin B1) and intestinal functionality may include upregulation of cytokines (including increased levels of interleukin 1 [IL-1] and IL-6) and a general increase in T and B cell presence, suggesting some type of inflammatory response of the intestine (Wild et al., 2016).
Initial evidence from animal studies also suggests that aflatoxin exposure may affect the intestinal microbiome (Liew and Mohd-Redzwan, 2018). Liew and Mohd-Redzwan (2018) reviewed evidence for the full set of harmful mycotoxins (aflatoxins, ochratoxins, zearalenone, fumonisins, and trichothecenes) on their interaction with the intestinal microbiome. However, they concluded that, although aflatoxin exposure is of concern (based on limited existing evidence from animal studies and mechanisms identified in vitro), research specifically on the effects of aflatoxin exposure to the microbiome is limited.
Although no human- or child-specific studies have been conducted, available studies included two rat (Wang et al., 2016; Liew et al., 2019) full-microbiome analyses and two broiler (Kubena et al., 2001; Galarza-Seeber et al., 2016) microbiota characteristic analyses.
Wang et al. (2016) conducted an exploratory dosing study (control, 5, 25, and 75 μg AFB1/kg of body weight) on male rats and reported the presence of a dose-dependent relationship between aflatoxin exposure and alterations/dysbiosis of the microbiome. Rat microbiomes grouped at specific dosing levels: doses increased phylogenetic diversity, and lactic acid bacteria significantly decreased (Wang et al., 2016). Liew et al. (2019) assessed three groups of rats (control, AFB1 exposed, and AFB1+probiotic) and found significant differences in beta-diversity scores between control and AFB1-exposed groups including a decrease in the Prevotella genus among AFB1-exposed rats.
Trends were less clear among the two broiler studies, where Galarza-Seeber et al. (2016) found that increasing doses (control, 1, 1.5, and 2 ppm of AFB1) increased overall plate counts of total aerobic bacteria, total Gram-negative bacteria, and total lactic acid bacteria, but total lactic acid bacteria were reduced at a 1 ppm dose, compared with a control group. Kubena et al. (2001) identified a significant increase in total volatile fatty acids in broiler intestines exposed to 2.5 and 7.5 ppm of AFB1, compared with control groups. However, numerous studies on mycotoxins associated with co-occurrence of aflatoxins (e.g., fumonisin and T-2 toxins) suggest similar trends of reduced microbial diversity and increased susceptibility to infections (Liew and Mohd-Redzwan, 2018; Mateos et al., 2018).
Several publications propose hypotheses for specific aflatoxin–microbiome interactions within humans. Du et al. (2017) suggested that the dysbiosis of the microbiome caused by aflatoxin exposure reduced metabolism and, therefore, nutrient absorption. Furthermore, they highlighted that aflatoxins have antimicrobial properties that can attack specific microbial communities in the microbiome (e.g., Escherichia coli, Bacillus subtilis, and Enterobacter aerogenes).
The Malnutrition and Enteric Disease (MAL-ED) multinational study found worrying levels of aflatoxins among children in several Southeast Asian countries. Although aflatoxin was not significantly correlated with growth or intestinal functionality markers (Mitchell et al., 2017), the authors suggested further investigation of the intestinal microbiome. Finally, the Sanitation Hygiene Infant Nutrition Efficacy (SHINE) trial proposed to investigate the interaction between mycotoxin exposure (aflatoxin, fumonisin, and deoxynivalenol) on outcomes of environmental enteric dysfunction and alterations in the insulin-like growth factor 1 (Gough et al., 2015).
Guatemala provides an important case study to investigate the link between aflatoxin exposure and child growth. The most recent data suggest that 46.5% of Guatemalan children less than 5 years of age are stunted; the average height-for-age z-score ratio among this population was −1.90 SD (Ministerio de Salud Pública y Asistencia Social (MSPAS) et al., 2017).
Furthermore, the influence of the Mayan culture, especially within the western part of Guatemala, emphasizes the use of maize as the staple food, with 70% of food in this region being maize based (Immink and Alarcon, 1991; Fuentes Lopez et al., 2005). Although this reliance on maize may limit nutrient consumption, that impact can be compounded by dangerously high levels of aflatoxin found within the maize supply of Guatemala [San Marcos markets: mean = 26 ng/g, range = 0–158 ng/g; Totonicapán markets: mean = 13 ng/g, range = 0–88 ng/g (Torres et al., 2015)].
We conducted a pilot field study among children in Guatemala. The primary hypotheses tested were as follows: (1) exposure to aflatoxin by maize consumption is associated with dysbiosis of the intestinal microbiome among children, (2) reported diarrhea in the 2 weeks before sample collection is associated with the dysbiosis of the intestinal microbiome among children, and (3) dysbiosis of the intestinal microbiome is associated with poor growth outcomes among children as measured by the height-for-age ratio.
Experimental Protocols
We conducted a literature review to identify factors to be included in the pilot study. These factors include dietary aflatoxin, recent diarrheal episodes, age, height-for-age, development milestones, prenatal health factors, and dietary diversity. Then, we acquired de-identified data from local health officials and analyzed them quantitatively. Supplementary Fig. S1 gives the workflow for this project.
Location of field study
De-identified data were obtained from local health officials in villages near San Vicente Buenabaj, Totonicapan, Guatemala (15 1′33.20N, 91 35′1.99W). The terrain is mountainous, with an average elevation of 2780 m and a yearly average variation in temperature between 5.1°C and 17.0°C. The most common type of work is subsistence farming of maize. The local culture is Mayan, and the primary language is Quiche, with Spanish as the secondary language. This site was selected based on the high prevalence of aflatoxin in maize (Torres et al., 2015; Voth-Gaeddert et al., 2019) and child stunting, along with the ability to obtain data.
Data collection
Data were collected and de-identified by local health officials within the context of the clinic's services to the local population (local approval was obtained from the department of health while Institutional Review Board exemption was obtained from Missouri University of Science and Technology for researchers to analyze the de-identified data). Three mechanisms were used by local health officials to obtain data: (1) a survey and anthropometric measurements of height, weight, and age, (2) grab samples of household maize, and (3) stool samples. Each dataset was de-identified by the local health clinic and each child was given a unique identifier number. Requests for specific data were submitted by the researchers to the local health clinic and the unique identifier number was used to correlate data from the different datasets (e.g., stool samples to diet).
The health survey was previously developed and validated for this region (Voth-Gaeddert et al., 2018a, 2018b). It was verbally conducted, one-on-one, with mothers of children less than 60 months of age in their local language through a translator. Data collected included child and maternal morbidity information (including occurrence of diarrhea within the past 2 weeks), a 24-h dietary recall, prenatal health, breastfeeding practices, demographic and economic information, and WaSH-related information. In addition, the child's height and weight were taken following WHO guidelines (World Health Organization, 2008).
Maize samples were collected to test and calculate a putative aflatoxin exposure level for each child. This method, its validity, and limitations are described elsewhere (Voth-Gaeddert et al., 2018b). In brief, three, 8-ounce grab samples were collected from the top, middle, and bottom sections of each household's maize stock allocated for same-day consumption. The maize samples were collected in a paper bag, placed in a cooler, and immediately shipped to Guatemala City for laboratory testing. Additional information collected included a 24-h dietary recall (including a specific focus on maize-based products), and observation of household maize stock by trained professionals (assessing fungal presence and insect damage).
The maize samples were tested for total aflatoxin levels (aflatoxin B1, B2, G1, G2) using the U.S. Department of Agriculture-approved Veratox for Aflatoxin kit. This total aflatoxin concentration (aflatoxin per maize quantity), along with the total quantity of maize consumed by the child (calculated from the 24-h dietary recall) and the child's weight, were used to calculate a putative aflatoxin exposure level (ng of total aflatoxin (AF)/kg of child body weight (bw)/day).
Stool samples were collected following the protocol utilized by the MAL-ED and SHINE consortiums (Miller, 2014; Gough et al., 2015). In brief, upon defecation into a provided sanitary diaper, health workers collected and transferred the stool sample to a 100 mL sterile collection tube, placed the tube on ice immediately, and transferred the sample on dry ice to a laboratory in Guatemala City within 24 h of collection. Samples were stored at −20°C until DNA extraction and further processing.
Sample processing and sequencing
All collected data were immediately de-identified by local health officials before being sent for processing; only the health officials retained the identifier key. Maize processing and testing for total aflatoxin are described elsewhere (Voth-Gaeddert et al., 2018b). Processing of stool samples was conducted in two steps. First, stool samples were thawed and prepped for DNA extraction, which was conducted using the Qiagen PowerSoil DNA extraction kit according to the manufacturer's instructions (Qiagen, 2016). Upon completion of extraction for all stool samples, the DNA extracts were sent on dry ice from Guatemala City to the Microbiome Analysis Laboratory (http://krajmalnik.environmentalbiotechnology.org/microbiome-lab.html, Biodesign Swette Center for Environmental Biotechnology, Arizona State University, Tempe).
16S rRNA gene sequencing was carried out at the Arizona State University Genomics Core. Amplicon sequencing of the V4 region of the 16S rRNA gene was performed with the barcoded primer set 515f/806r designed by Caporaso et al. (2012) and following the protocol by the Earth Microbiome Project (EMP) (www.earthmicrobiome.org/emp-standard-protocols) for the library preparation. PCR amplifications for each sample were carried out in triplicate, then pooled and quantified using Quant-iT™ PicoGreen® dsDNA Assay Kit (Invitrogen). Two hundred forty nanograms of DNA per sample was pooled and then cleaned using QIA quick PCR purification kit (QIAGEN).
The PCR pool was quantified by Illumina library Quantification Kit ABI Prism® (Kapa Biosystems). DNA pool was determined and diluted to a final concentration of 4 nM then denatured diluted to a final concentration of 4 pM with a 30% of PhiX. Finally, the DNA library was loaded in the MiSeq Illumina sequencer using the chemistry version 2 (2 × 150 paired-end) and following the directions of the manufacturer. Sequencing output in fastq format and metadata was uploaded to MG-RAST and is available on the MG-RAST server (www.mg-rast.org/linkin.cgi?project=mgp84772).
Bioinformatic and statistical analyses
Generated paired-end fastq files were merged and filtered in Usearch8.1 for each sample (Edgar, 2010). Operational taxonomic units (OTUs; min size = 2) were generated at an identification of 97% using Usearch8.1. Data were then imported into QIIME 1.9 (Caporaso et al., 2010) to assign taxonomies to OTUs (using uclust and Greengenes), align sequences, filter aligned sequences, generate the phylogenetic tree, filter OTUs from the OTU table, add metadata, and convert to a biom file. The general script is included in the Supplementary Data.
Alpha and beta diversities were computed utilizing the alpha- and beta-diversity commands within QIIME 1.9. Alpha diversity is used to assess the diversity of OTUs within a single group. Beta diversity is used to assess if the diversity (i.e., the total number of unique OTUs) of microbial communities within one group is statistically different from the diversity of the microbial communities in a second group of children. Both weighted and unweight Unifrac distances were used for the computation. The random sampling depth was set to the total number of reads for the smallest sample (∼20,000) (Jovel et al., 2016).
From this, the beta-diversity analysis was conducted for height (less than −2.54 vs. greater than or equal to −2.54), diarrheal occurrence (occurred in past 2 weeks vs. no), aflatoxin exposure (>10 ng AF/kg of child bw/day), and age (≥14 months of age). Relative abundance files for each of the above-listed factors generated in QIIME 1.9 were uploaded to the Huttenhower Galaxy website to conduct a linear discriminant analysis effect size (LEfSe) using default parameters (alpha = 0.05, threshold = 2.0) to generate a set of Cladograms of differentially abundant taxa for the four factors listed previously (Segata et al., 2011).
Heatmap and principal coordinate analysis (PCoA) plots were generated to identify unique subgroupings. The heatmap was generated in QIIME 1.9 with no grouping defined. The raw unmerged fastq data were also uploaded to MG-RAST (Meyer et al., 2008) as a general quality check of the QIIME 1.9 outputs. In addition, six principal coordinate analysis (PCoA) plots were generated within MG-RAST using six distance metrics (Weight Unifrac, Unweighted Unifrac, Bray–Curtis, Euclidean, Manhattan, Pearson). The heatmap and PCoA plots were visually inspected by two experts, independently to identify potential subgroupings.
Upon agreement of two microbiome subgroupings, the survey data for these children were assessed. Variables investigated from the survey data included diarrheal occurrence, height-for-age z-score, being short (less than −2.54 SD), weight-for-height z-score (SD), aflatoxin exposure level, high aflatoxin exposure (>10 ng of AF/kg of child bw/day), prenatal health index, and number of times the child played on the ground the previous day. Of the two microbiome subgroupings, all investigated variables of one subgroup were healthier than average (and was termed the healthy subgroup), whereas all investigated variables of the other subgrouping were less healthy than the average (and was termed the unhealthy subgroup).
Odds ratios were computed for five factors (height, diarrheal occurrence, aflatoxin exposure, age, and diet diversity) to assess the likelihood of a child with a specific exposure or characteristic being in the healthy or unhealthy subgroup. For example, to compute the odds ratio for diarrheal occurrence, the ratio of children who had diarrhea and a dysbiotic microbiome to children who had diarrhea and a healthy microbiome was divided by the ratio of children who did not have diarrhea and a dysbiotic microbiome to children who did not have diarrhea and a healthy microbiome. Confidence intervals were then generated. R 3.4.1 was utilized for this calculation and further reading on odds ratio methods can be found in Daniel and Cross (2013).
Finally, beta diversity and OTU significant differences were computed to compare the two subgroups' microbiomes. OTU differences were compared with the rat dosing study (Wang et al., 2016). A bloom/die-off analysis and an LEfSe cladogram were generated and are presented in the Supplementary Data.
Results and Discussion
Descriptive statistics
Table 1 gives the descriptive statistics for the 35 children: 20 boys, 14 girls, 1 unreported, and the age range was between 1 and 39 months. The mean height-for-age z-score ratio was −2.35 SD (95% CI = −2.90 to −1.81; median was −2.54 SD), and the mean weight-for-height (kg/cm) z-score ratio was 0.80 SD (95% CI = 0.21–1.40). Nine children (26%) had at least one diarrheal occurrence (≥3 loose stools in 1 day) in the preceding 2 weeks to sample collection (a potential limitation is that diarrhea recalls of this length of time can result in reduced accuracy, but the question used was from the locally adapted and validated Demographic and Health Survey program).
Descriptive Statistics of the Sample Population, n = 35
Value selected based on median.
Based on Gong et al. (2016).
Defined by USAID/FANTA (Swindale and Bilinsky, 2006).
AF, aflatoxin; CI, confidence interval; NA, not available; SD, standard deviation.
The mean putative total aflatoxin exposure of children was 34 ng of AF/kg of child bw/day (95% CI = 3.9–64). The dietary structures of households, based on the 24 h dietary recall, were consistent among the population: 95% were breastfed for at least 4 months of age, all children who were weaned or being introduced to complementary foods consumed maize, 90% of children consumed beans, and 90% of children consumed some form of sugar or sweets as their staple diet.
Data on antibiotic usage were not reported, but antibiotic use among children in Guatemala most often occurs in response to an intestinal or respiratory infection (Ramay et al., 2015; Rogawski et al., 2017). Three children reported to have had respiratory infections, but not diarrhea in the 2 weeks before sample collection (increasing their chance of potential usage of antibiotics not related to diarrhea). Finally, 43% of children <14 months of age reported having played on the ground five times or more the previous day, compared with 83% of children ≥14 months of age.
Figure 1 gives the height-for-age z-score ratios plotted versus age in months. Although two data points are potential outliers, two trends are clear. One, children in this cohort were systematically shorter than global averages (the global average being 0.00). This is consistent with previous reports that stunting is endemic in Guatemala (Ministerio de Salud Pública y Asistencia Social (MSPAS) et al., 2017). Two, the height-for-age ratios decreased as children became older, meaning that the children became relatively more stunted over time.
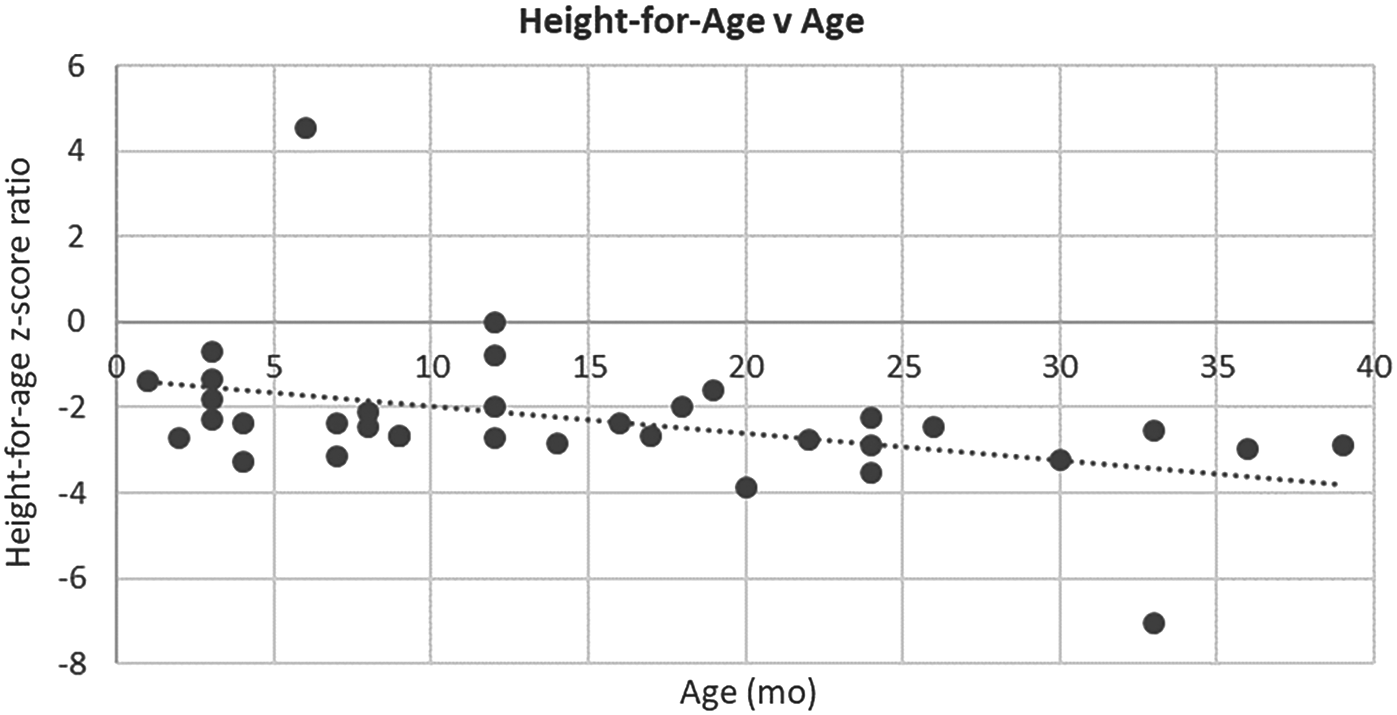
Height-for-age Z-score ratio versus age in months. Slope = −0.06; R2 = 0.18; p = 0.01 (removing potential outliers (>4, < −6); Slope = −0.03; R2 = 0.17; p = 0.02).
Furthermore, Supplementary Fig. S2 depicts intestinal microbial abundance versus child age for the four most abundant phylum taxonomic groups (Actinobacteria, Bacteroidetes, Firmicutes, and Proteobacteria). Tall and short children are denoted, and trend lines are graphed for each. Seven of the 8 trend lines support previous work by Dinh et al. (2016), who assessed 20 Indian children (half were clinically stunted) followed for 24 months with fecal sampling every 3 months (Dinh et al., 2016). In both studies, Actinobacteria and Proteobacteria decreased among older children, whereas Bacteroidetes and Firmicutes increased. However, Bacteroidetes increased among shorter children in our study, counter to Dinh et al. (2016).
In addition, Firmicutes (50.4%) were the dominate phyla within our children followed by Actinobacteria (19.6%), Bacteroidetes (16.3%), and Proteobacteria (13.1%). This follows trends identified in Sweden (Backhed et al., 2015) and Canada (Azad et al., 2013), as opposed to the Firmicute and Proteobacteria dominated microbiomes in India from Dinh et al. (2016) or the Bacteroidetes and Actinobacteria dominate microbiomes in Burkina Faso (De Filippo et al., 2010).
Diversity analysis by factor
Table 2 gives the results of weighted (accounting for abundance of OTUs) and unweighted (only presence–absence of OTUs) Unifrac-based beta diversity for the four primary factors of interest: height (</≥ −2.54 SD), diarrheal occurrence (yes/no), aflatoxin exposure (≤/>10 ng of AF/kg of child bw/day), and age (</≥14 months of age). When grouped by height or age, children exhibited significant difference in the microbiomes based on weighted and unweighted Unifrac distances. Grouping by diarrheal occurrence led to significant differences in the microbiomes for the unweighted Unifrac distance only. Unweighted Unifrac analysis allows us to address the contribution of taxa in lower abundance.
Weighted and Unweighted Unifrac Beta-Diversity Significance Tests by Factor
Bolded values denote p-values <0.05.
Samples within one group versus samples compared across groups.
Samples within one group versus samples within the other group. Groups included height (short = less than −2.54 SD, tall = greater than −2.54), diarrhea (yes = occurred in previous 2 weeks, no = did not occur in previous 2 weeks), aflatoxin exposure (high = >10 μg/kg of child bw/day, low = ≤10 μg/kg of child bw/day), and age (old = >14 months, young = ≤14 months). Unweighted is presence–absence of all OTUs. Weighted includes abundance values for all OTUs. p-value is nonparametric. The two-sided Student's two-sample t-test with 999 permutations was used for the beta-diversity significance test.
These results suggest significant differences in microbial community composition related to height, diarrheal occurrence, and age. Although this does not prove that the significantly different microbiomes of short children were unhealthy, it provides initial evidence to support the hypothesis that stunting was associated with dysbiosis of the intestinal microbiome. In the same vein, the results also support the hypothesis that diarrheal occurrence was associated with dysbiosis of the intestinal microbiome. Finally, the results support previous literature that the microbiome significantly differs by age and developmentally, it can be split at 14 months of age (Stewart et al., 2018a). The fact that unweighted Unifrac led to significant differences in the microbiomes suggests that differences in height, diarrhea, and age are potentially driven by lower abundance taxa.
We also separated children according to age [two groups: older, ≥14 months of age (n = 16), and younger, <14 months of age (n = 19)], recomputed the alpha and beta diversities, and evaluated the diversities against height, diarrheal occurrence, and aflatoxin exposure. The microbiomes of older children (≥14 months of age) grouped by height (tall vs. short) were the only factor having significant differences in intestinal microbial community composition. These differences are depicted in box plots in Fig. 2.
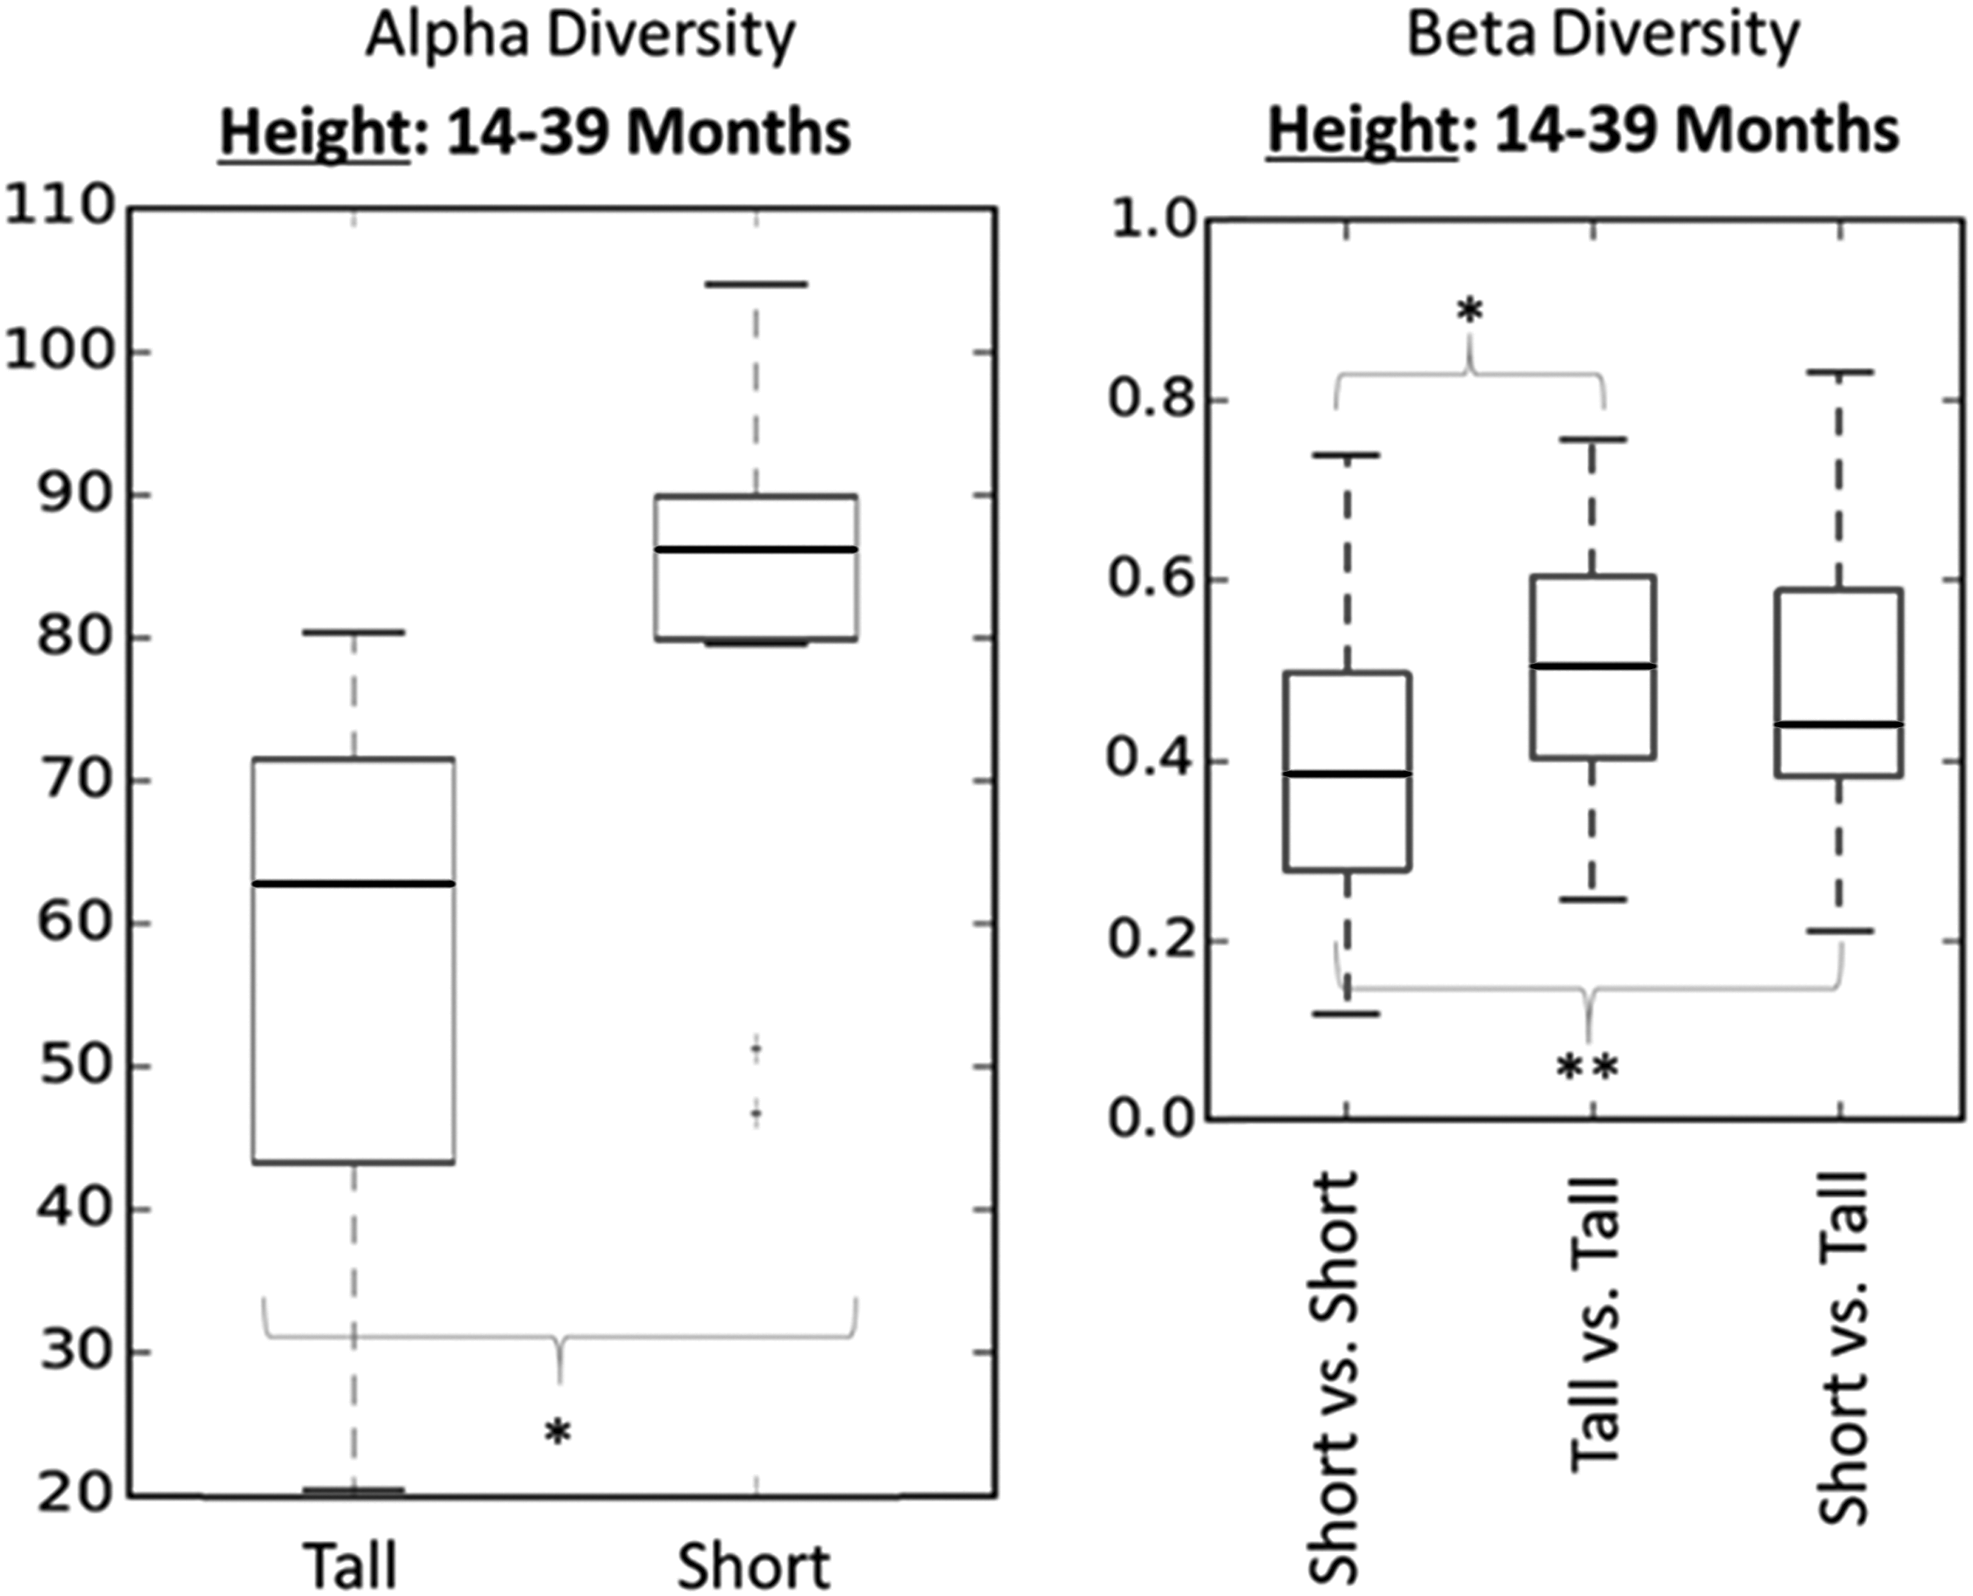
Older children age group (≥14 months of age) comparison of tall (greater than −2.54 SD) and short (less than or equal to −2.54 SD) children's microbiomes. The only significant difference identified when children were grouped by age. The alpha-diversity index used was Observed OTUs. Beta-diversity significance test was conducted using the two-sided Student's two-sample t-test with 999 permutations. Significance denoted by *p < 0.05, **p < 0.01. OTU, operational taxonomic unit.
The alpha-diversity plot shows ranges of microbial diversity grouped by height. The beta-diversity plot shows ranges of similarity (or distance) values (1) within the group of short children, (2) within the group of tall children, and (3) between the group of short children and the group of tall children. Significant differences between tall and short children were found for alpha- and beta-diversity values. Again, although this does not prove that the significantly different microbiomes of short older children were unhealthy, it provides additional evidence that the association between a child's height and the diversity of their microbiome is more distinct after 14 months.
Significant microbial differences by factor
Figure 3 and Supplementary Figs. S3, S4, S5 are cladograms of taxa that drive the overall differences seen when the children were grouped by factor (height, diarrheal occurrence, aflatoxin exposure, or age). All four factors were associated with unique and significant differences of taxa. However, some taxa identified in the cladograms were the same for different factors. This suggested a potential relationship between these factors mediated by an increase or decrease in that specific taxa (e.g., Actinobacteria/Bifidobacterium in height and diarrhea). Further discussion of specific significant differences among the four cladograms is provided with Supplementary Fig. S5.
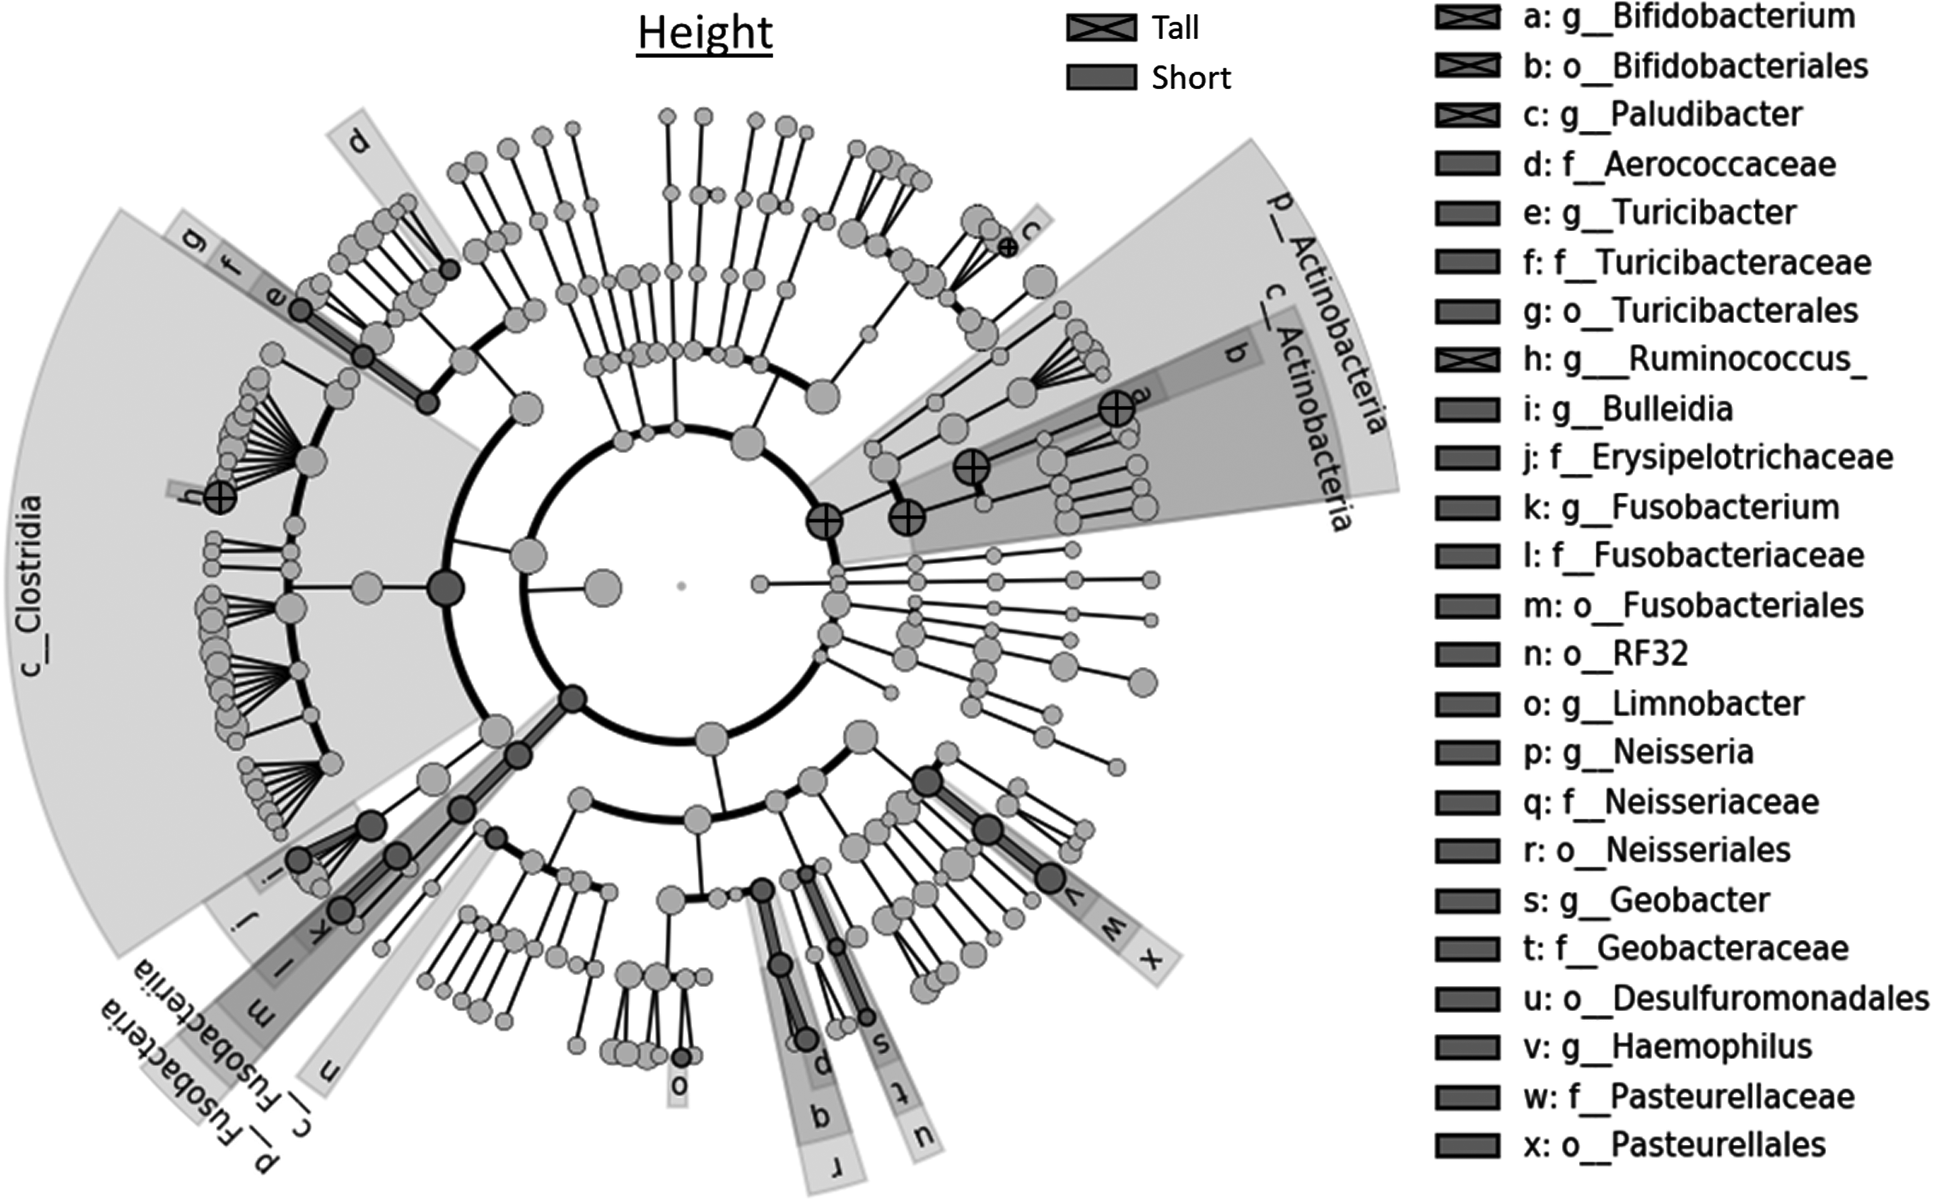
Linear discriminant analysis effect size (LEfSe) cladogram of the microbiomes of children (n = 33) grouped based on height (Tall = greater than −2.54 SD; Short = less than or equal to −2.54 SD). Names of taxa are given if they significantly varied between the two groups of children based on a Kruskal–Wallis ratio test. Letters before names denote taxonomic level (e.g., g_ = genus, f_ = family).
Microbiome similarities: assessing child health by microbiome groupings
The diversity analyses and cladograms suggest that differences in the intestinal microbiomes of the children were related to height differences and differences in diarrheal occurrences, age, and aflatoxin exposure. Therefore, to investigate if these intestinal microbiome differences in children were dysbiotic microbial shifts (a shift in the microbiome negatively affecting the host's health) a PCoA plot, heatmap, and survey data were assessed. Figure 4 gives the PCoA plot of all children (N = 35) and a unique subset of children depicted by the box. A similar exercise was conducted for the heatmap and a subset of children was identified (depicted by a rectangle in Supplementary Fig. S6).
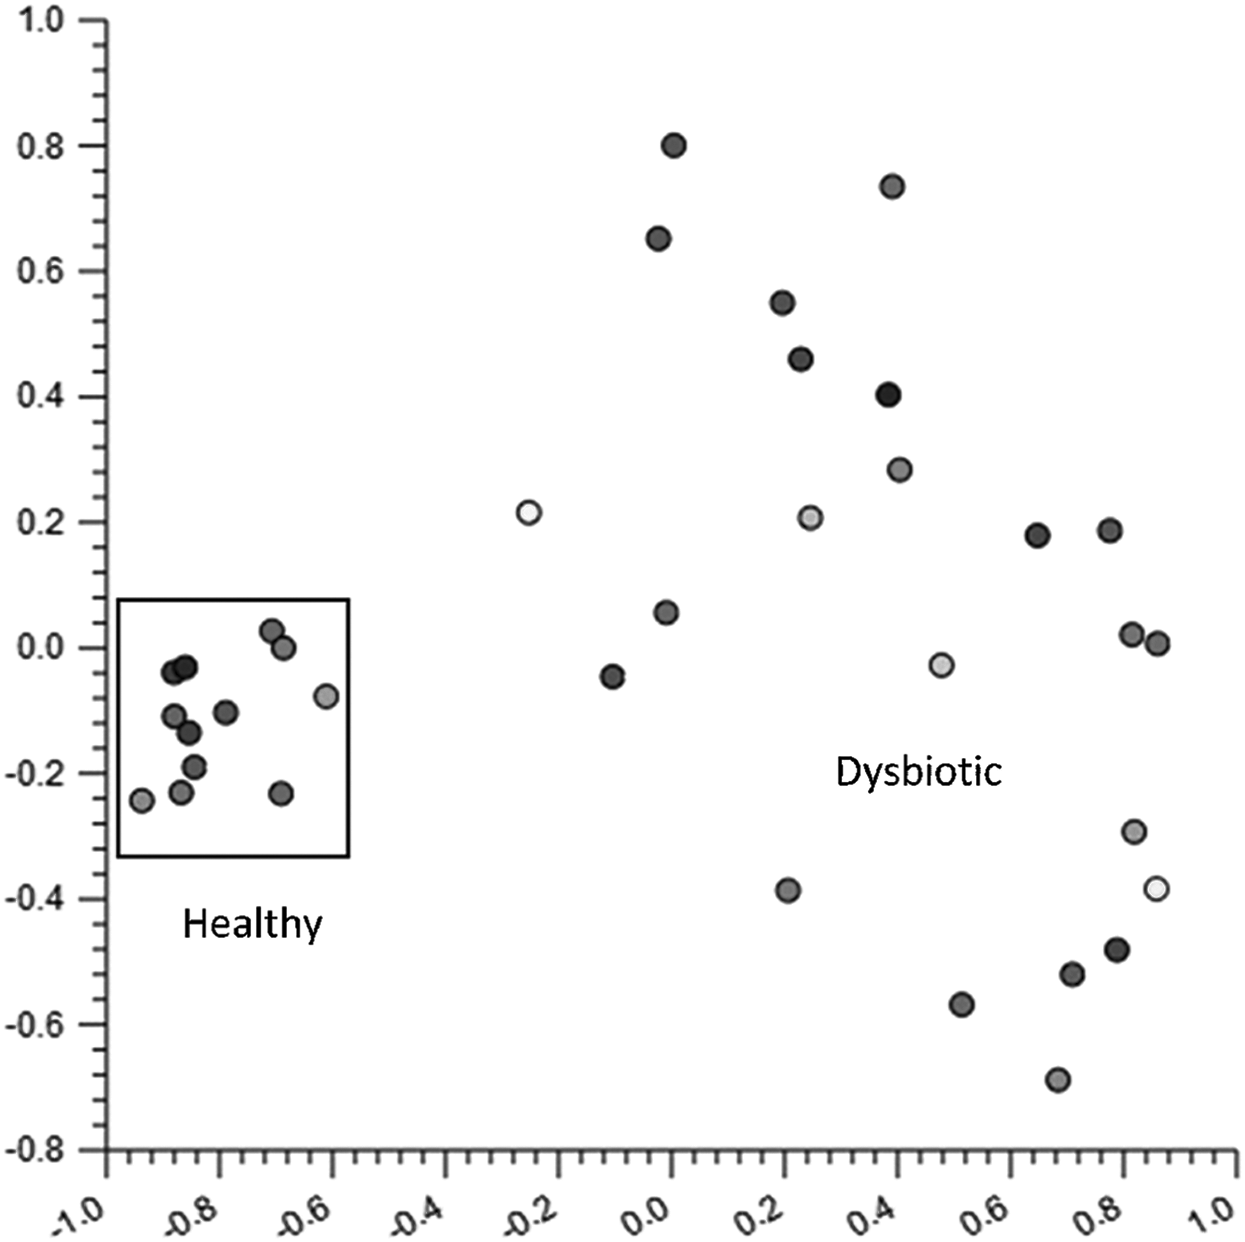
PCoA plot of all children (N = 35) using the Manhattan Distance metric. The box highlights a cluster of similar microbiomes. A secondary group of data points have similarities identified in the heatmap (Supplementary Fig. S6). PCoA, principal coordinate analysis.
Table 3 gives descriptive statistics of demographic and environmental factors from survey data for the two subgroups identified by the PCoA plot and heatmap. The survey data suggest that the microbiome of one subgroup (the PCoA subgroup; box in Fig. 4) was relatively healthy, whereas the microbiome of the second subgroup (the heatmap subgroup; red box in Supplementary Fig. S6) was dysbiotic.
Descriptive Statistics of Demographic and Environmental Factors for the Subgroups Including the Principal Coordinates Analysis Subgroup (Box in Fig. 4) and the Heatmap Subgroup (Rectangle in Supplementary Fig. S6)
Child gets one point for each positive item; mother attended 9+ visits during pregnancy, mother took folic acid vitamins, mother took iron vitamins, mother took prenatal vitamins (total 4 points possible).
NA, not available; PCoA, principal coordinate analysis.
We computed odds ratios for each factor to test if a child having a specific attribute or exposure (tall vs. short, diarrheal occurrence vs. no diarrheal occurrence) was more likely to have a normal or dysbiotic microbiome (i.e., be in one of the specific subgroups). Factors investigated included height, diarrheal occurrence, aflatoxin exposure, age, and child diet diversity.
The only significant odds ratios were for children exposed to levels of aflatoxin >10 ng/kg of child bw/day and children ≥14 months of age. Children who consumed >10 ng of aflatoxin/kg of child bw/day had 24 times higher odds of having an intestinal microbiome classified as dysbiotic than children who consumed ≤10 ng of aflatoxin/kg of child bw/day. Children ≥14 months of age had 3.9 times higher odds of having an intestinal microbiome classified outside the normal subgroup, compared with younger children, but was not significant (95% CI = 0.8–18.3).
Age may be a proxy for the set of developmental milestones associated with external risk factors for the child, especially in areas of poor sanitary conditions, as opposed to changes in the physical intestinal structure and enzymatic secretion changes during the aging process. For example, age may reflect increased child activity or environmental exposure risk, and changes in diet (e.g., shifting away from breastfeeding).
Our data support this, as the number of times children played on the ground the previous day was higher among children who were older (suggesting increased mobility) and higher among children who had dysbiotic microbiomes (suggesting increased environmental exposures); however, it was not statistically significant. Variance within the child diet diversity variable was small, all children had similar diets, and no significant microbiome differences were driven by child diet diversity among the full group (N = 35) or either of the two subgroups (n = 12 and n = 9).
Aflatoxin exposure by maize consumption may be a key driver of the dysbiosis of the microbiome in this population. The dysbiotic microbiome subgroup was 14.3 months older and consumed almost 22.5 ng of AF/kg of bw/day more through their food than the healthy microbiome subgroup. This suggests that as a child increases in age, they begin complementary feeding, which increases their potential for aflatoxin exposure.
This association was first reported in Gong et al. (2002, 2003) in West Africa and also recently reported in the MAL-ED cohort in Dhaka where the prevalence of aflatoxin in the blood more than doubled between the first and second year after birth among children (Mahfuz et al., 2018). Finally, when children were grouped by age (Fig. 2), differences in the microbiome associated with height were significant only for children ≥14 months of age. This possibly suggests that the dysbiosis of the microbiome is more likely to cause differences in height beginning in the second year after birth, which is when consumption of solid foods begins.
A cladogram (Supplementary Fig. S7) was generated to investigate specific taxonomic differences between the relatively healthy and dysbiotic microbiome subgroups. The majority of the overall differences begin at a high taxonomic level (i.e., phylum/class level), suggesting significant shifts in the microbiome between healthy and dysbiotic microbiome subgroups of children in Guatemala. Supplementary Fig. S8 depicts the abundance differences between the two subgroups at the order level. At the phylum level, the healthy microbiome subgroup was dominated by Actinobacteria, whereas the dysbiotic microbiome subgroup was dominated by Firmicutes.
In addition, similarities are present between the taxonomic differences identified here and the taxonomic differences identified in the previous aflatoxin exposure study in rats (Wang et al., 2016; this was the only study to conduct a 16S microbiome analysis). Supplementary Table S1 presents the list of all statistically significant microbial taxa identified in our study between relatively healthy and dysbiotic microbiomes of children (associated with Supplementary Fig. S8). Wang et al. (2016) reported the top 20 significant microbial taxa that had the largest F-test value between treatment groups of rats exposed to aflatoxin (Wang et al., 2016).
Of the 13 microbial taxa that increased in a dose-dependent manner among rat groups, 12 were identified as significantly different between relatively healthy and dysbiotic microbiomes of children in our study. The genus taxa include Bacteroides, Coprococcus, and Oscillospira; the family taxa include Rikenellaceae; and the order taxa include Clostridiales. Of the seven microbial taxonomies that decreased in a dose-dependent manner among the rat groups, only one, belonging to the genus Streptococcus, was identified as significantly different between normal and dysbiotic microbiomes of children in our study. This result further supports the hypothesis that aflatoxin exposure from food sources among children in Guatemala is associated with the dysbiosis of the intestinal microbiome.
The hypothesis presented and our supporting evidence put forward an important mechanistic pathway for how aflatoxin exposure may be associated with child growth. Although the dataset is small, the data support the hypothesis that, as a child reaches specific developmental milestones, exposure to environmental contaminants—including maize-based aflatoxins—may increase the possibility of a poor growth outcome.
Summary
We conducted a pilot study to understand the relationships among childhood stunting, the intestinal microbiome, and aflatoxin exposure for children in Guatemala. Although this study was limited to only 35 children, the results showed that childhood stunting was correlated to a dysbiotic intestinal microbiome, associated with diarrhea in the 2 weeks before sampling. Exposure to aflatoxin through maize consumption was associated with microbial dysbiosis and stunting, especially for children older than 14 months. The results support the available literature that aflatoxin exposure influences the microbiome that in turn is associated with child growth. Although further research is needed to assess the magnitude of impact of aflatoxins, further support should be given to aflatoxin control mechanisms.
Footnotes
References
Supplementary Material
Please find the following supplemental material available below.
For Open Access articles published under a Creative Commons License, all supplemental material carries the same license as the article it is associated with.
For non-Open Access articles published, all supplemental material carries a non-exclusive license, and permission requests for re-use of supplemental material or any part of supplemental material shall be sent directly to the copyright owner as specified in the copyright notice associated with the article.