
Abstract
We systematically assessed the removal of total petroleum hydrocarbons (TPHs) and other organic carbon using sequential biodegradation and ozonation in two soils (BM3 and BM4). We optimized the conditions for each step: 5% moisture content for ozonation and 10% moisture and circumneutral pH for biodegradation. For the relatively biodegradable TPH in BM3, preozonation and postozonation strategies were equally effective. In contrast, the more recalcitrant TPH in BM4 was better treated using postozonation. Carbon analyses along the treatment timeline revealed that dissolved organic carbon (DOC) was the dominant substrate for microbial consumption when readily biodegradable TPH was no longer available. The carbon in TPH was more reactive with O3 than was the rest of dichloromethane-extractable organic carbon (DeOC), and the fate of TPH dictated the changes of DeOC. However, the fate of total organic carbon was controlled mainly by the microbial mineralization of DOC. Ozonation did not directly enhance the biodegradation rate of the residual TPH after ozonation, but ozone converted TPH into DOC that was microbially mineralized. This is the first study that compares the efficiencies of pre- and postozonation of two distinctly different soils. This study provides insights regarding the fundamental mechanism through which biodegradation and ozonation integrate and reveals the dynamics between ozonation and biodegradation during treatment petroleum-contaminated soils. Multistage ozonation+biodegradation is a useful tool to achieve the regulatory TPH standard (10,000 mg/kg), and DOC should be measured alongside TPH to gauge the dynamics of the integrated process.
Introduction
Current field-applicable technologies for treating petroleum-contaminated soil include chemical, physical, and biological processes, which can be applied in situ or ex situ. Most commonly used are bioremediation (e.g., land farming, bioventing, biopile) (Dupont, 1993; Balba et al., 1998; Riser-Roberts, 1998; Li et al., 2002; Maila and Cloete, 2004), stabilization/solidification (Meegoda, 1999; Shah et al., 2003; Mater et al., 2006), chemical oxidation (USEPA, 1998; Ferguson et al., 2004), soil washing (Barnes et al., 2002; Kang et al., 2012), and thermal (desorption and incineration) (Reeves, 1991; Troxler et al., 1992; Ezeji et al., 2007; Vidonish et al., 2016). Even direct reuse of the soil as a road material has been reported (Pamukcu et al., 1990; Hassan et al., 2005). Among the technologies, bioremediation is attractive due to its relative cost-effectiveness, simplicity, and good performance in many situations (Wilson and Jones, 1993; Okoh and Trejo-Hernandez, 2006; Das and Chandran, 2010; Singh et al., 2012). Bioremediation can remove alkanes, branched alkanes, cycloalkanes, and aromatics, and it often can achieve a regulatory treatment goal of ≤1% total petroleum hydrocarbon (TPH) after biostimulation or bioaugmentation (Hamilton et al., 2001).
Although bioremediation can be effective, it can be slow, and its efficiency depends on a suite of variables, including oxygen availability, moisture level (>10%), TPH concentration, pH (circumneutral), macro and micronutrients, salinity, and temperature (Atlas, 1981; Leahy and Colwell, 1990; Riser-Roberts, 1998). Moreover, one challenge facing bioremediation is a “residual TPH concentration” or a TPH plateau at which biodegradation stops, even though biotic conditions are optimal (Huesemann, 1995, 1997; McMillen et al., 1995; Nocentini et al., 2000). High residual concentrations often are associated with oils having low American Petroleum Institute (API) gravity (inverse of a petroleum's density), which is linked to a high concentration of resins and asphaltenes and, thus, lower concentration of the more readily biodegradable hydrocarbons (McMillen et al., 2001). Poor biodegradability may be due to low bioavailability, that is, the microbes cannot access TPH that is insoluble or resides within the soil's pores (Weissenfels et al., 1992; Alexander, 2000; Cuypers et al., 2001), the inherent recalcitrance of the molecules having complex structures (Gough and Rowland, 1990; Singh and Ward, 2004), or both (Huesemann, 1997). No matter the cause, residual TPH concentration greater than the regulatory standard needs to be treated with more aggressive strategies to reach the cleanup goal.
Chemical oxidation relying on ozone (O3) to remediate the soil has gained attention over the past few decades. Ozone and the hydroxyl radical (OH•), which can be produced from ozone, react with many types of hydrocarbons, but through different mechanisms. The dominant oxidation pathways for OH• are hydrogen abstraction and OH• addition (Zavitsas and Melikian, 1975; Hoigné and Bader, 1976; Atkinson, 1986; Chen and Tschuikow-Roux, 1993; Allodi et al., 2008; Francés-Monerris et al., 2017). In contrast, ozone directly attacks hydrocarbons through O3 molecule 1,3 dipolar cycloaddition, which leads to bond breaking (Gottschalk et al., 2000; Beltran, 2003; Yu et al., 2007). Ozone's strong oxidizing power can help overcome the residual plateau by making the recalcitrant residuals more soluble, simpler in structure, and, thus, more biodegradable. TPH primarily consists of saturated alkanes (n-alkane, branched alkane, and cycloalkane) and aromatic compounds (single-ring and multiring) that can be biodegraded through different mechanisms. All the mechanisms involve initial oxygenase reaction (mono- or di-) that insert an -OH group derived from O2 into the hydrocarbon. Once one or two -OH groups are inserted, the molecules are available for normal hydroxylation and dehydrogenation reactions (Atlas, 1981; Wilson and Jones, 1993; Madigan et al., 1997; Wentzel et al., 2007). One mechanism by which ozonation may accelerate biodegradation of hydrocarbons is by adding -OH groups that may allow the microorganisms to bypass the initial oxygenation reactions and move directly to the electron- and energy-generating hydroxylations and dehydrogenations. For example, carboxylic acids produced by ozonation of TPH (Chen et al., 2017, 2018) can be directly utilized by microorganisms.
When applied before biodegradation, ozonation can produce soluble and biodegradable compounds to support microbial growth and activity. This preozonation setting is the format used so far for integrated biodegradation and ozonation of soils containing petroleum residuals (Ahn et al., 2005; Goi et al., 2006; Haapea and Tuhkanen, 2006; Liang et al., 2009). However, postozonation, that is, O3 applied after biodegradation to reduce the residual concentration for a recalcitrant oil has not been broached. In addition, none of the studies used sequential ozonation and bioremediation, with the ozonation and biostimulation processes individually optimized. Furthermore, the fate of dissolved organic carbon (DOC) produced during ozonation has not been tracked. DOC with high polarity cannot be measured by gas chromatography-flame ionization detector (GC-FID) tailored for nonpolar hydrocarbons (Chen et al., 2017); therefore, only monitoring the regulated TPH does not account for the remediation of all the introduced carbon, as DOC could still be a hazardous contaminant and always contains oxygen demand (Stalter et al., 2010).
In this study, we evaluate a multiple-step treatment that alternates ozonation and biodegradation. We do the evaluation with two weathered soils containing distinctly different residual crude oils: Benchmark 3 (BM3) has relatively more biodegradable residual petroleum, while Benchmark 4 (BM4) has more recalcitrant residual oil. We use moisture and pH conditions to optimize each step: ≤5% water content to achieve fast O3 reactivity and ≥10% moisture with near-neutral pH to achieve rapid biodegradation rate of TPH and ozonation products. The soil acidifies from production of carboxylic acids after ozonation and, therefore, pH adjustment may be necessary for biodegradation.
The objectives of this study are to: (1) compare the overall TPH removal efficiencies of preozonation versus postozonation method for both soils; (2) track the fate of all carbon pools to understand how they behave relative to TPH; and (3) understand how ozonation integrates with biodegradation.
Experimental Protocols
Benchmark soils
We carried out multistage ozonation+bioremediation experiments with two soils containing weathered petroleum: BM3 and BM4. Table 1 summarizes physical and chemical characteristics of the two soils, which were distinctly different. BM3 was a 50:50 mixture of two petroleum-contaminated soils from two different Chevron sites having weathered hydrocarbons; it had a TPH concentration of 31,000 mg/kg with a relatively biodegradable oil (API gravity ∼40). BM4's TPH concentration (30,000 mg/kg) was close to BM3, but its oil was more recalcitrant. BM4 was sampled from a clayey sludge from another Chevron site. Although the API gravity of the petroleum in BM4 was not determined, its dichloromethane extract was darker than BM3, indicating a higher asphaltene content and, thus, a heavier oil in BM4 (McMillen et al., 2001; Honse et al., 2012; Selley and Sonnenberg, 2014).
Physical and Chemical Properties of BM3 and BM4 Soils
All concentrations are normalized to air-dried soil mass.
TOC, total organic carbon; TPH, total petroleum hydrocarbon.
Ozonation setup
The experimental setup, shown in Supplementary Fig. S1, was an upflow column containing BM3 or BM4 soil. The setup was modified from past work (Chen et al., 2016) by the addition of an anhydrate Na2SO4 column (for moisture removal) and the ozone monitor (to track O3 consumption). The inlet O3 concentration was set at a constant value (10,000 ppmv, i.e., 20 mg/L), and the effluent was connected to an ozone monitor (465M; T-API, CA) for real-time measurement of the O3 concentration. The gas flow rate was kept at 5 L/min for all ozonation experiments. Each ozonation treated 250 g of soil for 1 h under the above conditions.
Total petroleum hydrocarbons, dissolved organic carbon, dichloromethane-extractable organic carbon, and total organic carbon
TPH was assayed by GC-FID for both soils. Carbon was separated into DOC, dichloromethane-extractable organic carbon (DeOC), TPH carbon (TPHC), and total organic carbon (TOC). They were measured to establish carbon balances using the methods reported in Chen et al. (2016, 2017). TPH is part of DeOC, and TOC contains all pools of carbon. Details of the extraction and analytical methods can be found in Supplementary Data.
Evaluating TPH removal efficiency for BM3
We carried out three groups of multicycle biodegradation+ozonation experiments to assess the TPH removal efficiencies for BM3 soil: (1) biostimulation for 12 weeks (the control); (2) ozonation as pretreatment followed by 4-week biostimulation, followed by two more cycles of the same treatment; and (3) ozonation as post-treatment at the end of week 4 of the biostimulation, followed by two more identical cycles. One kilogram of BM3 soil was used for each group that was replicated. All ozone treatments were at a soil-moisture level of 5%. We applied the same O3 mass for each ozonation experiment, which corresponded to a dose of 0.8 g O3/g TPHinitial or 24 g O3/kg dry soil.
The biodegradation experiments mimicked land farming. We placed the 1 kg of soil with pH maintained at ∼7.5 (before or after ozonation) in each pan, and we tilled the soil every 2 days to provide oxygen and stimulate aerobic biodegradation. The soil was moistened with deionized water to maintain a 10% of moisture content. The pans were covered with aluminum foil to slow moisture loss and were incubated at 30°C in the dark. To 1 kg of soil, we added 10 mL salt and macronutrient solution, 1 mL trace mineral A solution, 1 mL trace mineral B solution, and 10 mL of vitamin mix solution. The chemical compositions of these solutions and concentration of each reagent are provided in Supplementary Data (Tables S1–S4).
Evaluating preozonation versus postozonation for BM4
We also performed three groups of multicycle biodegradation+ozonation studies to assess the TPH removal efficiencies and carbon fates for BM4 soil. All experimental conditions were the same as for the BM3 soil. Since BM3 and BM4 have approximately the same TPH initial concentration, the ozone dose, when normalized, also came to 0.8 g O3/g TPHinitial or 24 g O3/kg dry soil.
Results and Discussion
Integration of ozonation and bioremediation for BM3
Figure 1 tracks the fates of TPH during the three different treatment scenarios for BM3: biotreatment only (blue diamonds), preozonation (orange squares), and postozonation (gray triangles). The green lines are the dividers between phases.

The fates of BM3's TPH for the biotreatment control (blue diamonds), preozonation (orange squares), and postozonation (gray triangles). The 12-week experiment was divided into three 4-week phases. Each ozone dose was 0.8 g O3/g initial TPH, corresponding to 24 g O3/kg dry soil. The green lines divide the three phases. Symbols are the means of three replicates, and error bars are the standard deviations. TPH, total petroleum hydrocarbon.
Biotreatment of BM3
Initially, TPH-biodegradation kinetics for biostimulation alone were rapid and represented well by pseudo zero-order kinetics (r2 = 0.97). Fast biodegradation in phase 1 likely was due to consumption of the lightest portion of BM3's TPH; nearly 40% of the TPH was removed during this phase. However, the biodegradation rate slowed in phase 2, and, by the beginning of phase 3, TPH plateaued at a concentration of ∼13,500 mg/kg. Phases 2 and 3 combined only achieved ∼15% TPH reduction, due, in part, to the accumulation of less-biodegradable residuals (Nocentini et al., 2000). Biodegradation alone did not meet the TPH regulation (10,000 mg/kg). BM3's TOC and DeOC concentrations (presented in Supplementary Fig. S2 in Supplementary Data) followed the path of TPH and leveled off in phase 3 at 48.5 g/kg (declined from 58) and 27 g/kg (declined from 36.5), respectively.
Preozonation of BM3
Preozonation led to a different TPH-removal pattern. The first ozonation dropped the TPH concentration by ∼8,000 mg/kg, and the ensuing bioremediation yielded a TPH-biodegradation rate almost parallel to that of biotreatment. Thus, microbial degradation of TPH in phase 1 was not suppressed by ozonation, which means that the microbial community experienced a quick recovery from any disinfecting action during ozonation. The biggest TPH reduction (60%) occurred in phase 1.
Figure 2, which tracks the different carbon components for BM3, shows that ozonation produced 6 g/kg of DOC, with 5 g/kg being non-TPH DOC. Only 0.2 g/kg of non-TPH DOC was utilized in phase 1. This lack of biodegradation of non-TPH DOC suggests that biodegradable TPH remained abundant after ozonation and outcompeted DOC as a substrate.

Carbon fate for the multistage treatment of BM3 using preozonation. Carbon was divided into four categories: TOC, DeOC, TPHC, and DOC. TPHC was calculated from TPH concentration × 0.85 (i.e., 85% of TPH is carbon). The carbon flow chart presents how each category of carbon evolved throughout the treatment process that follows the same timeline as Fig. 1, and the first, second, and third correspond to phases 1, 2, and 3, respectively. Numbers show the mass of C in grams, and the areas are proportional to the mass. The green arrows indicate an ozone dose. DOC, dissolved organic carbon; DeOC, dichloromethane-extractable organic carbon; TOC, total organic carbon; TPHC, TPH carbon.
The second ozone dose removed only about one-half of the TPH removed by the first ozonation. This correlates with having about one-half of TPH already removed, but it also is possible that the remaining TPH was less reactive or had to compete with DOC. The most significant trend is that the preferred substrate for microbial metabolism in phase 2 shifted from TPH to DOC: Biodegradation consumed 6 g/kg of DOC in total, with 1.5 g/kg in DeOC and 4.5 g/kg outside of DeOC. Because the easily biodegradable TPH was consumed in phase 1, TPH had only a modest decrease in phase 2, 1.5 g/kg. TOC loss (6 g/kg) was slightly less than the combined losses of DOC and DeOC loss, due to net growth of biomass.
Phase 3 showed similar patterns as phase 2: The third dose decreased less TPH than the previous one (Fig. 1), and biodegradation mainly targeted DOC rather than TPH (Fig. 2). Overall, the three cycles of ozonation coupled with biodegradation achieved a significant degree of TPH removal: from ∼31,000 to ∼5,000 mg/kg in 84 days. TOC reduction—from 58 to 34 g/kg—was based on DOC mineralization, with most of the DOC generated by ozonation.
Postozonation of BM3
Postozonation reached about the same TPH endpoint as preozonation, but the route was different (gray triangles in Fig. 1). The first ozone dose, applied at the end of week 4, led to a sharp drop of TPH, ∼5,400 mg/kg TPH, but did not cause substantial mineralization; instead, Fig. 3 shows that the primary effect of ozonation was converting DeOC and TPHC to DOC. The effect of the second ozone dose was similar, but muted.

Carbon fate for multicycle treatment of BM3 using postozonation. Carbon was divided into four categories: TOC, DeOC, TPHC, and DOC. TPHC was calculated by TPH concentration × 0.85 (i.e., 85% of TPH is carbon). The carbon flow chart presents how each category of carbon evolved throughout the treatment process that followed the same timeline as Fig. 1, and the first, second, and third correspond to phases 1, 2, and 3, respectively. Numbers show the mass of C in grams, and the areas are proportional to the mass. The green arrows indicate an ozone dose.
Figure 3 shows that biodegradation in phases 2 and 3 mirrored the trends of preozonation: rapid DOC mineralization, but limited TPH consumption. This underscores that, when readily biodegradable TPH was depleted, the dominant impact of ozone was to transform TPH, along with some other components in DeOC, into DOC, which then could be biodegraded and mineralized.
In summary for BM3, when readily biodegradable TPH was available, the microbial community selectively utilized this portion of TPH in preference to non-TPH DOC. Later, DOC became the dominant substrate, since only less-biodegradable TPH remained. Integrating ozonation with biodegradation made it possible to bring the TPH level far below the regulated value of 10,000 mg/kg while also removing about 40% of the TOC. TPH reductions during biostimulation in phases 2 and 3 were much smaller than in phase 1, since DOC, not TPH, became the main substrate. Nevertheless, phases 2 and 3 enlarged the differences of the final TPH between the ozone treatment and bio-only control: from 5,000 to 10,000 mg/kg (∼30% of the initial TPH concentration). The reproducibility of the trends in TPH removal is supported by the standard deviation bars being much smaller than the TPH differences.
For BM3, preozonation and postozonation were equally efficient, since BM3 contained a significant fraction of readily biodegradable TPH. The results for BM3 illustrate that it is valuable to measure organic components beyond TPH, even though TPH provides the regulatory standard. The conversion of TPH to DOC and the subsequent mineralization of DOC define the dynamics between ozonation and biodegradation, which determined the loss of TOC.
Integration of ozonation and bioremediation for BM4 soil
Figure 4 compares TPH changes with time among the three treatment processes for BM4: biotreatment only (blue diamonds), preozonation (orange squares), and postozonation (gray triangles).
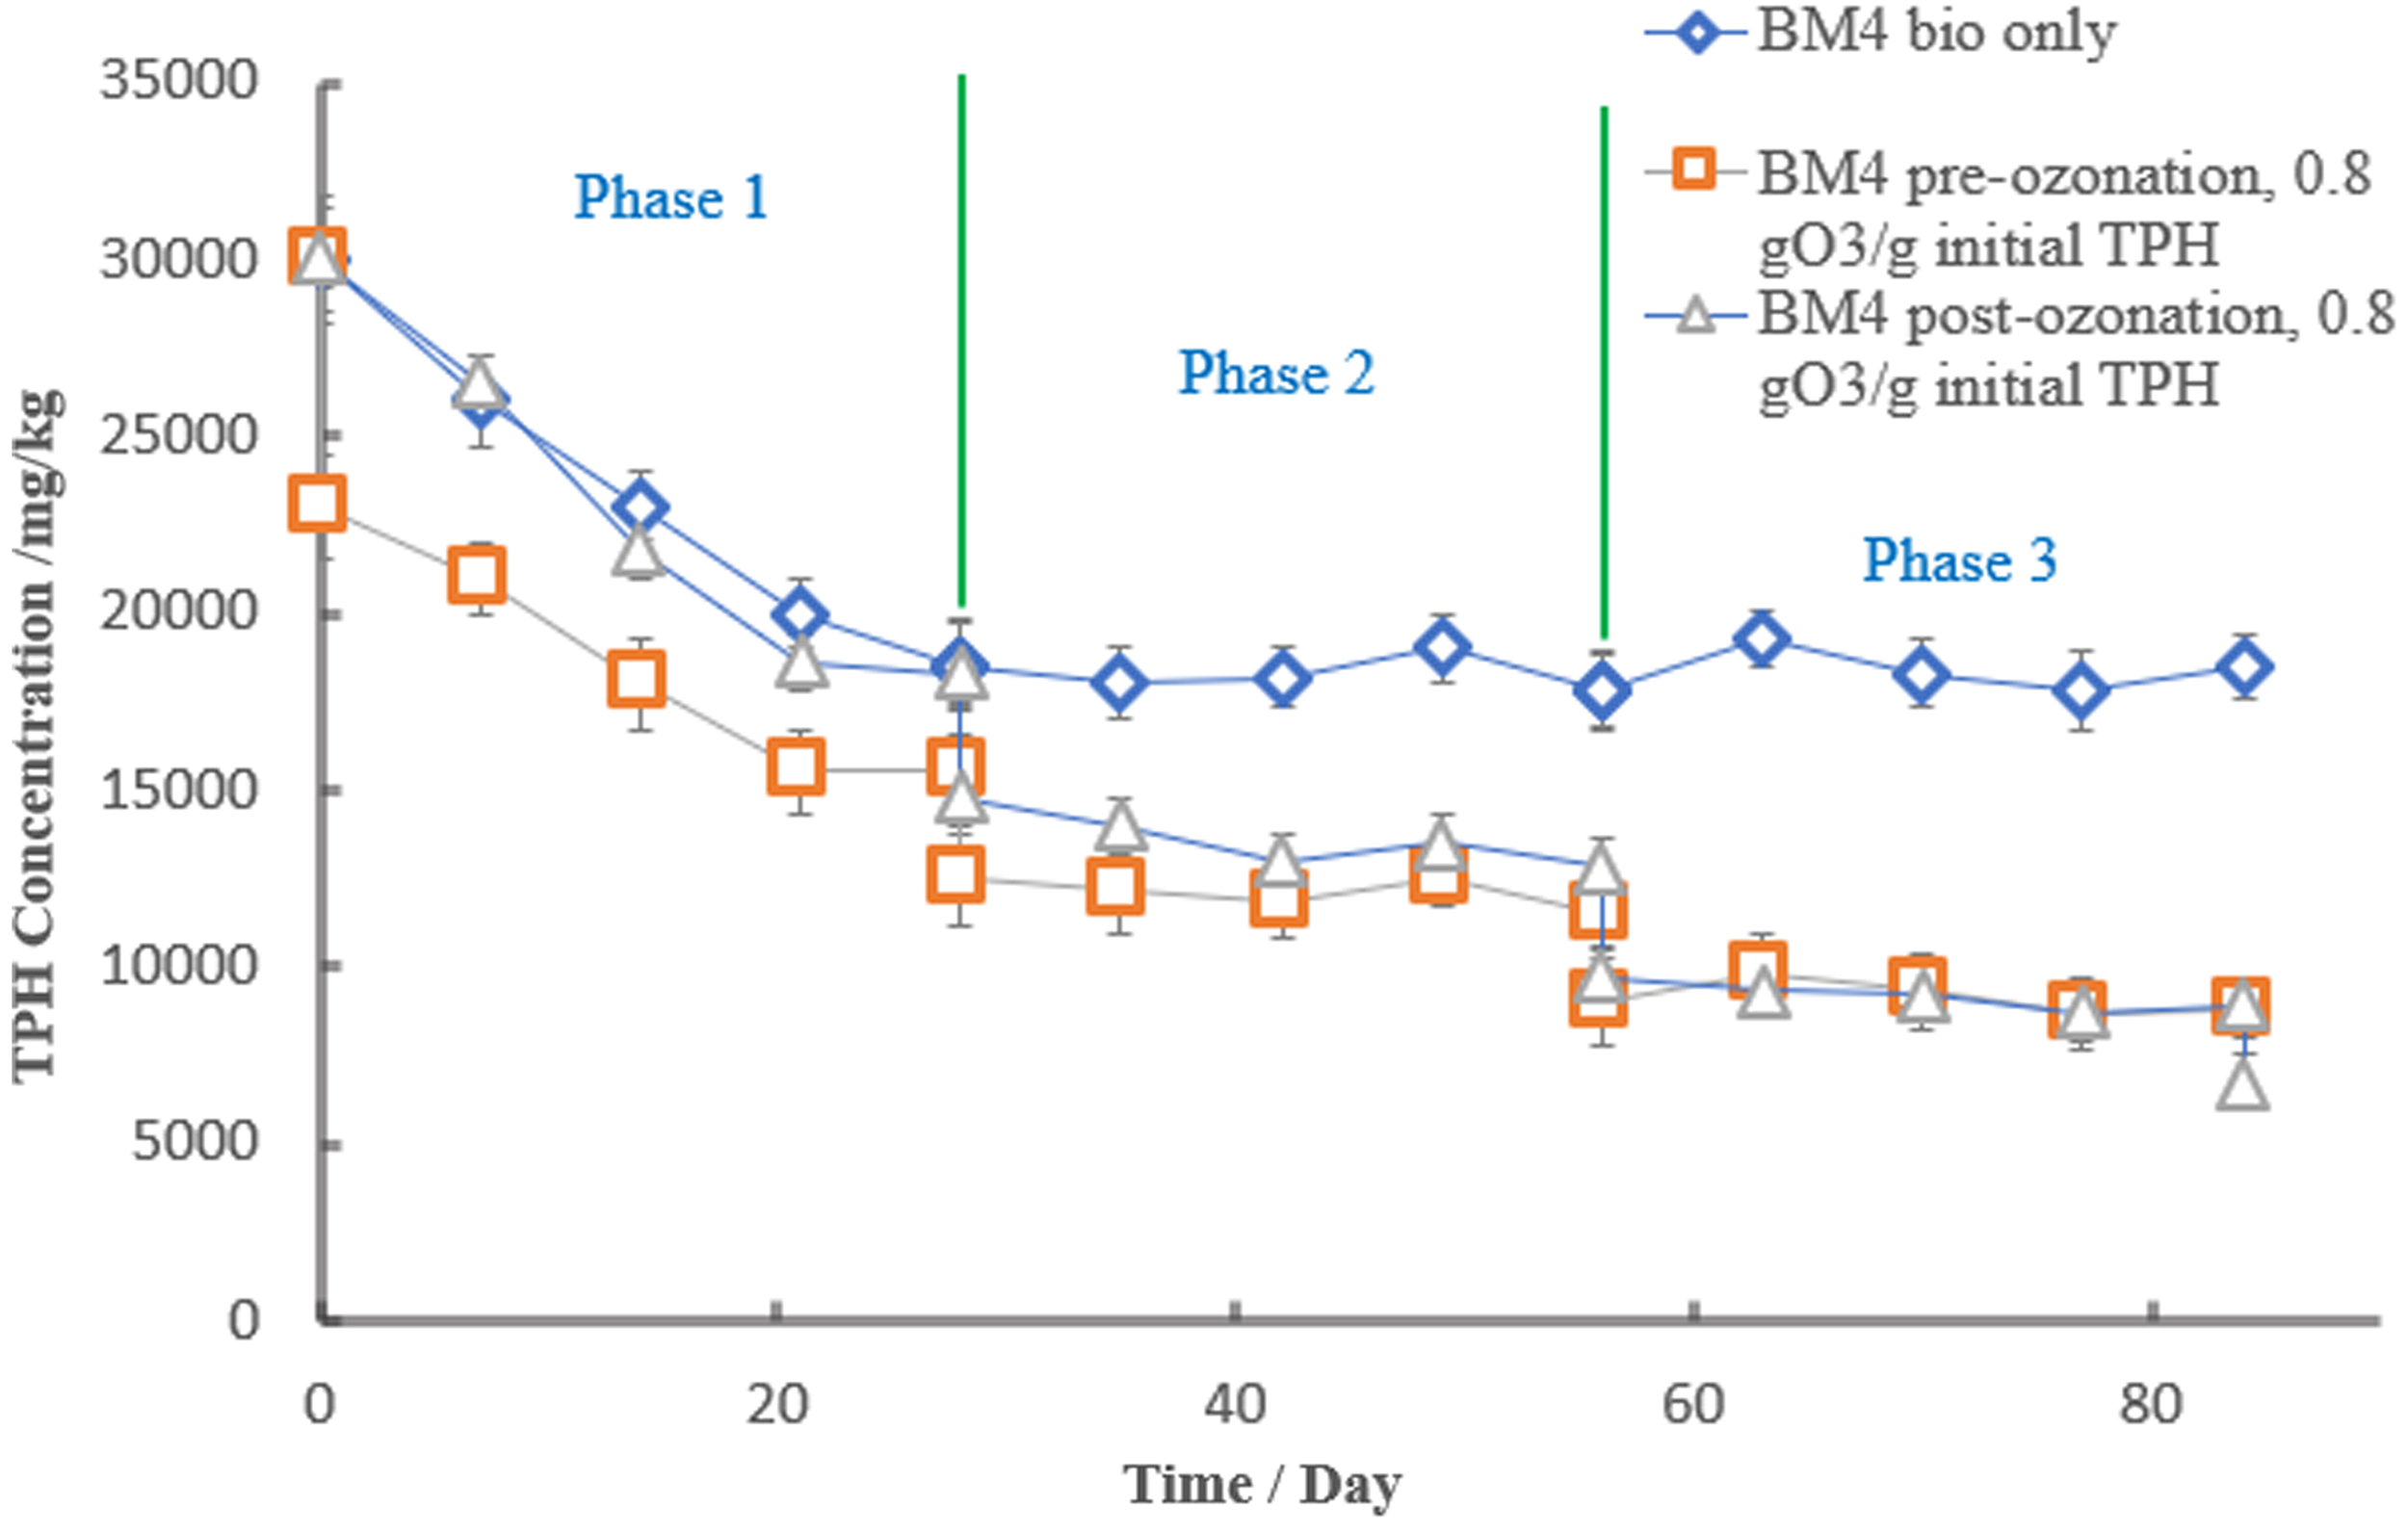
The patterns of BM4 TPH concentrations with time for: Biotreatment control (blue diamonds), preozonation (orange squares), and postozonation (gray triangles). The 12-week period was divided into three 4-week phases. Each ozone dose was 0.8 g O3/g initial TPH, which corresponds to 24 g O3/kg dry soil. The green lines divide the three phases. Symbols are the means of three replicates, and error bars are the standard deviations.
Biotreatment of BM4
In phase 1 of biotreatment (control), TPH decreased in a pseudo zero-order pattern from ∼30,000 to ∼18,500 mg/kg, presumably due to the biodegradation of the lighter fractions of TPH. Starting in phase 2, biodegradation stopped, leading to a residual concentration of ∼5,000 mg/kg higher than the residual for BM3; this observation is consistent with a heavier oil in BM4 (McMillen et al., 2001). Again, the final TPH concentration achieved by bioremediation alone did not meet the 10,000 mg/kg standard. The TOC reduction (∼8 g/kg) was primarily driven by TPHC loss, which led to mineralization using biodegradation (Supplementary Fig. S3 in Supplementary Data).
Preozonation of BM4
The overall patterns for TPH and carbon components with BM4 were similar to those for BM3, but important details differed. The first ozone dose resulted in an ∼7,000 mg/kg TPH reduction, which was followed by another 7,000 mg/kg TPH decrease during biodegradation in phase 1, bringing the TPH concentration ∼2,000 mg/kg below the residual concentration of biostimulation alone. The second and third ozone doses combined led to less TPH decline than did the first dose, which resembled the pattern of BM3. The final TPH was diminished to ∼9,000 mg/kg, which met the regulatory standard, but was higher than the endpoint TPH of BM3.
Figure 5, which displays the carbon distribution, shows that, in phase 1, about 40% of ozone-generated total DOC (3 g/kg) was biodegraded. Although TOC loss in phase 1 was dominated by TPHC loss, DOC loss dominated the change in TOC of the second and third phases, and the domination was strongest for the DOC outside of DeOC, since this fraction of DOC is more polar and biodegradable.
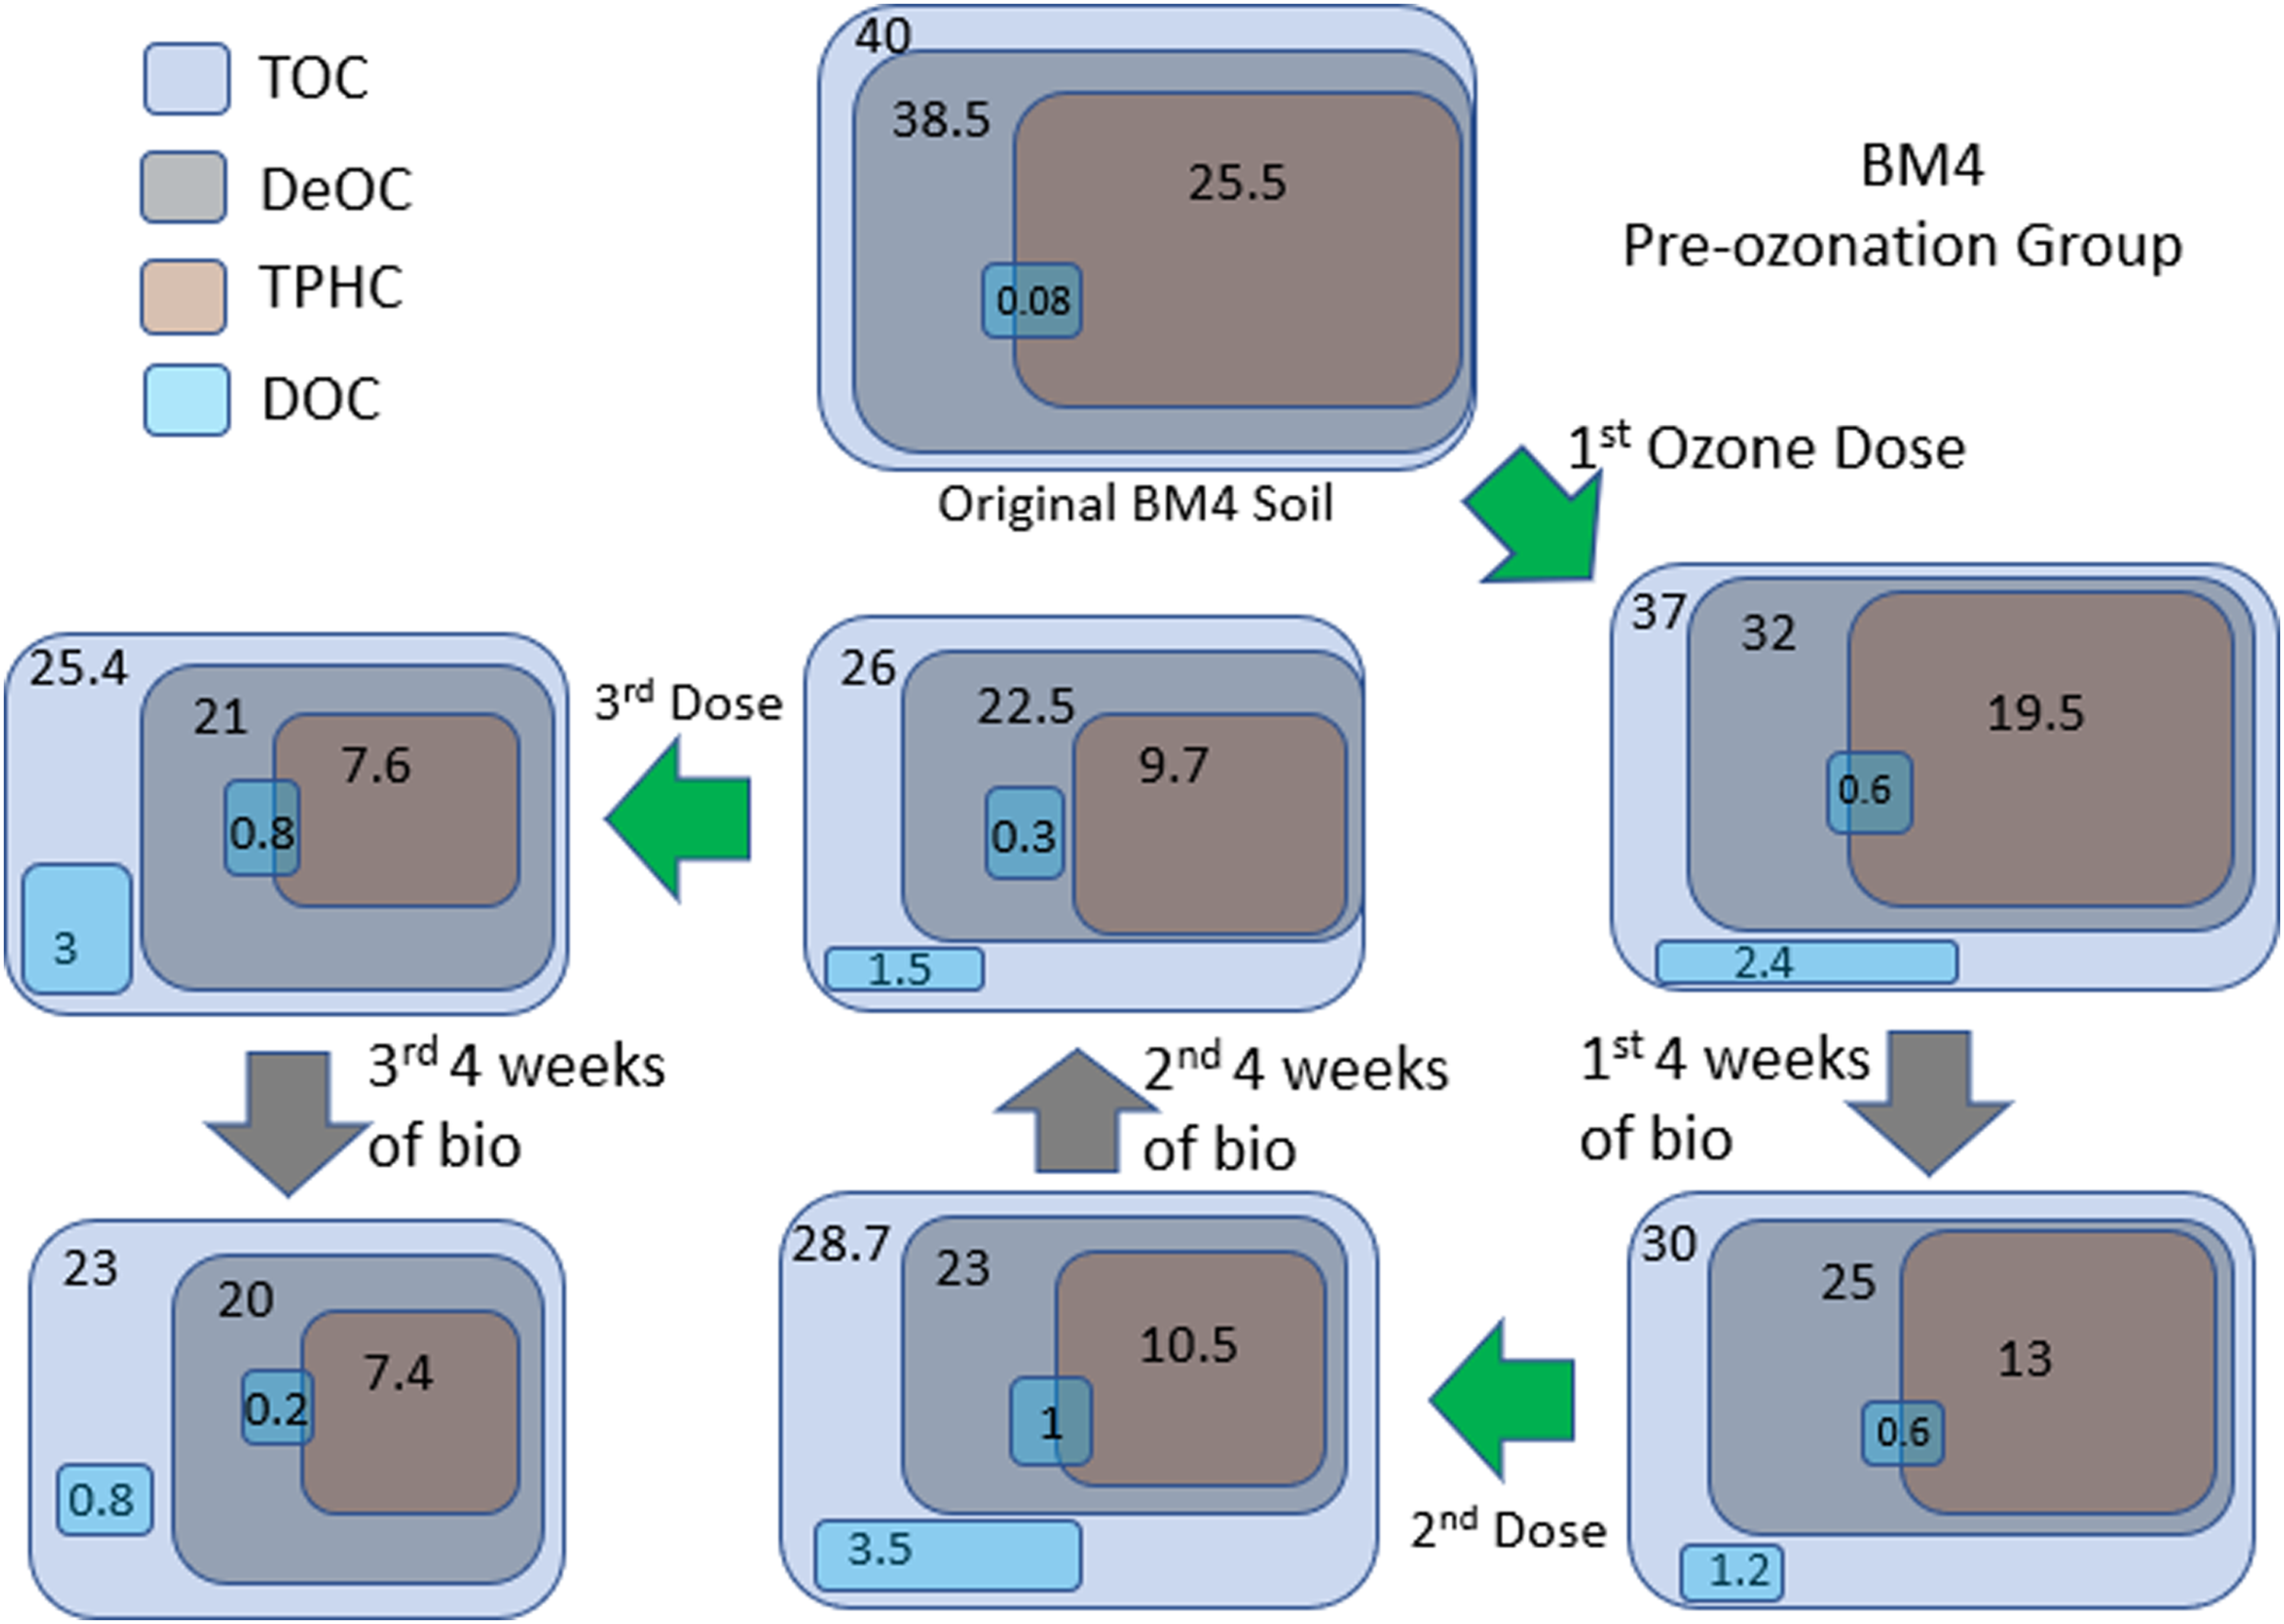
Carbon fate of BM4 during preozonation multistage treatment. Carbon was divided into four categories: TOC, DeOC, TPHC, and DOC. TPHC was calculated by TPH concentration × 0.85 (assuming 85% of TPH is carbon). The carbon flow chart presents how each category of carbon evolved throughout the treatment process that followed the same timeline as Fig. 4, and the first, second, and third correspond to phases 1, 2, and 3, respectively. Numbers show the mass of C in grams, and the areas are proportional to the mass. The green arrows indicate an ozone dose.
TOC loss over all phases was ∼45%, and it was dominated by mineralization of DOC that was generated from TPH by ozonation (in all phases), although some direct mineralization of TPH also occurred in phase 1.
Postozonation of BM4
Postozonation reached the TPH endpoint of preozonation before the third ozone dose (Fig. 4). This faster trajectory occurred because TPH was biodegraded during phases 2 and 3. Figure 6 illustrates that these two phases of biodegradation removed 2.6 g TPHC, a value much larger than the 1 g TPHC for preozonation (Fig. 5). Thus, the TPH following the first ozonation still contained a biodegradable fraction.
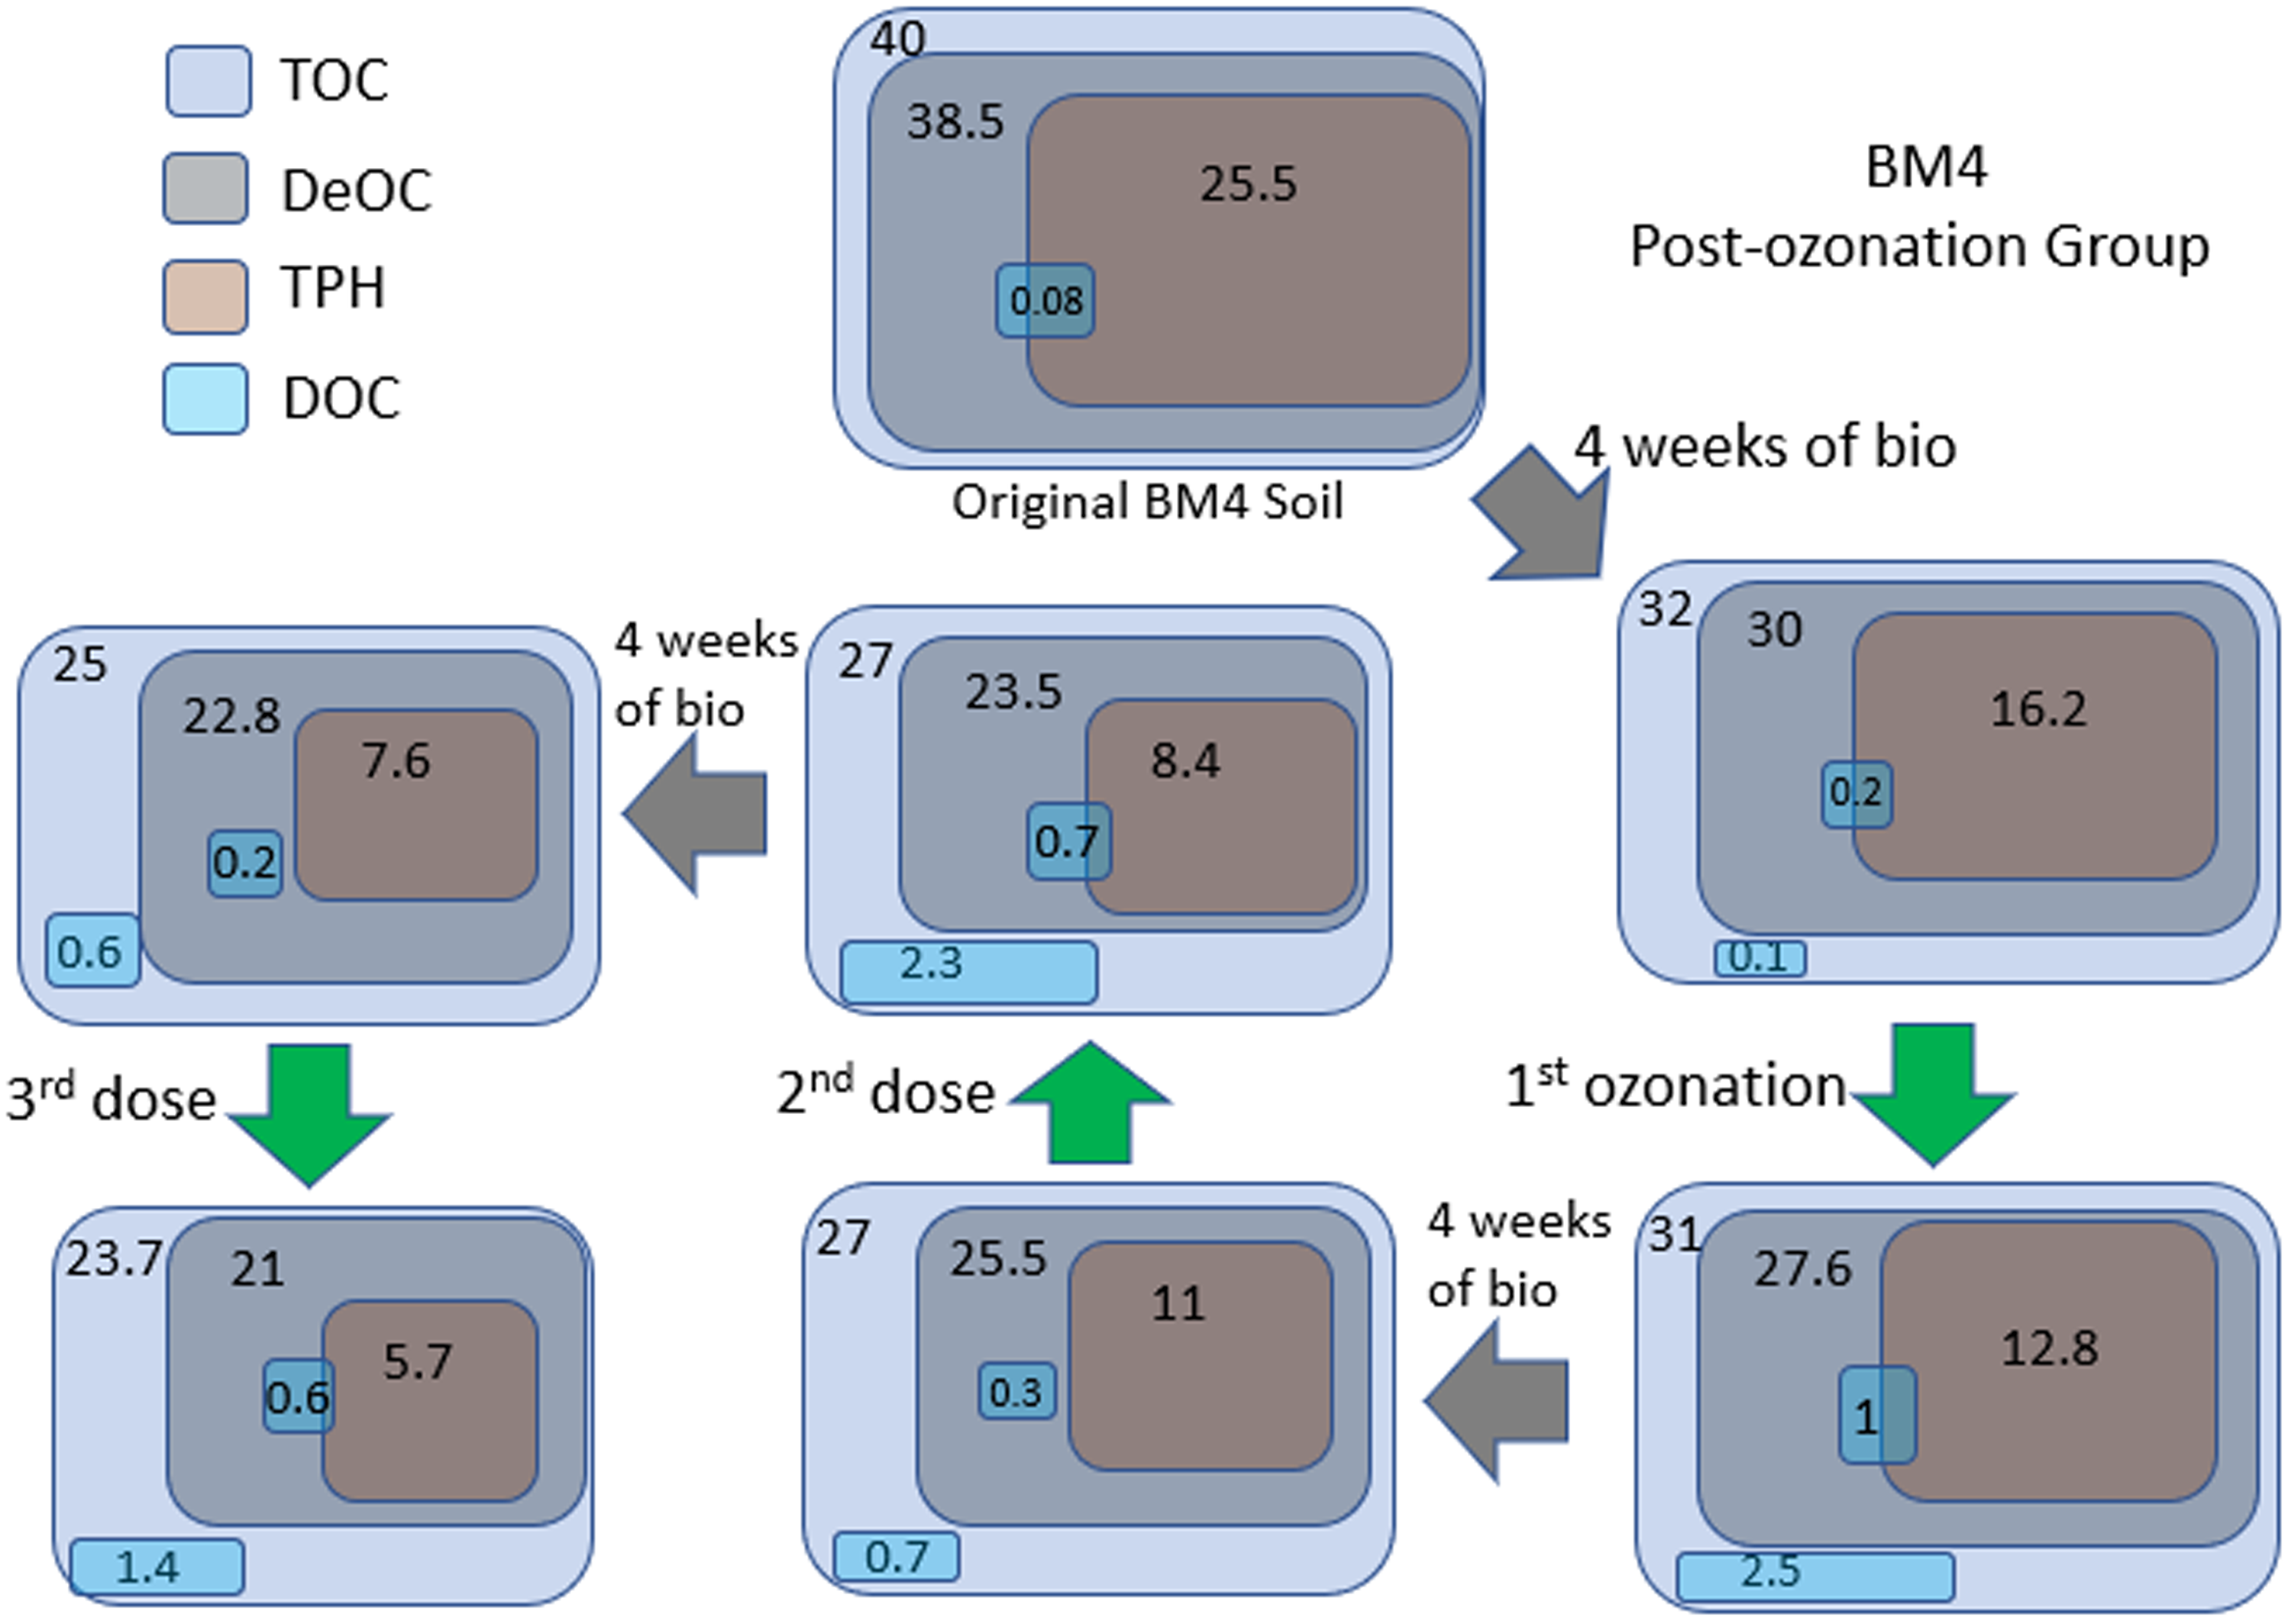
Carbon fate of BM4 during postozonation multicycle treatment. Carbon was divided into four categories: TOC, DeOC, TPHC, and DOC. TPHC was calculated by TPH concentration × 0.85 (assuming 85% of TPH is carbon). The carbon flow chart presents how each category of carbon evolved throughout the treatment process that followed the same timeline as Fig. 4, and the first, second, and third correspond to phases 1, 2, and 3, respectively. Numbers show the mass of C in grams, and the areas are proportional to the mass. The green arrows indicate an ozone dose.
Within the DeOC, TPH always was the more reactive component during ozonation or biodegradation. For example, Fig. 6 shows that the first ozonation removed 3.4 g of TPHC and produced 0.8 g DOC inside DeOC, which created a net loss of 2.6 g, approximately the loss of DeOC. This supports that the change in TOC was mainly controlled by the change of TPHC.
In summary for BM4, the results emphasize that, when relatively recalcitrant TPH was present, ozonation did not directly enhance the biodegradation rate of the persistent TPH. Instead, it converted the residual TPH into more hydrophilic and biodegradable DOC that could be mineralized by microbial metabolism. Ozonation coupled with biodegradation achieved ∼67% removal of TPH and 45% removal of TOC. Delivering the first O3 dose when biodegradation alone reached a plateau (i.e., postozonation) was more efficient for removing and mineralizing recalcitrant TPH. The same overall O3 dose achieved more TPH reduction for postozonation than for preozonation. Therefore, the more recalcitrant residual petroleum of BM4 was better treated with postozonation, although post- and preozonation were equivalent for BM3. Multistage ozonation+biodegradation made it possible to achieve the regulatory TPH standard (10,000 mg/kg) and mineralize >40% of the residual petroleum in soil.
BM4 trends reinforce that TPH should not be the only monitored parameter in determining the performance of a process that integrates ozonation with biodegradation. Ozonation transforms TPH to DOC, which then can be mineralized of DOC to yield a loss of TOC.
Summary
The overarching goal of this was to advance understanding of the synergy between ozonation and biodegradation of residual petroleum in weathered soil. Optimized condition for sequential steps of ozonation and biodegradation made it possible to meet the TPH regulatory standard and mineralize 40–45% of the TOC when biodegradation alone was unable to meet the standard. For the relatively biodegradable TPH in BM3, preozonation and postozonation strategies were equally effective. In contrast, postozonation was more efficient for the less biodegradable TPH in BM4.
Tracking the fate of carbon along the treatment timelines revealed that DOC was the dominant substrate for microbial oxidation when readily biodegradable TPH was no longer available. TPHC was more reactive (during ozonation or biodegradation) than was DeOC, and the fate of TPH dictated the changes of DeOC. In contrast, decreases in TOC relied more on the microbial mineralization of DOC that had been produced by ozonation. While ozonation did not directly enhance the biodegradation kinetics of TPH, it converted TPH into DOC that was subsequently mineralized microbially. The results illustrate that DOC needs to be measured alongside TPH to gauge the dynamics of integrated ozonation+biodegradation.
Footnotes
Acknowledgments
The authors thank Chevron Energy Technology Company for soil samples and funding for this work. The authors also appreciate the effort of Dr. Paul Dahlen on coordination.
Author Disclosure Statement
The authors declare that no actual or potential competing financial interests exist that might compromise the content and the quality of the work presented in this article.
Funding Information
No funding was received for this article.
References
Supplementary Material
Please find the following supplemental material available below.
For Open Access articles published under a Creative Commons License, all supplemental material carries the same license as the article it is associated with.
For non-Open Access articles published, all supplemental material carries a non-exclusive license, and permission requests for re-use of supplemental material or any part of supplemental material shall be sent directly to the copyright owner as specified in the copyright notice associated with the article.