
Abstract
This article dealt with the photocatalytic oxidation of formaldehyde, a representative indoor contaminant contained in air. A numerical model was developed for analyzing the degradation of formaldehyde based on experimentally estimated kinetic parameters. This was achieved by constructing two different configuration reactors operating under kinetic control regime and different steady conditions. The radiation and velocity fields of the reactors were simulated using computational fluid dynamics (CFD) methods. The reactors were installed on an external recirculation loop, and the processed air was reintroduced into a 1.95 m3 environmental chamber. The geometry design made the overall conversion of folded-plate reactor increase almost 40% relative to the plate reactor under a typical run. Studies also found that the overall conversion of formaldehyde showed good agreement between model predictions and experimental performances. The removal performance in the folded-plate reactor was obviously improved by enlarging the reaction area, increasing the residence time, and enhancing the radiation interchange. The relative high degradation efficiency was observed at relatively low relative humidity. The simulation results depicted that the radiation intensity was nearly uniformly increasing with distance along the surface, the velocity distribution was uniform in general, and most of the air passed through the triangular channel from the upper portion. The numerical model and CFD simulations could address a better reactor design and allow a better understanding of photocatalytic processes.
Introduction
The increasing use of synthetic building materials and furnishings, which emit harmful contaminants, has resulted in the gradual degradation of indoor air quality (IAQ) (Huang et al., 2018). Poor IAQ will significantly affect human health and cause economic losses (Boulanger et al., 2017). Volatile organic compounds (VOCs) are among the chemical indoor air pollutants and due to their low boiling points, they are easy to evaporate. Nowadays, the VOC concentrations in indoor air are tending to be higher than that allowed by the standards. Some of VOCs may be associated with sick building syndrome, such as fatigue, allergic reactions, and membrane irritations (Norback et al., 2017).
Formaldehyde (HCHO) is one of the most dominant VOCs and can cause serious indoor air pollution, which makes HCHO the most studied one (Salthammer, 2019). HCHO is the simplest aliphatic aldehyde and has a strong smell at ambient temperature. HCHO is a wildly used chemical in adhesives and emitted from furnishing, carpeting, paints, and cigarettes (Jiang et al., 2017). HCHO's indoor concentration may reach up to 2.5 mg/m3; in this range, it can produce headache, nausea, and eye irritation (Norback et al., 2017). Unfortunately, recent study categorized HCHO as a human carcinogen (Passalía et al., 2012).
Traditional methods of HCHO decontamination include thermal oxidation (Xu et al., 2011), activated carbon adsorption (Sidheswaran et al., 2012), and biological treatment (Aydogan and Montoya, 2011). These methods are not entirely satisfactory, requires high temperature operation, or produce liquid-solid phase secondary pollution, with long retention time.
Photocatalytic oxidation (PCO) is an innovative and promising approach for the quick and economical removal of VOCs from indoor air (Kamal et al., 2016). The air purification technique of PCO commonly uses nano-semiconductor catalysts and ultraviolet (UV) light to convert VOCs in indoor air into benign and odorless constituents, namely H2O and CO2. Titanium dioxide (TiO2) is a widely used photocatalyst and this semiconductor is chemically inert, safe, environmentally friendly, easy to use, and able to catalyze reactions efficiently (Seidmohammadi et al., 2018; Yari et al., 2019). The schematic of PCO process using TiO2 as catalyst is that, when the absorbed photon has sufficient energy, the TiO2 will be irradiated and generate highly reactive electron-hole pairs. Only if the recombination of electron-hole pairs is limited, the generated hole can oxidize the adsorbed hydroxyl groups and form the hydroxyl radical (OH·), that is the dominant strong oxidant. Its net reaction with a VOC can be expressed as OH· +VOC +O2 →CO2+H2O. The PCO process is implemented under ambient temperature and pressure and has the potential to decompose a broad range of VOCs, including some compounds that are hardly mineralized by other techniques (Stucchi et al., 2018). Compared with other advanced technologies, UV-PCO processes using TiO2 have several advantages: (1) the processes are safe, (2) the TiO2 is mild oxidant and not expensive, and (3) the degradation reactions are activated at ambient temperature and with no recontamination.
Various PCO reactors have already been successfully developed for photocatalytic reaction characterization and kinetic measurements; the plate, honeycomb monolith, and annular are three representative types (Mo et al., 2009). The removal rates of these reactors are generally obtained by experimental methods and they are usually expressed with Langmuir-Hinshelwood (L-H) kinetic equation (unimolecular or bimolecular) (Zhong et al., 2017). However, as the constants in L-H equation vary depending on the temperature, UV intensity, and reactor configuration, a lot of experiments are needed. Some numerical models, integrating mass and radiation transfer and heterogeneous reaction kinetics, have been applied for the prediction of otherwise expensive and time-consumptive experiments, providing an understanding of the capability and limitations of the PCO reactor (Nakahara et al., 2017; Wang et al., 2019). Also, these numerical approaches have gradually become a reliable tool to assist reactor design and optimization. Recent reports also demonstrate that computational fluid dynamics (CFD) approach is a powerful tool and its computational capabilities are sufficiently large to simulate very different kinds of processes, including photocatalytic reactions. There have been lots of valuable contributions in the CFD simulating approach for gas-phase photocatalytic reactors (Verbruggen et al., 2015; Gauvin et al., 2018).
In this study, a simple numerical model for evaluating the effectiveness of air contaminant removal in the PCO reactors was introduced. The target pollutant selected was HCHO. Based on the application of experimentally determined kinetic parameters in two different configuration reactors, the prediction and evaluation of the HCHO removal performances were modeled and contrasted. Then, the radiation and velocity fields were simulated using CFD methods. The modeling results could address useful information for the PCO reactor design and optimization.
Materials and Methods
Experimental details
Experimental setup
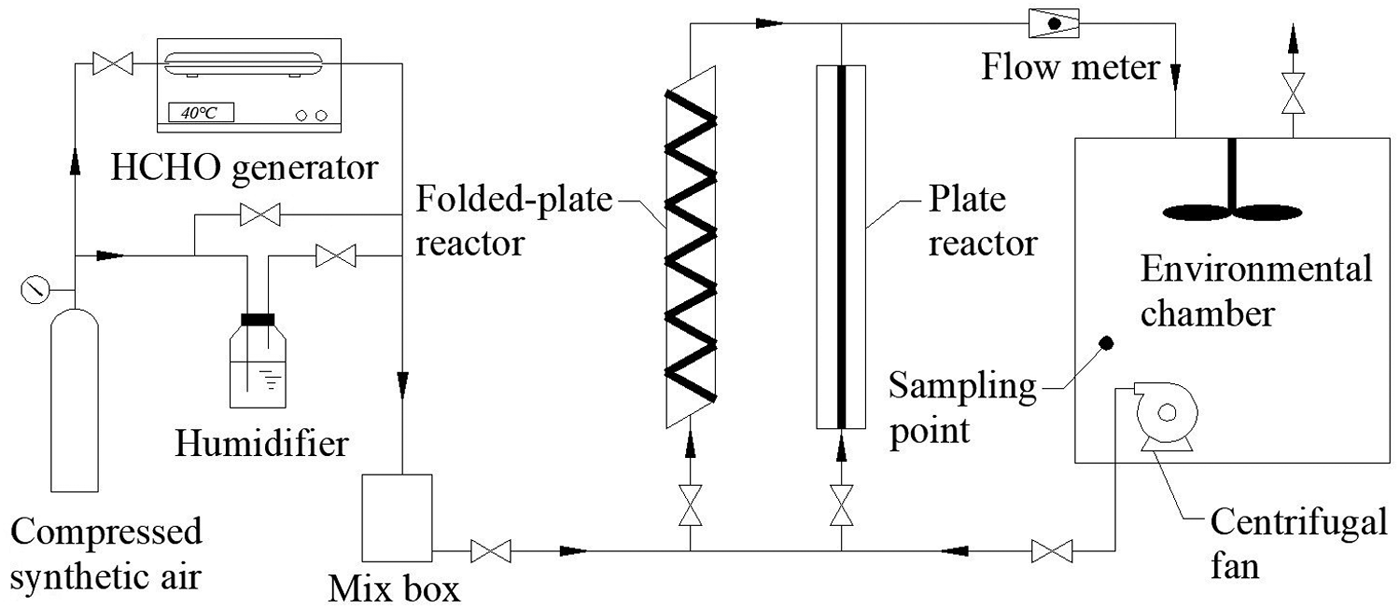
The kinetic parameters were experimentally determined in two different configuration reactors, plate and folded plate (Fig. 1). HCHO was selected as the target air pollutant. The reactors were made of Plexiglas and stainless steel as a support for the TiO2 catalyst. The Plexiglas used to build the reactor wall was transparent. Compressed synthetic air (mixture of O2 and N2 with volume ratio 21:79) was supplied by a compressed cylinder. The purified dry air passed through a mass flow controller and was then divided into two streams. One stream passed through an HCHO generator, while the other passed through a humidifier. The HCHO-enriched air mixed with water vapor saturated stream in the mixing box. The mixed gas was supplied through a mass flow controller to the reactor. The initial HCHO concentration in supply air was controlled from 1.0 to 3.0 ppm. Commercial HCHO aqueous solutions were commonly stabilized with methanol and should not be used to generate gas-phase formaldehyde mixture. For that reason, the HCHO-enriched air was obtained by on-line generation of monomeric gaseous formaldehyde by controlled sublimation of paraformaldehyde.
Experimental layout of reactors.
The reactors were irradiated by two sets of three 15W germicidal lamps (TUV15W PHILIPS, 254 nm) positioned in an aligned arrange. The original radiation intensity from UV lamp was measured before the PCO reaction began, and the value was assumed to remain unchanged during the experiment. For the measurement, a UVC power meter was used with the sensor close to the lamp surface tightly (Shenzhen Linshang Technology Co. Ltd., LS126C, CHN). The UV light spreading out would be reflected back to the plates by the arching reflecting boards. This design could provide enhanced radiation flux over the catalytic surface. The reactors were installed on an external recirculation loop and operated in recirculation mode, by reintroducing processed air into an environmental chamber. The chamber had a volume of 1.95 m3 and was built from gas-tight stainless steel with no VOC sources or sinks. A variable-speed centrifugal fan operating inside the chamber supplied the required recirculation rate. The airflow at the recirculation loop was measured by a mass flow controller (Nanjing SENLOD Measurement and Control Co. Ltd., MF5712-N-200, CHN).
The air samples were collected by Tenax tubes from the chamber, and the samples were analyzed by Agilent GC-MS 5973N. The experimental system was operated for about 15 min without turning on the UV lamp in the reactor to stabilize the concentration of air flowing through the system and to check the initial concentration of HCHO when stabilized. The UV lamp was then turned on to activate the PCO reaction, and the concentration of HCHO was monitored until the experimental system reached a new steady state. The catalyst was regenerated after each experiment by continuous UV illumination and flow of clean air through the reactor overnight.
The plate reactor consisted of a rectangular wall and six stainless steel plates (200 × 40 × 4 mm) connected in parallel (Fig. 2a). It operated in a continuous flow with three inlets/outlets, so a well-distributed flow and air concentration profiles in the cross-section were obtained.
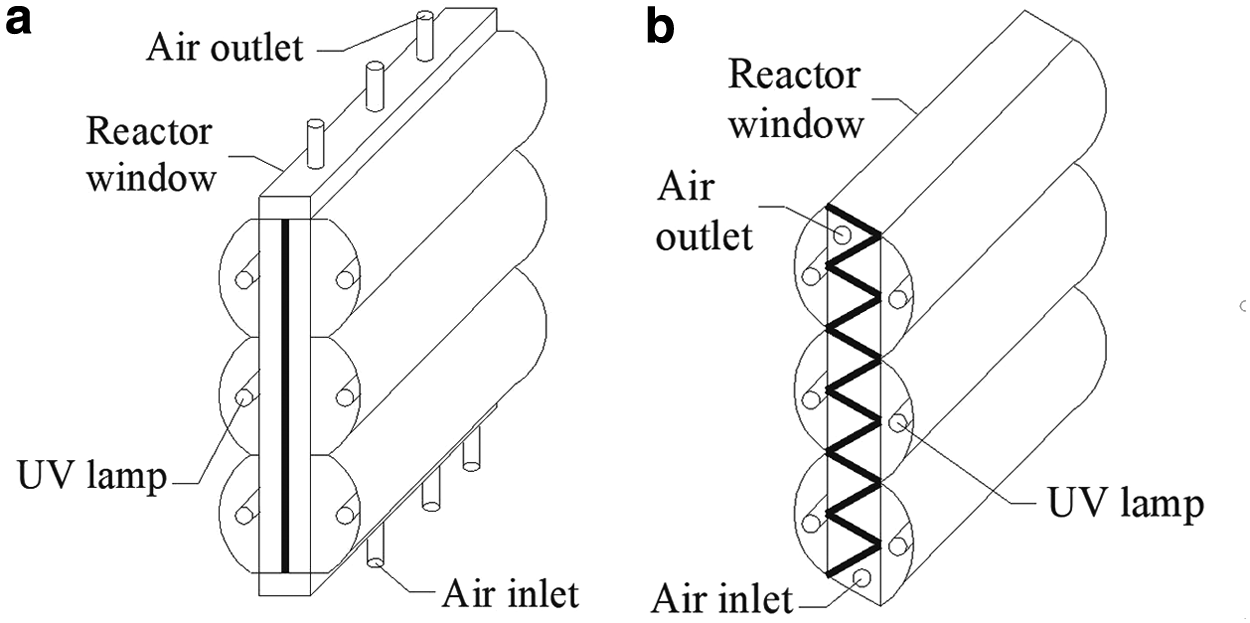
Schematic of the reactors:
The folded-plate reactor had 12 plates (200 × 40 × 4 mm), and adjacent plates were folded into an angle of 60, forming 11 triangular channels inside the reactor (Fig. 2b). Each of the 12 plates had a triangular gap (10 × 40 mm) at one end, thus making this reactor a continuous single-pass reactor. The air pollutants could flow in a zigzag pattern from one channel to another and the changes in direction might act as static mixers that renewed the velocity field of air pollutants.
The two different configuration reactors had the same effective volume, but their reaction area was quite different. The symmetry configuration of the triangular channel in the folded-plate reactor increased the inner space utilization rate; thus, the reaction area was greatly increased and the fractional conversion was, therefore, obviously enhanced. More details on PCO reactor dimensions are shown in Table 1.
Main Characteristics of Reactors
Experimental conditions and methods
The operation conditions were summarized in Table 2. The commercial Degussa P25 TiO2 was used as the photocatalyst, and the TiO2 particles were deposited on the stainless steel plate through a sol-gel process (Ranjitha et al., 2013). P25 TiO2 was used widely in air purification with a primary particle diameter of 300 nm, a surface area of 50 m2/g, and a crystal distribution of 70% anatase and 30% rutile. The TiO2 loading was 1.2 mg/cm2, which was a slight excess to ensure that catalytic surface was fully covered and the experimental results were obtained under kinetic control regime. The temperature was set to a common room temperature level of 25°C ± 1°C. The relative humidity (RH) varied from 40% to 80%. The KANOMAX CLIMOMASTER 6531 tester was used to determine the values of RH and temperature. The value of average UV intensity was assumed to remain inalterable during the PCO reaction.
Summary of Experimental Conditions Used in Each Test
Key parameters for analyzing reactor performance
Fractional conversion η
The fractional conversion, η, proportional to the degraded VOC, is the main parameter influencing the PCO performance. η is expressed as follows (the Chinese National Standard GB/T 18801-2015):
Where V (m3) is the volume of test chamber; G (m3/h) is the volumetric flow rate; and b (h−1) is decay rate constant. The index “e” and “n” represent “total decay” and “natural decay,” respectively.
The mass conservation equation together with initial condition can be expressed as follows:
Where C0 (ppm) is the initial contaminate concentration in test chamber. Ct (ppm) is the concentration at time t (h).
Equation (2) can be used to obtain decay rate constant b by applying the linear regression on the lnCti and ti from the following expression:
The UV radiation intensity Isurface
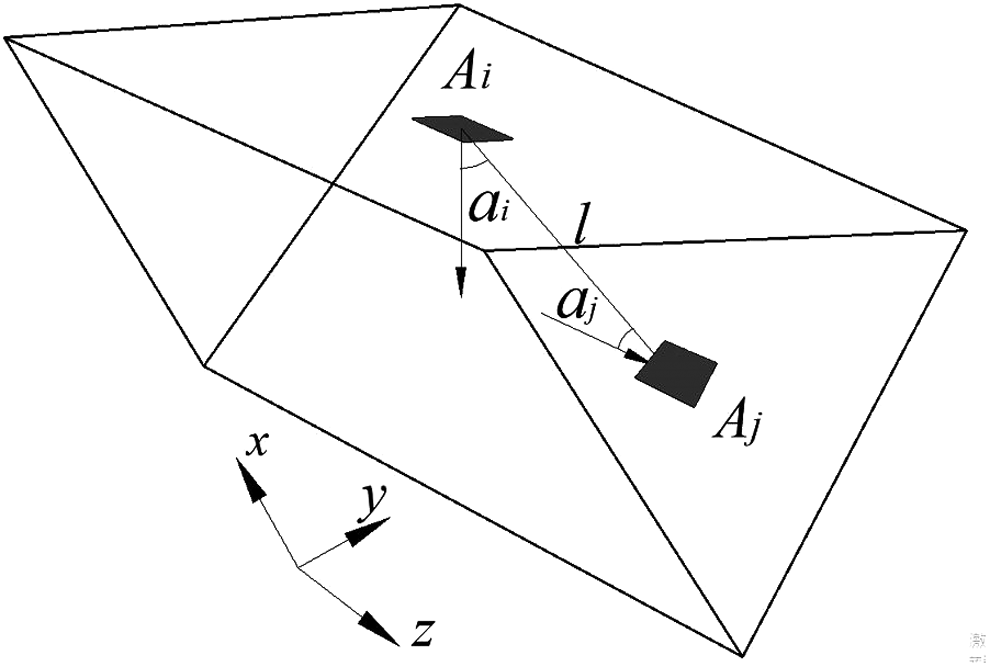
The radiation interchange is modeled involving a triangular prism with one window and two catalytic surfaces (Fig. 3). To simplify the radiation transport analysis, the assumptions are as follows (Zhong and Haghighat, 2011): (1) the window is considered an emitting transparent surface, which lets in uniform radiation coming from UV lamp; (2) the triangular channels of the reactor are identically irradiated by UV lamps, which emit primarily at the wavelength of 254 nm. (3) Irradiance emitted from UV lamp is constant, and the effect of ozone produced by UV light is not taken into account. (4) The gas-phase absorption, reflection, and scattering of UV light are negligible; (5) the catalytic surface is opaque, uniform, and diffused, only can absorb radiation. Therefore, αλ+ρλ = 1 and ɛλ = αλ. Where α, ρ, and ɛ represent the absorptance, reflectance, and emissivity, respectively. Also, the index “λ” represents wavelength.
Radiation interchange in the triangular channel.
Considering the channel symmetry, only one catalytic surface is taken into consideration. The UV radiation intensity on the reaction surface Isurface (W/m2) can be calculated by using absorbed radiation flux q (W) that reaches the area of catalytic surface A (m2). For surface i (Mo et al., 2008),
Where Ji (W/m2) is the total emission UV flux; Eb,i (W/m2) is the blackbody radiation; and ɛλ,i is the emissivity.
For the opaque, uniform, and diffuse surface, ɛλ,i is predicted to be in the range from 0.85 to 0.95. Eb,i can be obtained by the Stefan-Boltzmann low as follows:
Where TK (K) is the thermodynamic temperature of catalytic surface.
Ji is evaluated from the following expression (Mo et al., 2008):
Where ɛλ,iEb,i represents the emission radiation of surface i and N is the total number of all the differential surfaces, including the window and the catalytic surfaces. Fij is the view factor between surface i and j, defined as follows:
Where l (m) represents the distance between surfaces i and j; and ai and aj are the intersection angles. The geometric relationship of ai and aj in the triangular prism is shown in Fig. 3.
The Equation (6) should be solved to calculate J; then, the UV radiation intensity on the catalytic surface Isurface can be obtained. In CFD simulation, Isurface will be imported into Fluent 6.3 as part of the boundary conditions.
Adsorption equilibrium constant K and reaction rate constant k
Assuming that the PCO reaction takes place at constant temperature and under kinetic control regime, and the effect of by-products and the adsorption of water are negligible, the reaction rate r (mol/[m2·s]) can be evaluated from the unimolecular L-H model, expressed as (Hu et al., 2018) follows:
Where C (ppm) is the average concentration adjacent to the reaction surface; K (ppm−1) is adsorption equilibrium constant; and k (mol/[m2·s]) is the reaction rate constant for a given UV radiation intensity.
Equation (8) can be rewritten as follows to fit the experimental data:
K and k are calculated from the slope and intercept of the line fit to the experimental data plotted as 1/r versus 1/C using least-squares methods.
In addition, k is UV light-intensity dependent. Hossain et al. (1999) presented a modification formula. For that,
Where I0 is the original radiation intensity from UV lamp for which the reaction rate constant k0 has been evaluated. Sλ is the one sun equivalent under the λ wavelength.
For λ = 254 nm, Sλ is equal to 1 mW/cm2 (Obee and Brown, 1995).
Numerical model
Assuming the gas-phase concentrations over the catalytic surface are uniform throughout the system, the mass balance equation for HCHO in the text chamber will be written as follows:
Where m is the mass of photocatalyst and g is the amount of HCHO adsorbed per unit weight of the photocatalyst.
Based on the Langmuir model for monolayer adsorption, g can be evaluated from the following expression (Mo et al., 2009):
Where g0 is the maximum amount adsorbed per unit weight.
Substituting Equations. (8), (10), and (12) into Equation (11) gives the following equation:
The solution of Equation (13) is as follows:
Ct can be calculated and predicted by solving Equation (14) with the Isurface, I0, k0, and K as the boundary conditions on the reaction surface. Following that, the modeling value of η can be derived by solving Equations (1)–(3).
CFD simulation
Conservation equations
The CFD simulation of the fluid flowing through the reactor involves the solution of the Navier–Stokes equations, which is described by the equation of momentum for the horizontal system:
Where ρ is the fluid density,
The mass conservation equation is given as follows:
Where D is the diffusion coefficient of HCHO in air. The continuity equation, used to describe the mass conservation, is as follows:
Boundary conditions
A velocity magnitude and the HCHO concentrations are set as boundary conditions. At the inlet, Equations (15)–(17) are subjected to the boundary conditions:
At the reactor surfaces,
Heterogeneous reaction in the system also appears as boundary conditions. For reaction surface, the HCHO diffusion flux equals to the heterogeneous reaction rate R (Obee, 1996):
For nonreaction surface,
In addition, the equation of radiation balance (Isurface) is evaluated and introduced as part of the boundary condition. The resolution of the complete set of governing equations is achieved in Fluent 6.3 (Fluent, Inc.). Using Fluent, the velocity and radiation distributions subject to the imposed boundary conditions can be achieved. Gambit 2.3 is applied to develop a simplified geometric model of the PCO reactor, which is conducted under the hypothesis that the fluid is incompressible and the influent and effluent tubing is not in computation. The three-dimension domain is meshed with hexahedral volume cells aligned with the main direction of the triangular channel. Considering the relatively high range of the Reynolds numbers, the standard k–ɛ turbulence model is applied.
Results and Discussion
Comparison of model and experimental results
Table 3 listed the regression parameters and showed a comparison of experimental data with model results for two different configuration reactors under a typical run. The η of plate reactor was not satisfactory because of the smaller reaction area (Table 1) and shorter residence time; it was possible to get large convective mass transfer rate, but the transfer rate did not match the reaction rate. The two reactors had the same effective volume, but due to the axial symmetry configuration, the reaction area of folded-plate reactor was almost doubled, the residence time was significantly increased, and radiation interchange could be found on the catalytic surface. Consequently, the geometry design made the η of folded-plate reactor increase almost 40% relative to the plate reactor, which was generally satisfactory. In addition, Table 3 depicted that the relative difference between the experimental data and model results was not obvious, which meant that this model was capable for predicting the experimental results with a high level of confidence.
The HCHO Removal Performances of Two Different Configuration Reactors: Plate and Folded Plate
inlet concentration: 1.5 ppm; RH: 40%; inlet flow rate: 5.0 m3/h.
RH, relative humidity.
The experiments were made for five operating conditions with different inlet concentrations and RH (Table 2). The overall conversions from the model were contrasted to the experimental results. The comparison was depicted in Fig. 4. From Fig. 4a, it could be seen that agreements were found between model and experimental results. The model and experimental results had a difference of 5.2%–11.4% and the model data were comparatively higher; this meant that the model results were not fairly good, but the model was already helpful enough for various PCO reactor design, optimization, and control.

Model and experimental data for HCHO:
Figure 4b showed a comparison of the removal performance between plate and folded-plate reactor, it was obvious that the folded-plate reactor was better. The PCO reactors were operated for about 20 min without turning on the UV lamp to stabilize and measure the initial concentration of HCHO. The curves decreased a little within the first 20 min because of the adsorption steps before degradation, which played an important role in the PCO process. With turning on the UV lamp, the HCHO itself was oxidized quickly in the initial stage; then, the degradation rate gradually dropped down until the concentration became stable again. This was mainly because the active sites on reaction surface were gradually blocked by the reactants and intermediates (Mahmood et al., 2019). We also noted that the model data correlated well with the experimental results based on the corresponding point matching, even though the model results were comparatively lower. The differences between model and experimental results found herein might be explained as the generation of intermediates, adsorbed onto the catalyst and blocking the active sites, was ignored with the Langmuir-Hinshelwood rate equations.
Furthermore, Fig. 4a also showed that whatever the initial HCHO concentration increased to, the relative high values of η were obtained always at low RH values. The water vapor level played an extremely important role in photocatalytic degradation. Under UV illumination, the water molecules adsorbed on the photocatalyst would lead to the generation of OH·, which was the dominant strong oxidant for gas-phase contaminant decomposition (Lee et al., 2016). The influence of water molecules on PCO reactions followed the adsorption competition relationship, the excessive water molecules competed with HCHO for adsorption sites and hastened the HCHO release from the reaction surface; thus, PCO reaction rate would be seriously retarded (Mo et al., 2013). Furthermore, the presence of water molecules would accelerate the recombination of electron-hole pairs, thus reducing the removal rate (Qi et al., 2017). In our study, the competitive adsorption was significant; therefore, lower water vapor concentration resulted in higher decomposition.
CFD-predicted results
Radiation field
Figure 5 depicted the predicted radiation distribution over one catalyst plate of the triangular channel for the folded-plate reactor. The UV radiation intensity was increasing uniformly with distance into the channel, except for the ends. The position of the UV lamp relative to the catalytic surface (Fig. 2b for geometry details) affected radiation intensity and the closer the lamp to the surface, the stronger radiation field that was formed. Therefore, radiation intensity over the upper half of the catalyst plate was relatively stronger.
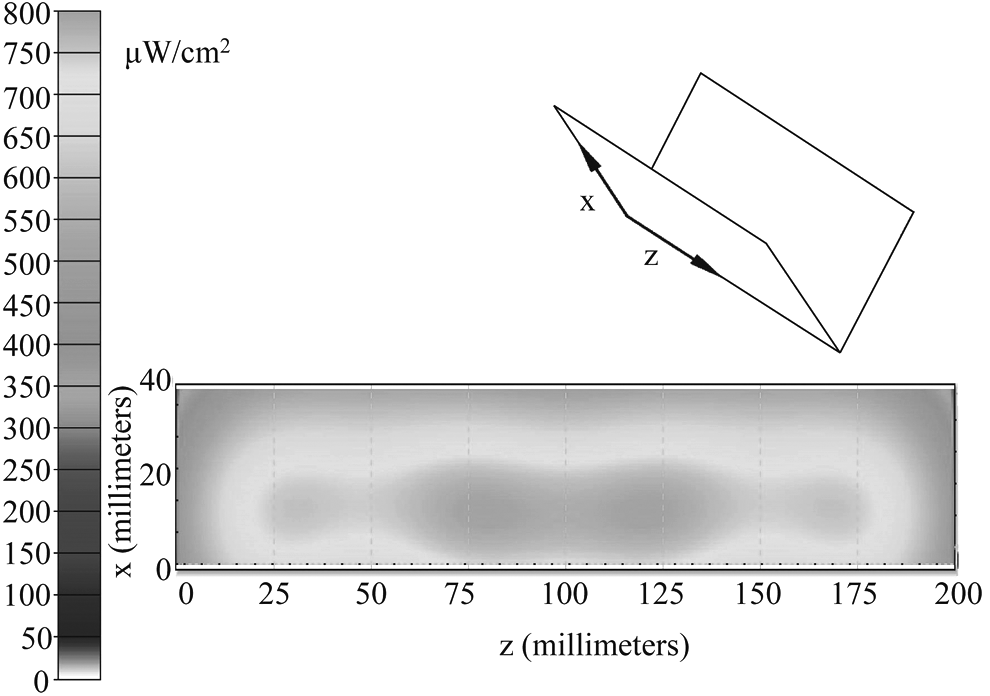
Radiation intensity distribution on the catalytic surface.
Velocity field
The behavior of the air flow was simulated before the photocatalytic decomposition. Figure 6 illustrated the predicted velocity field for the folded-plate reactor under a typical operating condition. As shown in Fig. 6a, the air flow distribution in horizontal direction was comparatively uniform in general and it was actually higher near the elbows due to the narrow widths there. Figure 6b and c illustrated the velocity field in the cross-section and vertical section. Because the presence of catalytic plates introduced a nonnegligible flow resistance, the closer the air flow to the bottom of triangular channel, the less uniform the velocity field was; most of the air flow passed through the triangular channel from the upper portion. This could result in low mass transfer rate at the bottom of triangular channel even if the reaction rate was high there and it could influence the completed adsorption and oxidation processes, causing insufficient utilization of the photocatalyst.
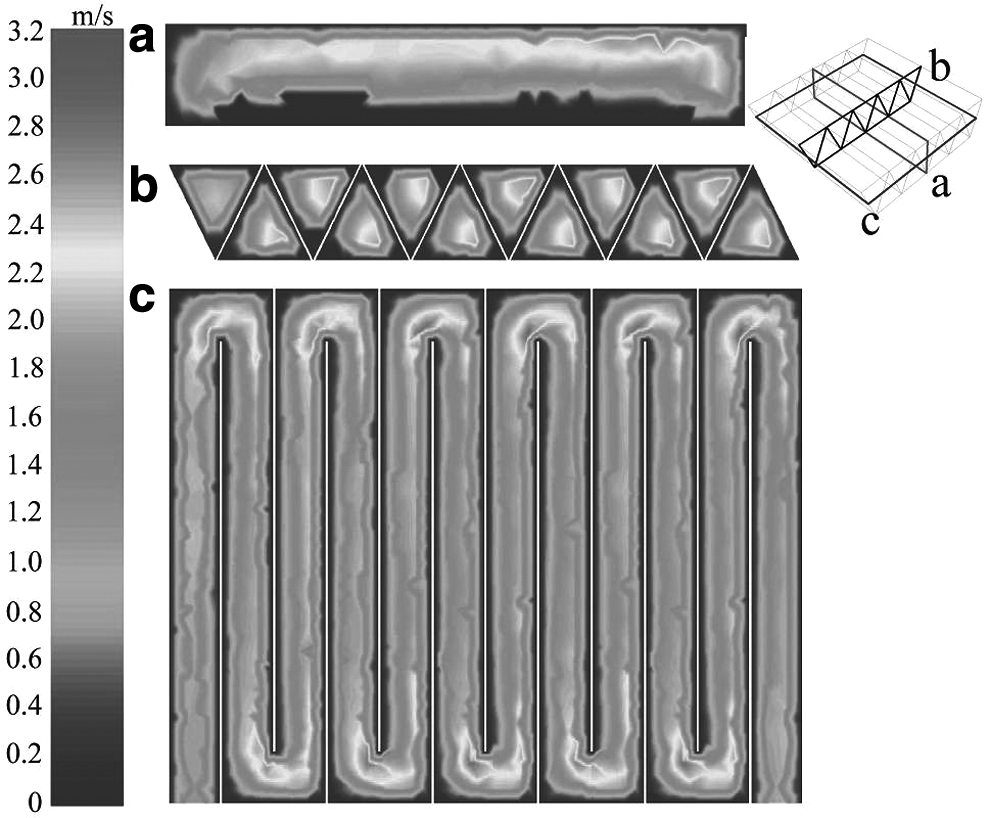
Predicted velocity field (m/s) for a typical run.
Conclusion
A simple numerical model was developed for analyzing HCHO removal performance of the PCO reactors, taking into consideration radiation intensity and L–H reaction kinetics. The photocatalytic degradation of HCHO had been measured, modeled, and contrasted in two different configuration reactors. Results showed that the overall conversions from numerical model, based on the computation of view factors, reaction rate constant, and the adsorption equilibrium constant, were validated with experimental results under five operating conditions. In this process, the folded-plate reactor was more efficient because of the symmetrical channels enlarging the reaction area, increasing the residence time and enhancing the radiation interchange. High degradation efficiency was obtained at relatively low RH. CFD simulation methods allowed the resolution of radiation and velocity fields in a complex geometry reactor. The simulation results depicted that the radiation intensity was uniformly increasing with distance into the channel, the velocity distribution was uniform in general, and most of the air passed through the channel from the upper portion. Consequently, the simple numerical model was successfully applied for PCO reactors; the CFD simulations could address a better reactor design and allow a better understanding of photocatalytic processes.
Footnotes
Author Disclosure Statement
No competing financial interests exist.
Funding Information
The Science and Technology Planning Projects of Guizhou (Grant No. QKHLHZ[2017]7242); The Academic Training & Exploration Project of Guizhou University (Grant No. QKHPTRC[2017]5788); and The Scientific Research Foundation of Talent Introduction of Guizhou University (Grant No. GDRJHZ[2015]22).