
Abstract
Abstract
A highly effective modified walnut shell (MWNS) adsorbent was prepared by reacting walnut shell with maleic anhydride, and was characterized through Fourier transform infrared, X-ray photoelectron spectroscopy, and point of zero charge analysis. Adsorption behavior of metal ions (Pb2+ and Ni2+) onto MWNS was studied. Adsorption kinetics were fitted with pseudo-first-order, pseudo-second-order, Elovich, and intraparticle diffusion models. Isotherms data were analyzed using Langmuir, Freundlich, and Dubinin–Radushkevich models, and the feature concentration (CeD) for Pb2+ was determined. Results showed that the maximum monolayer adsorption capacity for Pb2+ of MWNS is 383.50 mg/g at 318 K obtained from Langmuir model. Also, the Pb2+ adsorption onto MWNS is monolayer chemisorption at Ce < CeD, and multilayer physisorption at Ce > CeD, while the Ni2+ adsorption onto MWNS belongs to heterogeneous multilayer physisorption. Competitive adsorption experiment of Pb2+ and Ni2+ in binary system was carried out. Material Studio (Adsorption Locator) was applied to determine the adsorption location between MWNS and metal ions, and the results can explain the priority adsorption of Pb2+.
Introduction
Heavy metal pollution poses great threats to both human and environment due to its high toxicity, nonbiodegradability, and carcinogenic nature.
Lead, a cumulative poison, is generated by several industries, such as acid battery manufacturing, metal plating and finishing (Qian et al., 2016), and fertilizer and pesticide industries (Nafisur and Uzma, 2014). It can cause significant harmful physiological effects, primarily affecting the nervous, renal, hepatic, and hematopoietic systems (Kalia and Flora, 2005). In addition, chronic toxicity of lead also causes symptoms, including paralysis, convulsions, coma, ataxia, and lack of coordination (Flora et al., 2006). The maximum permissible limit of lead in drinking water is 0.01 mg/L (World Health Organization, 1993).
Nickel, an essential metal for organism (Chen et al., 2009), is another heavy metal used in different industries, such as battery and accumulator manufacturing, mining production, electroplating, paint formulation, porcelain enameling, dying, pigment, and paper industries (Abbas et al., 2016; Suhaib and Tushar, 2018). The permissible level of nickel in drinking water is 0.01 mg/L according to the World Health Organization (Panneerselvam et al., 2011). The nickel concentration beyond permissible levels can cause gastrointestinal distress, skin dermatitis, and kidney and lung problems (Alomá et al., 2012; Zhou et al., 2018).
Considering the toxicity, various methods are developed for the removal of heavy metals in wastewater, including precipitation (Kavak, 2013), electrochemical treatment (Meunier et al., 2006), membrane separation (Juang and Shiau, 2000), and adsorption. Adsorption is an efficient methodology and is used to remove odor, heavy metal ions, and organic pollutants.
Several kinds of adsorbents are applied in adsorption process, such as activated carbon, nanostructure materials [e.g., mesoporous carbon, zeolite, and nanofiber (Islama et al., 2015)], clay materials [e.g., bentonite, montmorillonite, and kaolinite (Badawi et al., 2017)], and industrial and agricultural materials [e.g., mango kernel (Akram et al., 2017), orange peel (Feng and Guo, 2012), coffee husks (Oliveira et al., 2008), and tea leaves (Ahluwalia and Goyal, 2005)]. The agricultural byproduct walnut shell (WNS) is an available abundant agricultural waste with low price in China, and it is mainly composed of cellulose, hemicellulose, and lignin, which have various functional groups such as hydroxyl or phenolic groups and ketones (Zafar et al., 2015). These groups could act as coordination sites to bind metal ions.
Chemical modification of WNS without changing its fundamental skeleton could introduce new functional groups to change the physicochemical properties of the surface, and can enhance the performances for the removal of metal ions from wastewater. Attarad et al. (2018) described the fabrication of silver and zinc oxide nanoparticle-impregnated cellulose (AgCt and ZnCt) for the removal of metal ions. The maximum adsorption capacity for Pb2+ (or Ni2+) removal obtained with Langmuir is 43.81 mg/g (or 101.2 mg/g) (ZnCt) and 92.22 mg/g (or 222.9 mg/g) (AgCt). Azhar et al. (2017) designed hydroxyethylcellulose succinate-Na (HEC-Suc-Na), which was evaluated for removal of some heavy metal ions. Maximum adsorption capacities of supersorbent HEC-Suc-Na for heavy metal ions from aqueous solution as calculated by Langmuir model were found to be 1000 and 500 mg/g for Pb(II) and Ni(II), respectively.
Our laboratory prepared two kinds of modified walnut shell (MWNS) by grafting acrylic acid (Cheng et al., 2016) and maleic anhydride (MAH) (Li et al., 2019). However, the maximum adsorption capacity for Pb(II) of the MWNSs is limited (lower than 1.2 mmol/g) by the fact that the grafting yield cannot be further increased due to the self-polymerization of the acrylic acid or the lower boiling point of the solvent (Li et al., 2018). On the other hand, the previous work has mainly focused on the adsorption of single metal ion. Therefore, it is necessary to prepare a new MWNS adsorbent with higher adsorption capacity and investigate competitive adsorption of two metal ions onto MWNS in binary system.
In this article, a highly effective MWNS adsorbent was prepared by the reaction between WNS and MAH in a solvent with high boiling point. The applicability of MWNS was evaluated by removing Pb2+ and Ni2+ from aqueous solution. The effects of several factors (initial pH, contact time, initial concentration, and temperature) on the adsorption property of MWNS were investigated. Adsorption behavior (kinetics and isotherms) of the two ions onto MWNS was studied in the temperature range of 298–318 K. Competitive adsorption of Pb2+ and Ni2+ onto MWNS in binary system was also studied, and the mechanism was further discussed through molecular simulation based on Material Studio.
Methods
Reagents
MAH was obtained from Westlong Biochemical Technology Co., Ltd. N-methyl pyrrolidone (NMP), hydrochloric acid (35 wt%), HNO3 (98 wt%), NaCl, and NaOH were supplied by Shanghai Titan Scientific Co., Ltd. Lead (II) nitrate and nickel (II) nitrate hexahydrate were purchased from Shanghai Macklin Biochemical Co., Ltd. All the reagents involved were of analytical reagent (AR) grade.
Analysis
Fourier transform infrared (FTIR) and X-ray photoelectron spectroscopy (XPS) were performed using a Nicolet MQGNA-IR 550 (Thermo Electron Corp.) adopting KBr pellet and an ESCALAB 250Xi photoelectron spectrometer (Thermo Fisher Scientific), respectively. The pH at the point of zero charge (pHPZC) of MWNS was determined in 0.1 mol/L NaCl solution in the initial pH (pHi) range of 2.0–12.0 (Chen et al., 2010). The initial pH was adjusted by the addition of 0.1 mol/L HCl or NaOH solution on a digital pH meter. The final pH (pHf) was measured after adding MWNS to the above solution for 24 h, and the values of ΔpH (ΔpH = pHf–pHi) could be obtained. The concentration of metal ion was analyzed by Atomic Absorption Spectrometer (AAS, ZEEnit 600 model).
Modified WNS preparation
WNS, collected from farmers' shopping mall, was first crushed and sieved to the desired diameter (75–150 μm), then washed with deionized water, and dried until complete dryness. Dried WNS (20 g), MAH (32 g), and NMP (160 mL) were added in a 500 mL three-necked flask with mechanical stirring at 90°C for 4 h. The obtained powers were filtered, washed three or four times with deionized water, dried to a constant mass, and stored for further use. The modification reaction involved is shown in Supplementary Fig. S1. The carboxyl value of MWNS was measured by the detailed method (seen in Supplementary Data) according to the previous article (Li et al., 2019), and the result is 4.895 mmol/g.
Adsorption experiments
Adsorption experiments were performed by mixing 0.16 g MWNS with 100 mL metal ion solution in 250 mL stoppered Erlenmeyer flasks. The flasks were placed in a thermostatic water bath with vigorous shaking. The effect of initial solution pH was investigated in initial metal ion concentration of 5.0 mmol/L (1036.0 mg/L for Pb2+ and 293.3 mg/L for Ni2+) at 298 K, and the variation ranges of pH were 1.0–5.0 for Pb2+ and 1.0–7.0 for Ni2+. The pH was adjusted by adding HNO3 or NaOH solution.
The kinetics tests were conducted at 298–318 K from 0 to 420 min. At selected time intervals (15, 30, 45, 60, 90, 120, 180, 240 … 420 min), the sample solution was analyzed by AAS. The adsorption capacity at time t, qt (mg/g), was calculated as
where C0 and Ct (mg/L) represent the metal ion concentration initially and at time t, respectively. w (g) and V (L) are the adsorbent mass and the solution volume, respectively.
The effect of initial concentration and temperature was studied by determining the isotherms with different initial concentrations (0.5–10.0 mmol/L for Pb2+ and Ni2+, that is 103.6–2072.0 mg/L for Pb2+ and 29.3–586.9 mg/L for Ni2+) at 298–318 K. The equilibrium adsorption capacity qe (mg/g) was calculated through Equation (1), in which Ce, the equilibrium concentration of metal ion (mg/L), was substituted for Ct.
Competitive adsorption tests of Pb2+ and Ni2+ were conducted by mixing 0.16 g MWNS with 100 mL solution containing Pb2+ (5.0 mmol/L, that is 1036.0 mg/L) and Ni2+ (5.0 mmol/L, that is 293.3 mg/L) for 10 h at 298 K, and the variation ranges of pH were 1.0–5.0.
All the tests were repeated thrice and the mean values were reported with the standard deviations <3%.
Adsorption capacity of WNS for Pb2+ and Ni2+ in single solution was measured. The detailed description of the experimental procedures can be seen in Supplementary Data, and the result is shown in Supplementary Table S1. Competitive adsorption tests of Pb2+ and Ni2+ onto WNS were carried out. The detailed information can be found in Supplementary Data, and the result is also shown in Supplementary Table S1.
Results and Discussion
Characteristics of MWNS
FTIR spectra of WNS and MWNS are presented in Supplementary Fig. S2. From Supplementary Fig. S2, the new bands with peak maximums at 1740 cm−1 (C = O stretching vibration of ester or carboxylic acid) and 1650 cm−1 (cis C = C stretching vibration) correspond to motions associated with MAH grafted on MWNS surface.
The curve fitting XPS spectra (C 1s) of WNS and MWNS are shown in Fig. 1, and detail analysis is listed in Table 1. From Fig. 1, the C 1s spectra of MWNS are different from those of WNS. From Table 1, the area ratio for C-OH/C-O-C decreases from 45.1% to 27.4%, and that for COOH/COOR increases from 2.1% to 10.2%. These results suggest that MAH reacts with hydroxyl groups on WNS, that is, MAH is successfully grafted to the surface of WNS.
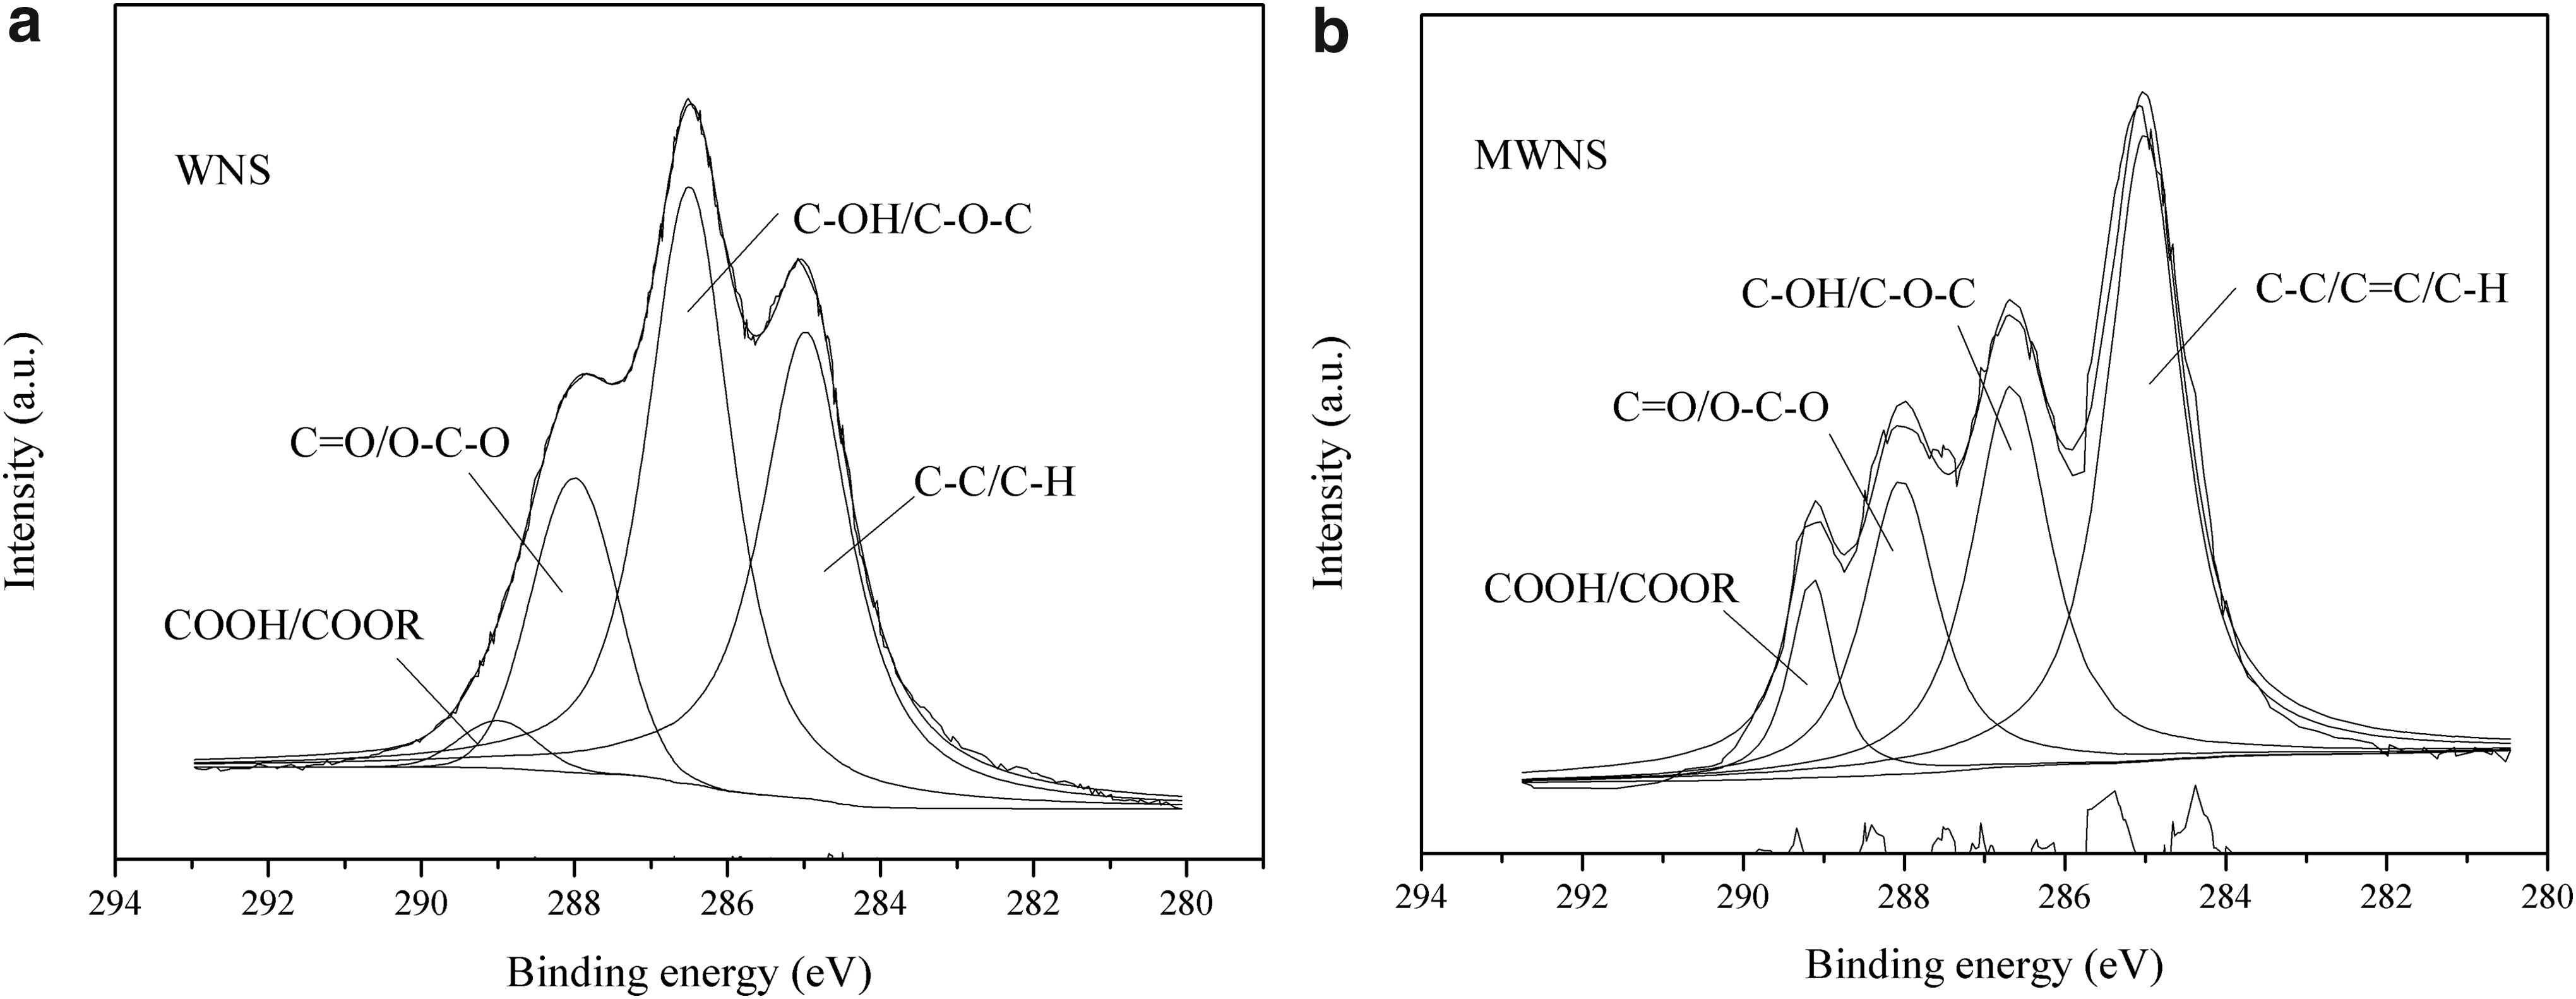
X-ray photoelectron spectroscopy spectra of
Area Ratios of C 1s Spectra of Walnut Shell and Modified Walnut Shell
MWNS, modified walnut shell; WNS, walnut shell.
Figure 2 presents the plot of the ΔpH versus pH of MWNS. The pHPZC is determined from the point of intersection of the curve and the x-axis, and is about 2.9, which is lower compared with WNS-MAH (3.3) (Li et al., 2019). That may be due to the higher carboxyl value of MWNS compared with WNS-MAH (2.80 mmol/g) (Li et al., 2018). If pH > pHPZC, MWNS exhibits the negatively charged surface (R-COO−), mainly because of the dissociation of -COOH from MAH, which could favor the adsorption of the positively charged metal ion.
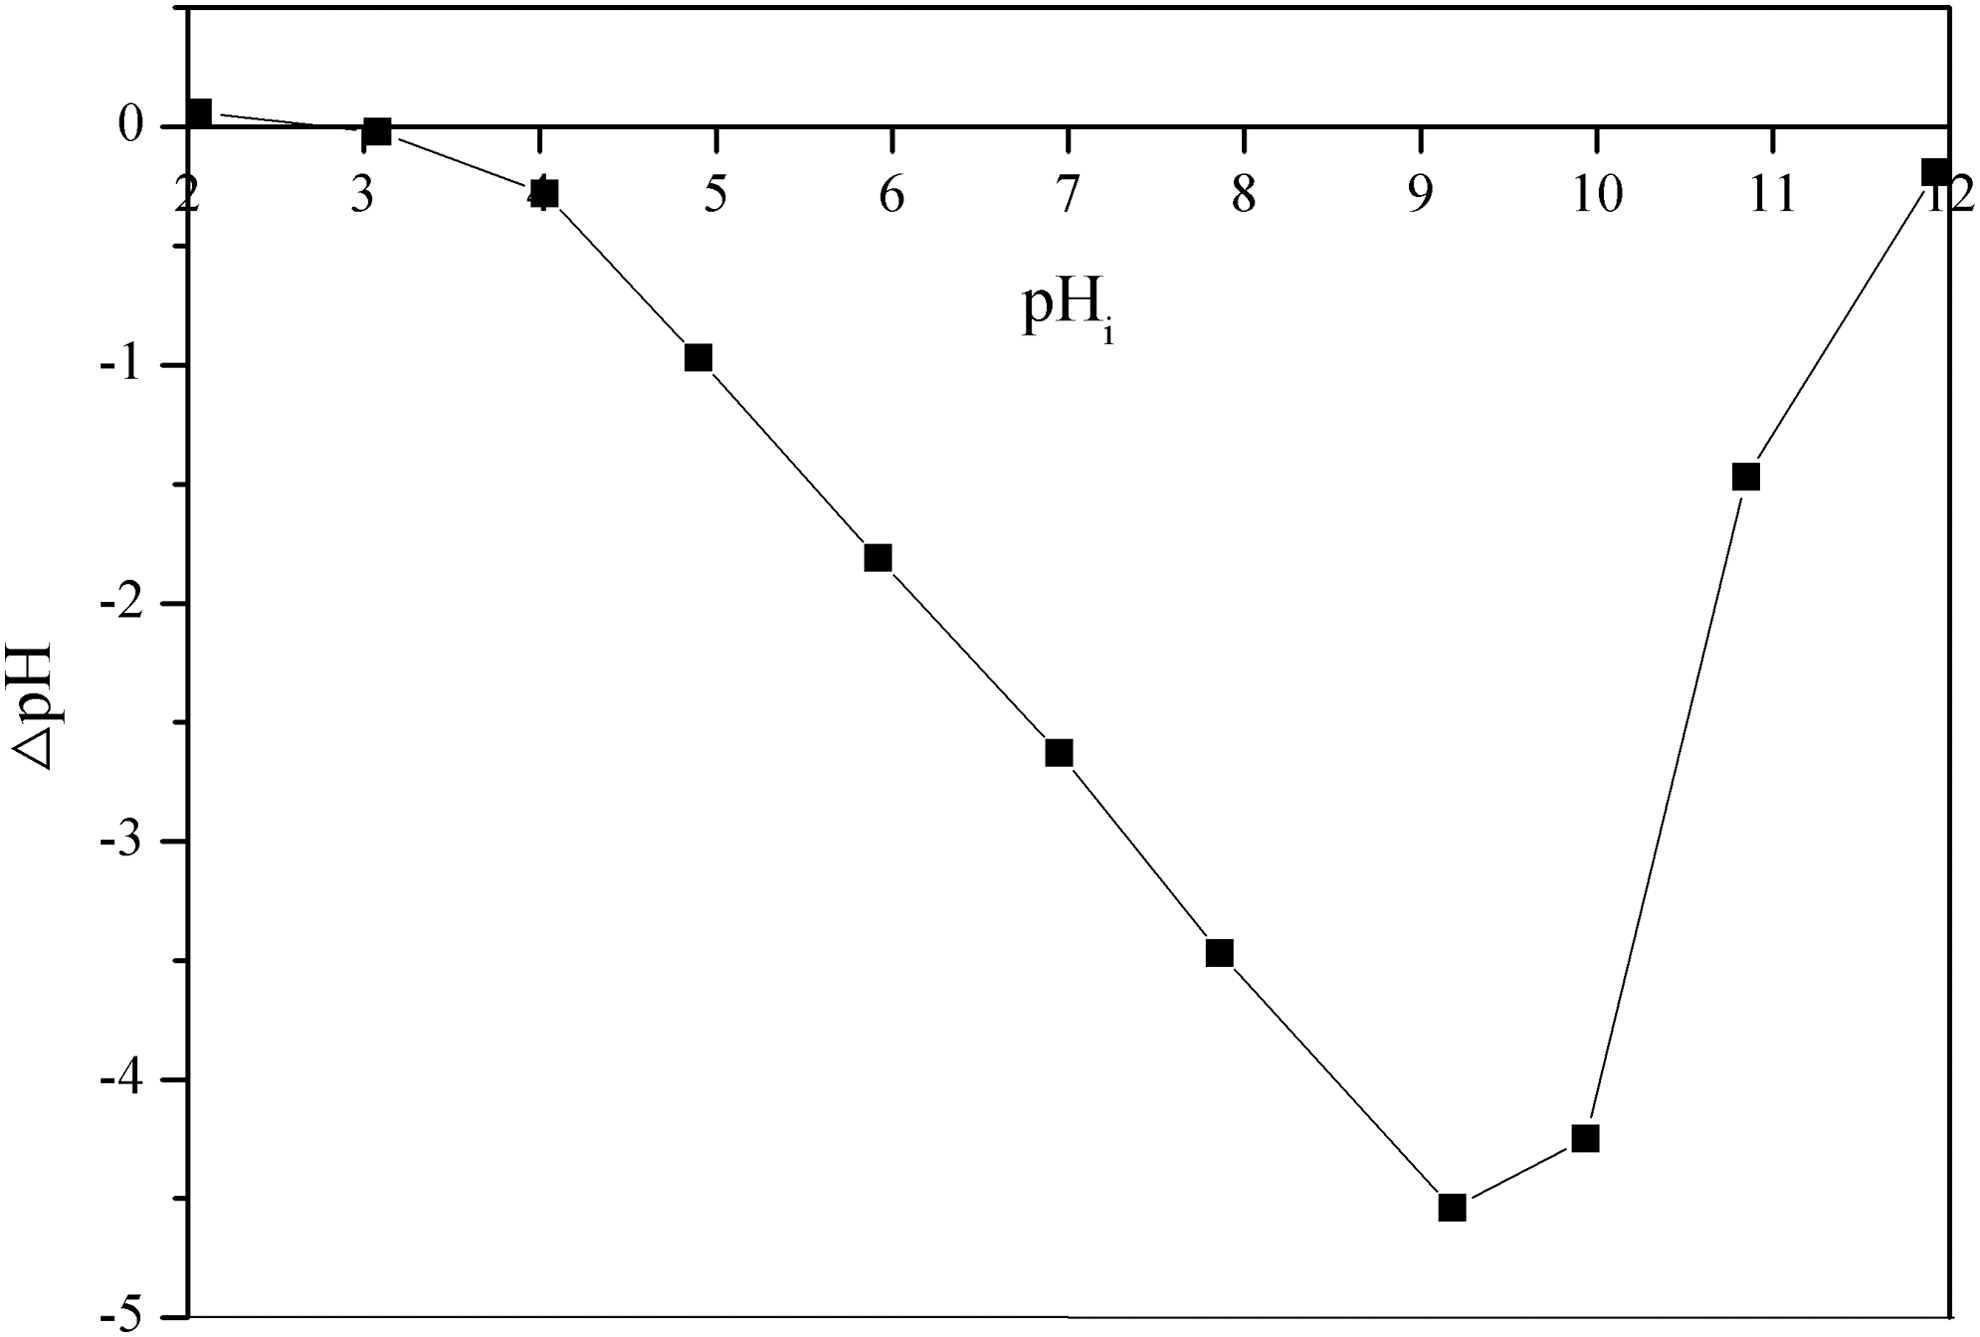
Plot of ΔpH versus pHi to determine the pHPZC.
Effect of initial pH
Because insoluble metal hydroxide begins to form from 5.0 mmol/L metal ion (M2+) solution when pH >5.23 for Pb2+ and pH >7.52 for Ni2+, the effect of initial pH on Pb2+ and Ni2+ adsorption from single aqueous solution was studied in the pH range of 1.0–5.0 for Pb2+ and 1.0–7.0 for Ni2+. Also, the results are presented in Fig. 3. From Fig. 3, the adsorption capacity of Pb2+ and Ni2+ increases gradually at low pH (pH < pHPZC) due to the competition between H+ and M2+. Furthermore, at low pH, a large amount of H+ ions will hinder the dissociation of carboxyl on the surface of MWNS, and the interaction between binding sites on the surface of MWNS and M2+ is weak. The increase in pH (pH > pHPZC) leads to dissociation of carboxyl, which increases the adsorption tendency for M2+, and consequently increases the adsorption capacity of adsorbent. In this way, the highest adsorption capacity was obtained approximately at pH of 5.0 for Pb2+ and 7.0 for Ni2+, respectively. Therefore, the subsequent experiments were carried out at pH of 5.0 for Pb2+ and 7.0 for Ni2+, respectively.
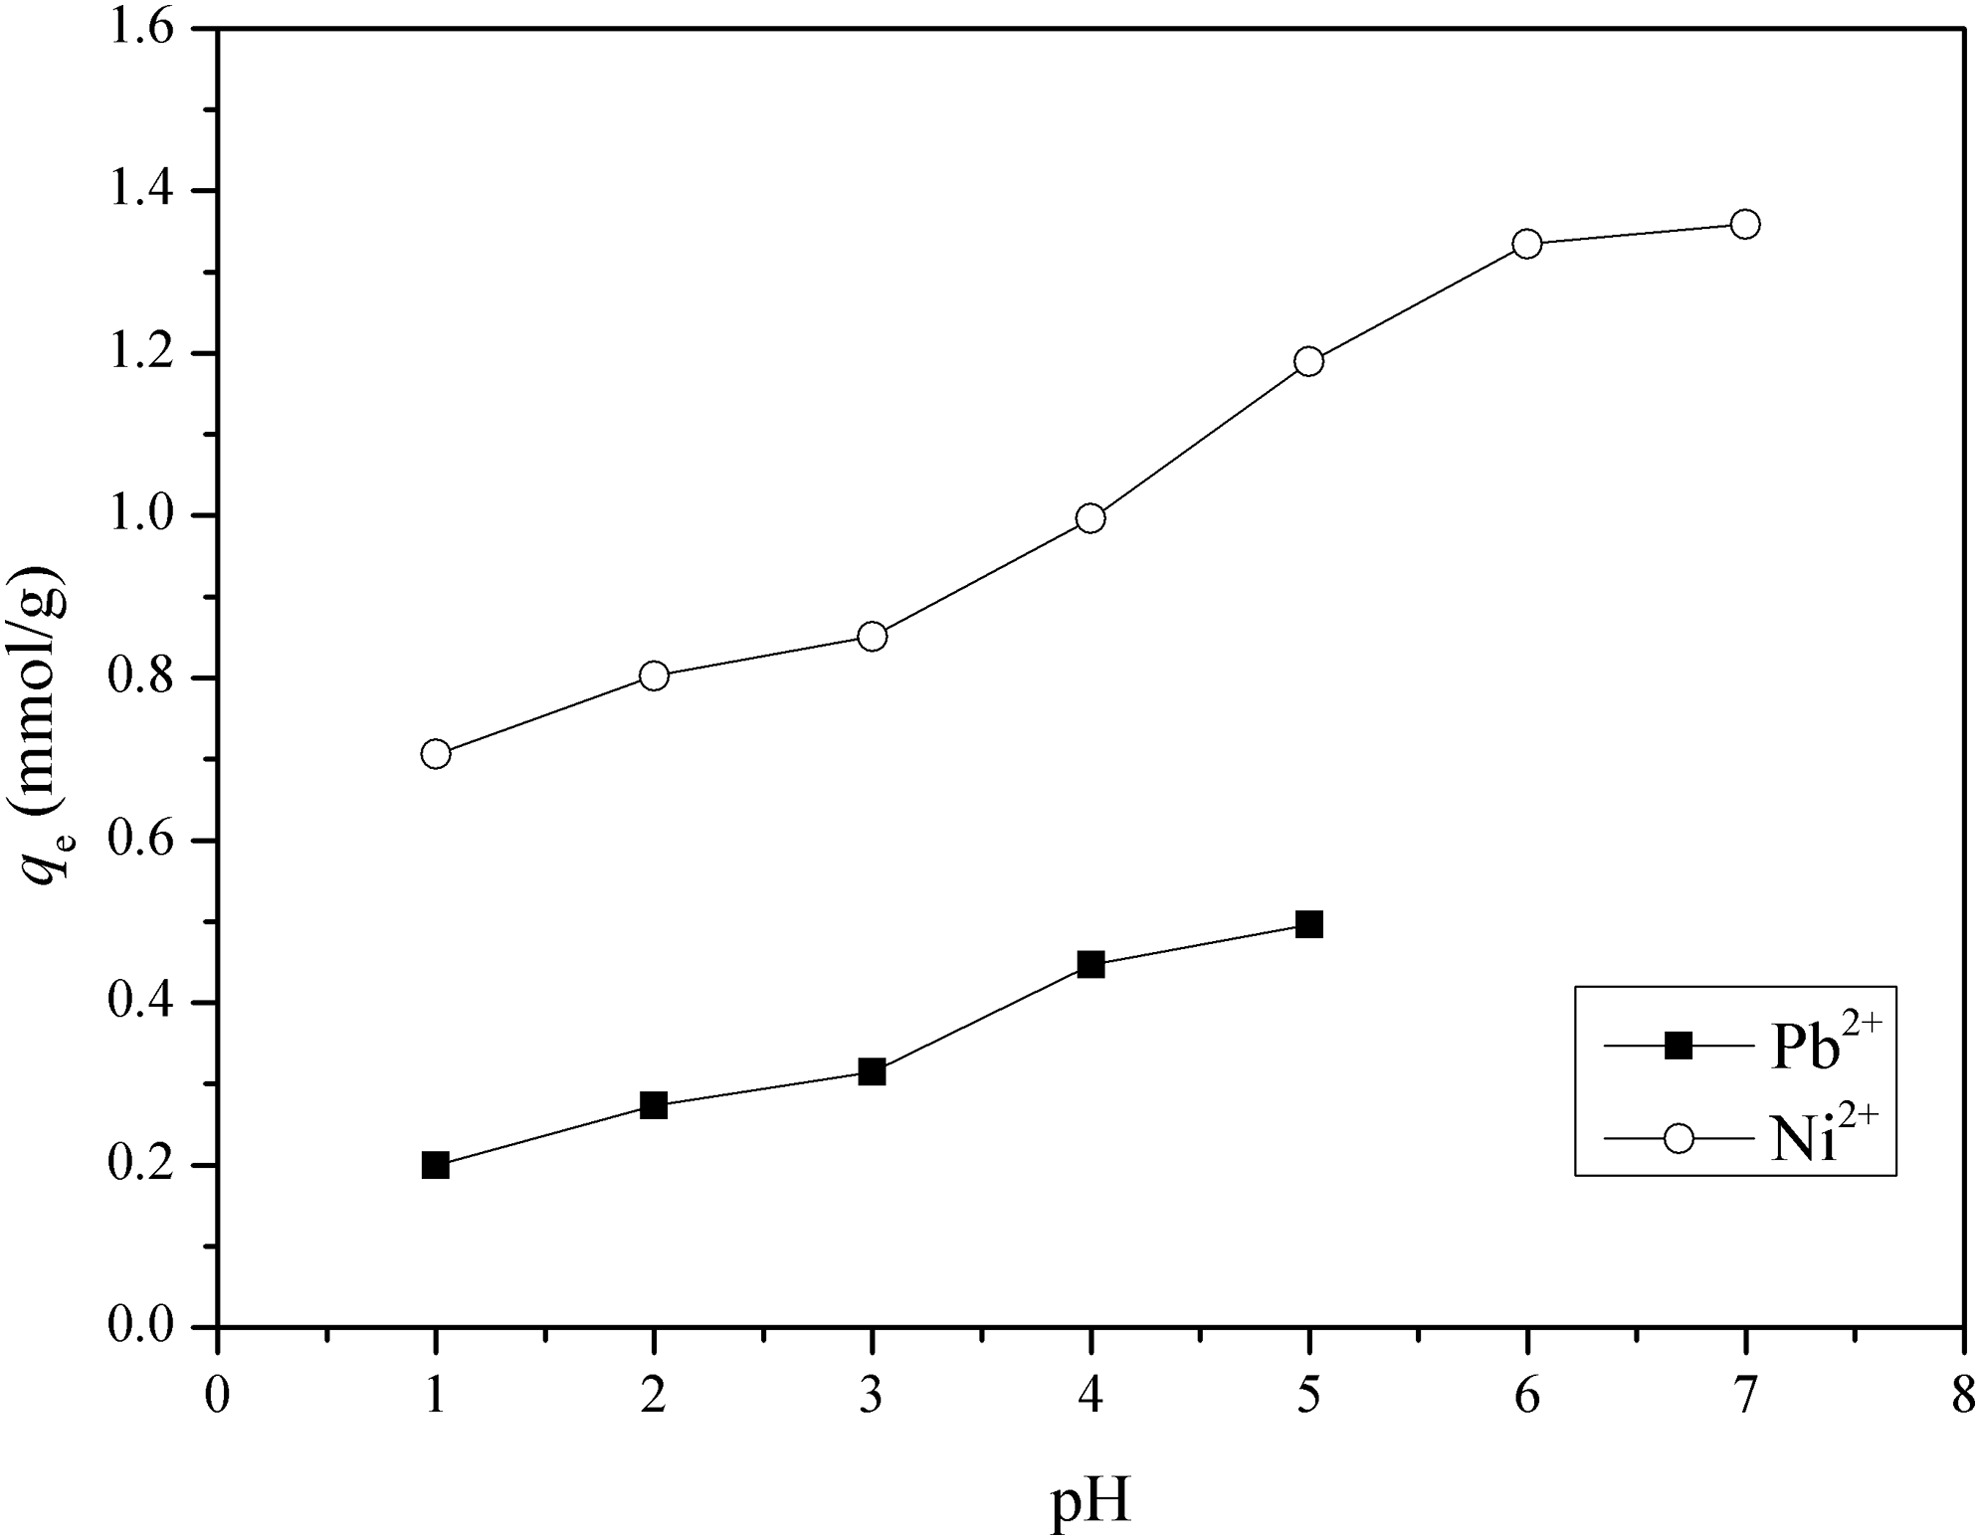
Effect of pH on metal ion adsorption onto MWNS. (CM2+ = 5.0 mmol/L; w/V = 160 mg/100 mL; pH: 1.0–5.0 for Pb2+, 1.0–7.0 for Ni2+; T = 298 K).
Effect of contact time and temperature
Generally, with the increase of contact time, the adsorption capacity increases until the adsorption reaches the equilibrium. The time required to reach the equilibrium and equilibrium adsorption capacity are important factors to predict the feasibility and efficiency of an adsorbent. The relationship between adsorption capacity of Pb2+ and Ni2+ onto MWNS and contact time at different temperatures (298–318 K) is presented in Supplementary Fig. S3. From Supplementary Fig. S3, the adsorption process could be divided in three periods. At the initial period, the adsorption rate of M2+ is fast due to a large amount of binding sites available and the high concentration gradient of M2+, and then it decreases (the second period) until the equilibrium is achieved (the third period). When temperature increases from 298 K to 318 K, the adsorption capacity of M2+ increases.
Effect of initial concentration and temperature
The initial concentration and temperature play significant roles during the adsorption process. The effect of initial concentration and temperature on the equilibrium adsorption of Pb2+ and Ni2+ onto MWNS is shown in Supplementary Fig. S4. From Supplementary Fig. S4, the equilibrium adsorption capacity increases with increase of initial concentration of M2+. The process of adsorption M2+ onto MWNS could be regarded as a transfer process of M2+ from solution bulk to the adsorbent surface where M2+-loaded MWNS is formed, and the balance between the concentrations of M2+- and M2+-loaded MWNS is established. At the same temperature, the equilibrium partition constant (Kc) remains the same; with the increase of M2+ concentration, the concentration of M2+-loaded MWNS or the equilibrium adsorption capacity will increase. It can also be seen from Supplementary Fig. S4, the equilibrium adsorption capacity also increases with an increase in temperature, indicating Kc increases with the temperature increases, which means the adsorption process is endothermic, and it might involve not only physisorption but also chemisorption (Chen et al., 2010). The increase in temperature is beneficial to increase the ionization rate of the functional groups on the surface of the adsorbent, thereby increasing its active adsorption sites (Badawi et al., 2017).
Kinetics
Adsorption kinetic models are usually used to estimate the adsorption rate, and could provide a valuable insight to understand the adsorption mechanism. The pseudo-first-order model (Lagergren, 1898) describes the adsorption of solid-liquid system based on solid adsorption capacity. The pseudo-second-order model (Ho and McKay, 1999) assumes that the adsorption capacity is proportionally dependent on the number of active sites of adsorbent. Elovich model (Zeldowitsch, 1934; Peers, 1965) could be used to determine whether the adsorption process involves chemisorption.
The pseudo-first-order model is
where k1 (min−1) represents rate constant in the pseudo-first-order process.
The pseudo-second-order model is
where k2 (g/[mg·min]) represents rate constant in the pseudo-second-order process.
The Elovich model is
where α (mg/[g·min]) and β (g/mg) are the initial adsorption rate and the desorption constant, respectively.
The Equations (2), (3), and (4) are applied to fit the experiment data shown in Supplementary Fig. S3. The parameters in these equations and the corresponding correlation coefficient (R2) for the above models are listed in Table 2. From Table 2, the R2 values of the pseudo-second-order model for Pb2+ (R2 > 0.999) are comparatively higher than those of the pseudo-first-order model (R2 < 0.96), which indicates that the Pb2+ adsorption kinetics are represented well with the pseudo-second-order model, and also suggests that the Pb2+ adsorption onto MWNS is the rate-controlling step. The R2 values of the pseudo-first-order and pseudo-second-order model for Ni2+ are both closer to 1.0, which indicates that the Ni2+ adsorption kinetics fitted well with both models.
Kinetic Parameters for Pb2+ and Ni2+ Adsorption
Furthermore, the rate constants obtained from the pseudo-second-order model for Pb2+ and Ni2+ increase with the increase in temperature, which suggests that the Pb2+ and Ni2+ adsorption onto MWNS are endothermic processes. Besides, the Elovich model fits the kinetic data of Pb2+ adsorption onto MWNS well (R2 > 0.98), which also suggests that the Pb2+ uptake by MWNS involves chemisorption. The kinetic data of Ni2+ adsorption onto MWNS are not suitable for the Elovich model (R2 < 0.98), indicating the Ni2+ adsorption onto MWNS may be a physisorption process.
To analyze the controlling step of the metal ion adsorption onto MWNS, intraparticle diffusion equation (Cao et al., 2014) is applied to fit the kinetic data.
The intraparticle diffusion model is
where kid (mg/[g·min0.5]) represents the rate constant in intraparticle diffusion.
The plots of qt versus t0.5 are presented in Fig. 4. From Fig. 4, the plots show the trilinearity, which suggests the presence of three governing steps that occurred during the metal ion adsorption onto MWNS. The first step is due to film diffusion of metal ions from boundary layer toward the external adsorbent surface. The second step with gradual adsorption rate is governed by the intraparticle diffusion. The last step corresponds to the equilibrium at the adsorbent/solution interface
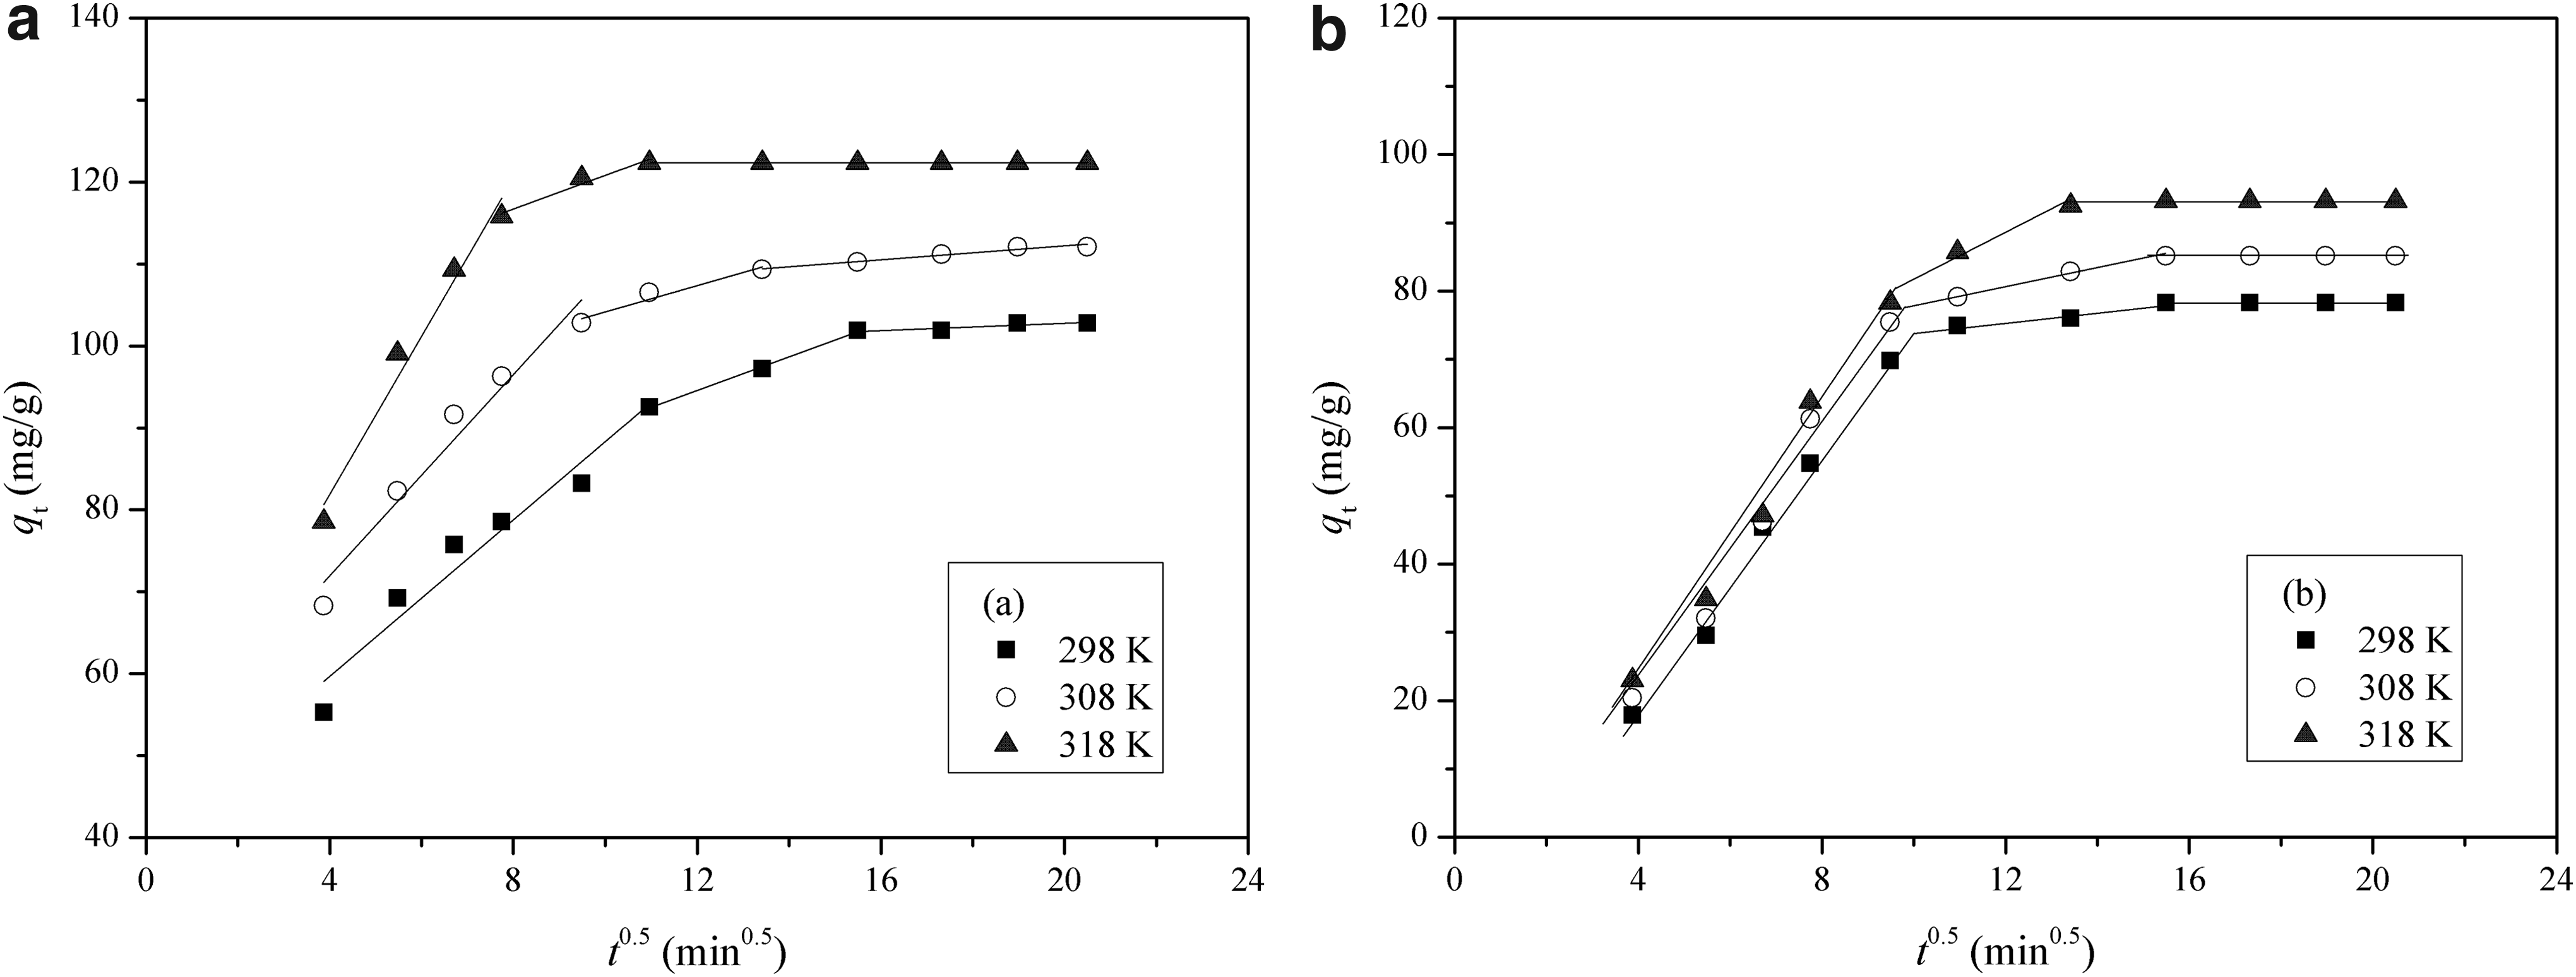
Plots of qt versus t0.5 of
Isotherms
Adsorption isotherms demonstrate the relationship between the adsorption capacity and the concentration at equilibrium, and could provide valuable information to improve the adsorption efficiency. In general, the adsorption isotherms are correlated with Langmuir (1918), Freundlich (1906), and Dubinin–Radushkevich (D–R) models (Dubinin, 1960).
The linear expression of Langmuir model is
where qm is the maximum monolayer adsorption capacity. KL is the Langmuir parameter, which is related to the energy of adsorption.
The separation factor (RL) from Langmuir model can be defined as
The linear expression of Freundlich model is
where KF is the Freundlich constant, which can be as an indicator of adsorption capacity, and n is the Freundlich parameter related to the adsorption intensity.
The D–R model could discriminate between physisorption and chemisorption on both homogenous and heterogeneous surfaces. The linear expression of D–R model is
with
where qD represents the maximum adsorption capacity and KD is the coefficient related to the adsorption energy. ɛ is the Polanyi potential. E is the mean energy, which is applied to evaluate the adsorption type. If E < 8.0 kJ/mol, the process is a physisorption; if 8 < E < 16 kJ/mol, the process is a chemisorption (El-Kamash et al., 2005).
The isotherm data for Pb2+ (Supplementary Fig. S4a) and Ni2+ (Supplementary Fig. S4b) were fitted with Equations (6) and (8), respectively. The parameters in these equations and correlation coefficient (R2) are listed in Table 3. From Table 3, the R2 values of the Langmuir model for Pb2+ (R2 > 0.99) are closer to 1.0, which indicates that the process of Pb2+ adsorption onto MWNS is a monolayer adsorption. Also, the maximum monolayer adsorption capacity of MWNS from this model for Pb2+ is 383.50 mg/g at 318 K, which is larger compared with WNS-MAH (221.24 mg/g at 318 K) (Li et al., 2019). This may be due to the fact that MWNS (4.895 mmol/g) has a higher carboxyl value than WNS-MAH (2.80 mmol/g). Adsorption favorability could be predicted by RL (RL = 0, irreversible; 0 < RL < 1, favorable; and RL > 1, unfavorable). The values of RL for Pb2+, 0.895–0.633 (298 K), 0.896–0.637 (308 K), and 0.898–0.641 (318 K), are ranging from 0 to 1, which implies the favorability of Pb2+ adsorption onto MWNS.
Langmuir and Freundlich Models Parameters for Pb2+ and Ni2+ Adsorption
On the other hand, the adsorption of Pb2+ onto MWNS obeys the Freundlich model (R2 > 0.99), and the values of n for Pb2+ (1.4433–1.4723) are higher than 1, but lower than 10, indicating that the adsorption of Pb2+ onto MWNS is homogeneous and reversible (Amin, 2009; Badawi et al., 2017).
According to the R2 values for Ni2+ in Table 3, the Ni2+ adsorption onto MWNS accords with the Freundlich model (R2 > 0.99), but does not conform to the Langmuir model (R2 < 0.85), which suggests the process of Ni2+ adsorption onto MWNS may be a multilayer adsorption. The values of n for Ni2+ (0.5384–0.5476) are lower than 1, which suggests that the process of Ni2+ adsorption onto MWNS is a heterogeneous and reversible adsorption (Amin, 2009; Badawi et al., 2017).
The isotherm data for Pb2+ (Supplementary Fig. S4a) and Ni2+ (Supplementary Fig. S4b) were also fitted with Equation (9), and the parameters in this equation and correlation coefficient (R2) are listed in Tables 4 and 5. Figure 5 presents comparison between the experimental data and model ones from Equation (9) for Pb2+ and Ni2+ onto MWNS at 298–318 K. From Fig. 5a, when MWNS adsorbs Pb2+ from aqueous solution, there are intersection points [(ɛ′)2] corresponding to feature concentrations (CeD), which are related to temperature. The values of CeD are calculated and listed in Table 4. From Table 4, the values of E are 13.19–13.62 kJ/mol (>8 kJ/mol) for Ce < CeD and 4.30–4.55 kJ/mol (<8 kJ/mol) for Ce > CeD, respectively. These results indicate that the process of Pb2+ adsorption onto MWNS is carried out by chemisorption for Ce < CeD, and by physisorption for Ce > CeD, while when MWNS adsorbs Ni2+ from aqueous solution, from Table 5, the values of E (4.73–5.13 kJ/mol) are lower than 8 kJ/mol in the whole concentration range, which reveals that the process of Ni2+ adsorption onto MWNS belongs to physisorption, which is consistent with the results obtained from Elovich model. Further discussion will be expanded in later sections.

Dubinin–Radushkevich model of
Dubinin–Radushkevich Model Parameters for Pb2+ Adsorption
Dubinin–Radushkevich Model Parameters for Ni2+ Adsorption
Based on the above discussion, it can be concluded that, when MWNS adsorbs Pb2+ from aqueous solution at Ce < CeD, monolayer chemisorption is the main process, and at Ce > CeD, physical adsorption primarily occurs, while the process of Ni2+ adsorption onto MWNS belongs to heterogeneous multilayer physisorption.
The adsorption capacities for Pb2+ and Ni2+ compared with various adsorbents are listed in Table 6. From Table 6, the MWNS in this study had larger adsorption capacity.
Comparison of Adsorption Capacity of Pb2+ and Ni2+ onto Various Adsorbents
Competitive adsorption of Pb2+ and Ni2+ from aqueous solution
The competitive adsorption behavior was studied in binary system containing Pb2+ and Ni2+, and the results were presented in Fig. 6. From Figs. 3 and 6, it can be seen that, the molar adsorption capacities of MWNS for Pb2+ and Ni2+ in binary system are lower than those in single solution, indicating there is a competition between these two metal ions. For example, at pH 5.0, the molar adsorption capacities of MWNS for Pb2+ (0.436 mmol/g) and Ni2+ (0.733 mmol/g) in binary system are about 87% and 62% of those in single solution, respectively, which suggests Pb2+ is more preferentially adsorbed than Ni2+ onto the MWNS surface. The difference in the adsorption capacity of different metal ions is related with the ionic radius and the interaction between metal ions and adsorbents.

Competitive adsorption of Pb2+ and Ni2+ onto MWNS. (CPb2+ = CNi2+ = 5.0 mmol/L; w/V = 160 mg/100 mL; pH: 1.0–5.0; T = 298 K).
The molar adsorption capacity of MWNS for Pb2+ (0.497 mmol/g at 298 K) in single solution is lower compared with Ni2+ (1.359 mmol/g at 298 K); it may be because the ionic radius of Pb2+ (1.33 Å) (Liu et al., 2013) is larger compared with Ni2+ (0.72 Å) (Meites and McGraw-Hill, 1963). On the other hand, from Supplementary Table S1, the molar adsorption capacity of MWNS for Pb2+ and Ni2+ in single solution is 4 times and 1.8 times those of WNS, respectively. It also shows that the adsorption of Pb2+ on the surface of MWNS is more favorable than Ni2+.
Materials Studio 7.0 was utilized to simulate this adsorption process. To simplify calculations, the monomer structure of WNS and MWNS (shown in Supplementary Fig. S1) is applied to replace the molecular structure of the adsorbent. The simulation of adsorption was completed by using the module of Adsorption Locator. The grand canonical ensemble Monte Carlo was first used to sample the configuration space of the adsorbate–adsorbent system. Then, the global minimum adsorption configuration was searched (Xiang et al., 2012).
Through the simulation by Materials Studio 7.0, the locations of metal ions (Pb2+ and Ni2+) adsorbed onto WNS and MWNS are presented in Fig. 7, and the distances (r) between metal ions and WNS or MWNS are listed in Table 7. The interaction between the adsorbate and the adsorbent mainly depends on the interaction between the metal ion and oxygen atoms [O1–O9, marked (1)–(9)], and the oxygen atom with the smallest distance (rmin) between the metal ion and adsorbent can be regarded as the dominant adsorption site. From Table 7, when adsorption of metal ions occurs onto WNS and MWNS from single solution, the dominant adsorption sites are O9 and O3, respectively.
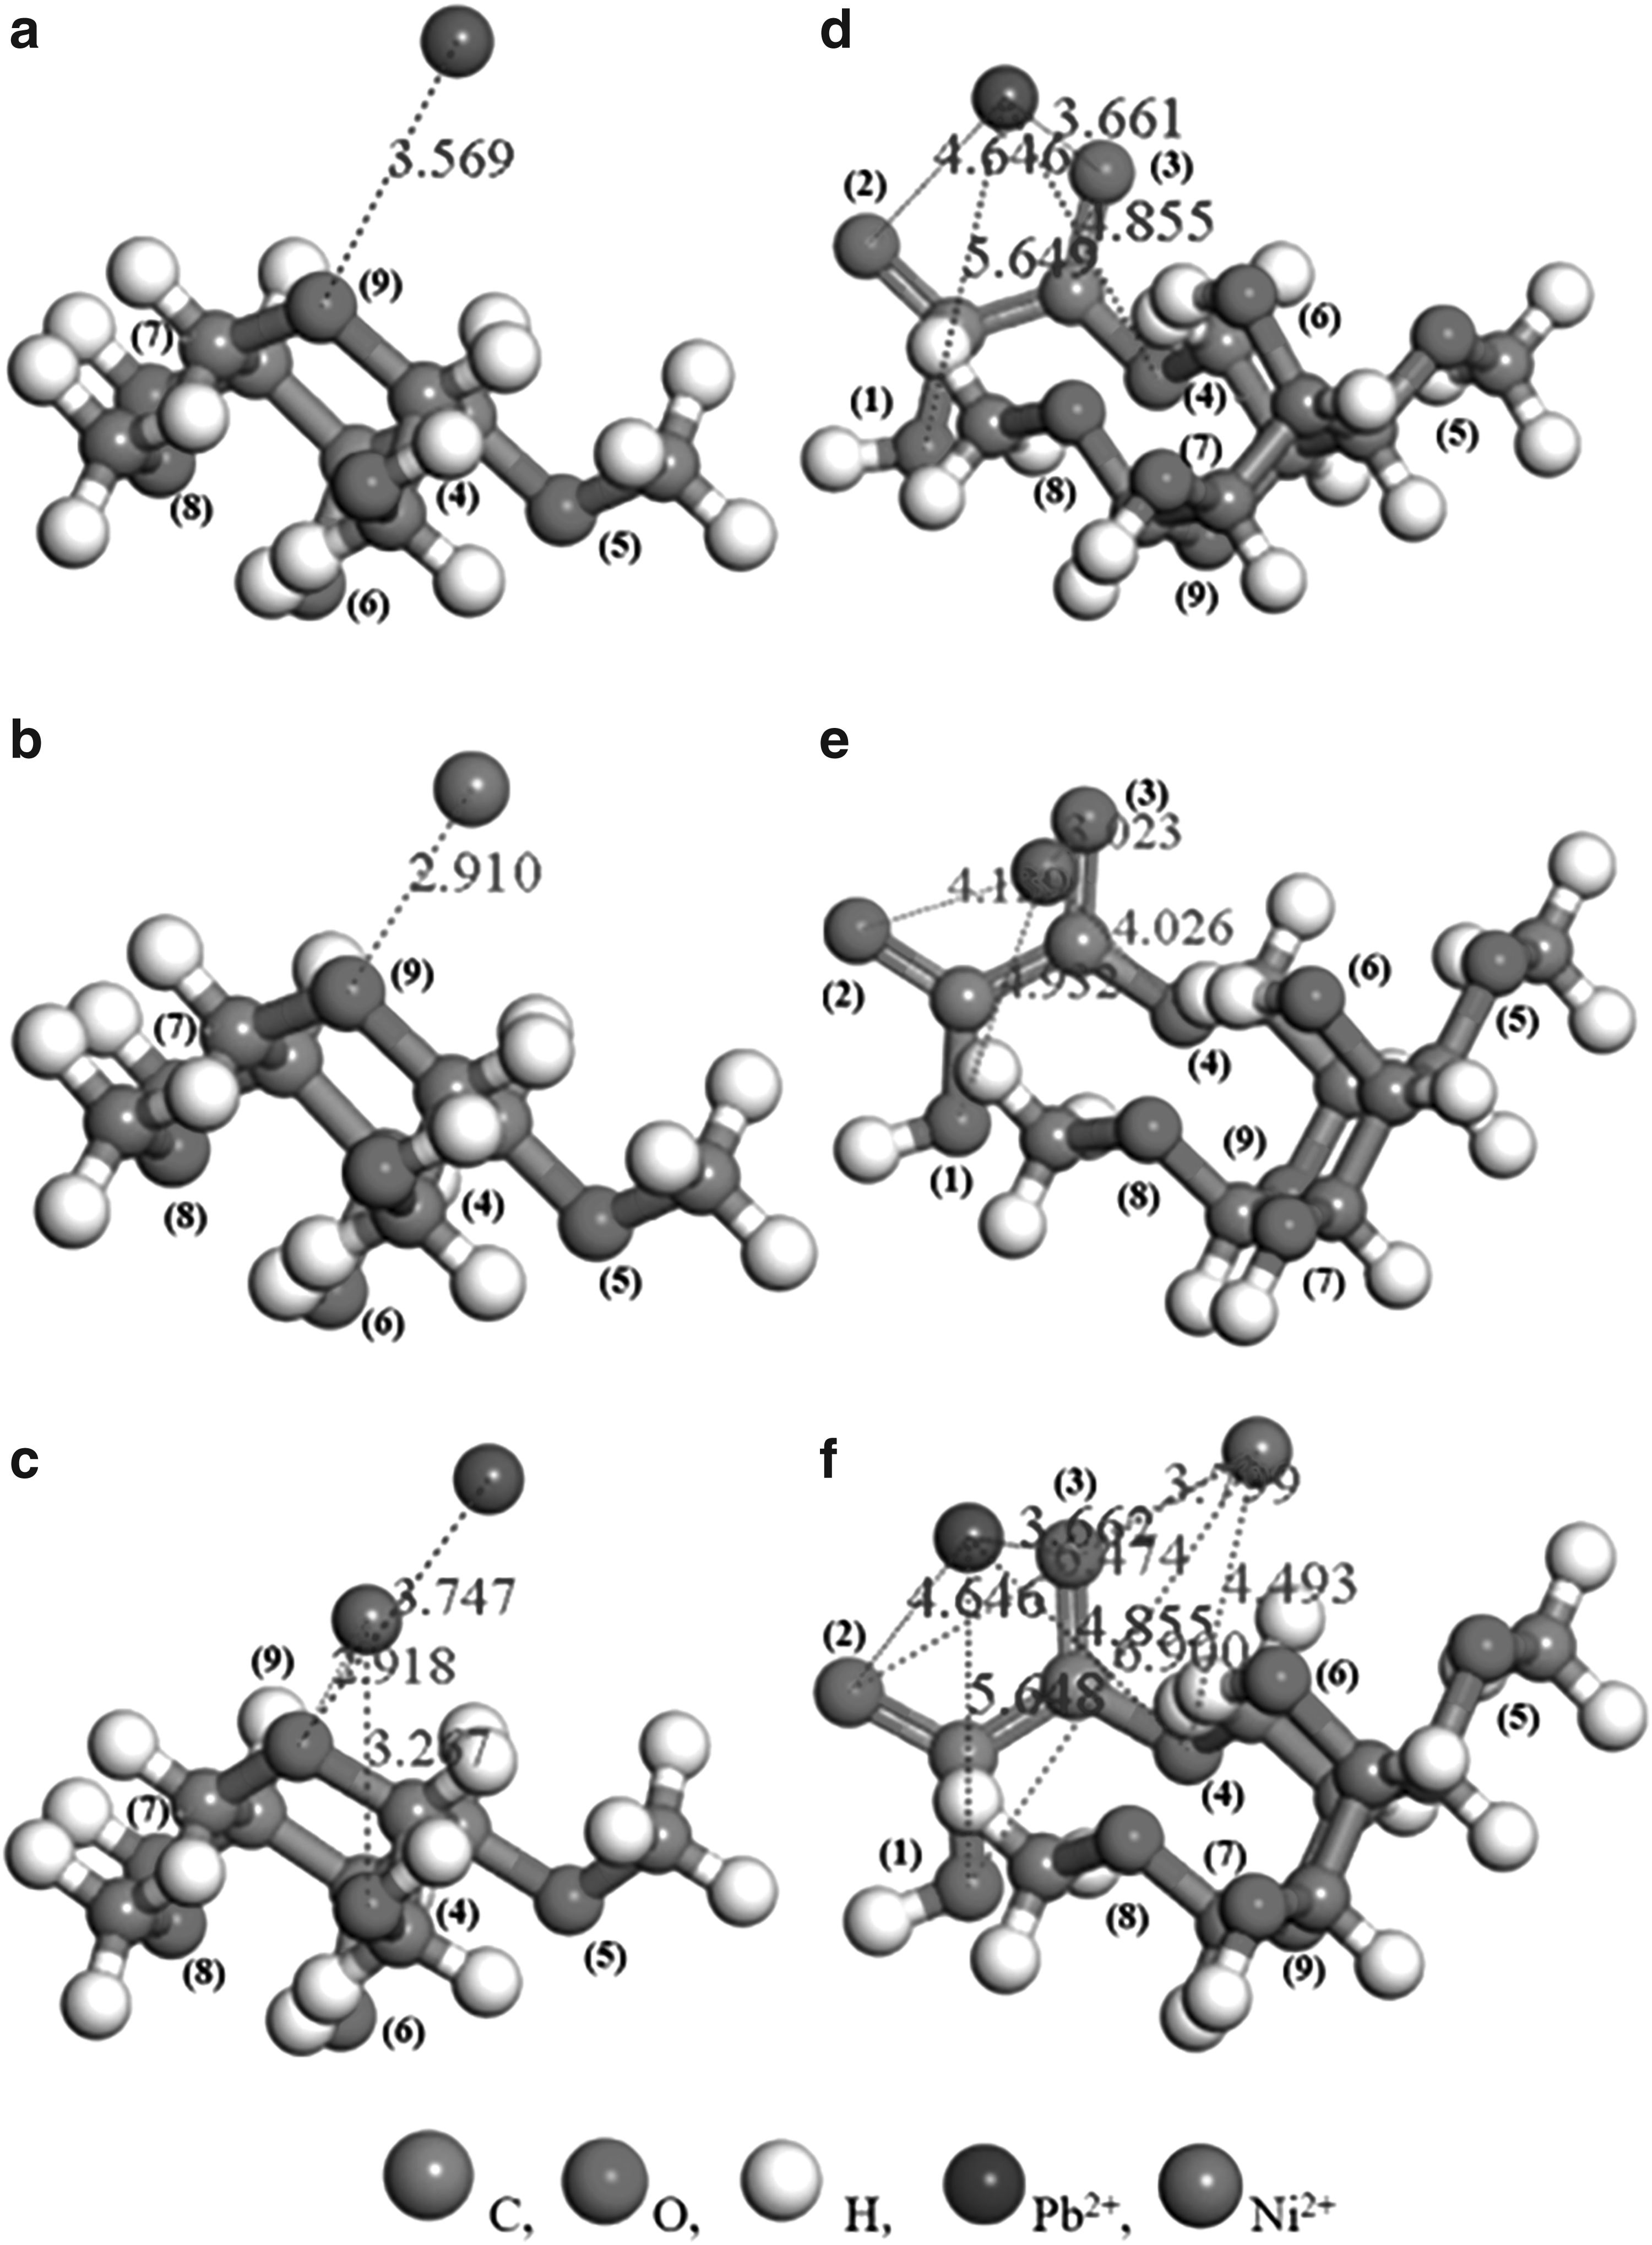
Distances between
Distances Between Metal Ions and Walnut Shell or Modified Walnut Shell
The distance smaller than
The smallest distance (rmin) between the metal ion and adsorbent.
Assuming that the adsorption capacity is mainly contributed by the dominant adsorption site, based on the fact that the adsorption capacity of MWNS is higher compared with WNS (Table 2 and Supplementary Table S1), it can be concluded that the type of adsorption site has the major effect on the adsorption capacity, which means the interaction between metal ion and O3 in MAH is stronger than that between metal ion and O9 in cellulose. It indicates that the introduction of MAH onto WNS facilitates adsorption.
On the other hand, since the interaction is inversely proportional to the sixth power of the distance, it can be assumed that the oxygen atoms with the distance smaller than
Furthermore, from Fig. 7d–f and Table 7, the distances between Pb2+ and O3 and the number of effective adsorption sites for single solution are almost same as those for binary system, while the distance between Ni2+ and O3 for single system is obviously lower than that for binary system, and the dominate adsorption site for Ni2+ changes from O3 to O6 and the number of effective adsorption sites also decreases from 5 to 4, indicating Pb2+ not only occupies the dominate adsorption site O3 of MWNS preferentially but also occupies more effective adsorption sites than Ni2+.
On the other hand, the rate constants (k2) obtained from pseudo-second-order model (shown in Table 2) for Pb2+ (4.80 × 10⁻⁴–1.52 × 10⁻³ g/[mg·min]) are larger than those for Ni2+ (2.16 × 10⁻⁴–2.83 × 10⁻⁴ g/[mg·min]), indicating that the Pb2+ occupies the adsorption sites faster than Ni2+. Hence, it can be concluded that, when MWNS adsorbs Pb2+ and Ni2+ in a coexistence system, there is a competition for active adsorption sites. Pb2+ will give priority to occupy the active adsorption sites, that is, Pb2+ will be preferentially adsorbed, while Ni2+ could only occupy little further active adsorption sites.
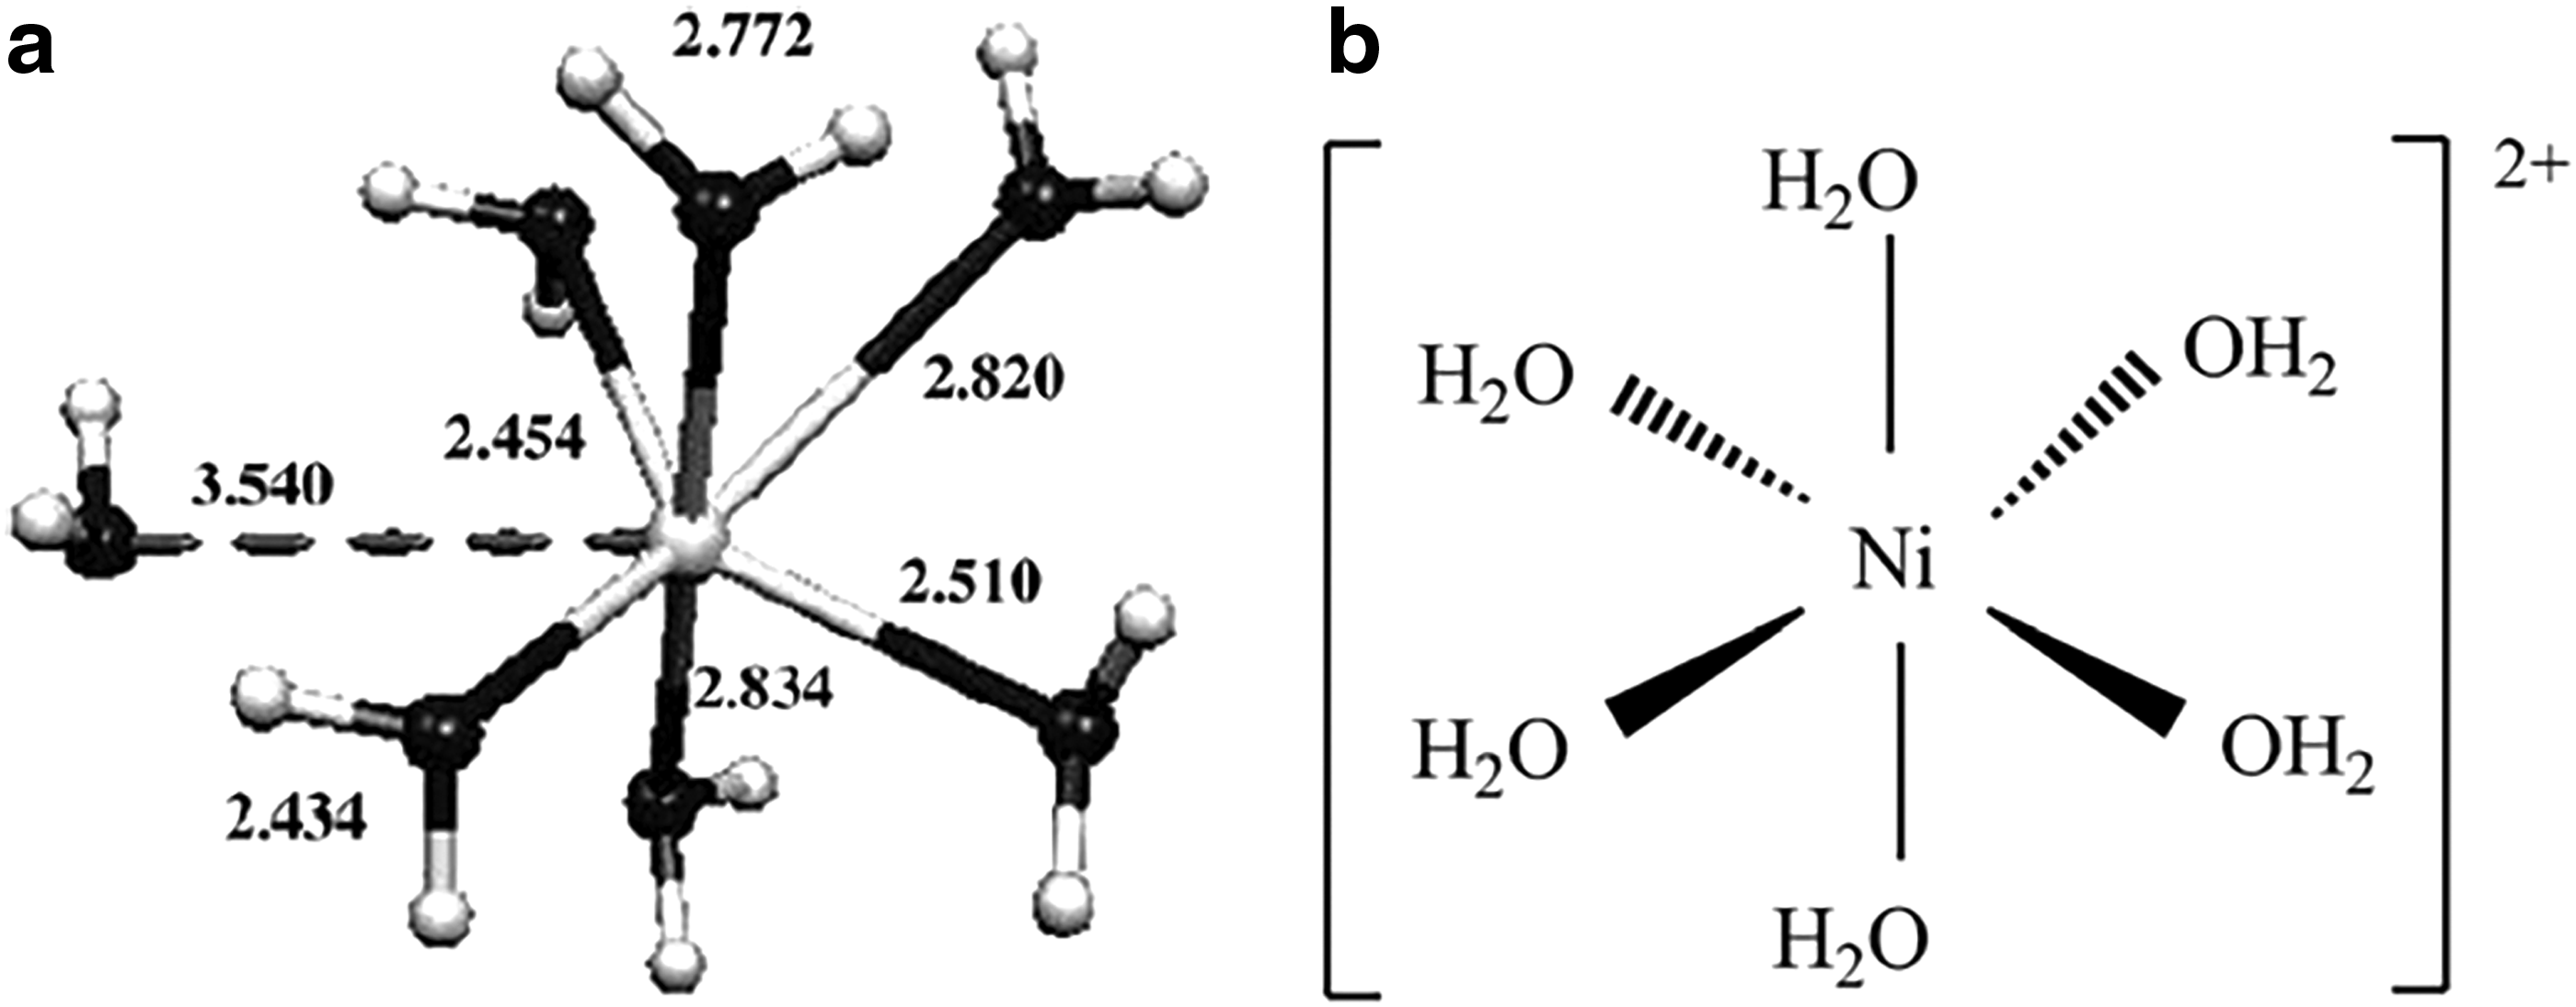
To verify the rationality of the simulation results, the hydrated structures of Pb2+ and Ni2+ are studied. To facilitate the calculation, the hydrated structure of metal cell could be simplified to a cuboid with three parameters (a, b, and c) and is shown in Fig. 8. As for the hydrated structure of Pb2+, Christophe et al. (2006) obtained the instantaneous structure (snapshot) of the aqueous Pb2+ complex, which is composed of seven water molecules (shown in Fig. 9a). As for the hydrated structure of Ni2+ (shown in Fig. 9b), Liu et al. (2016b) proposed that the first coordination shell consists of six water molecules, and the coordination distance of Ni–O is 2.04 Å. Based on the above cuboid model and the H–O distance in water molecule (0.96 Å) (Liu, 1992), the values of a, b, and c are obtained, and are 5.366, 5.366, and 9.000 Å for Pb2+, and 4.243, 4.243, and 6.000 Å for Ni2+, respectively. According to the previous discussion, the minimal distances between M2+ and O1–O9 are 3.569 and 2.910 Å for Pb2+ and Ni2+, respectively, which are both greater than the values of a/2 (2.683 and 2.121 Å for Pb2+ and Ni2+, respectively), indicating the results obtained from Materials Studio simulation could be acceptable.
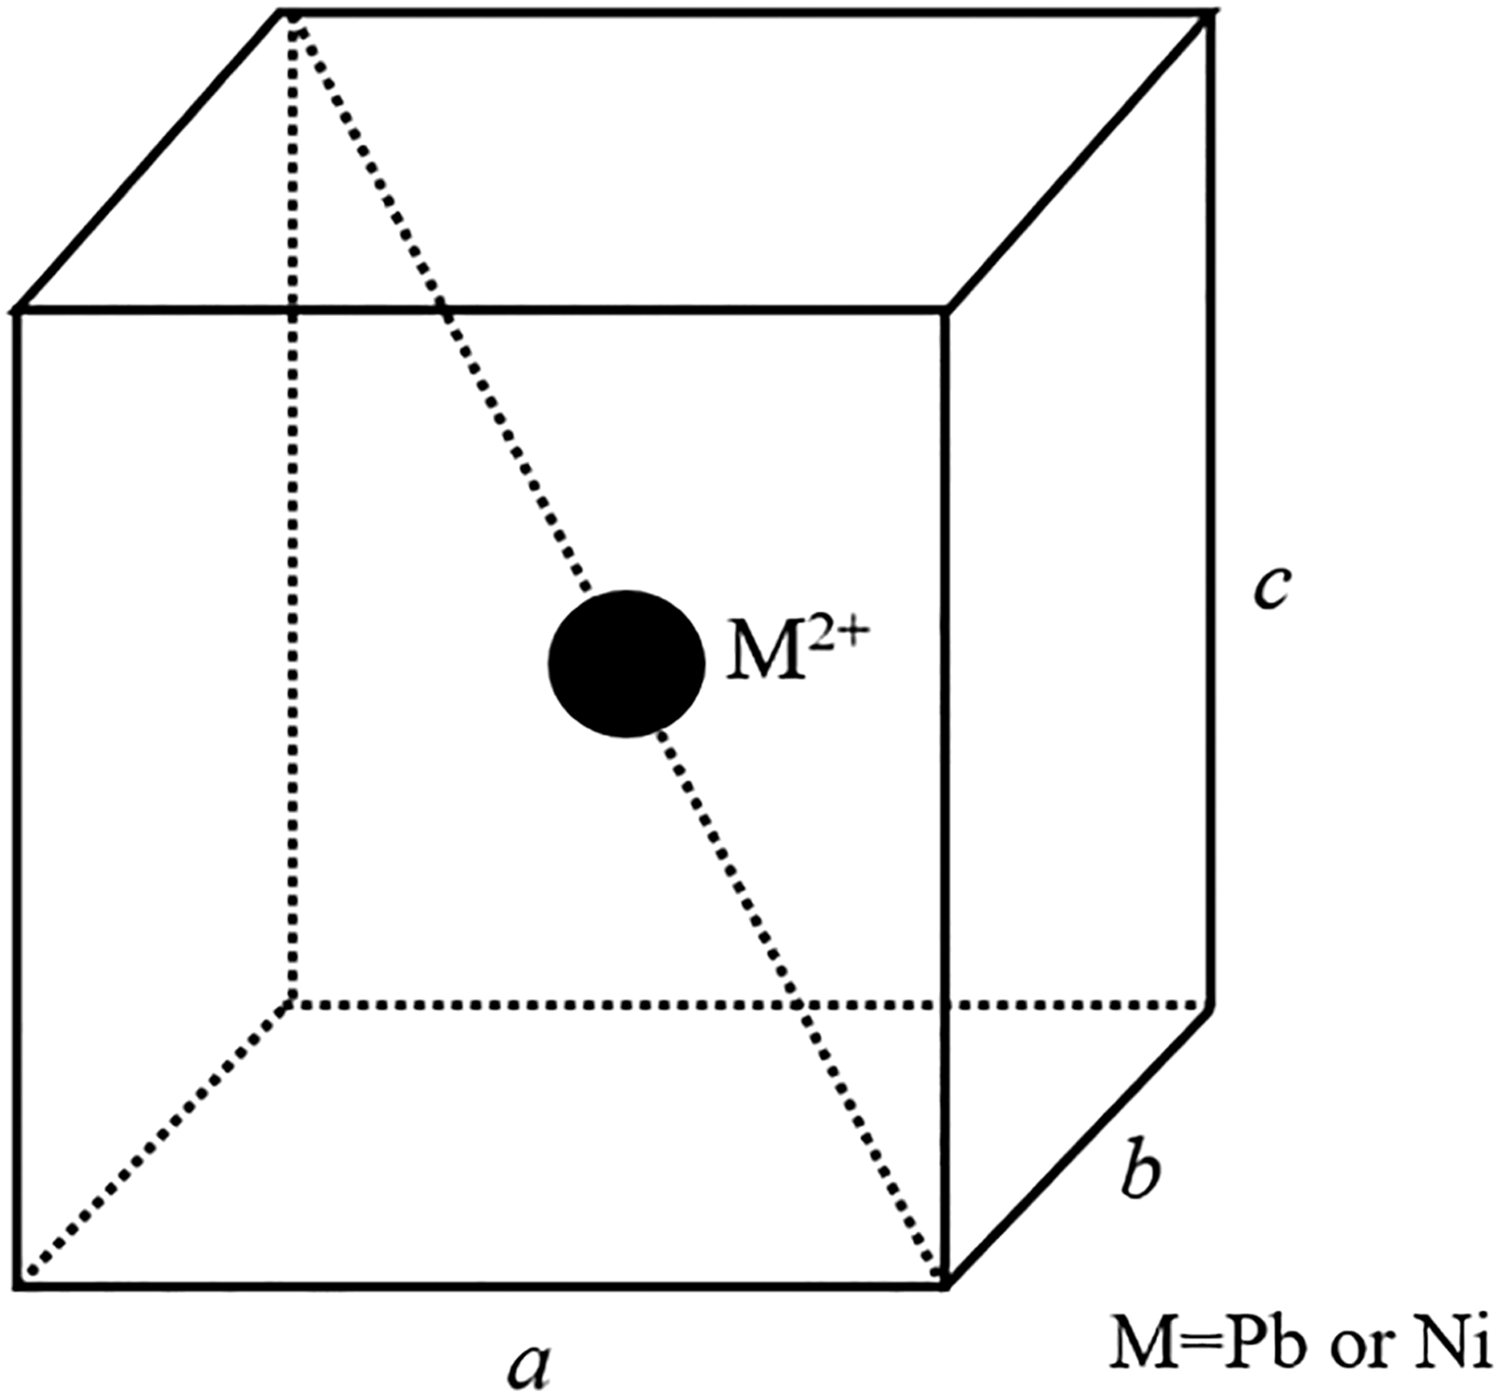
Rough stereochemical structure of one hydrated metal ion complex.
Thermodynamics
The orientation and feasibility of physicochemical adsorption could be estimated by thermodynamic parameters, including ΔG, ΔH, and ΔS, which can be obtained from follows:
where Ces (mg/g) represents the equilibrium solid-phase concentration. Table 8 presents the values of ΔG, ΔH, and ΔS of Pb2+ and Ni2+ adsorption onto MWNS, and the latter two are calculated by the slope and intercept of the plot ln Kc–1/T. From Table 8, the negative values of ΔG indicate that the adsorption process of Pb2+ and Ni2+ onto MWNS is feasible. The positive values of ΔH suggest that the adsorption of Pb2+ and Ni2+ onto MWNS is endothermic in nature. The positive values of ΔS indicate that the process of Pb2+ and Ni2+ adsorption is entropy driven (Yang et al., 2014).
Thermodynamic Parameters of Pb2+ and Ni2+ Adsorption onto Modified Walnut Shell
Conclusions
The adsorbent (MWNS) was synthesized by the reaction between WNS and MAH in NMP as solvent. The prepared adsorbent was characterized through FTIR, XPS, and point of zero charge analysis, and was utilized to remove Pb2+ and Ni2+ from aqueous solution. The effects of pH, contact time, temperature and initial concentration were investigated. Results show that the optimal pH is 5.0 for Pb2+ and 7.0 for Ni2+, respectively. The adsorption capacity of Pb2+ and Ni2+ increases with increasing temperature and initial concentration of M2+.
The kinetics experiments of adsorption were performed at 298–318 K. The kinetics data of Pb2+ are represented well with the pseudo-second-order model, suggesting that the Pb2+ adsorption onto MWNS is the rate-controlling step. The kinetics data of Ni2+ are represented well with both the pseudo-first-order and the pseudo-second-order models. Besides, the Elovich model fits the kinetic data of Pb2+ adsorption onto MWNS well, which suggests that the Pb2+ uptake by MWNS involves chemisorption. The results from intraparticle diffusion model imply the presence of three governing steps that occurred during the metal ion (Pb2+ and Ni2+) adsorption onto MWNS.
The equilibrium data of Pb2+ and Ni2+ uptake by MWNS are correlated with Langmuir, Freundlich, and D–R models. The results show that the adsorption of Pb2+ onto MWNS is a monolayer homogeneous and reversible process. Also, the maximum monolayer adsorption capacity for Pb2+ of MWNS is 383.50 mg/g at 318 K obtained from Langmuir model. Through the D–R model, when MWNS adsorbs Pb2+ from aqueous solution, chemisorption is the main process at Ce < CeD, and physisorption primarily occurs at Ce > CeD. The process of Ni2+ adsorption onto MWNS is a heterogeneous multilayer physisorption.
Competitive adsorption tests of Pb2+ and Ni2+ in binary system were conducted, and the fact that Pb2+ is more preferentially adsorbed than Ni2+ onto the MWNS surface was observed. Material Studio (Adsorption Locator) was applied to determine the adsorption location between MWNS and metal ions in single and binary systems. The simulation results show that there is a competition for active adsorption sites of MWNS between Pb2+ and Ni2+, and when MWNS adsorbs these two ions in a binary system, Pb2+ would preferentially occupy the active adsorption sites.
Through thermodynamic analysis, the negative values of ΔG indicate that the adsorption process of Pb2+ and Ni2+ onto MWNS is feasible. The positive values of ΔH and ΔS suggest that the adsorption of Pb2+ and Ni2+ onto MWNS is endothermic and entropy increased.
Footnotes
Acknowledgment
The authors thank Mrs. Jia Qian for her contribution in the discussion about D–R model.
Author Disclosure Statement
No competing financial interests exist.
Funding Information
Financial support from the East China University of Science and Technology is greatly acknowledged.
References
Supplementary Material
Please find the following supplemental material available below.
For Open Access articles published under a Creative Commons License, all supplemental material carries the same license as the article it is associated with.
For non-Open Access articles published, all supplemental material carries a non-exclusive license, and permission requests for re-use of supplemental material or any part of supplemental material shall be sent directly to the copyright owner as specified in the copyright notice associated with the article.