
Abstract
Environmental factors such as ultraviolet radiation and pollution have been known to influence the incidence rate of cancer. However, these factors do not explain the variation in incidence rates across the United States. In this study, the hypothesis that precipitation and climate zone play a role in determining the incidence rate of invasive cancer in the United States is tested. The hypothesis was tested using the county-level cancer incidence rate data obtained from the Center for Disease Control's National Program of Cancer Registries Cancer Surveillance System. Individual generalized linear models were developed for each of the five separate cancer incidence rates, as well as total invasive cancer. Precipitation and climate zone were included in each model along with demographic variables such as annual income, population by gender, race, and age—important control variables. Results indicate that in the United States, counties with high precipitation and cold climate have statistically significantly higher rates of invasive cancer incidence rates (p < 0.05). This is the first study reporting precipitation and climate as natural environmental factors responsible for the geographical disparity in invasive cancer incidence rates within the United States.
Introduction
Cancer remains the leading cause of death in the United States, which is responsible for one in four deaths (Siegel et al., 2012). However, there is a significant disparity in cancer incidence and mortality rates between different states (Goodwin et al., 1998; Perdue et al., 2008; Sariego, 2009; Siegel et al., 2012). The cancer incidence rate data available through the Surveillance, Epidemiology, and End Results (SEER) program of the National Cancer Institute shows that the states with higher rates are clustered toward the East Coast (Fig. 1). This observed difference in incidence rates has been linked to racial, ethnic, behavioral, social, economic, and lifestyle factors for different types of cancers (Armstrong and Doll, 2006; Anand et al., 2008; Cheng et al., 2009; Vona-Davis and Rose, 2009).
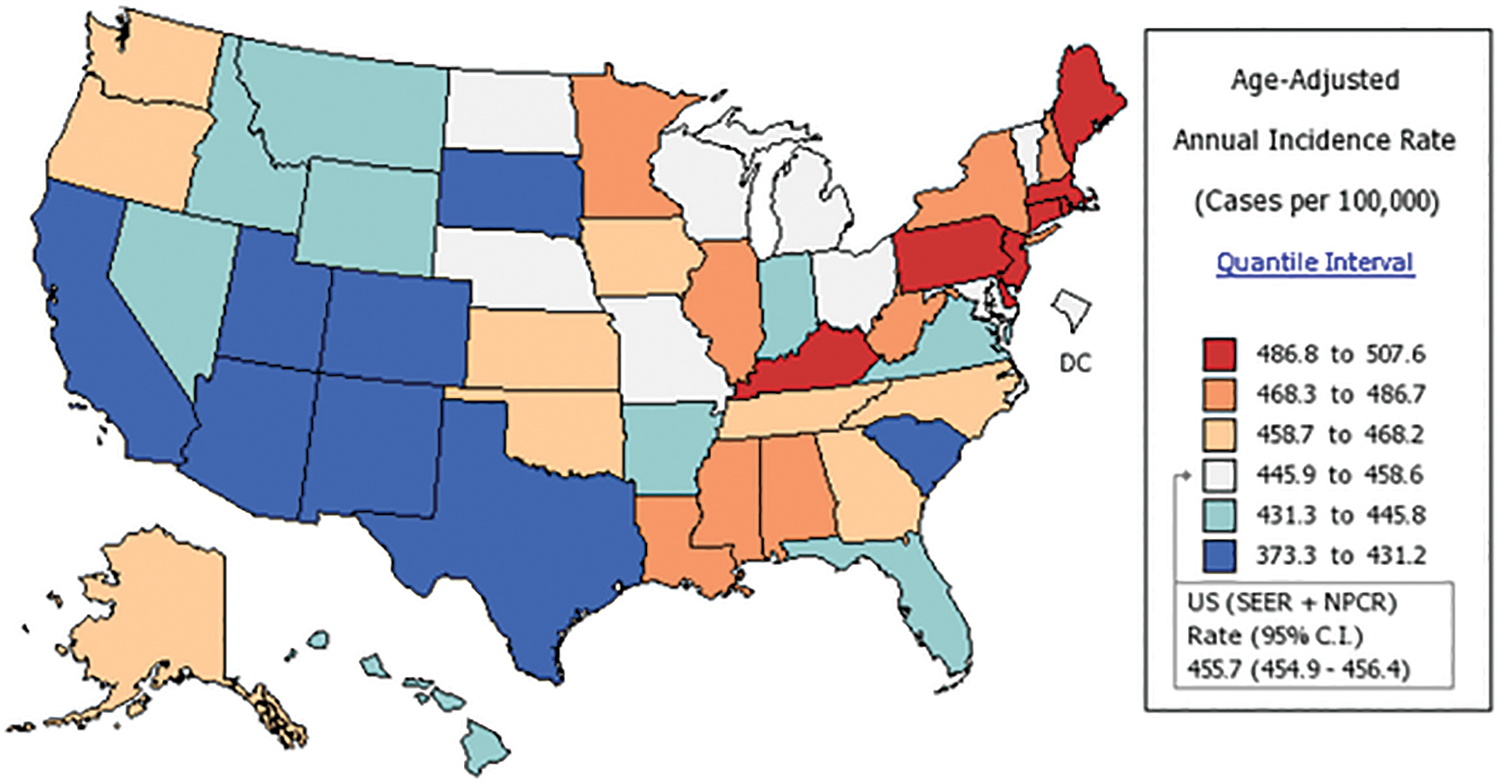
Cancer incidence rates in different states within the United States in 2008 as reported by The SEER program of the National Cancer Institute. CI, confidence interval; NPCR, National Program of Cancer Registries; SEER, Surveillance, Epidemiology, and End Results.
Environmental factors have also been known to increase cancer rates, and most have been traced to anthropogenic origin (Doll and Peto, 1981; Irigaray et al., 2007; Clapp et al., 2008). Consensus exists on the causation relation between persistent toxic pollutants released into air, soil, water, and food and cancer (Irigaray et al., 2007). These compounds, along with exogenous environmental factors, including viruses and radiation, contribute to the genesis of cancers and, therefore, may account for their currently growing incidence (Bray et al., 2002).
Although these studies have been able to explain some of the geographical differences in cancer rates, reasons for most of the geographical differences remain elusive (Laden et al., 1997; Robbins et al., 1997; Elk and Landrine, 2011). Also, major national-level studies correlating risk factors and cancer rates have used data obtained at the state level, limiting the inference to broad geographical areas, often with vast heterogeneity within.
In this study, the plausibility of two environmental variables—precipitation and climate zone (a variable that combines temperature and moisture level in a given area) as natural factors explaining the regional differences in invasive cancer incidence rates is investigated. Precipitation, moisture, and temperature may not be a directly causative agent of cancer on its own. However, they may increase the exposure to carcinogens by acting as carriers or increasing the natural biotic generation of carcinogens. An extensive literature search revealed that a single study conducted at a regional level in Spain has been reported, investigating whether prostate cancer mortality rates were correlated with precipitation (Santos Arrontes et al., 2005, 2007). Similarly, there has been only one study showing people living in cold climate in the United States at increased risk for thyroid cancer (Lehrer and Rosenzweig, 2014).
No detailed study has been conducted in the United States investigating a relationship between incidence rates for various types of invasive cancers and environmental factors such as precipitation and climate zone. In this study, we test the hypothesis that precipitation and climate zone are significant factors affecting incidence rates for breast cancer, ovarian cancer, lung cancer, colorectal cancer, prostate cancer, and for all types of invasive cancer considered aggregately.
Methods
Data collection
Retrospective published data were used for developing the model. Cancer incidence rates were obtained from the Center for Disease Control's National Program of Cancer Registries Cancer Surveillance System January 2014 data submission and SEER November 2013 submission (www.statecancerprofiles.cancer.gov). The cancer incidence rate per 100,000 eligible individuals were recorded for all newly diagnosed invasive cancer (referred to in this study as total invasive cancer), breast and ovarian cancer (among females), lung and bronchus cancer, colorectal cancer, and prostate cancer (among males) averaged for the time span of 2008–2012. Because the data were only available aggregated by county and had to be linked to climate and demographic data, the creation of a data set for all states would have been time prohibitive. For this reason, 15 states were randomly selected for statistical analysis: Arizona, Arkansas, California, Connecticut, Georgia, Iowa, Massachusetts, New York, New Jersey, Oklahoma, South Carolina, Texas, Utah, Washington, and Wisconsin. Cancer data were collected from official state government cancer registries or from the Cancer Incidence and Mortality Inquiry System for the time span of 1990–2009. States reporting incidence rates annually were averaged for 5-year intervals (1990–1994, 1995–1999, 2000–2004, and 2005–2009) (South Carolina Department of Health and Environmental Control, 2012; Arizona Department of Health Services, 2012; Cancer Incidence and Mortality Data, 2012; New York State Department of Health, 2012; Oklahoma Central Cancer Registry, 2012; Wisconsin Department of Health Services, 2012). The same county may have had more than one observation, but each observation was treated as independent because the observations do not have any overlapping years. If it was not possible to calculate 5-year average incidence rates, the data were converted to 3- or 4-year averages (for Connecticut, South Carolina, and Washington). Cancer data were collected only for counties for which precipitation data were available for the corresponding period. In total, data were collected for 256 counties.
Total annual precipitation data were collected from the National Oceanic and Atmospheric Administration website (National Oceanic and Atmospheric Administration, 2012). Precipitation data for each available county were averaged into the corresponding 3-, 4-, or 5-year intervals for which cancer data had been averaged. Climate zone data were obtained from the International Energy Conservation Code (Baechler et al., 2015). The United States is divided into seven climate zones. The classification of the zones is as follows: 1, very cold; 2, cold; 3, marine; 4, mixed humid; 5, mixed dry; 6, hot humid; and 7, hot dry (Fig. 2). Demographic data such as annual income, population by gender, race, and age (over/under 18) were obtained from the U.S. Census 2010.
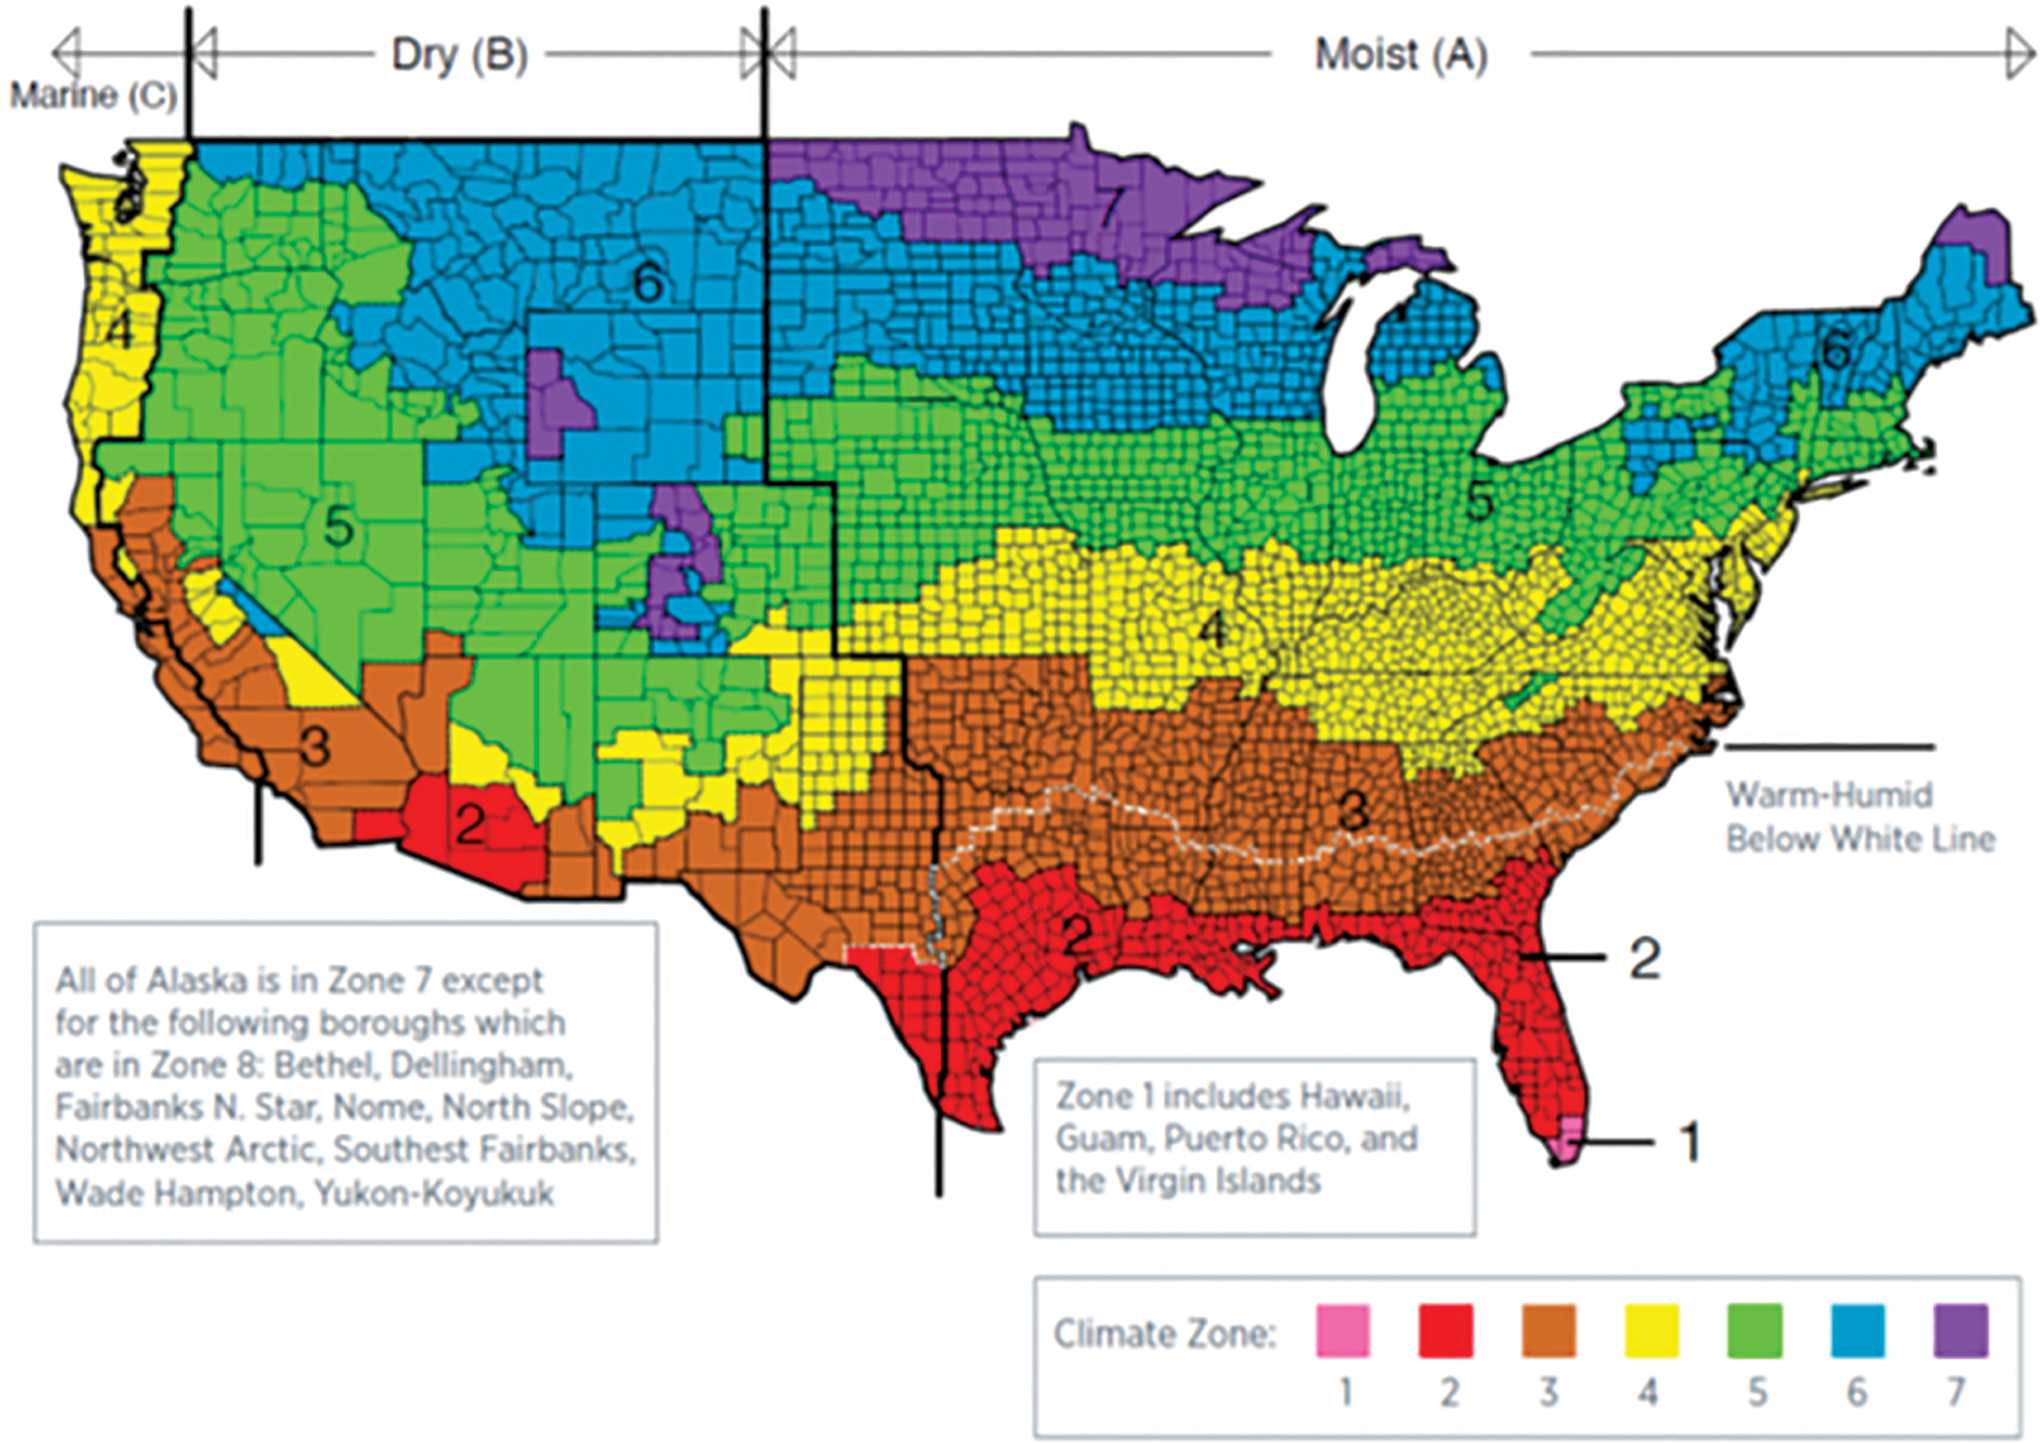
International Energy Conservation Code Climate Regions within the United States (U.S. Department of Energy, 2013).
Statistical methods
A separate statistical model was created for each of the outcome variables of interest: incidence rates of total invasive, breast, ovarian, lung and bronchus, colorectal, and prostate cancers. The Poisson regression model, including an offset, is an appropriate method of analysis for modeling incidence densities, in this case density of various cancer types. However, the Poisson model is sometimes susceptible to overdispersion, when the observed variance is larger than the nominal variance assumed by the distribution (McCullagh and Nelder, 1989; Cameron and Trivedi, 1998; Dean, 1998; Keene et al., 2007). In the case of Poisson overdispersion, it is recommended that one uses more flexible model such as the negative binomial (Cameron and Trivedi, 1998). Many researchers have taken this approach in analyzing similarly structured data (Anderson et al., 2014; Mutyaba et al., 2015; Abdullah et al., 2016). In this study, both Poisson and negative binomial distributions were considered for each cancer outcome. If overdispersion was present, the negative binomial model was used.
Five independent variables were considered. Precipitation and climate zone were the primary variables of interest, whereas annual income by county, percentage of county population >18 years, and percentage of county population being Caucasian were included in each model due to their previously demonstrated importance in cancer incidence. The log of the population size was included in the models as an offset to account for the differences in population sizes among the counties. The first model considered for each cancer outcome can be stated symbolically as follows:
where Yi is the cancer incidence for the ith county. The population is limited to male for prostate cancer and female for breast cancer;
Climate zone: when i = 1 to 7, β2i is the coefficient for the respective climate zone i. For example, when i = 1, β21 is the coefficient for climate zone 1.
The second model includes an additional regression parameter, β6, which represents the interaction between precipitation and climate zone:
Precipitation × climate zone: when i = 1 to 7, β6i is the coefficient for interaction between precipitation and climate zone i. For example, when i = 1, β61 is the coefficient for interaction between precipitation and climate zone 1.
Addition of this interaction term allows us to investigate whether the effect of precipitation is uniform across different climate types. For each model, type 3 analyses of effects were used to assess significance for each predictor's effect while controlling for the other predictors. All statistical tests were conducted at the α = 0.05 level using SAS statistical software v9.4.
Results and Discussion
In population-based studies using aggregate data such as this one, it is not possible to control for all of the possible confounding variables, both measurable and unmeasurable, which might explain the association that has been shown. However, in this study, the variables that seem to be the most likely confounders, age, gender, and ethnicity, were controlled. These three variables have shown to be statistically significant variables influencing cancer rates across population (Parker and Wingo, 1998; Mackillop et al., 2000; White et al., 2014).
Negative binomial regression was used for all cancer outcomes, except for ovarian cancer, which utilized Poisson regression. Results of type 3 tests for each of the incidence rates of individual cancer types investigated using Equation (1) are shown in Table 1. Precipitation was found to be significant for all of the cancer outcomes with the exception of ovarian cancer (p = 0.1778). In fact, for total invasive cancer, lung cancer, and colorectal cancer, the p-value for the test of significance was <0.0001. As shown in Table 1, the effect of increased precipitation was an increase in incidence of all cancers. Likewise, climate zone was significant for all cancer outcomes. For incidence rates of total invasive cancer and breast cancer, results show that all five considered variables were significant. Diversity of population was only significant in the models for total invasive cancer, breast, and ovarian cancers. Age of the population was found to be highly significant in all of the models considered in Table 1, with the exception of prostate cancer.
Type 3 Test Results for Equation 1 Models
Parameters in both the negative binomial and Poisson models are best interpreted by exponentiating the estimates. Table 2 provides estimates for each variable in Equation (1) for all six cancer types. Comparing the estimates, one can conclude that lung and bronchus cancer incidence rates increases significantly with increase in precipitation. Because climate zone is a nominal variable, the model uses reference cell coding, comparing all of the other zones to zone 7 (hot dry). Comparison of estimates for climate zone is done with the base level (zone 7), indicating whether the incidence rate for each cancer is comparatively higher or lower in that climate zone compared with zone 7. Results indicate that the expected number of total ovarian cancer and colorectal incidence rates for those who live in climate zone 1 (very cold) are 38.209% and 17.610%, respectively, higher than those who live in climate zone 7. The expected number of incidence rates for lung and bronchus cancer zone 3 (marine) is 19.19% lower than those who live in climate zone 7. Overall, incidence rates for cancer are primarily higher in places in very cold climate zone as compared with hot dry climate zone. Results also indicate incidence rates for lung and bronchus cancer are highest in zone 7 (hot dry) and lowest in zones 2 (cold) and 3 (marine). Ovarian cancer incidence is highest in zone 1 and lowest in zones 5 and 6. Colorectal incidence rates are highest in zone 1 (very cold) and lowest in zone 3 (marine).
Estimates for Each of the Variable Considered in Equation 1 for Six Cancer Types Considered
Ovarian cancer uses Poisson regression as the distribution, whereas all other cancer types use negative binomial.
If p-value <0.05, **if p-value <0.01, ***if p-value <0.001.
SE, standard error.
Results from analysis based upon Equation (2) are shown in Table 3. In this study, the primary interest was on considering if there was an interaction between our primary variables of interest, precipitation and climate zone. Indeed, in all of the models with the exception of ovarian cancer (p = 0.3062), the interactions between precipitation and climate zones were highly significant with p < 0.0001 in all models. This indicates that the effect of precipitation, although shown to be significant overall in increasing incidence of cancers, varies in effect among the different climate zones. The exact differences between zones will be investigated further in future research.
Type 3 Test Results for Equation 2 Models
Accounting for income, population age, and diversity, our results indicate that populations living in the regions experiencing higher precipitation and cold climate levels are more likely to have higher incidences rate of invasive cancer.
Although the possible mechanisms of action on how precipitation and climate zones may be linked to invasive cancer rates is unclear, we propose a hypothesis that the biogenic sources in a given area could be playing a much bigger role than what is currently understood as the cause of carcinogens. Parallel with increased cancer incidence rates on the East Coast of the United States, soil is generally more acidic in the eastern United States (Soil Survey Staff et al., 2018). Increased rainfall leaches away the alkaline elements of the soil such as calcium, magnesium, and potassium, increasing the acidity level. In acidic soil and cold climate zones, ammonia oxidizing microorganisms thrive in soil (Avrahami and Conrad, 2005; Shah et al., 2011). These bacteria convert ammonia to nitrites. Su et al. (2011) reported that under acidic conditions, nitrites formed in the soil can be converted to nitrous acid (HONO) and released into the atmosphere (Wu et al., 2019). HONO is a carcinogen that induces mutation through deamination of cytosine to uracil and of adenine to hypoxanthine in the DNA (Frankel et al., 1980). In addition, nitrites formed in the soil can also leach into the ground water. When consumed, ingested nitrites can lead to formation of N-nitroso compounds, potential human carcinogens (Inoue-Choi et al., 2015). Thus, higher concentrations of HONO in air and nitrites in water can be found in areas with higher precipitation and colder climate. This could subsequently increase in the incidence rate of cancer observed in the region. Further studies are warranted to confirm the hypothesis.
Mandal et al. (2009) studying the spatial trends of breast and prostate cancers in the United States hypothesized that difference in vitamin D level in people exposed to low levels of ultraviolet radiation (in northern regions of the United States) could explain the disparity. Sharma et al. (2015) suggested that in cold environment, high metabolic stress caused because of maintaining the body temperature could be the possible cause of increased cancer mortality. Furthermore, Steiner (2002) observed that areas in colder regions has low fluoride levels in the drinking water and could be linked to increased incidence rates of cancer.
This study conclusively shows that there is a statistical relationship between incidence rates of cancers in a given area and the amount of precipitation and climate type. Further studies are urgently needed to elucidate how environmental factors such as precipitation and temperature are linked to cancer rates in the population. Only after the interaction has been discovered can one develop effective preventative strategies to reduce cancer rates in our society.
It has been well documented in the literature that temperature and precipitation changes have occurred over time in various locations due to changes in global weather patterns (Hulme et al., 1998). If a relationship is confirmed between precipitation, temperature, and moisture levels in a given area and the incidence rates of cancer, important changes in the cancer rates may be expected as the global weather pattern changes. The recent report by Walsh et al. (2014) suggests that the average precipitation in the United States will increase for the northern United States and will decrease for southwest United States over the 21st century. Based on the observed correlation of the study presented in this article, this weather pattern change may in fact lead to an increased rate of cancer in the northern United States in this century.
Footnotes
Acknowledgments
Authors thank Lucas F. Loffredo and Luke Latario for their help in data extraction.
Author Disclosure Statement
No competing financial interests exist.
Funding Information
No funding was received for this article.